Zip Codes with the Highest Percentage of Population with a Degree in Science and Engineering in Canton, OH
RELATED REPORTS & OPTIONS
Science and Engineering
Canton
Compare Zip Codes
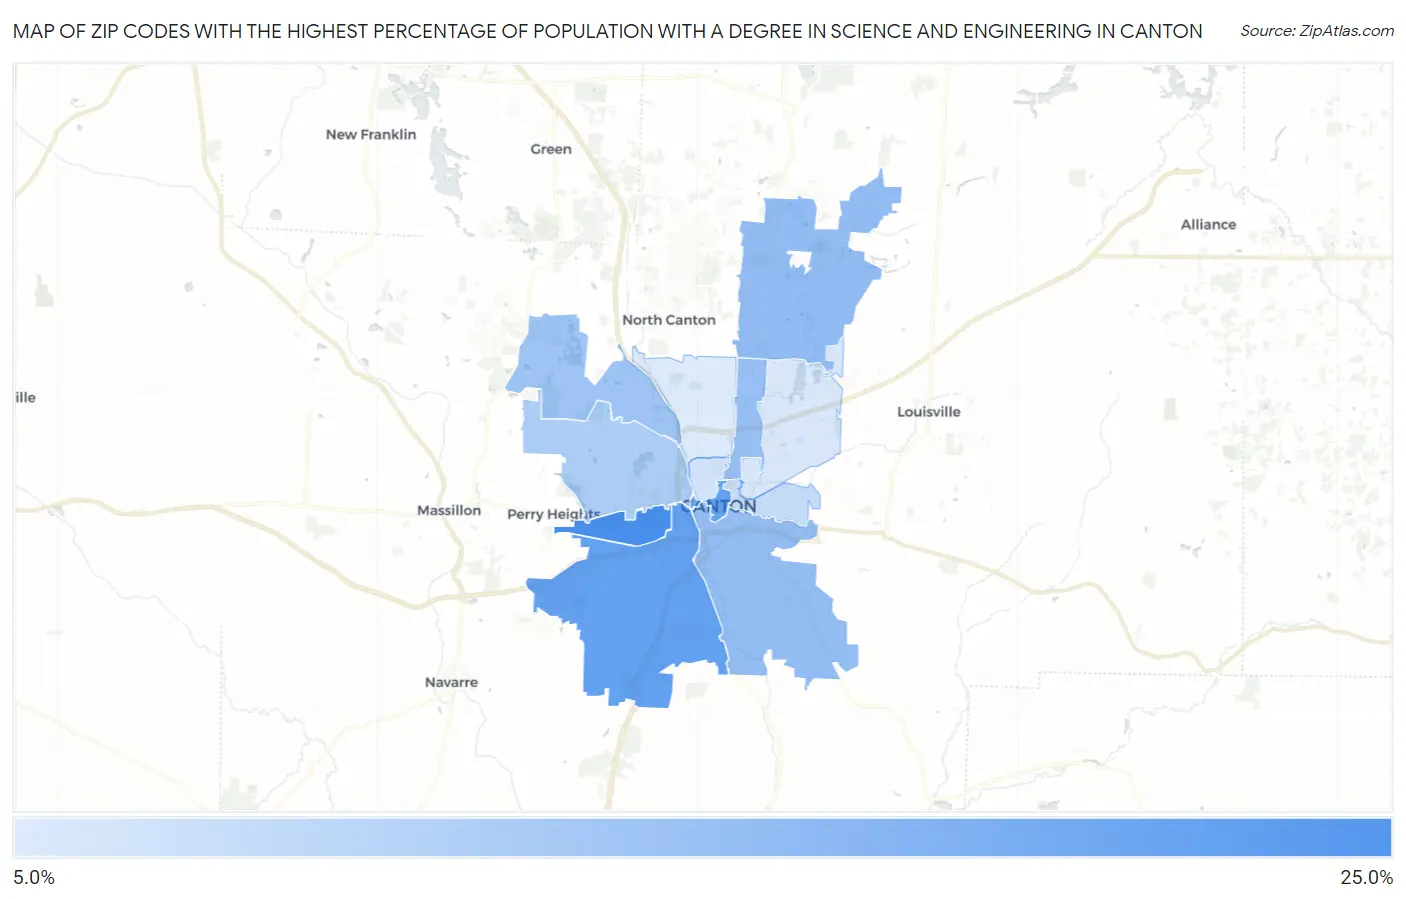
Map of Zip Codes with the Highest Percentage of Population with a Degree in Science and Engineering in Canton
8.0%
23.3%
Zip Codes with the Highest Percentage of Population with a Degree in Science and Engineering in Canton, OH
| Zip Code | % Graduates | vs State | vs National | |
| 1. | 44710 | 23.3% | 11.8%(+11.5)#125 | 9.8%(+13.6)#2,303 |
| 2. | 44706 | 20.4% | 11.8%(+8.55)#174 | 9.8%(+10.6)#3,196 |
| 3. | 44702 | 20.2% | 11.8%(+8.39)#181 | 9.8%(+10.4)#3,266 |
| 4. | 44721 | 15.6% | 11.8%(+3.75)#337 | 9.8%(+5.78)#6,126 |
| 5. | 44707 | 15.3% | 11.8%(+3.48)#349 | 9.8%(+5.51)#6,403 |
| 6. | 44714 | 14.9% | 11.8%(+3.13)#370 | 9.8%(+5.16)#6,782 |
| 7. | 44718 | 14.1% | 11.8%(+2.31)#422 | 9.8%(+4.35)#7,704 |
| 8. | 44708 | 12.7% | 11.8%(+0.897)#526 | 9.8%(+2.93)#9,685 |
| 9. | 44704 | 10.2% | 11.8%(-1.64)#721 | 9.8%(+0.388)#14,665 |
| 10. | 44703 | 9.1% | 11.8%(-2.68)#792 | 9.8%(-0.648)#17,012 |
| 11. | 44705 | 8.3% | 11.8%(-3.47)#829 | 9.8%(-1.44)#18,833 |
| 12. | 44709 | 8.0% | 11.8%(-3.82)#850 | 9.8%(-1.78)#19,642 |
1
Common Questions
What are the Top 10 Zip Codes with the Highest Percentage of Population with a Degree in Science and Engineering in Canton, OH?
Top 10 Zip Codes with the Highest Percentage of Population with a Degree in Science and Engineering in Canton, OH are:
What zip code has the Highest Percentage of Population with a Degree in Science and Engineering in Canton, OH?
44710 has the Highest Percentage of Population with a Degree in Science and Engineering in Canton, OH with 23.3%.
What is the Percentage of Population with a Degree in Science and Engineering in Canton, OH?
Percentage of Population with a Degree in Science and Engineering in Canton is 11.7%.
What is the Percentage of Population with a Degree in Science and Engineering in Ohio?
Percentage of Population with a Degree in Science and Engineering in Ohio is 11.8%.
What is the Percentage of Population with a Degree in Science and Engineering in the United States?
Percentage of Population with a Degree in Science and Engineering in the United States is 9.8%.