Zip Codes with the Highest Percentage of Renter-Occupied Units in Acton, MA
RELATED REPORTS & OPTIONS
Highest Renter-Occupied
Acton
Compare Zip Codes
Map of Zip Codes with the Highest Percentage of Renter-Occupied Units in Acton
19.9%
26.4%
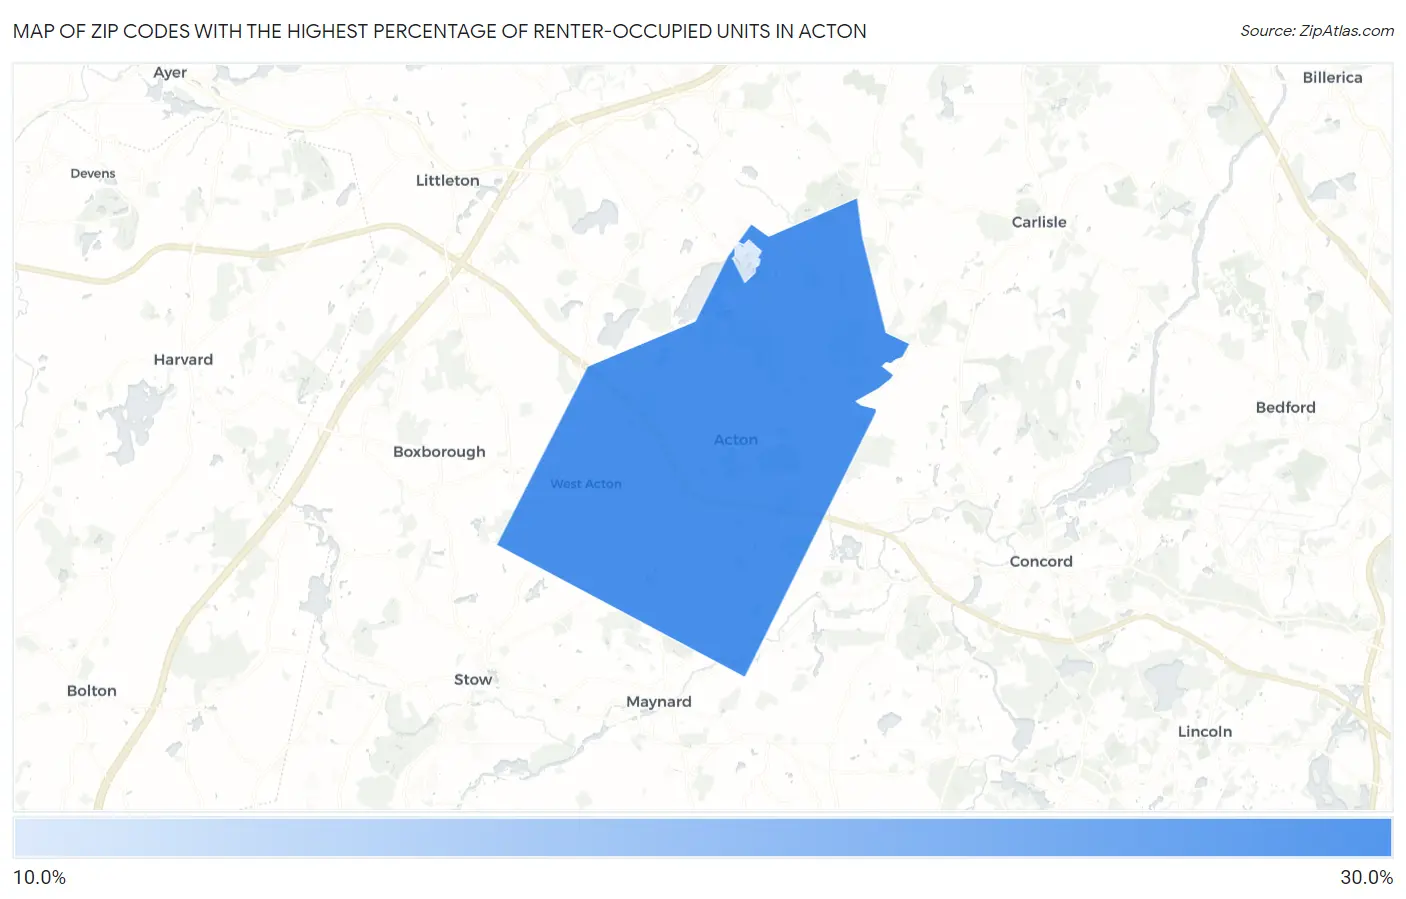
Zip Codes with the Highest Percentage of Renter-Occupied Units in Acton, MA
| Zip Code | % Renter-Occupied | vs State | vs National | |
| 1. | 01720 | 26.4% | 37.6%(-11.2)#204 | 35.2%(-8.80)#12,544 |
| 2. | 01718 | 19.9% | 37.6%(-17.6)#278 | 35.2%(-15.3)#18,285 |
1
Common Questions
What are the Top Zip Codes with the Highest Percentage of Renter-Occupied Units in Acton, MA?
Top Zip Codes with the Highest Percentage of Renter-Occupied Units in Acton, MA are:
What zip code has the Highest Percentage of Renter-Occupied Units in Acton, MA?
01720 has the Highest Percentage of Renter-Occupied Units in Acton, MA with 26.4%.
What is the Percentage of Renter-Occupied Units in Massachusetts?
Percentage of Renter-Occupied Units in Massachusetts is 37.6%.
What is the Percentage of Renter-Occupied Units in the United States?
Percentage of Renter-Occupied Units in the United States is 35.2%.