Zip Codes with the Highest Percentage of Population with a Degree in Liberal Arts and History in Waterbury, CT
RELATED REPORTS & OPTIONS
Liberal Arts and History
Waterbury
Compare Zip Codes
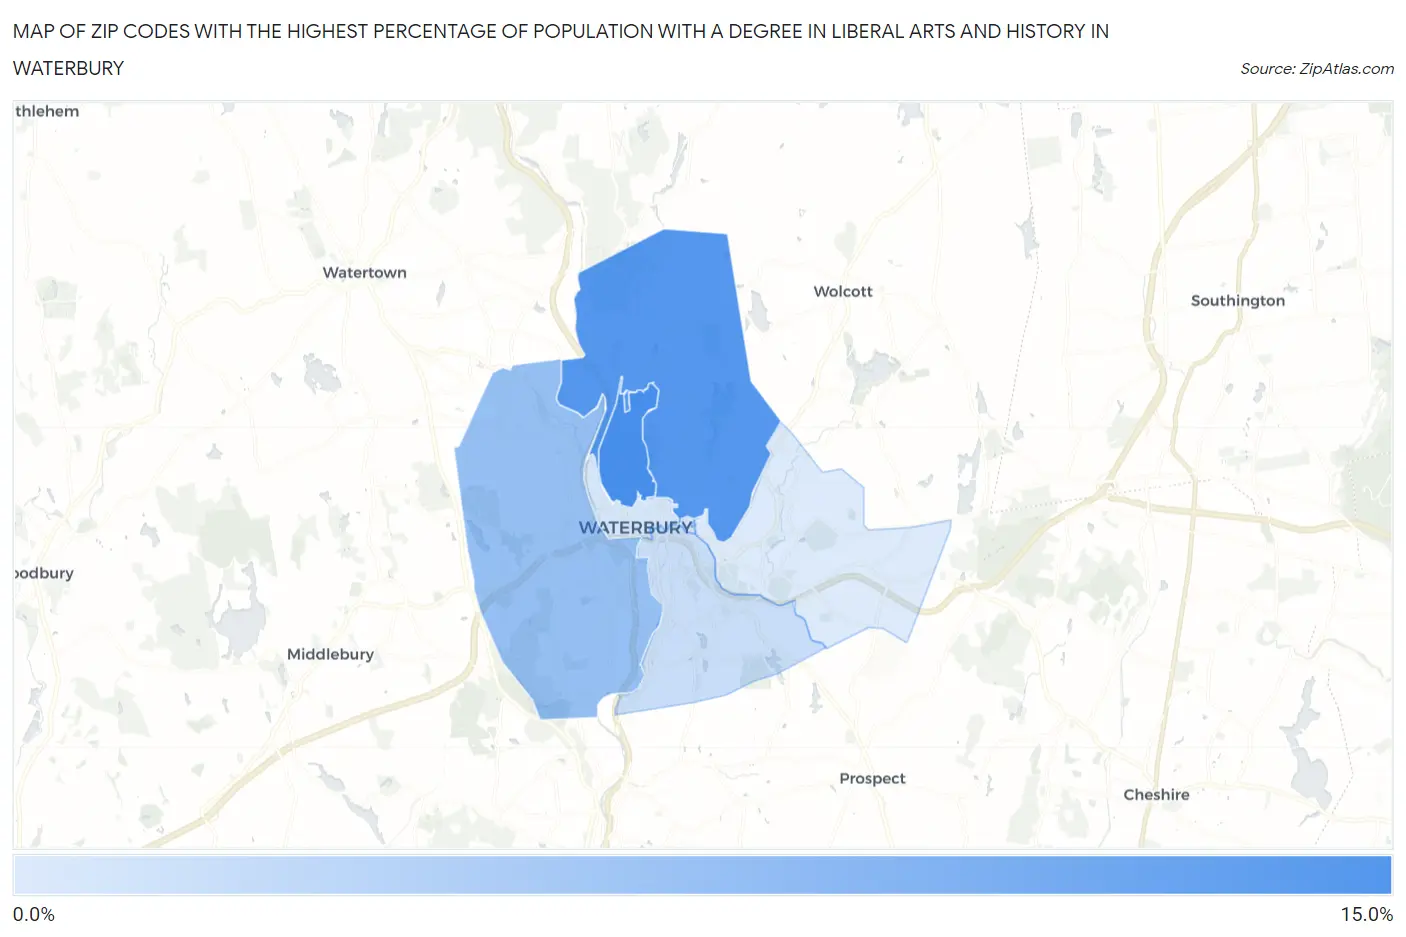
Map of Zip Codes with the Highest Percentage of Population with a Degree in Liberal Arts and History in Waterbury
2.4%
10.8%
Zip Codes with the Highest Percentage of Population with a Degree in Liberal Arts and History in Waterbury, CT
| Zip Code | % Graduates | vs State | vs National | |
| 1. | 06710 | 10.8% | 5.5%(+5.36)#16 | 4.9%(+5.98)#2,623 |
| 2. | 06704 | 10.0% | 5.5%(+4.48)#19 | 4.9%(+5.10)#3,134 |
| 3. | 06708 | 6.3% | 5.5%(+0.823)#89 | 4.9%(+1.44)#7,771 |
| 4. | 06706 | 3.5% | 5.5%(-2.00)#198 | 4.9%(-1.38)#16,627 |
| 5. | 06702 | 2.8% | 5.5%(-2.72)#226 | 4.9%(-2.11)#19,107 |
| 6. | 06705 | 2.4% | 5.5%(-3.14)#239 | 4.9%(-2.52)#20,410 |
1
Common Questions
What are the Top 5 Zip Codes with the Highest Percentage of Population with a Degree in Liberal Arts and History in Waterbury, CT?
Top 5 Zip Codes with the Highest Percentage of Population with a Degree in Liberal Arts and History in Waterbury, CT are:
What zip code has the Highest Percentage of Population with a Degree in Liberal Arts and History in Waterbury, CT?
06710 has the Highest Percentage of Population with a Degree in Liberal Arts and History in Waterbury, CT with 10.8%.
What is the Percentage of Population with a Degree in Liberal Arts and History in Waterbury, CT?
Percentage of Population with a Degree in Liberal Arts and History in Waterbury is 5.9%.
What is the Percentage of Population with a Degree in Liberal Arts and History in Connecticut?
Percentage of Population with a Degree in Liberal Arts and History in Connecticut is 5.5%.
What is the Percentage of Population with a Degree in Liberal Arts and History in the United States?
Percentage of Population with a Degree in Liberal Arts and History in the United States is 4.9%.