Zip Codes with the Highest Percentage of Population with a Degree in Liberal Arts and History in Milford, CT
RELATED REPORTS & OPTIONS
Liberal Arts and History
Milford
Compare Zip Codes
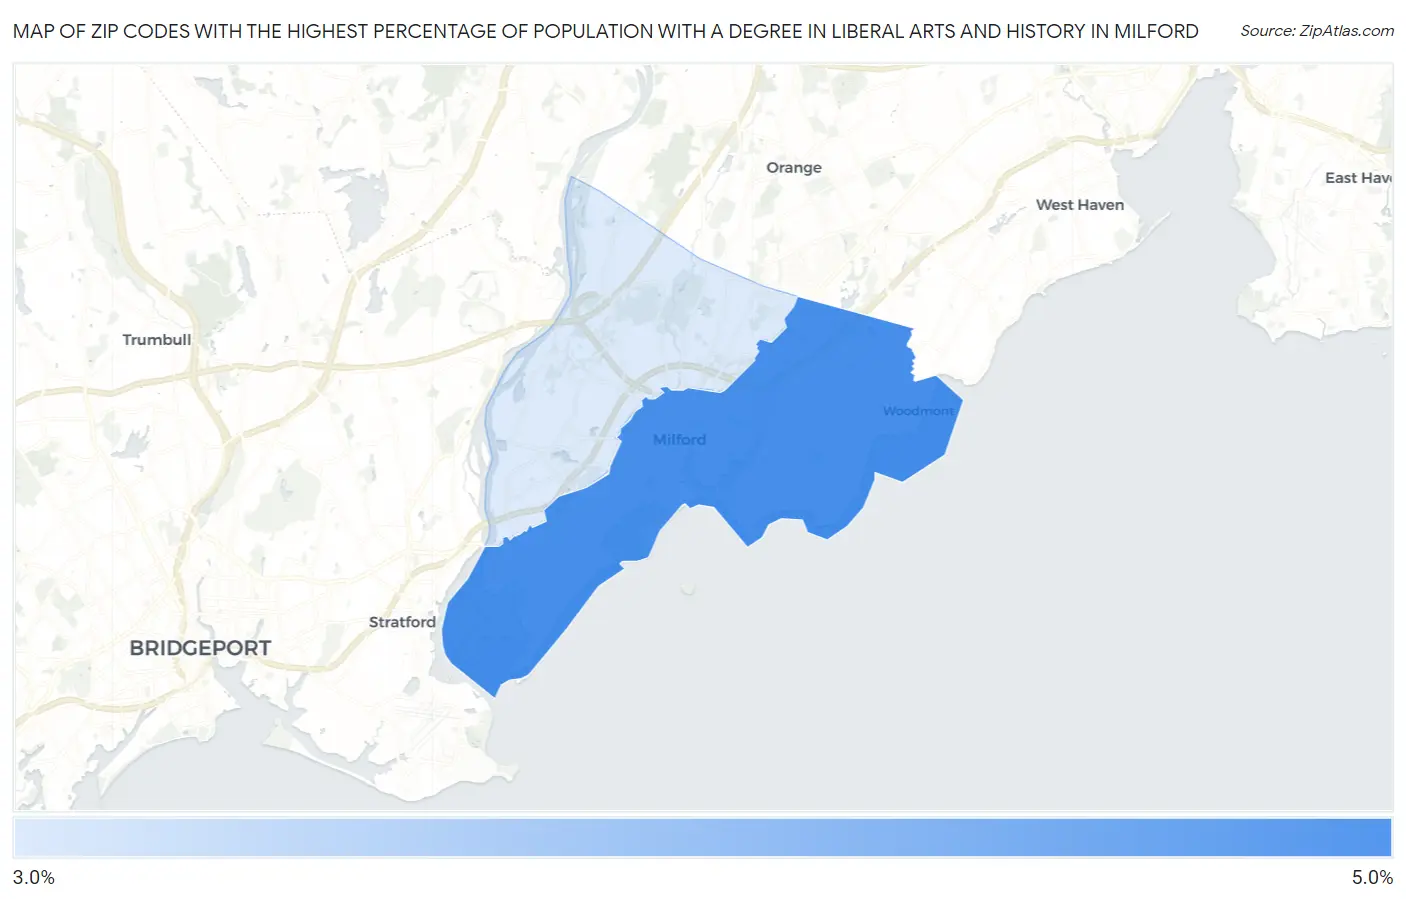
Map of Zip Codes with the Highest Percentage of Population with a Degree in Liberal Arts and History in Milford
3.5%
4.5%
Zip Codes with the Highest Percentage of Population with a Degree in Liberal Arts and History in Milford, CT
| Zip Code | % Graduates | vs State | vs National | |
| 1. | 06460 | 4.5% | 5.5%(-0.952)#162 | 4.9%(-0.336)#12,868 |
| 2. | 06461 | 3.5% | 5.5%(-2.02)#200 | 4.9%(-1.41)#16,732 |
1
Common Questions
What are the Top Zip Codes with the Highest Percentage of Population with a Degree in Liberal Arts and History in Milford, CT?
Top Zip Codes with the Highest Percentage of Population with a Degree in Liberal Arts and History in Milford, CT are:
What zip code has the Highest Percentage of Population with a Degree in Liberal Arts and History in Milford, CT?
06460 has the Highest Percentage of Population with a Degree in Liberal Arts and History in Milford, CT with 4.5%.
What is the Percentage of Population with a Degree in Liberal Arts and History in Connecticut?
Percentage of Population with a Degree in Liberal Arts and History in Connecticut is 5.5%.
What is the Percentage of Population with a Degree in Liberal Arts and History in the United States?
Percentage of Population with a Degree in Liberal Arts and History in the United States is 4.9%.