Zip Codes with the Highest Percentage of Population with a Degree in Liberal Arts and History in Greenwich, CT
RELATED REPORTS & OPTIONS
Liberal Arts and History
Greenwich
Compare Zip Codes
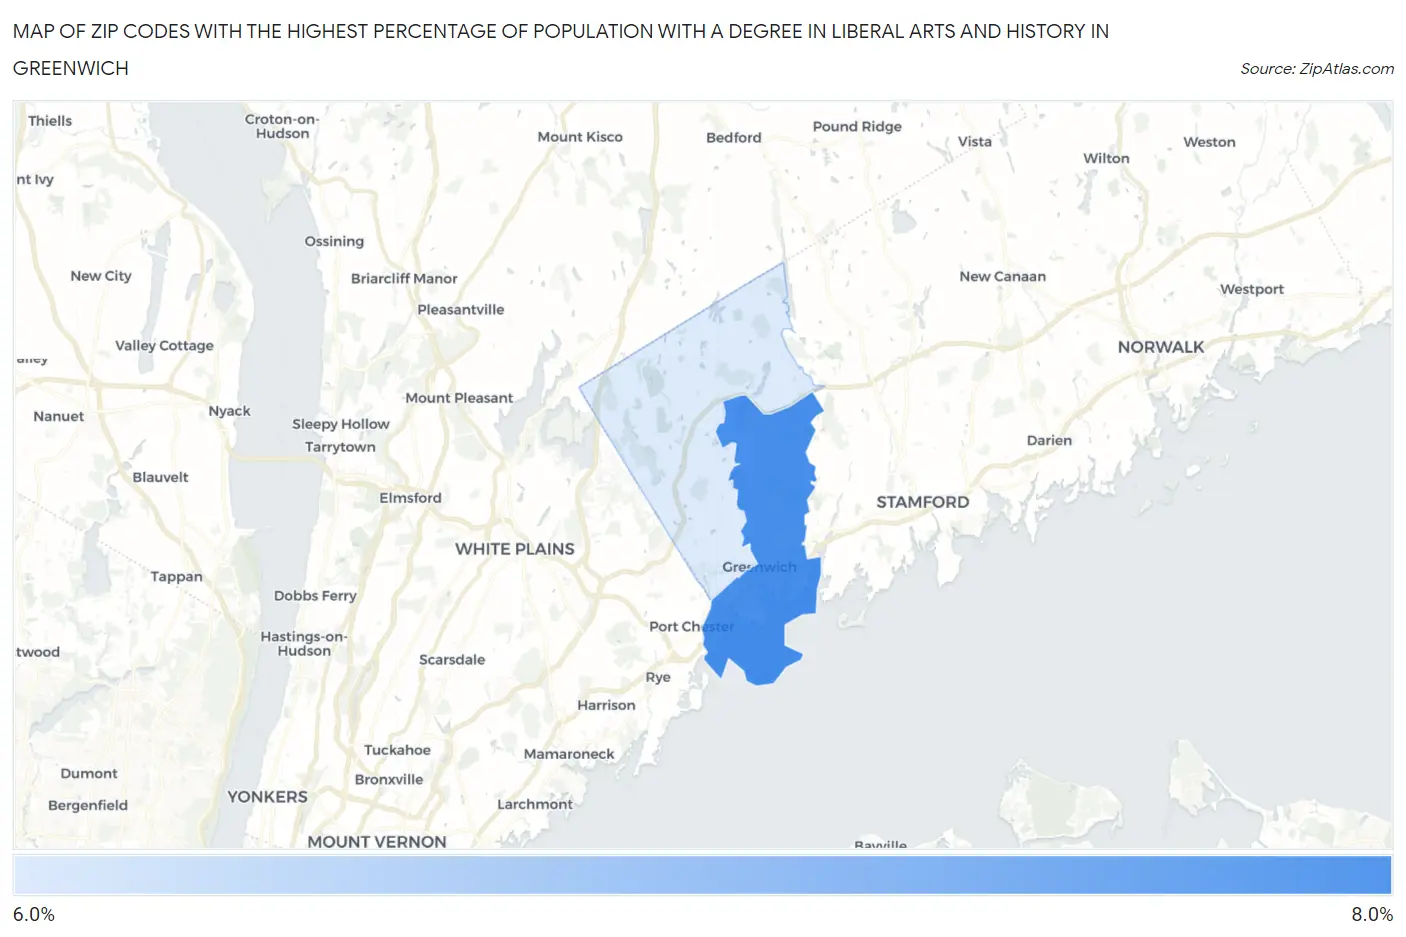
Map of Zip Codes with the Highest Percentage of Population with a Degree in Liberal Arts and History in Greenwich
6.5%
7.2%
Zip Codes with the Highest Percentage of Population with a Degree in Liberal Arts and History in Greenwich, CT
| Zip Code | % Graduates | vs State | vs National | |
| 1. | 06830 | 7.2% | 5.5%(+1.75)#53 | 4.9%(+2.37)#5,986 |
| 2. | 06831 | 6.5% | 5.5%(+1.02)#70 | 4.9%(+1.64)#7,322 |
1
Common Questions
What are the Top Zip Codes with the Highest Percentage of Population with a Degree in Liberal Arts and History in Greenwich, CT?
Top Zip Codes with the Highest Percentage of Population with a Degree in Liberal Arts and History in Greenwich, CT are:
What zip code has the Highest Percentage of Population with a Degree in Liberal Arts and History in Greenwich, CT?
06830 has the Highest Percentage of Population with a Degree in Liberal Arts and History in Greenwich, CT with 7.2%.
What is the Percentage of Population with a Degree in Liberal Arts and History in Greenwich, CT?
Percentage of Population with a Degree in Liberal Arts and History in Greenwich is 9.6%.
What is the Percentage of Population with a Degree in Liberal Arts and History in Connecticut?
Percentage of Population with a Degree in Liberal Arts and History in Connecticut is 5.5%.
What is the Percentage of Population with a Degree in Liberal Arts and History in the United States?
Percentage of Population with a Degree in Liberal Arts and History in the United States is 4.9%.