Zip Codes with the Highest Percentage of Population with a Degree in Liberal Arts and History in New Haven, CT
RELATED REPORTS & OPTIONS
Liberal Arts and History
New Haven
Compare Zip Codes
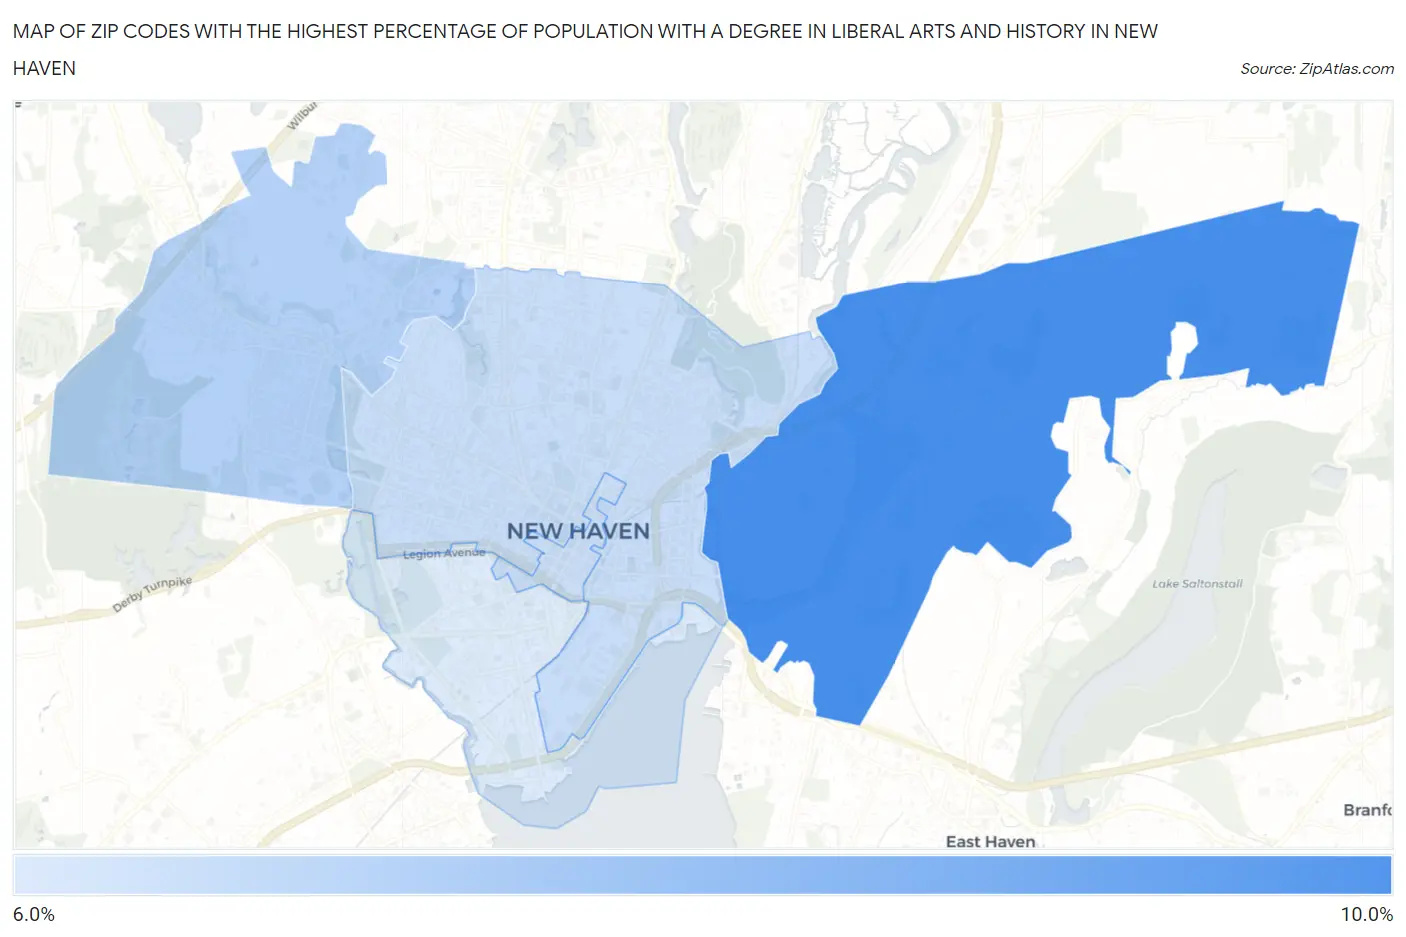
Map of Zip Codes with the Highest Percentage of Population with a Degree in Liberal Arts and History in New Haven
6.4%
9.1%
Zip Codes with the Highest Percentage of Population with a Degree in Liberal Arts and History in New Haven, CT
| Zip Code | % Graduates | vs State | vs National | |
| 1. | 06513 | 9.1% | 5.5%(+3.64)#23 | 4.9%(+4.26)#3,727 |
| 2. | 06515 | 7.1% | 5.5%(+1.66)#56 | 4.9%(+2.28)#6,136 |
| 3. | 06511 | 6.8% | 5.5%(+1.27)#61 | 4.9%(+1.89)#6,800 |
| 4. | 06510 | 6.7% | 5.5%(+1.25)#63 | 4.9%(+1.87)#6,863 |
| 5. | 06519 | 6.4% | 5.5%(+0.922)#83 | 4.9%(+1.54)#7,546 |
1
Common Questions
What are the Top 3 Zip Codes with the Highest Percentage of Population with a Degree in Liberal Arts and History in New Haven, CT?
Top 3 Zip Codes with the Highest Percentage of Population with a Degree in Liberal Arts and History in New Haven, CT are:
What zip code has the Highest Percentage of Population with a Degree in Liberal Arts and History in New Haven, CT?
06513 has the Highest Percentage of Population with a Degree in Liberal Arts and History in New Haven, CT with 9.1%.
What is the Percentage of Population with a Degree in Liberal Arts and History in New Haven, CT?
Percentage of Population with a Degree in Liberal Arts and History in New Haven is 7.1%.
What is the Percentage of Population with a Degree in Liberal Arts and History in Connecticut?
Percentage of Population with a Degree in Liberal Arts and History in Connecticut is 5.5%.
What is the Percentage of Population with a Degree in Liberal Arts and History in the United States?
Percentage of Population with a Degree in Liberal Arts and History in the United States is 4.9%.