Zip Codes with the Highest Percentage of Population with a Degree in Liberal Arts and History in West Hartford, CT
RELATED REPORTS & OPTIONS
Liberal Arts and History
West Hartford
Compare Zip Codes
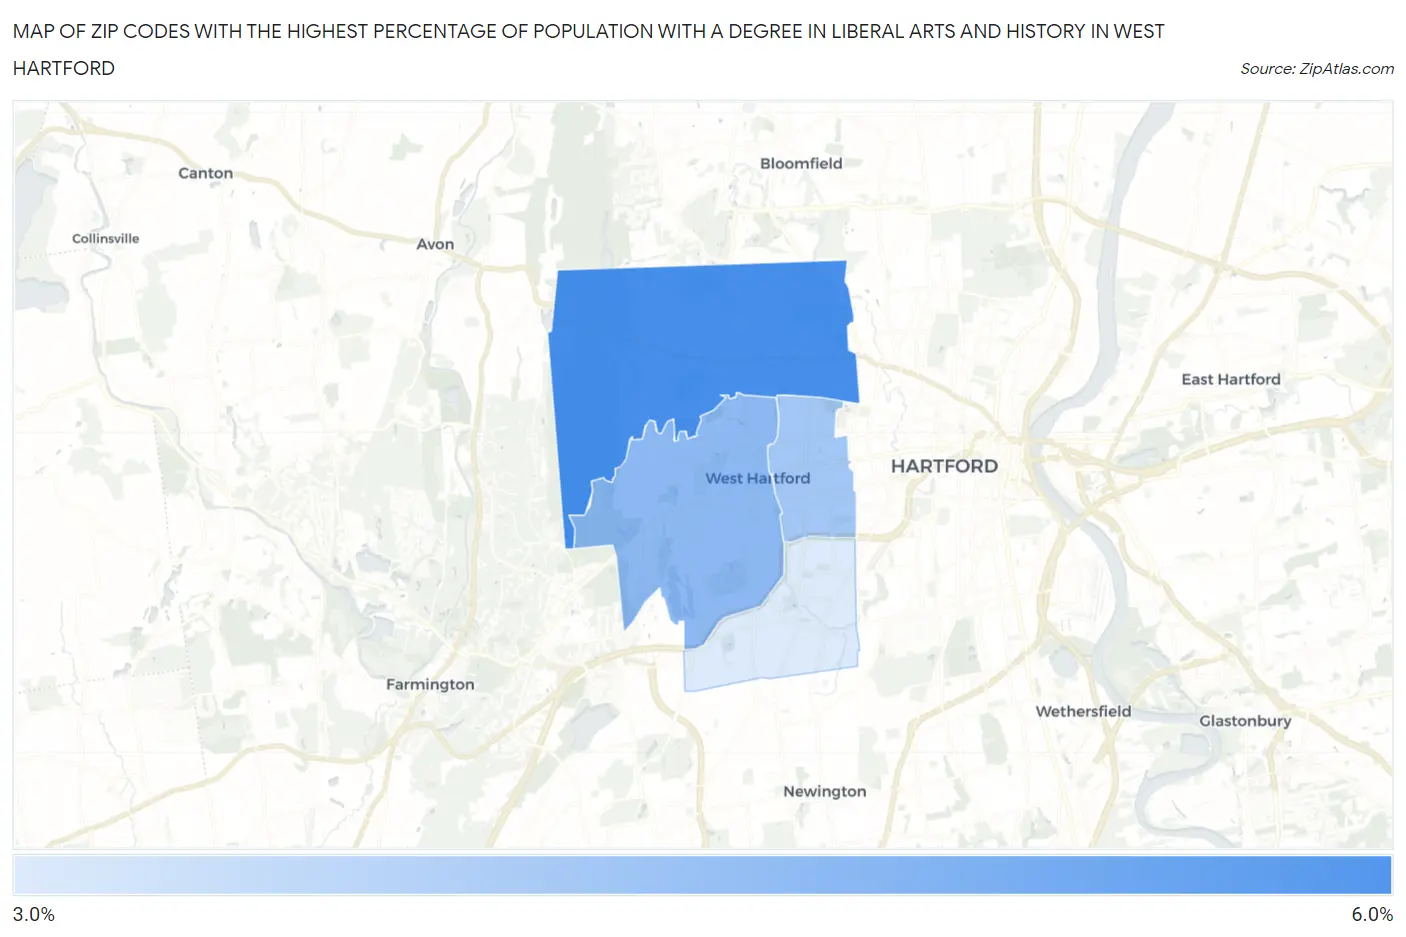
Map of Zip Codes with the Highest Percentage of Population with a Degree in Liberal Arts and History in West Hartford
3.7%
6.0%
Zip Codes with the Highest Percentage of Population with a Degree in Liberal Arts and History in West Hartford, CT
| Zip Code | % Graduates | vs State | vs National | |
| 1. | 06117 | 6.0% | 5.5%(+0.497)#105 | 4.9%(+1.11)#8,564 |
| 2. | 06107 | 5.0% | 5.5%(-0.526)#152 | 4.9%(+0.089)#11,463 |
| 3. | 06119 | 4.6% | 5.5%(-0.880)#157 | 4.9%(-0.265)#12,621 |
| 4. | 06110 | 3.7% | 5.5%(-1.74)#189 | 4.9%(-1.13)#15,722 |
1
Common Questions
What are the Top 3 Zip Codes with the Highest Percentage of Population with a Degree in Liberal Arts and History in West Hartford, CT?
Top 3 Zip Codes with the Highest Percentage of Population with a Degree in Liberal Arts and History in West Hartford, CT are:
What zip code has the Highest Percentage of Population with a Degree in Liberal Arts and History in West Hartford, CT?
06117 has the Highest Percentage of Population with a Degree in Liberal Arts and History in West Hartford, CT with 6.0%.
What is the Percentage of Population with a Degree in Liberal Arts and History in West Hartford, CT?
Percentage of Population with a Degree in Liberal Arts and History in West Hartford is 5.0%.
What is the Percentage of Population with a Degree in Liberal Arts and History in Connecticut?
Percentage of Population with a Degree in Liberal Arts and History in Connecticut is 5.5%.
What is the Percentage of Population with a Degree in Liberal Arts and History in the United States?
Percentage of Population with a Degree in Liberal Arts and History in the United States is 4.9%.