Yorkshire, VA Map & Demographics
Yorkshire Map
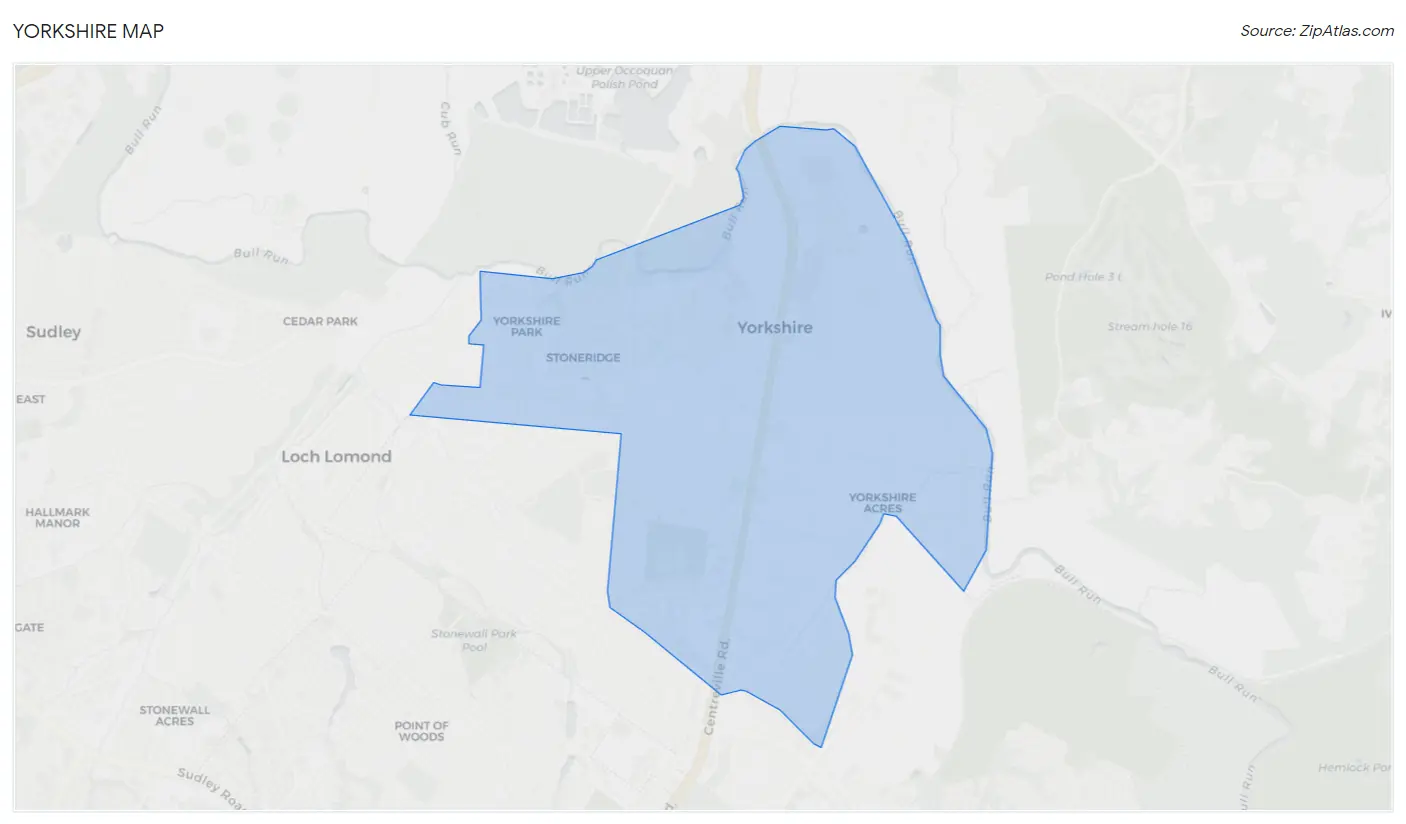
Yorkshire Overview
$33,398
PER CAPITA INCOME
$93,542
AVG FAMILY INCOME
$95,543
AVG HOUSEHOLD INCOME
37.1%
WAGE / INCOME GAP [ % ]
62.9¢/ $1
WAGE / INCOME GAP [ $ ]
0.36
INEQUALITY / GINI INDEX
10,563
TOTAL POPULATION
5,422
MALE POPULATION
5,141
FEMALE POPULATION
105.47
MALES / 100 FEMALES
94.82
FEMALES / 100 MALES
28.7
MEDIAN AGE
3.7
AVG FAMILY SIZE
3.5
AVG HOUSEHOLD SIZE
5,774
LABOR FORCE [ PEOPLE ]
75.9%
PERCENT IN LABOR FORCE
3.4%
UNEMPLOYMENT RATE
Income in Yorkshire
Income Overview in Yorkshire
Per Capita Income in Yorkshire is $33,398, while median incomes of families and households are $93,542 and $95,543 respectively.
| Characteristic | Number | Measure |
| Per Capita Income | 10,563 | $33,398 |
| Median Family Income | 2,521 | $93,542 |
| Mean Family Income | 2,521 | $107,809 |
| Median Household Income | 3,008 | $95,543 |
| Mean Household Income | 3,008 | $110,618 |
| Income Deficit | 2,521 | $0 |
| Wage / Income Gap (%) | 10,563 | 37.14% |
| Wage / Income Gap ($) | 10,563 | 62.86¢ per $1 |
| Gini / Inequality Index | 10,563 | 0.36 |
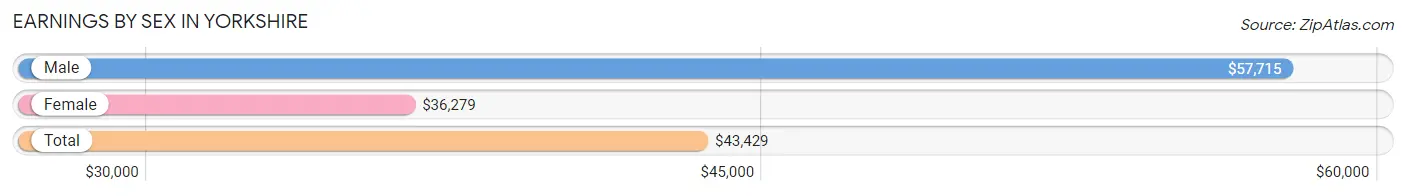
Earnings by Sex in Yorkshire
Average Earnings in Yorkshire are $43,429, $57,715 for men and $36,279 for women, a difference of 37.1%.
| Sex | Number | Average Earnings |
| Male | 3,221 (55.7%) | $57,715 |
| Female | 2,566 (44.3%) | $36,279 |
| Total | 5,787 (100.0%) | $43,429 |
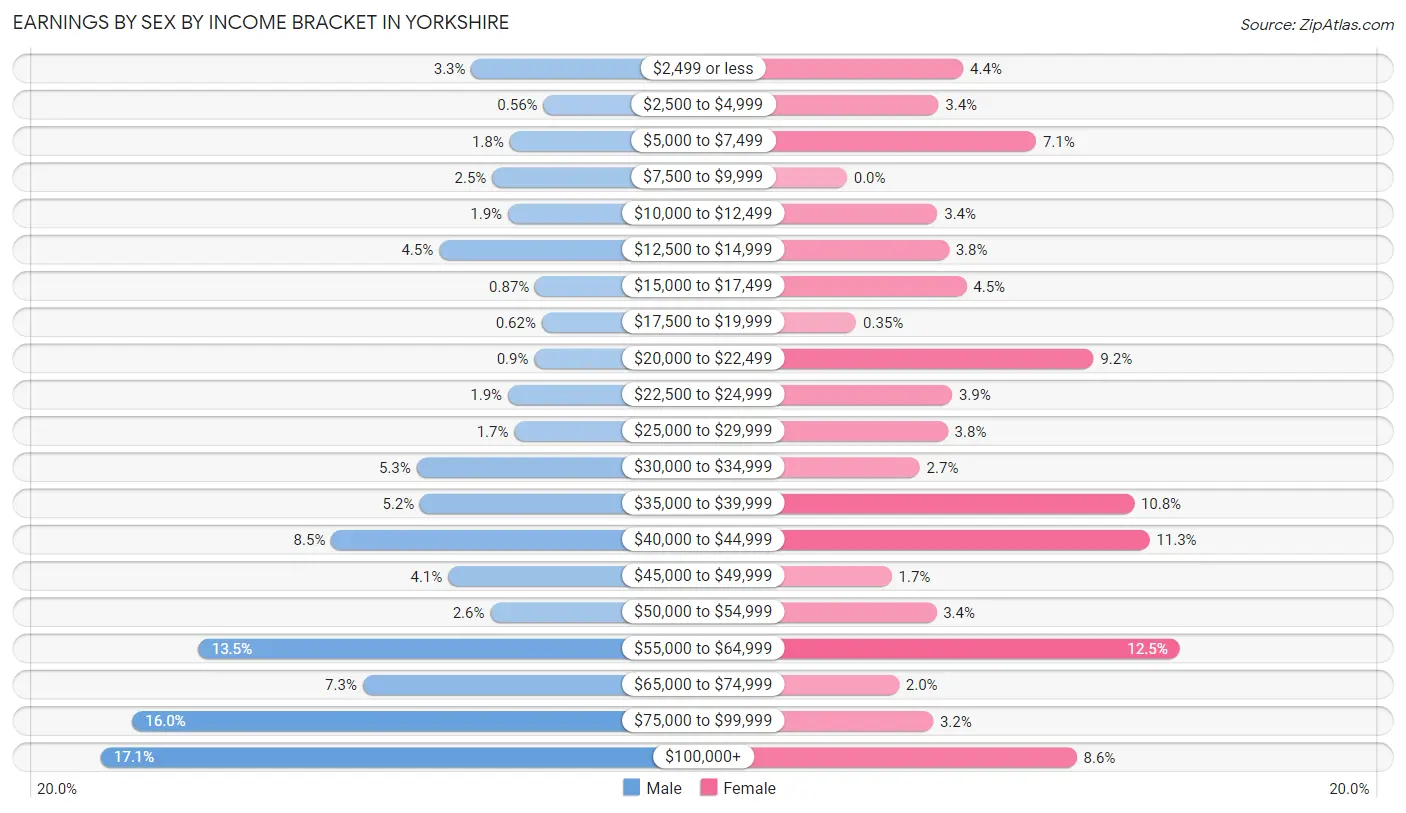
Earnings by Sex by Income Bracket in Yorkshire
The most common earnings brackets in Yorkshire are $100,000+ for men (552 | 17.1%) and $55,000 to $64,999 for women (320 | 12.5%).
| Income | Male | Female |
| $2,499 or less | 105 (3.3%) | 112 (4.4%) |
| $2,500 to $4,999 | 18 (0.6%) | 88 (3.4%) |
| $5,000 to $7,499 | 59 (1.8%) | 182 (7.1%) |
| $7,500 to $9,999 | 80 (2.5%) | 0 (0.0%) |
| $10,000 to $12,499 | 61 (1.9%) | 87 (3.4%) |
| $12,500 to $14,999 | 144 (4.5%) | 98 (3.8%) |
| $15,000 to $17,499 | 28 (0.9%) | 115 (4.5%) |
| $17,500 to $19,999 | 20 (0.6%) | 9 (0.4%) |
| $20,000 to $22,499 | 29 (0.9%) | 237 (9.2%) |
| $22,500 to $24,999 | 61 (1.9%) | 101 (3.9%) |
| $25,000 to $29,999 | 53 (1.7%) | 97 (3.8%) |
| $30,000 to $34,999 | 171 (5.3%) | 70 (2.7%) |
| $35,000 to $39,999 | 167 (5.2%) | 276 (10.8%) |
| $40,000 to $44,999 | 274 (8.5%) | 291 (11.3%) |
| $45,000 to $49,999 | 133 (4.1%) | 43 (1.7%) |
| $50,000 to $54,999 | 82 (2.5%) | 86 (3.4%) |
| $55,000 to $64,999 | 434 (13.5%) | 320 (12.5%) |
| $65,000 to $74,999 | 236 (7.3%) | 50 (1.9%) |
| $75,000 to $99,999 | 514 (16.0%) | 83 (3.2%) |
| $100,000+ | 552 (17.1%) | 221 (8.6%) |
| Total | 3,221 (100.0%) | 2,566 (100.0%) |
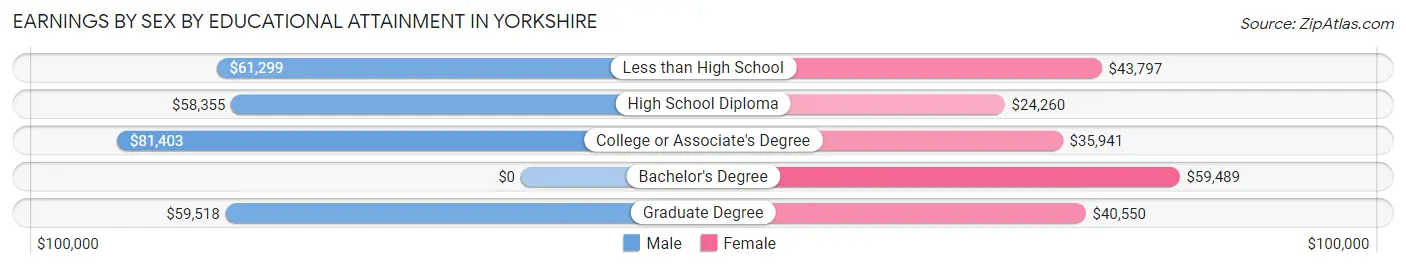
Earnings by Sex by Educational Attainment in Yorkshire
Average earnings in Yorkshire are $61,772 for men and $38,797 for women, a difference of 37.2%. Men with an educational attainment of college or associate's degree enjoy the highest average annual earnings of $81,403, while those with high school diploma education earn the least with $58,355. Women with an educational attainment of bachelor's degree earn the most with the average annual earnings of $59,489, while those with high school diploma education have the smallest earnings of $24,260.
| Educational Attainment | Male Income | Female Income |
| Less than High School | $61,299 | $43,797 |
| High School Diploma | $58,355 | $24,260 |
| College or Associate's Degree | $81,403 | $35,941 |
| Bachelor's Degree | - | - |
| Graduate Degree | $59,518 | $40,550 |
| Total | $61,772 | $38,797 |
Family Income in Yorkshire
Family Income Brackets in Yorkshire
According to the Yorkshire family income data, there are 585 families falling into the $100,000 to $149,999 income range, which is the most common income bracket and makes up 23.2% of all families.
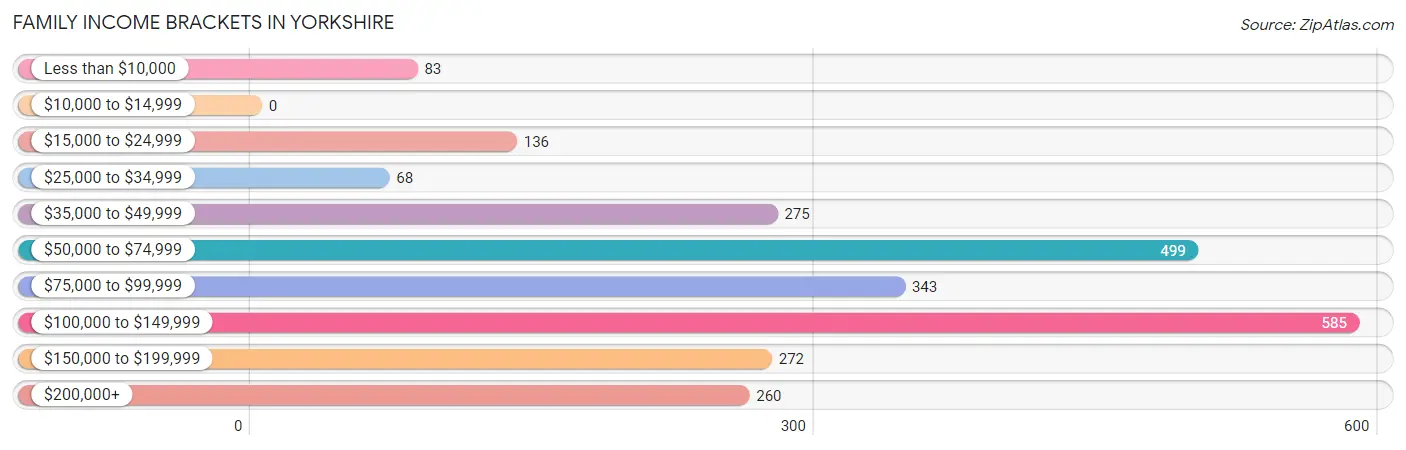
| Income Bracket | # Families | % Families |
| Less than $10,000 | 83 | 3.3% |
| $10,000 to $14,999 | 0 | 0.0% |
| $15,000 to $24,999 | 136 | 5.4% |
| $25,000 to $34,999 | 68 | 2.7% |
| $35,000 to $49,999 | 275 | 10.9% |
| $50,000 to $74,999 | 499 | 19.8% |
| $75,000 to $99,999 | 343 | 13.6% |
| $100,000 to $149,999 | 585 | 23.2% |
| $150,000 to $199,999 | 272 | 10.8% |
| $200,000+ | 260 | 10.3% |
Family Income by Famaliy Size in Yorkshire
6-person families (118 | 4.7%) account for the highest median family income in Yorkshire with $146,250 per family, while 2-person families (625 | 24.8%) have the highest median income of $57,122 per family member.
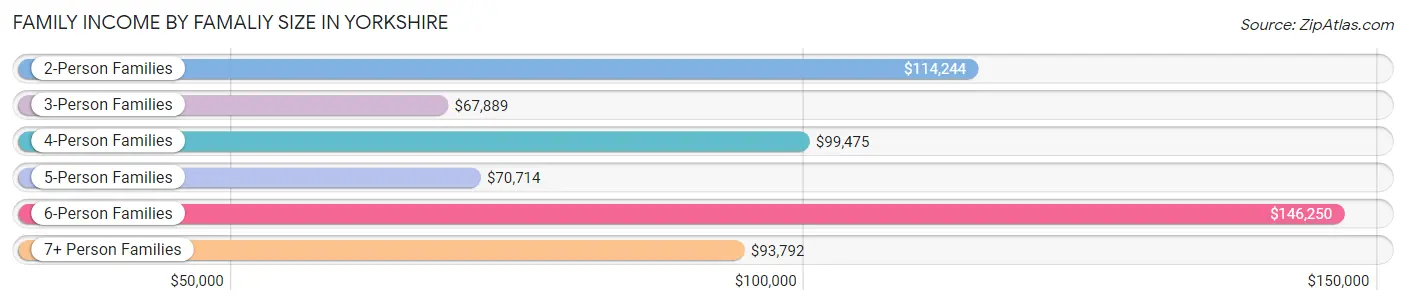
| Income Bracket | # Families | Median Income |
| 2-Person Families | 625 (24.8%) | $114,244 |
| 3-Person Families | 720 (28.6%) | $67,889 |
| 4-Person Families | 627 (24.9%) | $99,475 |
| 5-Person Families | 326 (12.9%) | $70,714 |
| 6-Person Families | 118 (4.7%) | $146,250 |
| 7+ Person Families | 105 (4.2%) | $93,792 |
| Total | 2,521 (100.0%) | $93,542 |
Family Income by Number of Earners in Yorkshire
The median family income in Yorkshire is $93,542, with families comprising 3+ earners (520) having the highest median family income of $129,873, while families with no earners (115) have the lowest median family income of $43,036, accounting for 20.6% and 4.6% of families, respectively.
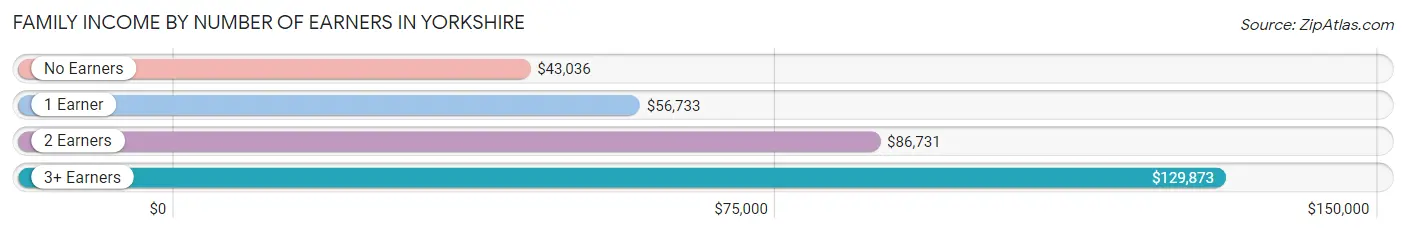
| Number of Earners | # Families | Median Income |
| No Earners | 115 (4.6%) | $43,036 |
| 1 Earner | 792 (31.4%) | $56,733 |
| 2 Earners | 1,094 (43.4%) | $86,731 |
| 3+ Earners | 520 (20.6%) | $129,873 |
| Total | 2,521 (100.0%) | $93,542 |
Household Income in Yorkshire
Household Income Brackets in Yorkshire
With 773 households falling in the category, the $100,000 to $149,999 income range is the most frequent in Yorkshire, accounting for 25.7% of all households. In contrast, only 21 households (0.7%) fall into the $10,000 to $14,999 income bracket, making it the least populous group.
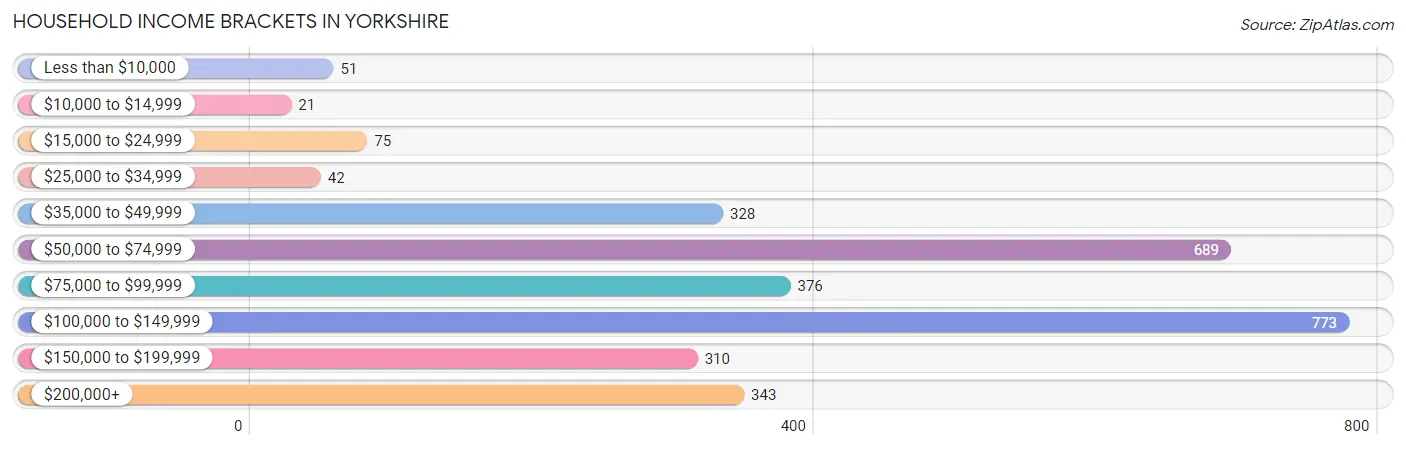
| Income Bracket | # Households | % Households |
| Less than $10,000 | 51 | 1.7% |
| $10,000 to $14,999 | 21 | 0.7% |
| $15,000 to $24,999 | 75 | 2.5% |
| $25,000 to $34,999 | 42 | 1.4% |
| $35,000 to $49,999 | 328 | 10.9% |
| $50,000 to $74,999 | 689 | 22.9% |
| $75,000 to $99,999 | 376 | 12.5% |
| $100,000 to $149,999 | 773 | 25.7% |
| $150,000 to $199,999 | 310 | 10.3% |
| $200,000+ | 343 | 11.4% |
Household Income by Householder Age in Yorkshire
The median household income in Yorkshire is $95,543, with the highest median household income of $130,769 found in the 45 to 64 years age bracket for the primary householder. A total of 1,080 households (35.9%) fall into this category. Meanwhile, the 15 to 24 years age bracket for the primary householder has the lowest median household income of $41,250, with 127 households (4.2%) in this group.
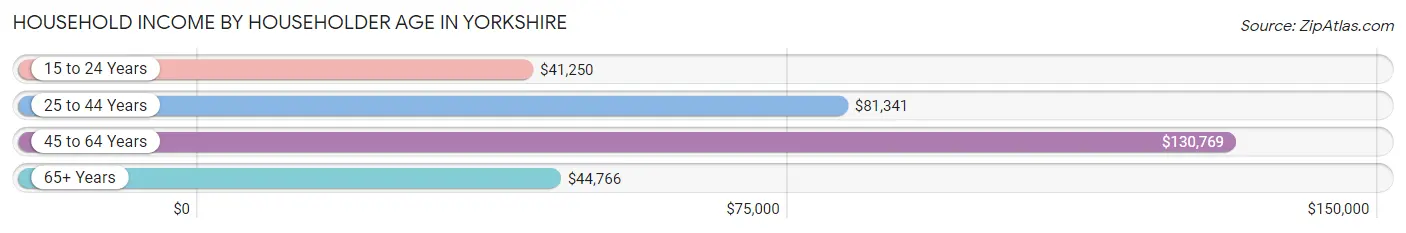
| Income Bracket | # Households | Median Income |
| 15 to 24 Years | 127 (4.2%) | $41,250 |
| 25 to 44 Years | 1,582 (52.6%) | $81,341 |
| 45 to 64 Years | 1,080 (35.9%) | $130,769 |
| 65+ Years | 219 (7.3%) | $44,766 |
| Total | 3,008 (100.0%) | $95,543 |
Poverty in Yorkshire
Income Below Poverty by Sex and Age in Yorkshire
With 11.0% poverty level for males and 8.6% for females among the residents of Yorkshire, 16 and 17 year old males and 75 year old and over females are the most vulnerable to poverty, with 140 males (51.8%) and 42 females (77.8%) in their respective age groups living below the poverty level.
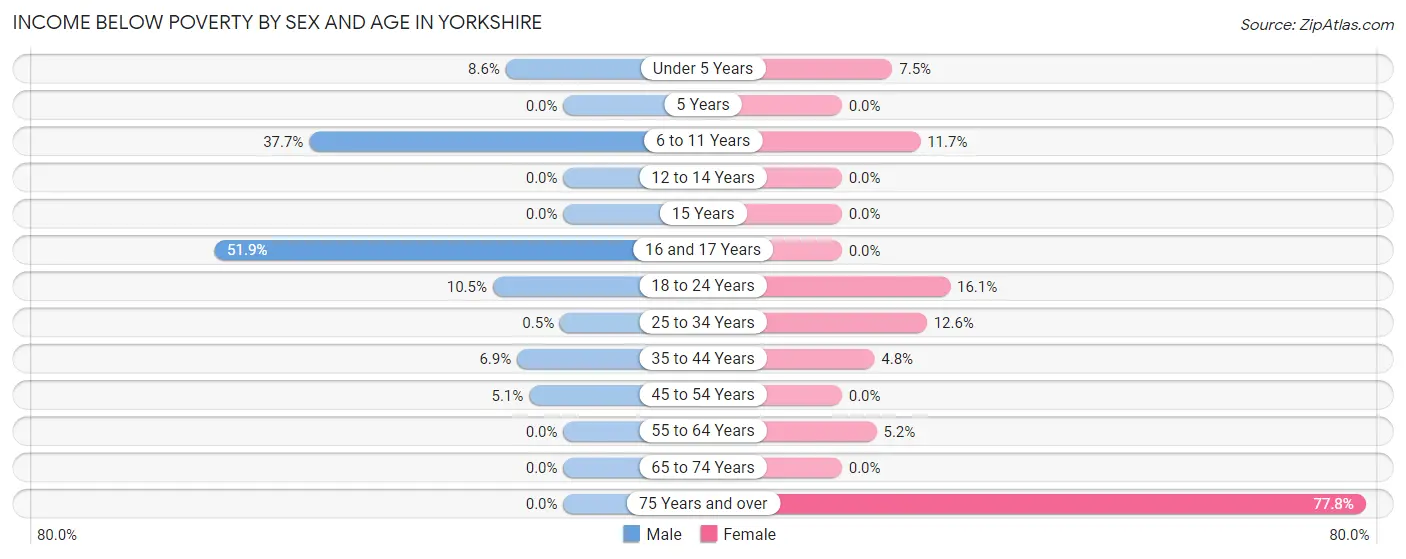
| Age Bracket | Male | Female |
| Under 5 Years | 31 (8.6%) | 41 (7.5%) |
| 5 Years | 0 (0.0%) | 0 (0.0%) |
| 6 to 11 Years | 240 (37.7%) | 77 (11.7%) |
| 12 to 14 Years | 0 (0.0%) | 0 (0.0%) |
| 15 Years | 0 (0.0%) | 0 (0.0%) |
| 16 and 17 Years | 140 (51.8%) | 0 (0.0%) |
| 18 to 24 Years | 72 (10.5%) | 90 (16.1%) |
| 25 to 34 Years | 2 (0.5%) | 134 (12.6%) |
| 35 to 44 Years | 85 (6.9%) | 38 (4.8%) |
| 45 to 54 Years | 27 (5.1%) | 0 (0.0%) |
| 55 to 64 Years | 0 (0.0%) | 21 (5.2%) |
| 65 to 74 Years | 0 (0.0%) | 0 (0.0%) |
| 75 Years and over | 0 (0.0%) | 42 (77.8%) |
| Total | 597 (11.0%) | 443 (8.6%) |
Income Above Poverty by Sex and Age in Yorkshire
According to the poverty statistics in Yorkshire, males aged 5 years and females aged 5 years are the age groups that are most secure financially, with 100.0% of males and 100.0% of females in these age groups living above the poverty line.
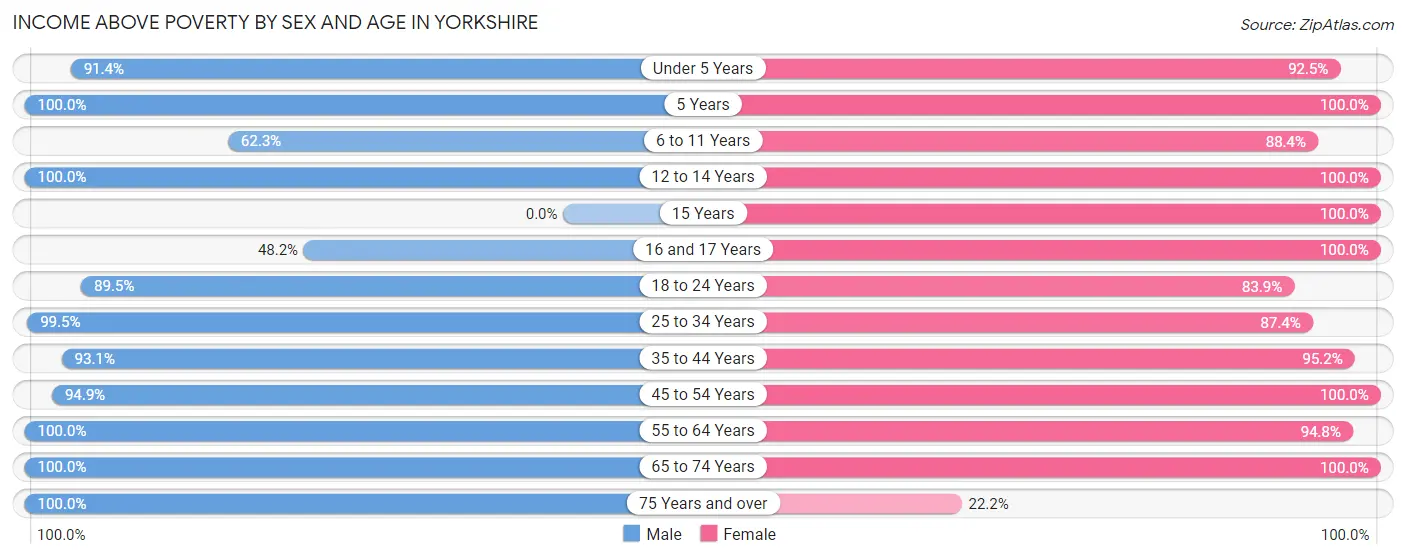
| Age Bracket | Male | Female |
| Under 5 Years | 331 (91.4%) | 506 (92.5%) |
| 5 Years | 125 (100.0%) | 54 (100.0%) |
| 6 to 11 Years | 396 (62.3%) | 584 (88.3%) |
| 12 to 14 Years | 234 (100.0%) | 316 (100.0%) |
| 15 Years | 0 (0.0%) | 17 (100.0%) |
| 16 and 17 Years | 130 (48.1%) | 25 (100.0%) |
| 18 to 24 Years | 615 (89.5%) | 470 (83.9%) |
| 25 to 34 Years | 398 (99.5%) | 929 (87.4%) |
| 35 to 44 Years | 1,151 (93.1%) | 748 (95.2%) |
| 45 to 54 Years | 505 (94.9%) | 387 (100.0%) |
| 55 to 64 Years | 610 (100.0%) | 386 (94.8%) |
| 65 to 74 Years | 302 (100.0%) | 264 (100.0%) |
| 75 Years and over | 24 (100.0%) | 12 (22.2%) |
| Total | 4,821 (89.0%) | 4,698 (91.4%) |
Income Below Poverty Among Married-Couple Families in Yorkshire
The poverty statistics for married-couple families in Yorkshire show that 3.0% or 49 of the total 1,606 families live below the poverty line. Families with 3 or 4 children have the highest poverty rate of 26.3%, comprising of 49 families. On the other hand, families with no children have the lowest poverty rate of 0.0%, which includes 0 families.
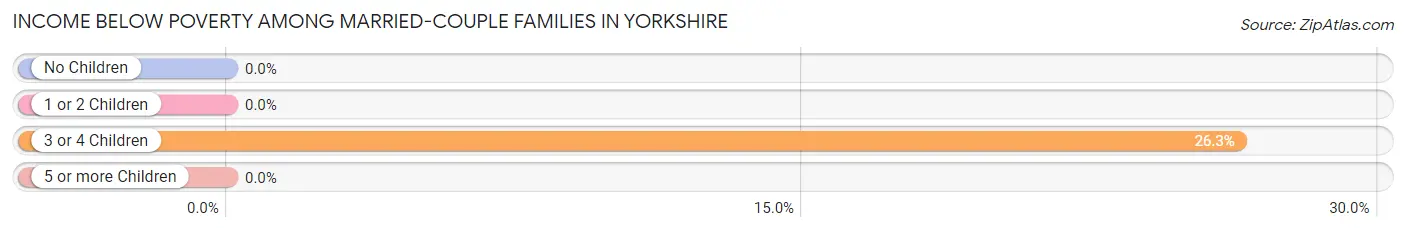
| Children | Above Poverty | Below Poverty |
| No Children | 762 (100.0%) | 0 (0.0%) |
| 1 or 2 Children | 612 (100.0%) | 0 (0.0%) |
| 3 or 4 Children | 137 (73.7%) | 49 (26.3%) |
| 5 or more Children | 46 (100.0%) | 0 (0.0%) |
| Total | 1,557 (97.0%) | 49 (3.0%) |
Income Below Poverty Among Single-Parent Households in Yorkshire
According to the poverty data in Yorkshire, 12.1% or 42 single-father households and 22.4% or 127 single-mother households are living below the poverty line. Among single-father households, those with 3 or 4 children have the highest poverty rate, with 31 households (100.0%) experiencing poverty. Likewise, among single-mother households, those with 1 or 2 children have the highest poverty rate, with 89 households (30.9%) falling below the poverty line.
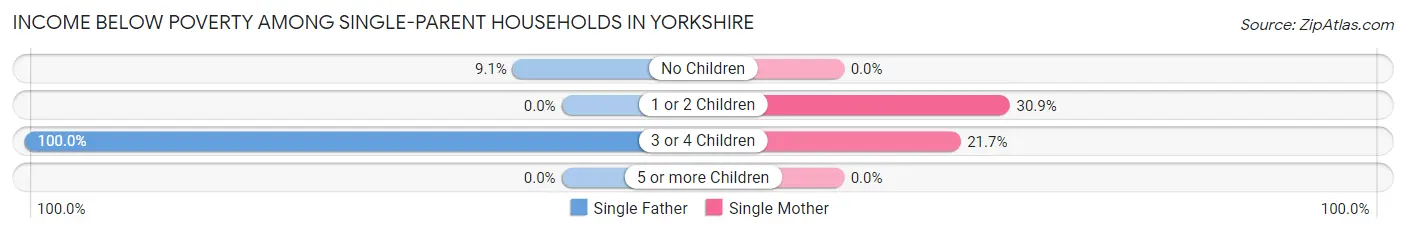
| Children | Single Father | Single Mother |
| No Children | 11 (9.1%) | 0 (0.0%) |
| 1 or 2 Children | 0 (0.0%) | 89 (30.9%) |
| 3 or 4 Children | 31 (100.0%) | 38 (21.7%) |
| 5 or more Children | 0 (0.0%) | 0 (0.0%) |
| Total | 42 (12.1%) | 127 (22.4%) |
Income Below Poverty Among Married-Couple vs Single-Parent Households in Yorkshire
The poverty data for Yorkshire shows that 49 of the married-couple family households (3.0%) and 169 of the single-parent households (18.5%) are living below the poverty level. Within the married-couple family households, those with 3 or 4 children have the highest poverty rate, with 49 households (26.3%) falling below the poverty line. Among the single-parent households, those with 3 or 4 children have the highest poverty rate, with 69 household (33.5%) living below poverty.
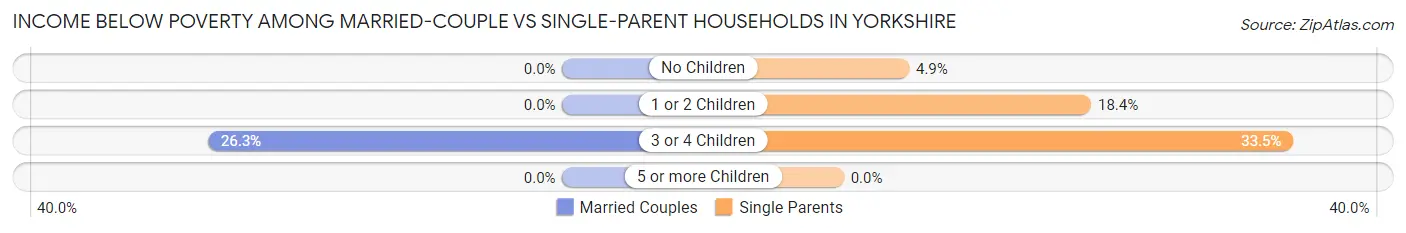
| Children | Married-Couple Families | Single-Parent Households |
| No Children | 0 (0.0%) | 11 (4.9%) |
| 1 or 2 Children | 0 (0.0%) | 89 (18.4%) |
| 3 or 4 Children | 49 (26.3%) | 69 (33.5%) |
| 5 or more Children | 0 (0.0%) | 0 (0.0%) |
| Total | 49 (3.0%) | 169 (18.5%) |
Race in Yorkshire
The most populous races in Yorkshire are White / Caucasian (5,959 | 56.4%), Hispanic or Latino (5,792 | 54.8%), and Two or more Races (1,578 | 14.9%).
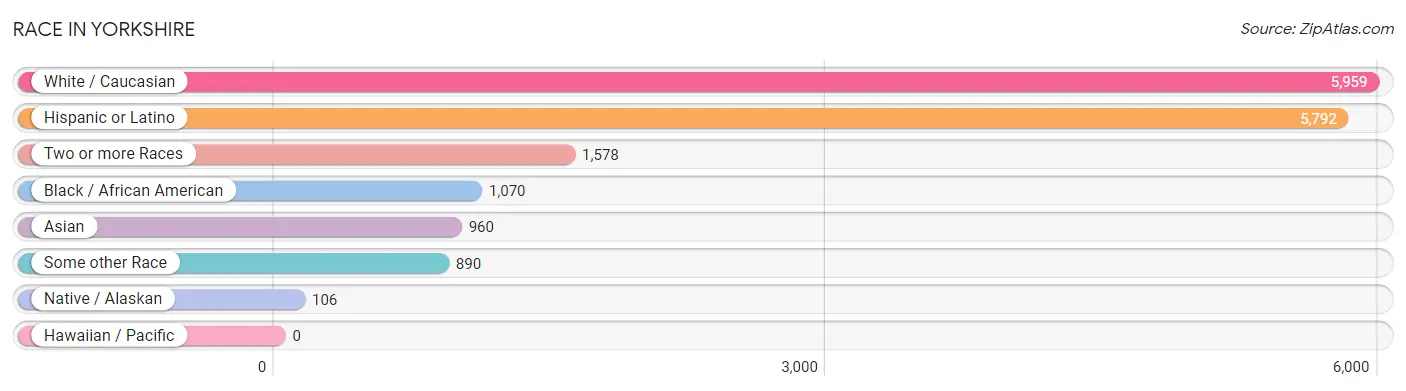
| Race | # Population | % Population |
| Asian | 960 | 9.1% |
| Black / African American | 1,070 | 10.1% |
| Hawaiian / Pacific | 0 | 0.0% |
| Hispanic or Latino | 5,792 | 54.8% |
| Native / Alaskan | 106 | 1.0% |
| White / Caucasian | 5,959 | 56.4% |
| Two or more Races | 1,578 | 14.9% |
| Some other Race | 890 | 8.4% |
| Total | 10,563 | 100.0% |
Ancestry in Yorkshire
The most populous ancestries reported in Yorkshire are Central American (3,973 | 37.6%), Salvadoran (3,147 | 29.8%), Mexican (918 | 8.7%), German (728 | 6.9%), and South American (618 | 5.9%), together accounting for 88.8% of all Yorkshire residents.
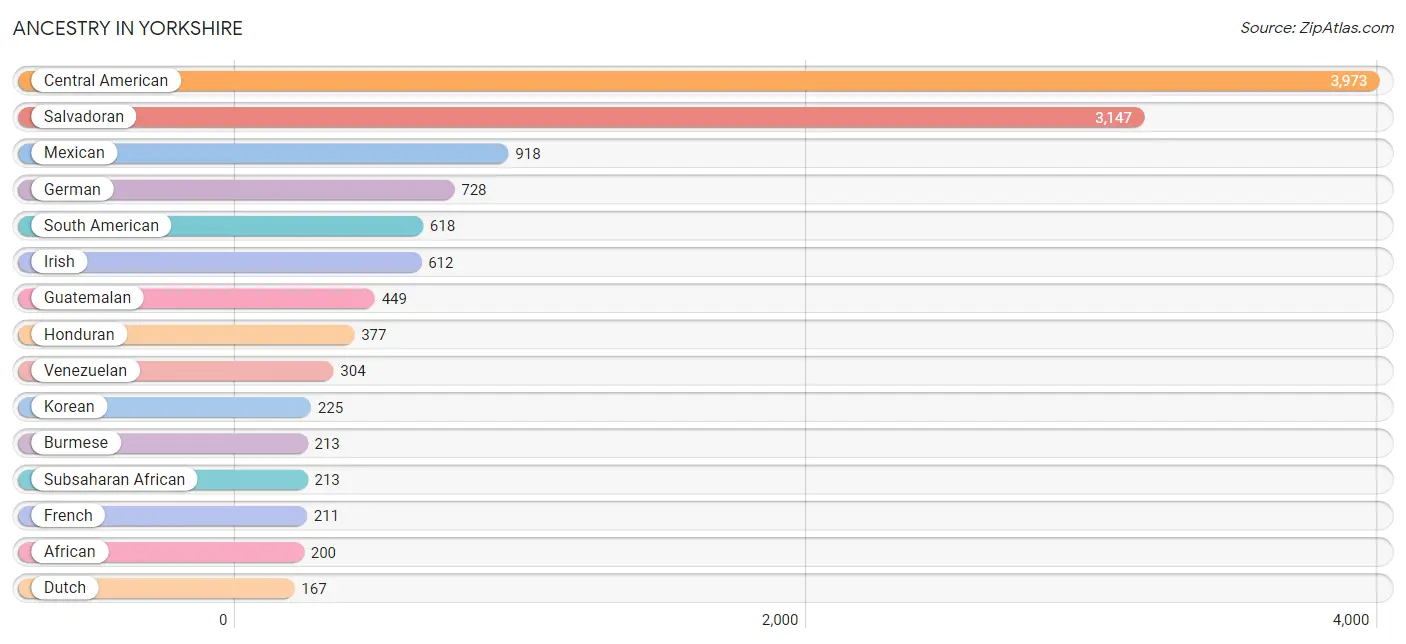
| Ancestry | # Population | % Population |
| African | 200 | 1.9% |
| American | 151 | 1.4% |
| Arab | 46 | 0.4% |
| Argentinean | 104 | 1.0% |
| Armenian | 12 | 0.1% |
| Austrian | 13 | 0.1% |
| Bhutanese | 60 | 0.6% |
| Bolivian | 53 | 0.5% |
| Brazilian | 7 | 0.1% |
| Burmese | 213 | 2.0% |
| Central American | 3,973 | 37.6% |
| Central American Indian | 79 | 0.7% |
| Choctaw | 27 | 0.3% |
| Colombian | 16 | 0.2% |
| Cuban | 124 | 1.2% |
| Dominican | 59 | 0.6% |
| Dutch | 167 | 1.6% |
| Egyptian | 22 | 0.2% |
| English | 159 | 1.5% |
| European | 45 | 0.4% |
| French | 211 | 2.0% |
| French Canadian | 14 | 0.1% |
| German | 728 | 6.9% |
| Ghanaian | 13 | 0.1% |
| Guatemalan | 449 | 4.3% |
| Haitian | 5 | 0.1% |
| Honduran | 377 | 3.6% |
| Hungarian | 21 | 0.2% |
| Indian (Asian) | 25 | 0.2% |
| Iranian | 19 | 0.2% |
| Irish | 612 | 5.8% |
| Italian | 134 | 1.3% |
| Korean | 225 | 2.1% |
| Laotian | 16 | 0.2% |
| Latvian | 13 | 0.1% |
| Mexican | 918 | 8.7% |
| Northern European | 10 | 0.1% |
| Norwegian | 14 | 0.1% |
| Pakistani | 18 | 0.2% |
| Peruvian | 141 | 1.3% |
| Salvadoran | 3,147 | 29.8% |
| Scandinavian | 10 | 0.1% |
| Scottish | 13 | 0.1% |
| South American | 618 | 5.9% |
| Spanish | 4 | 0.0% |
| Sri Lankan | 157 | 1.5% |
| Subsaharan African | 213 | 2.0% |
| Swedish | 111 | 1.1% |
| Thai | 86 | 0.8% |
| Trinidadian and Tobagonian | 12 | 0.1% |
| Venezuelan | 304 | 2.9% | View All 51 Rows |
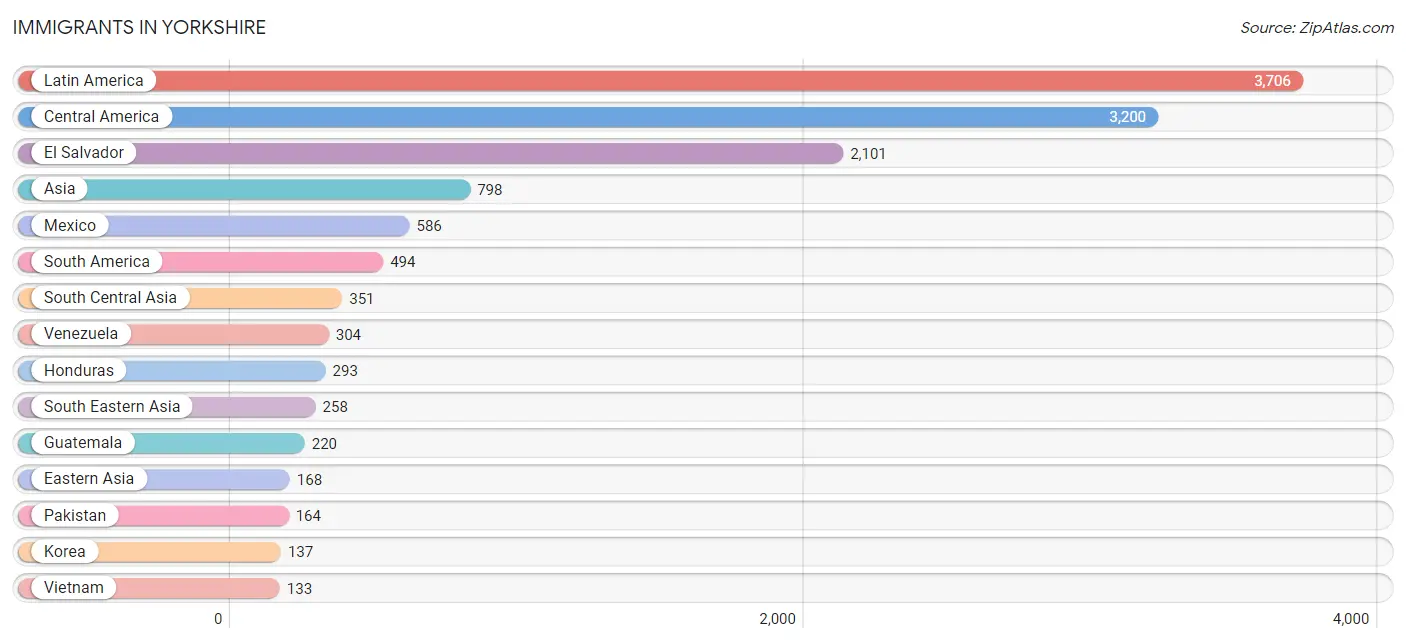
Immigrants in Yorkshire
The most numerous immigrant groups reported in Yorkshire came from Latin America (3,706 | 35.1%), Central America (3,200 | 30.3%), El Salvador (2,101 | 19.9%), Asia (798 | 7.5%), and Mexico (586 | 5.6%), together accounting for 98.4% of all Yorkshire residents.
| Immigration Origin | # Population | % Population |
| Africa | 95 | 0.9% |
| Argentina | 104 | 1.0% |
| Asia | 798 | 7.5% |
| Bolivia | 17 | 0.2% |
| Brazil | 7 | 0.1% |
| Caribbean | 12 | 0.1% |
| Central America | 3,200 | 30.3% |
| China | 7 | 0.1% |
| Eastern Asia | 168 | 1.6% |
| Egypt | 70 | 0.7% |
| El Salvador | 2,101 | 19.9% |
| Ghana | 25 | 0.2% |
| Guatemala | 220 | 2.1% |
| Honduras | 293 | 2.8% |
| India | 86 | 0.8% |
| Iraq | 15 | 0.1% |
| Israel | 6 | 0.1% |
| Japan | 24 | 0.2% |
| Korea | 137 | 1.3% |
| Latin America | 3,706 | 35.1% |
| Mexico | 586 | 5.6% |
| Nepal | 101 | 1.0% |
| Northern Africa | 70 | 0.7% |
| Pakistan | 164 | 1.5% |
| Peru | 62 | 0.6% |
| Philippines | 113 | 1.1% |
| South America | 494 | 4.7% |
| South Central Asia | 351 | 3.3% |
| South Eastern Asia | 258 | 2.4% |
| Thailand | 12 | 0.1% |
| Trinidad and Tobago | 12 | 0.1% |
| Venezuela | 304 | 2.9% |
| Vietnam | 133 | 1.3% |
| Western Africa | 25 | 0.2% |
| Western Asia | 21 | 0.2% | View All 35 Rows |
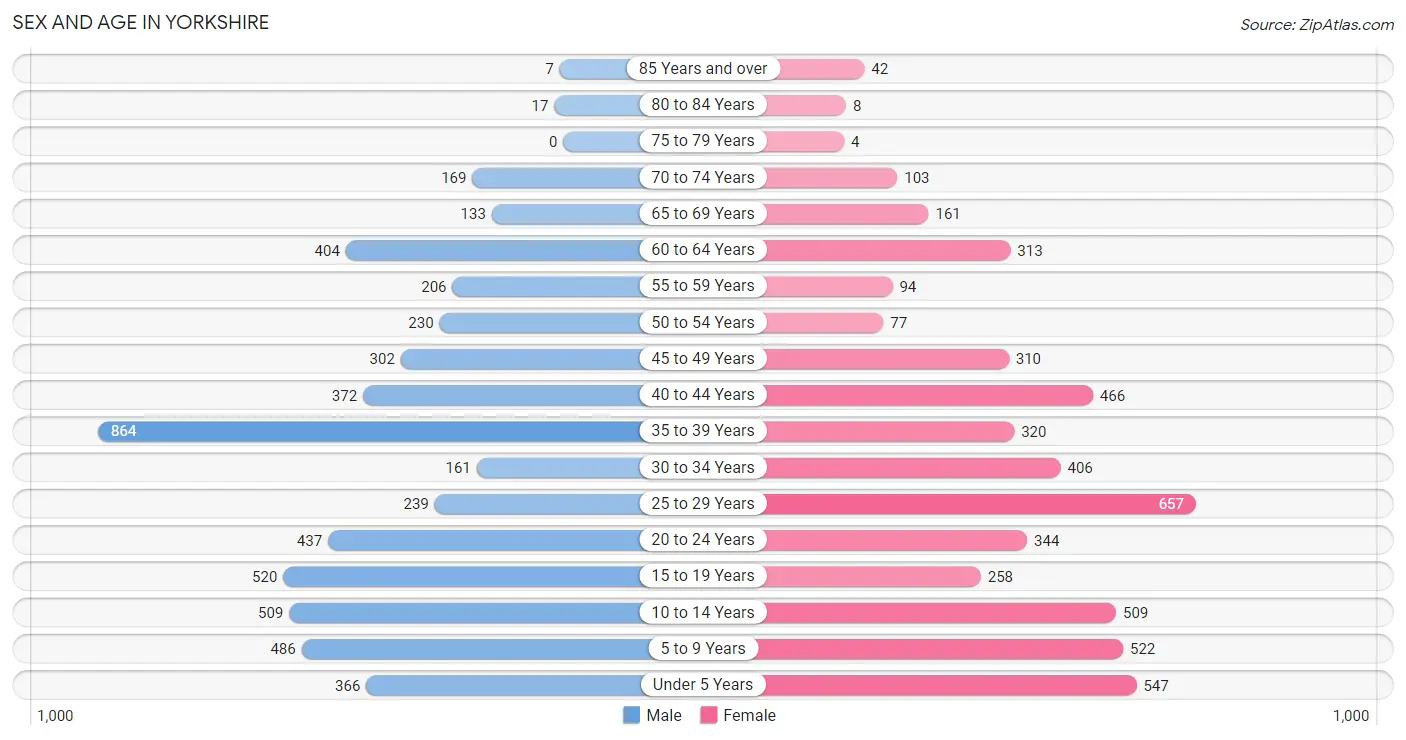
Sex and Age in Yorkshire
Sex and Age in Yorkshire
The most populous age groups in Yorkshire are 35 to 39 Years (864 | 15.9%) for men and 25 to 29 Years (657 | 12.8%) for women.
| Age Bracket | Male | Female |
| Under 5 Years | 366 (6.8%) | 547 (10.6%) |
| 5 to 9 Years | 486 (9.0%) | 522 (10.2%) |
| 10 to 14 Years | 509 (9.4%) | 509 (9.9%) |
| 15 to 19 Years | 520 (9.6%) | 258 (5.0%) |
| 20 to 24 Years | 437 (8.1%) | 344 (6.7%) |
| 25 to 29 Years | 239 (4.4%) | 657 (12.8%) |
| 30 to 34 Years | 161 (3.0%) | 406 (7.9%) |
| 35 to 39 Years | 864 (15.9%) | 320 (6.2%) |
| 40 to 44 Years | 372 (6.9%) | 466 (9.1%) |
| 45 to 49 Years | 302 (5.6%) | 310 (6.0%) |
| 50 to 54 Years | 230 (4.2%) | 77 (1.5%) |
| 55 to 59 Years | 206 (3.8%) | 94 (1.8%) |
| 60 to 64 Years | 404 (7.4%) | 313 (6.1%) |
| 65 to 69 Years | 133 (2.5%) | 161 (3.1%) |
| 70 to 74 Years | 169 (3.1%) | 103 (2.0%) |
| 75 to 79 Years | 0 (0.0%) | 4 (0.1%) |
| 80 to 84 Years | 17 (0.3%) | 8 (0.2%) |
| 85 Years and over | 7 (0.1%) | 42 (0.8%) |
| Total | 5,422 (100.0%) | 5,141 (100.0%) |
Families and Households in Yorkshire
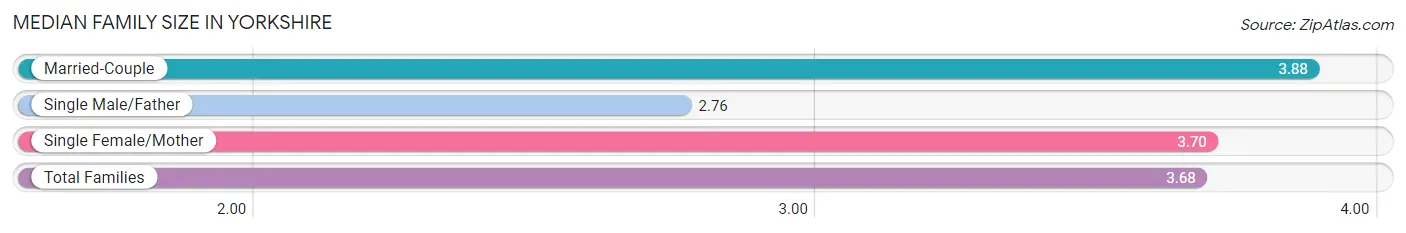
Median Family Size in Yorkshire
The median family size in Yorkshire is 3.68 persons per family, with married-couple families (1,606 | 63.7%) accounting for the largest median family size of 3.88 persons per family. On the other hand, single male/father families (347 | 13.8%) represent the smallest median family size with 2.76 persons per family.
| Family Type | # Families | Family Size |
| Married-Couple | 1,606 (63.7%) | 3.88 |
| Single Male/Father | 347 (13.8%) | 2.76 |
| Single Female/Mother | 568 (22.5%) | 3.70 |
| Total Families | 2,521 (100.0%) | 3.68 |
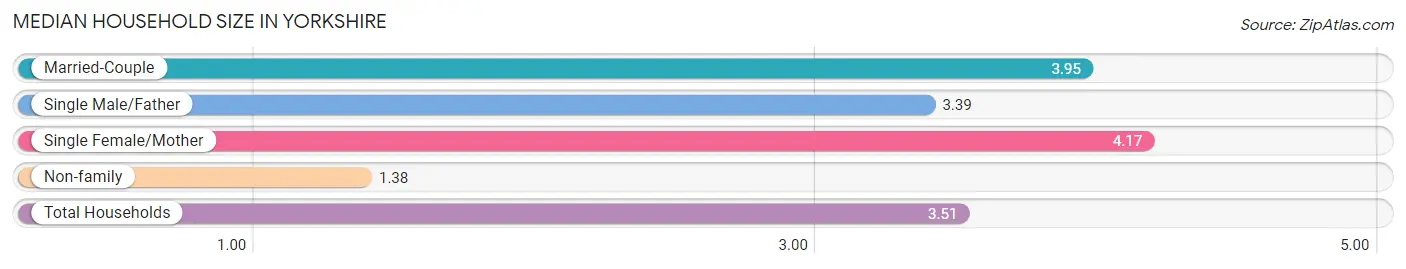
Median Household Size in Yorkshire
The median household size in Yorkshire is 3.51 persons per household, with single female/mother households (568 | 18.9%) accounting for the largest median household size of 4.17 persons per household. non-family households (487 | 16.2%) represent the smallest median household size with 1.38 persons per household.
| Household Type | # Households | Household Size |
| Married-Couple | 1,606 (53.4%) | 3.95 |
| Single Male/Father | 347 (11.5%) | 3.39 |
| Single Female/Mother | 568 (18.9%) | 4.17 |
| Non-family | 487 (16.2%) | 1.38 |
| Total Households | 3,008 (100.0%) | 3.51 |
Household Size by Marriage Status in Yorkshire
Out of a total of 3,008 households in Yorkshire, 2,521 (83.8%) are family households, while 487 (16.2%) are nonfamily households. The most numerous type of family households are 4-person households, comprising 825, and the most common type of nonfamily households are 1-person households, comprising 351.
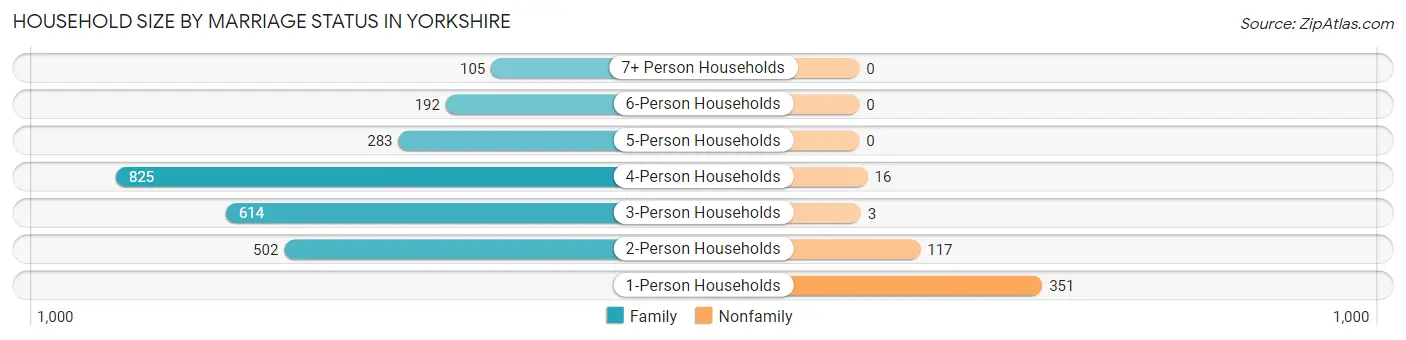
| Household Size | Family Households | Nonfamily Households |
| 1-Person Households | - | 351 (11.7%) |
| 2-Person Households | 502 (16.7%) | 117 (3.9%) |
| 3-Person Households | 614 (20.4%) | 3 (0.1%) |
| 4-Person Households | 825 (27.4%) | 16 (0.5%) |
| 5-Person Households | 283 (9.4%) | 0 (0.0%) |
| 6-Person Households | 192 (6.4%) | 0 (0.0%) |
| 7+ Person Households | 105 (3.5%) | 0 (0.0%) |
| Total | 2,521 (83.8%) | 487 (16.2%) |
Female Fertility in Yorkshire
Fertility by Age in Yorkshire
Average fertility rate in Yorkshire is 82.0 births per 1,000 women. Women in the age bracket of 35 to 50 years have the highest fertility rate with 103.0 births per 1,000 women. Women in the age bracket of 35 to 50 years acount for 50.2% of all women with births.
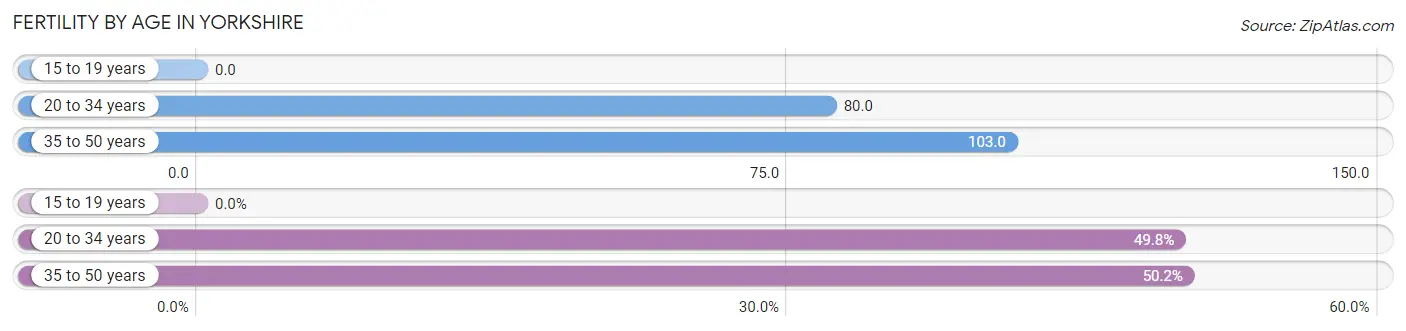
| Age Bracket | Women with Births | Births / 1,000 Women |
| 15 to 19 years | 0 (0.0%) | 0.0 |
| 20 to 34 years | 113 (49.8%) | 80.0 |
| 35 to 50 years | 114 (50.2%) | 103.0 |
| Total | 227 (100.0%) | 82.0 |
Fertility by Age by Marriage Status in Yorkshire
60.8% of women with births (227) in Yorkshire are married. The highest percentage of unmarried women with births falls into 20 to 34 years age bracket with 57.5% of them unmarried at the time of birth, while the lowest percentage of unmarried women with births belong to 35 to 50 years age bracket with 21.1% of them unmarried.
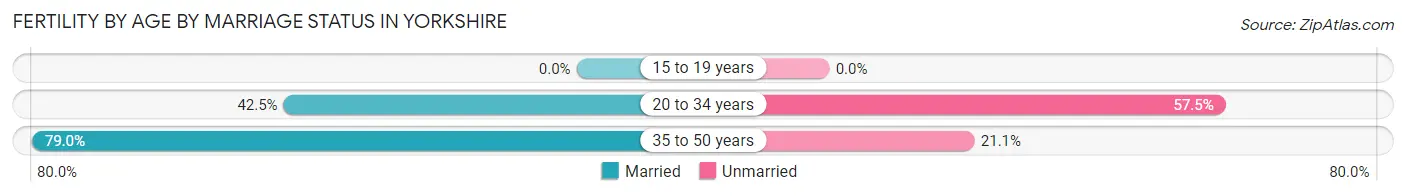
| Age Bracket | Married | Unmarried |
| 15 to 19 years | 0 (0.0%) | 0 (0.0%) |
| 20 to 34 years | 48 (42.5%) | 65 (57.5%) |
| 35 to 50 years | 90 (78.9%) | 24 (21.0%) |
| Total | 138 (60.8%) | 89 (39.2%) |
Fertility by Education in Yorkshire
Average fertility rate in Yorkshire is 82.0 births per 1,000 women. Women with the education attainment of bachelor's degree have the highest fertility rate of 147.0 births per 1,000 women, while women with the education attainment of college or associate's degree have the lowest fertility at 47.0 births per 1,000 women. Women with the education attainment of less than high school represent 37.4% of all women with births.
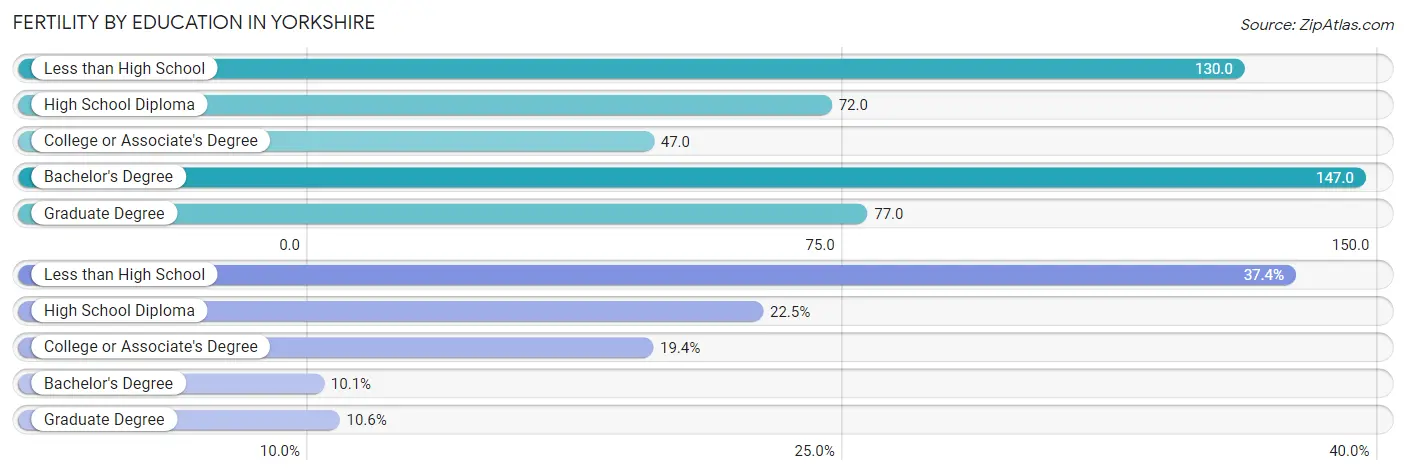
| Educational Attainment | Women with Births | Births / 1,000 Women |
| Less than High School | 85 (37.4%) | 130.0 |
| High School Diploma | 51 (22.5%) | 72.0 |
| College or Associate's Degree | 44 (19.4%) | 47.0 |
| Bachelor's Degree | 23 (10.1%) | 147.0 |
| Graduate Degree | 24 (10.6%) | 77.0 |
| Total | 227 (100.0%) | 82.0 |
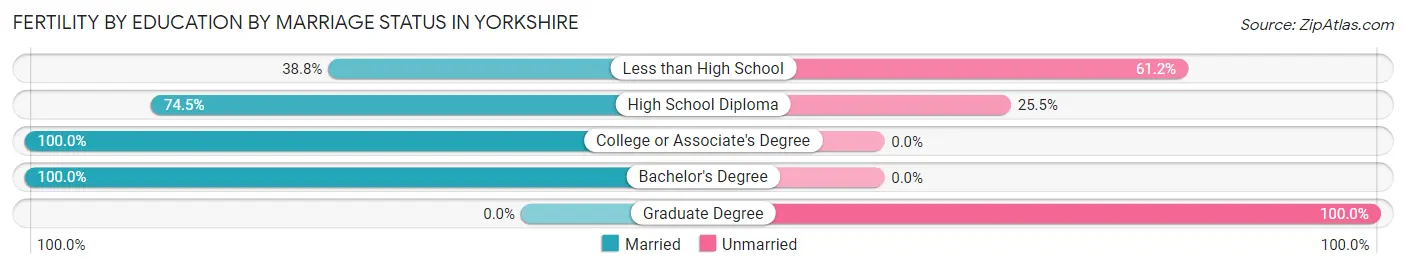
Fertility by Education by Marriage Status in Yorkshire
39.2% of women with births in Yorkshire are unmarried. Women with the educational attainment of college or associate's degree are most likely to be married with 100.0% of them married at childbirth, while women with the educational attainment of graduate degree are least likely to be married with 100.0% of them unmarried at childbirth.
| Educational Attainment | Married | Unmarried |
| Less than High School | 33 (38.8%) | 52 (61.2%) |
| High School Diploma | 38 (74.5%) | 13 (25.5%) |
| College or Associate's Degree | 44 (100.0%) | 0 (0.0%) |
| Bachelor's Degree | 23 (100.0%) | 0 (0.0%) |
| Graduate Degree | 0 (0.0%) | 24 (100.0%) |
| Total | 138 (60.8%) | 89 (39.2%) |
Employment Characteristics in Yorkshire
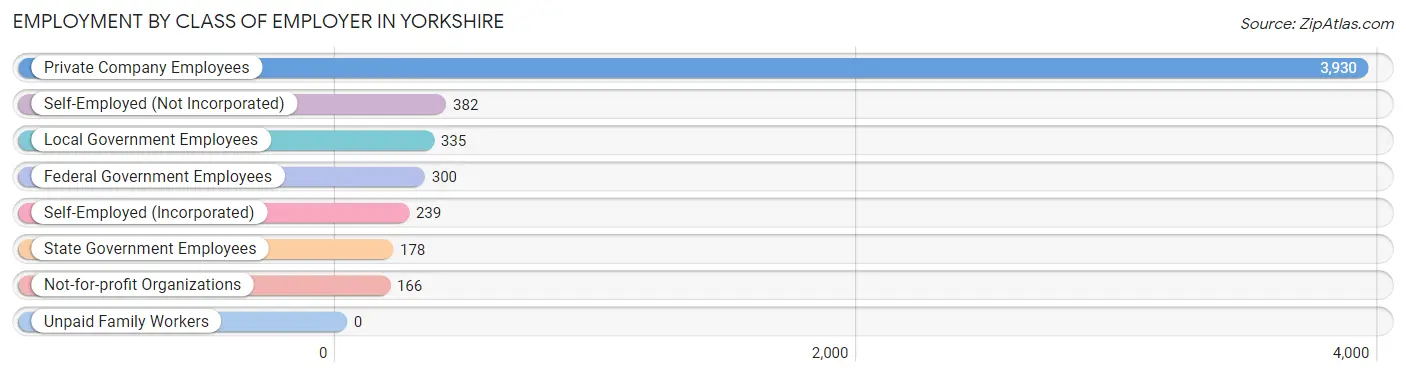
Employment by Class of Employer in Yorkshire
Among the 5,530 employed individuals in Yorkshire, private company employees (3,930 | 71.1%), self-employed (not incorporated) (382 | 6.9%), and local government employees (335 | 6.1%) make up the most common classes of employment.
| Employer Class | # Employees | % Employees |
| Private Company Employees | 3,930 | 71.1% |
| Self-Employed (Incorporated) | 239 | 4.3% |
| Self-Employed (Not Incorporated) | 382 | 6.9% |
| Not-for-profit Organizations | 166 | 3.0% |
| Local Government Employees | 335 | 6.1% |
| State Government Employees | 178 | 3.2% |
| Federal Government Employees | 300 | 5.4% |
| Unpaid Family Workers | 0 | 0.0% |
| Total | 5,530 | 100.0% |
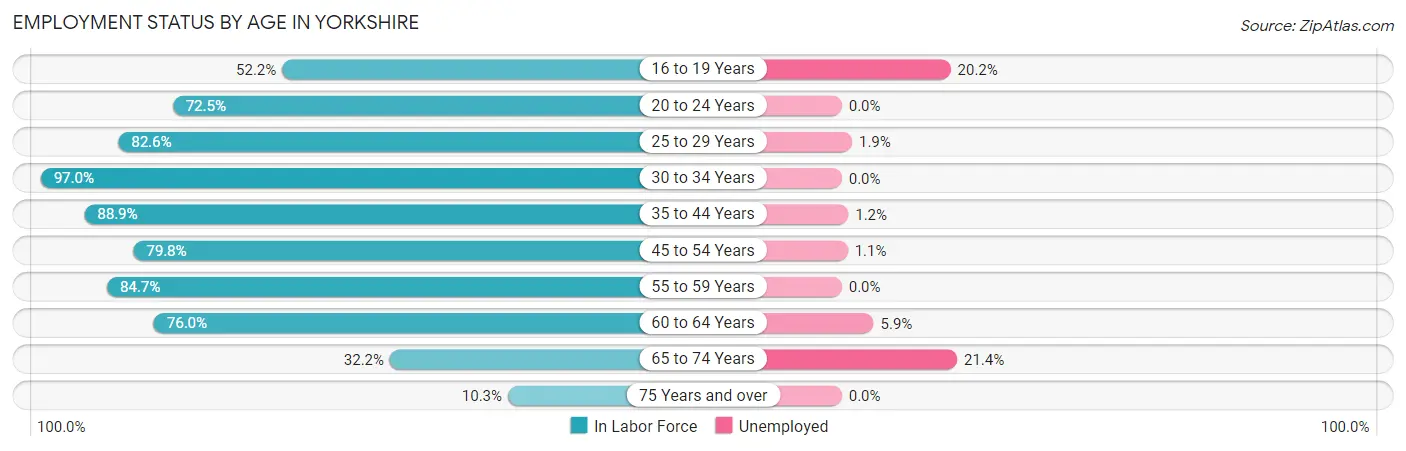
Employment Status by Age in Yorkshire
According to the labor force statistics for Yorkshire, out of the total population over 16 years of age (7,607), 75.9% or 5,774 individuals are in the labor force, with 3.4% or 196 of them unemployed. The age group with the highest labor force participation rate is 30 to 34 years, with 97.0% or 550 individuals in the labor force. Within the labor force, the 65 to 74 years age range has the highest percentage of unemployed individuals, with 21.4% or 39 of them being unemployed.
| Age Bracket | In Labor Force | Unemployed |
| 16 to 19 Years | 397 (52.2%) | 80 (20.2%) |
| 20 to 24 Years | 566 (72.5%) | 0 (0.0%) |
| 25 to 29 Years | 740 (82.6%) | 14 (1.9%) |
| 30 to 34 Years | 550 (97.0%) | 0 (0.0%) |
| 35 to 44 Years | 1,798 (88.9%) | 22 (1.2%) |
| 45 to 54 Years | 733 (79.8%) | 8 (1.1%) |
| 55 to 59 Years | 254 (84.7%) | 0 (0.0%) |
| 60 to 64 Years | 545 (76.0%) | 32 (5.9%) |
| 65 to 74 Years | 182 (32.2%) | 39 (21.4%) |
| 75 Years and over | 8 (10.3%) | 0 (0.0%) |
| Total | 5,774 (75.9%) | 196 (3.4%) |
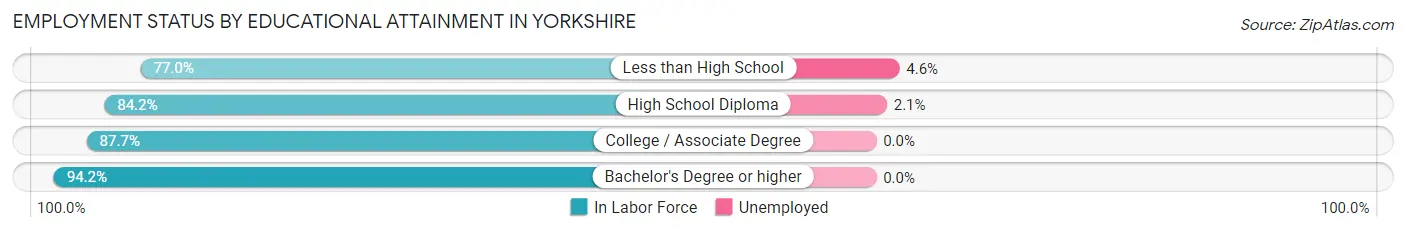
Employment Status by Educational Attainment in Yorkshire
According to labor force statistics for Yorkshire, 85.2% of individuals (4,619) out of the total population between 25 and 64 years of age (5,421) are in the labor force, with 1.7% or 79 of them being unemployed. The group with the highest labor force participation rate are those with the educational attainment of bachelor's degree or higher, with 94.2% or 966 individuals in the labor force. Within the labor force, individuals with less than high school education have the highest percentage of unemployment, with 4.6% or 50 of them being unemployed.
| Educational Attainment | In Labor Force | Unemployed |
| Less than High School | 1,086 (77.0%) | 65 (4.6%) |
| High School Diploma | 1,231 (84.2%) | 31 (2.1%) |
| College / Associate Degree | 1,336 (87.7%) | 0 (0.0%) |
| Bachelor's Degree or higher | 966 (94.2%) | 0 (0.0%) |
| Total | 4,619 (85.2%) | 92 (1.7%) |
Employment Occupations by Sex in Yorkshire
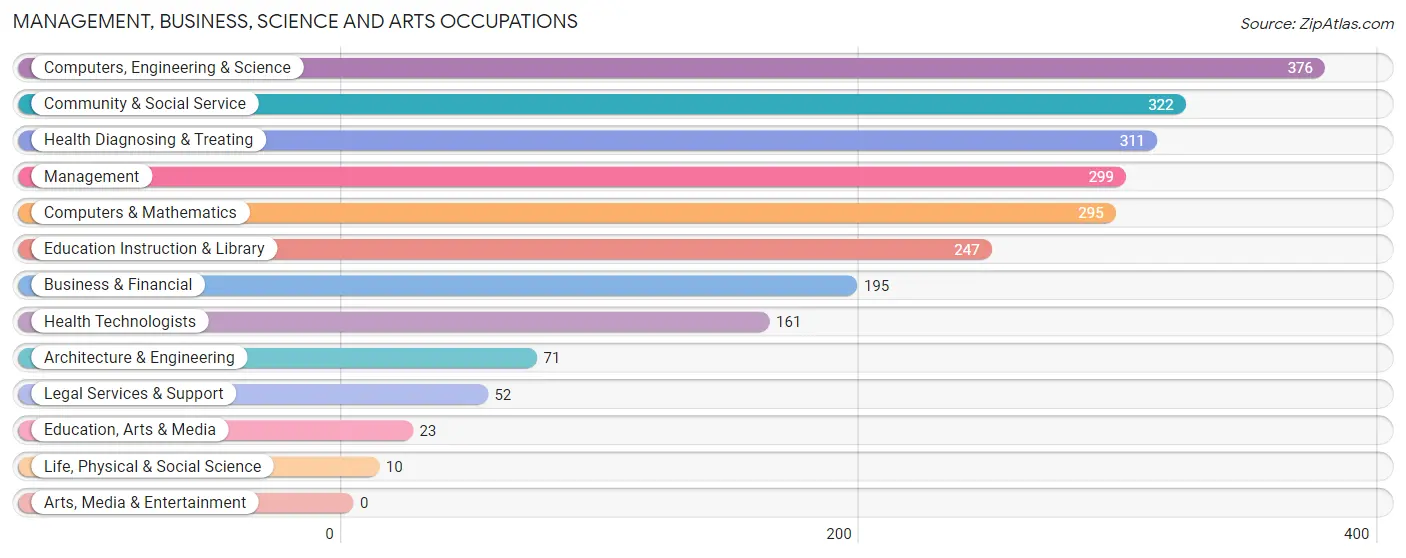
Management, Business, Science and Arts Occupations
The most common Management, Business, Science and Arts occupations in Yorkshire are Computers, Engineering & Science (376 | 6.8%), Community & Social Service (322 | 5.9%), Health Diagnosing & Treating (311 | 5.7%), Management (299 | 5.4%), and Computers & Mathematics (295 | 5.4%).
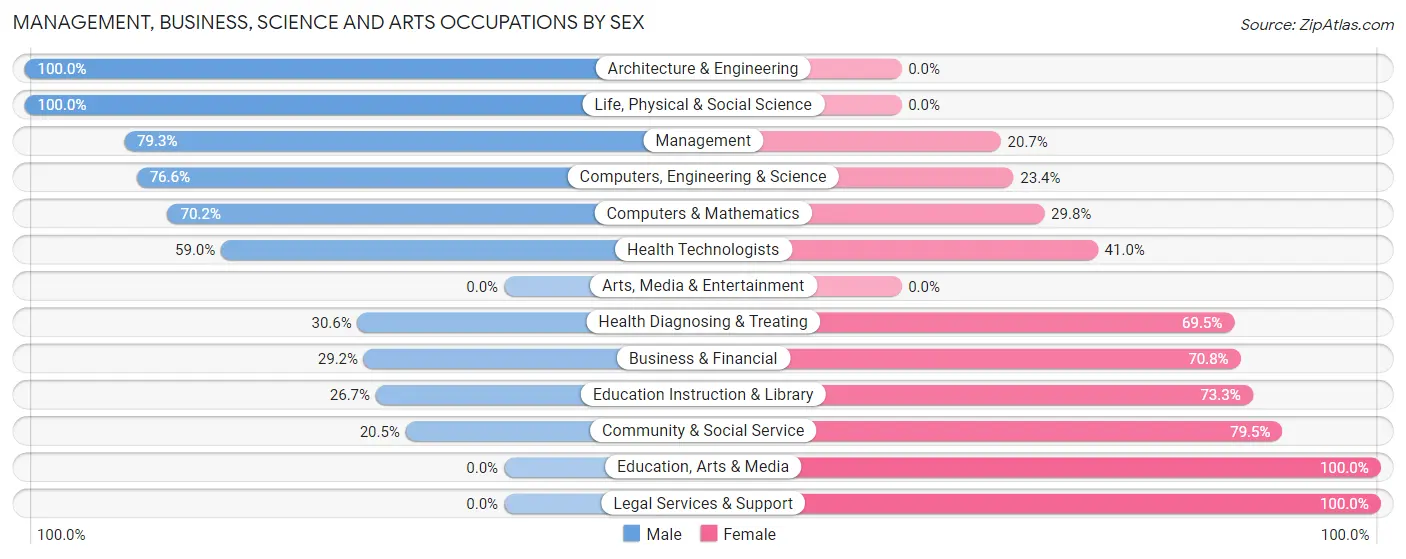
Management, Business, Science and Arts Occupations by Sex
Within the Management, Business, Science and Arts occupations in Yorkshire, the most male-oriented occupations are Architecture & Engineering (100.0%), Life, Physical & Social Science (100.0%), and Management (79.3%), while the most female-oriented occupations are Education, Arts & Media (100.0%), Legal Services & Support (100.0%), and Community & Social Service (79.5%).
| Occupation | Male | Female |
| Management | 237 (79.3%) | 62 (20.7%) |
| Business & Financial | 57 (29.2%) | 138 (70.8%) |
| Computers, Engineering & Science | 288 (76.6%) | 88 (23.4%) |
| Computers & Mathematics | 207 (70.2%) | 88 (29.8%) |
| Architecture & Engineering | 71 (100.0%) | 0 (0.0%) |
| Life, Physical & Social Science | 10 (100.0%) | 0 (0.0%) |
| Community & Social Service | 66 (20.5%) | 256 (79.5%) |
| Education, Arts & Media | 0 (0.0%) | 23 (100.0%) |
| Legal Services & Support | 0 (0.0%) | 52 (100.0%) |
| Education Instruction & Library | 66 (26.7%) | 181 (73.3%) |
| Arts, Media & Entertainment | 0 (0.0%) | 0 (0.0%) |
| Health Diagnosing & Treating | 95 (30.5%) | 216 (69.5%) |
| Health Technologists | 95 (59.0%) | 66 (41.0%) |
| Total (Category) | 743 (49.4%) | 760 (50.6%) |
| Total (Overall) | 3,051 (55.5%) | 2,445 (44.5%) |
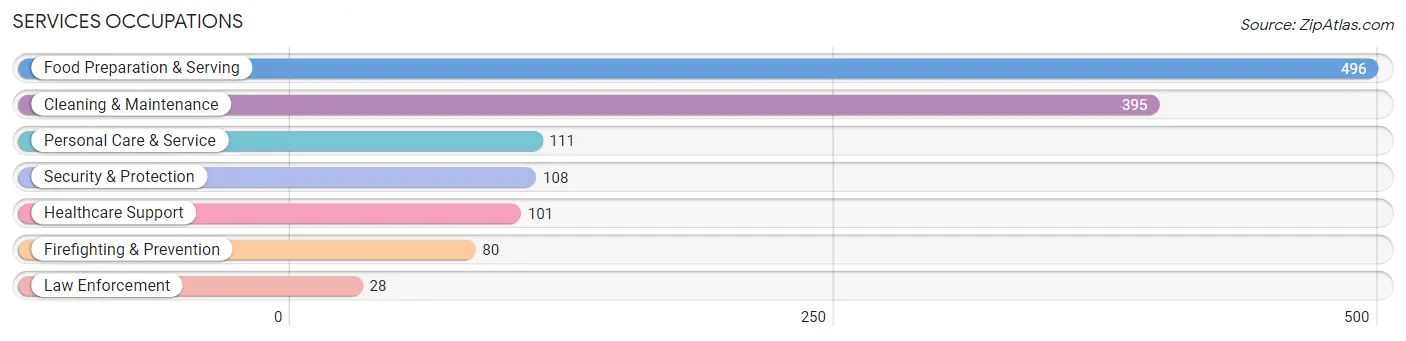
Services Occupations
The most common Services occupations in Yorkshire are Food Preparation & Serving (496 | 9.0%), Cleaning & Maintenance (395 | 7.2%), Personal Care & Service (111 | 2.0%), Security & Protection (108 | 2.0%), and Healthcare Support (101 | 1.8%).
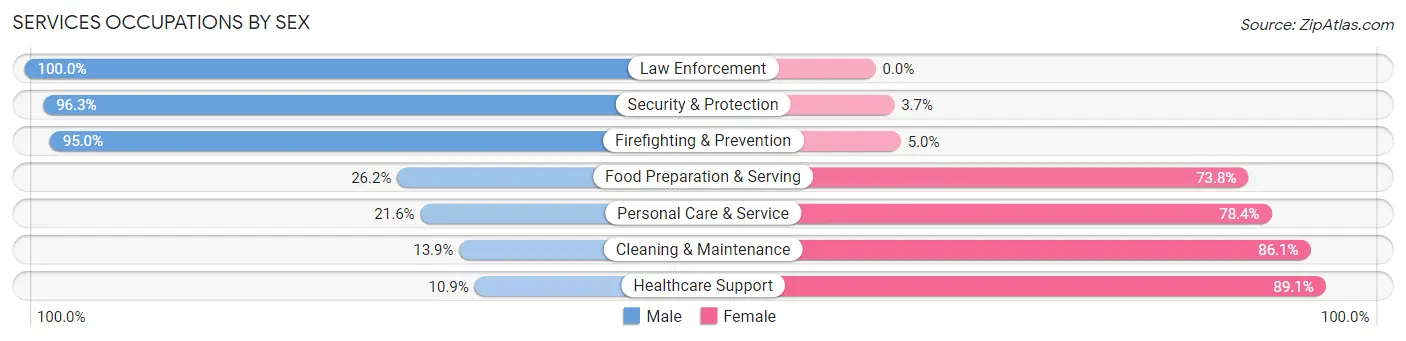
Services Occupations by Sex
Within the Services occupations in Yorkshire, the most male-oriented occupations are Law Enforcement (100.0%), Security & Protection (96.3%), and Firefighting & Prevention (95.0%), while the most female-oriented occupations are Healthcare Support (89.1%), Cleaning & Maintenance (86.1%), and Personal Care & Service (78.4%).
| Occupation | Male | Female |
| Healthcare Support | 11 (10.9%) | 90 (89.1%) |
| Security & Protection | 104 (96.3%) | 4 (3.7%) |
| Firefighting & Prevention | 76 (95.0%) | 4 (5.0%) |
| Law Enforcement | 28 (100.0%) | 0 (0.0%) |
| Food Preparation & Serving | 130 (26.2%) | 366 (73.8%) |
| Cleaning & Maintenance | 55 (13.9%) | 340 (86.1%) |
| Personal Care & Service | 24 (21.6%) | 87 (78.4%) |
| Total (Category) | 324 (26.8%) | 887 (73.3%) |
| Total (Overall) | 3,051 (55.5%) | 2,445 (44.5%) |
Sales and Office Occupations
The most common Sales and Office occupations in Yorkshire are Sales & Related (592 | 10.8%), and Office & Administration (521 | 9.5%).
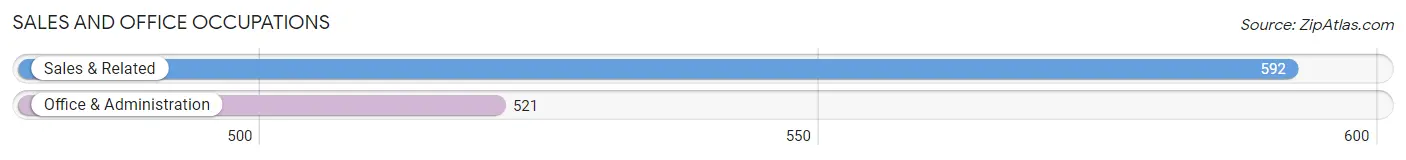
Sales and Office Occupations by Sex
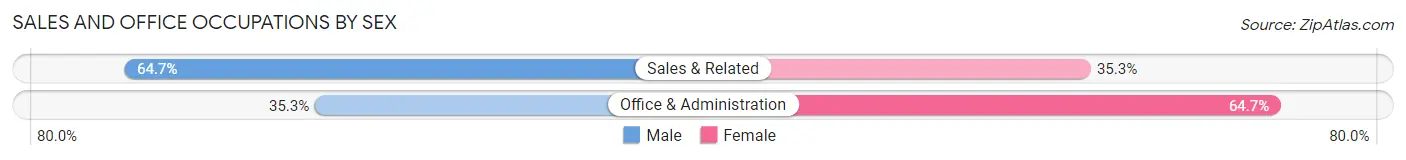
| Occupation | Male | Female |
| Sales & Related | 383 (64.7%) | 209 (35.3%) |
| Office & Administration | 184 (35.3%) | 337 (64.7%) |
| Total (Category) | 567 (50.9%) | 546 (49.1%) |
| Total (Overall) | 3,051 (55.5%) | 2,445 (44.5%) |
Natural Resources, Construction and Maintenance Occupations
The most common Natural Resources, Construction and Maintenance occupations in Yorkshire are Construction & Extraction (941 | 17.1%), and Installation, Maintenance & Repair (102 | 1.9%).
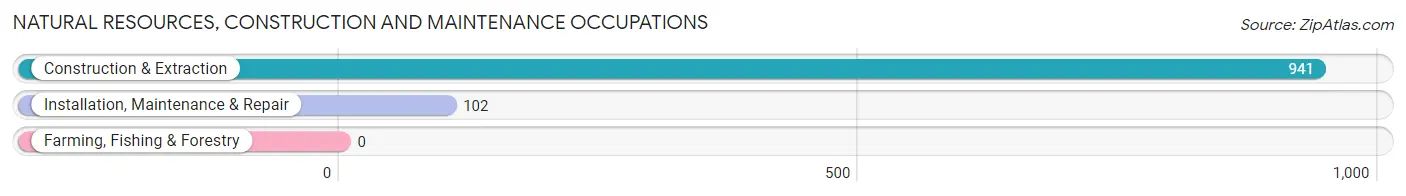
Natural Resources, Construction and Maintenance Occupations by Sex
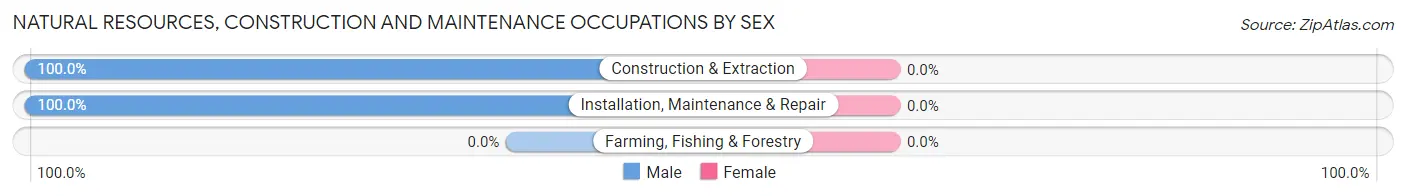
| Occupation | Male | Female |
| Farming, Fishing & Forestry | 0 (0.0%) | 0 (0.0%) |
| Construction & Extraction | 941 (100.0%) | 0 (0.0%) |
| Installation, Maintenance & Repair | 102 (100.0%) | 0 (0.0%) |
| Total (Category) | 1,043 (100.0%) | 0 (0.0%) |
| Total (Overall) | 3,051 (55.5%) | 2,445 (44.5%) |
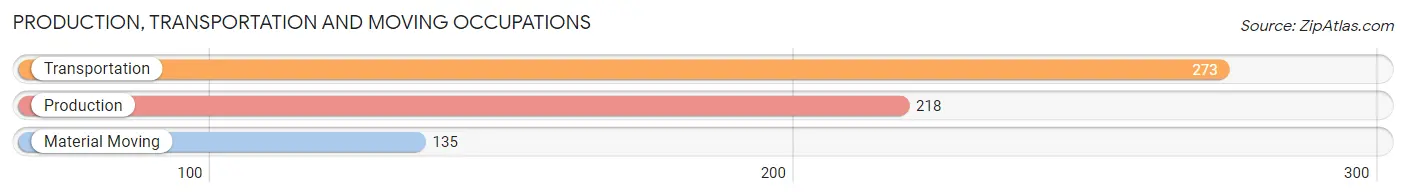
Production, Transportation and Moving Occupations
The most common Production, Transportation and Moving occupations in Yorkshire are Transportation (273 | 5.0%), Production (218 | 4.0%), and Material Moving (135 | 2.5%).
Production, Transportation and Moving Occupations by Sex
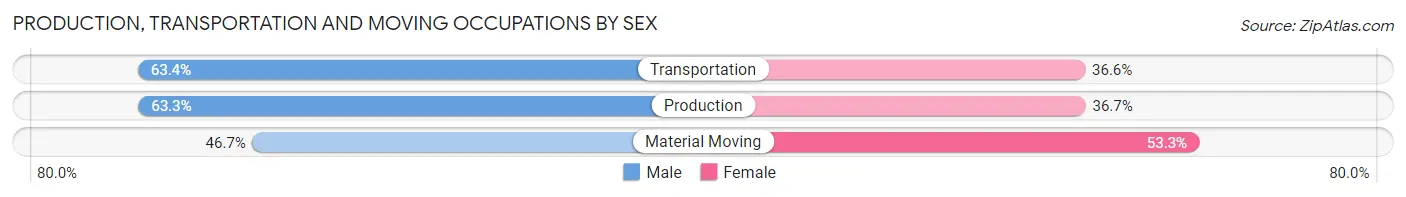
| Occupation | Male | Female |
| Production | 138 (63.3%) | 80 (36.7%) |
| Transportation | 173 (63.4%) | 100 (36.6%) |
| Material Moving | 63 (46.7%) | 72 (53.3%) |
| Total (Category) | 374 (59.7%) | 252 (40.3%) |
| Total (Overall) | 3,051 (55.5%) | 2,445 (44.5%) |
Employment Industries by Sex in Yorkshire
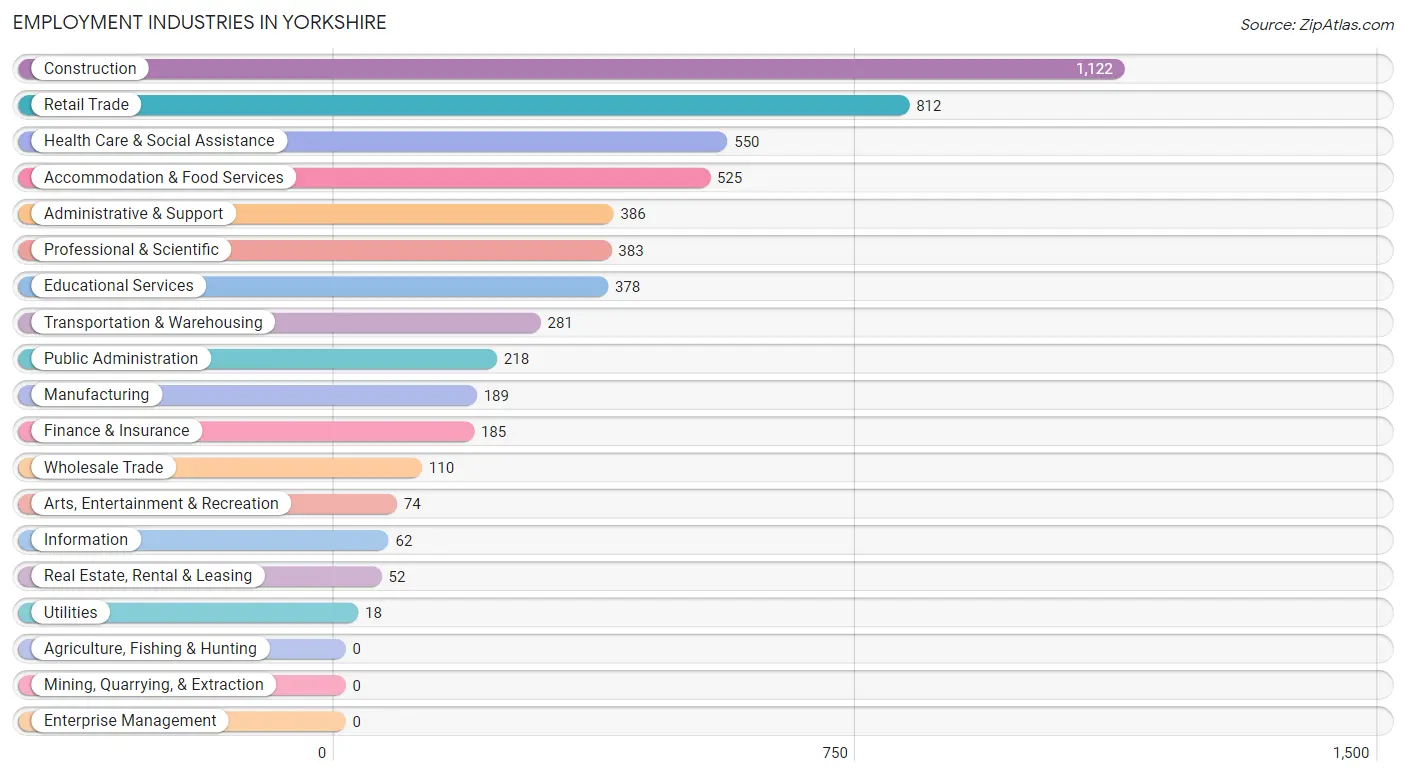
Employment Industries in Yorkshire
The major employment industries in Yorkshire include Construction (1,122 | 20.4%), Retail Trade (812 | 14.8%), Health Care & Social Assistance (550 | 10.0%), Accommodation & Food Services (525 | 9.6%), and Administrative & Support (386 | 7.0%).
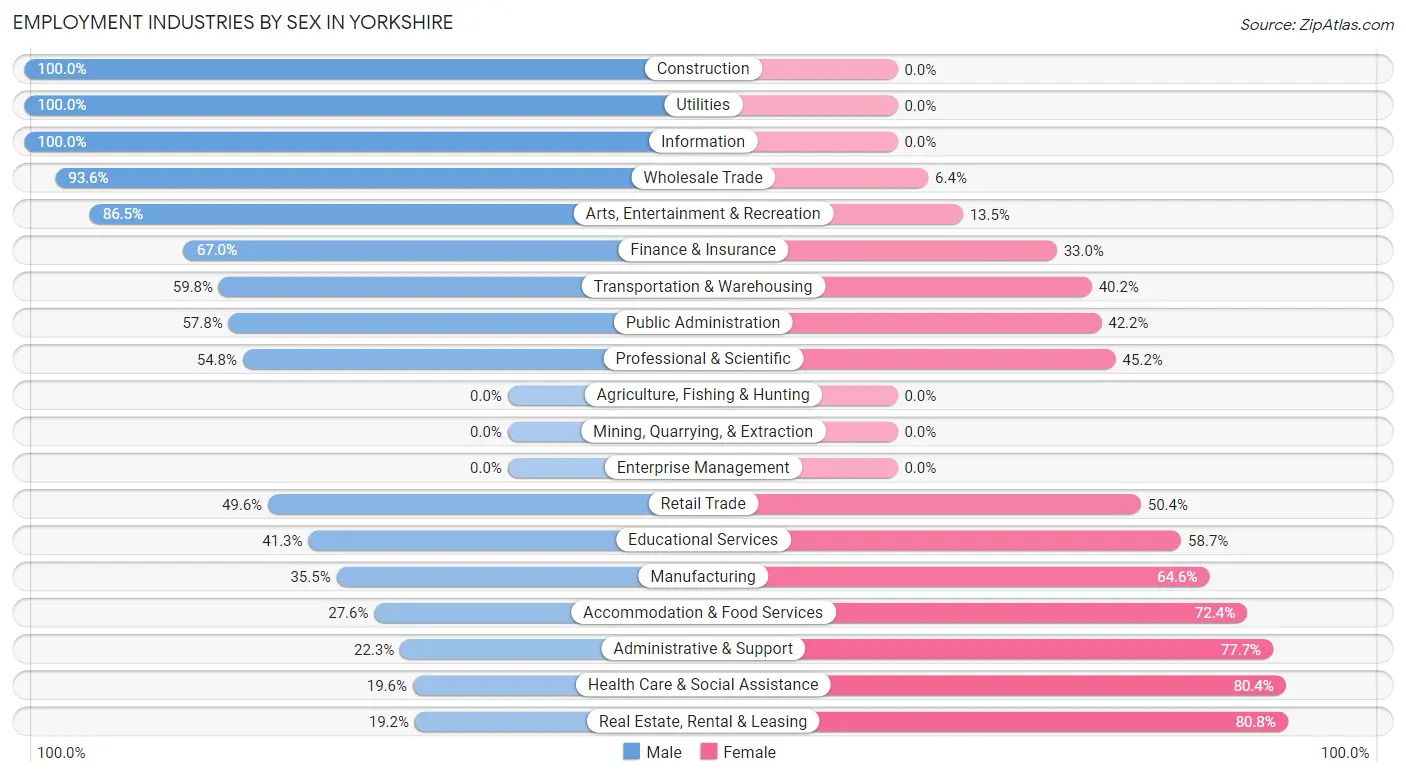
Employment Industries by Sex in Yorkshire
The Yorkshire industries that see more men than women are Construction (100.0%), Utilities (100.0%), and Information (100.0%), whereas the industries that tend to have a higher number of women are Real Estate, Rental & Leasing (80.8%), Health Care & Social Assistance (80.4%), and Administrative & Support (77.7%).
| Industry | Male | Female |
| Agriculture, Fishing & Hunting | 0 (0.0%) | 0 (0.0%) |
| Mining, Quarrying, & Extraction | 0 (0.0%) | 0 (0.0%) |
| Construction | 1,122 (100.0%) | 0 (0.0%) |
| Manufacturing | 67 (35.4%) | 122 (64.5%) |
| Wholesale Trade | 103 (93.6%) | 7 (6.4%) |
| Retail Trade | 403 (49.6%) | 409 (50.4%) |
| Transportation & Warehousing | 168 (59.8%) | 113 (40.2%) |
| Utilities | 18 (100.0%) | 0 (0.0%) |
| Information | 62 (100.0%) | 0 (0.0%) |
| Finance & Insurance | 124 (67.0%) | 61 (33.0%) |
| Real Estate, Rental & Leasing | 10 (19.2%) | 42 (80.8%) |
| Professional & Scientific | 210 (54.8%) | 173 (45.2%) |
| Enterprise Management | 0 (0.0%) | 0 (0.0%) |
| Administrative & Support | 86 (22.3%) | 300 (77.7%) |
| Educational Services | 156 (41.3%) | 222 (58.7%) |
| Health Care & Social Assistance | 108 (19.6%) | 442 (80.4%) |
| Arts, Entertainment & Recreation | 64 (86.5%) | 10 (13.5%) |
| Accommodation & Food Services | 145 (27.6%) | 380 (72.4%) |
| Public Administration | 126 (57.8%) | 92 (42.2%) |
| Total | 3,051 (55.5%) | 2,445 (44.5%) |
Education in Yorkshire
School Enrollment in Yorkshire
The most common levels of schooling among the 3,295 students in Yorkshire are middle school (967 | 29.3%), elementary school (743 | 22.6%), and college / undergraduate (671 | 20.4%).
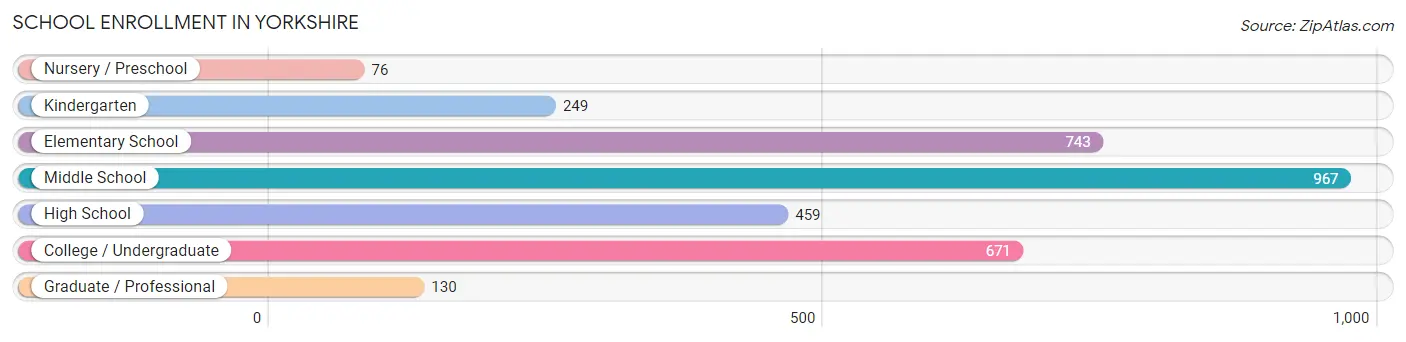
| School Level | # Students | % Students |
| Nursery / Preschool | 76 | 2.3% |
| Kindergarten | 249 | 7.6% |
| Elementary School | 743 | 22.6% |
| Middle School | 967 | 29.3% |
| High School | 459 | 13.9% |
| College / Undergraduate | 671 | 20.4% |
| Graduate / Professional | 130 | 4.0% |
| Total | 3,295 | 100.0% |
School Enrollment by Age by Funding Source in Yorkshire
Out of a total of 3,295 students who are enrolled in schools in Yorkshire, 287 (8.7%) attend a private institution, while the remaining 3,008 (91.3%) are enrolled in public schools. The age group of 3 to 4 year olds has the highest likelihood of being enrolled in private schools, with 46 (88.5% in the age bracket) enrolled. Conversely, the age group of 20 to 24 year olds has the lowest likelihood of being enrolled in a private school, with 134 (100.0% in the age bracket) attending a public institution.
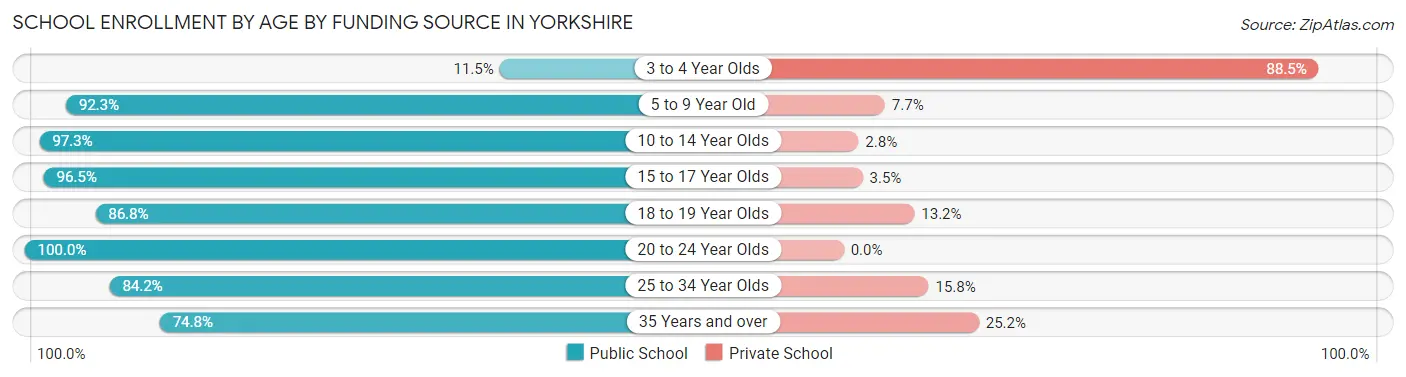
| Age Bracket | Public School | Private School |
| 3 to 4 Year Olds | 6 (11.5%) | 46 (88.5%) |
| 5 to 9 Year Old | 926 (92.3%) | 77 (7.7%) |
| 10 to 14 Year Olds | 990 (97.3%) | 28 (2.8%) |
| 15 to 17 Year Olds | 301 (96.5%) | 11 (3.5%) |
| 18 to 19 Year Olds | 356 (86.8%) | 54 (13.2%) |
| 20 to 24 Year Olds | 134 (100.0%) | 0 (0.0%) |
| 25 to 34 Year Olds | 181 (84.2%) | 34 (15.8%) |
| 35 Years and over | 113 (74.8%) | 38 (25.2%) |
| Total | 3,008 (91.3%) | 287 (8.7%) |
Educational Attainment by Field of Study in Yorkshire
Business (172 | 14.0%), education (144 | 11.7%), literature & languages (131 | 10.7%), social sciences (119 | 9.7%), and science & technology (110 | 9.0%) are the most common fields of study among 1,226 individuals in Yorkshire who have obtained a bachelor's degree or higher.
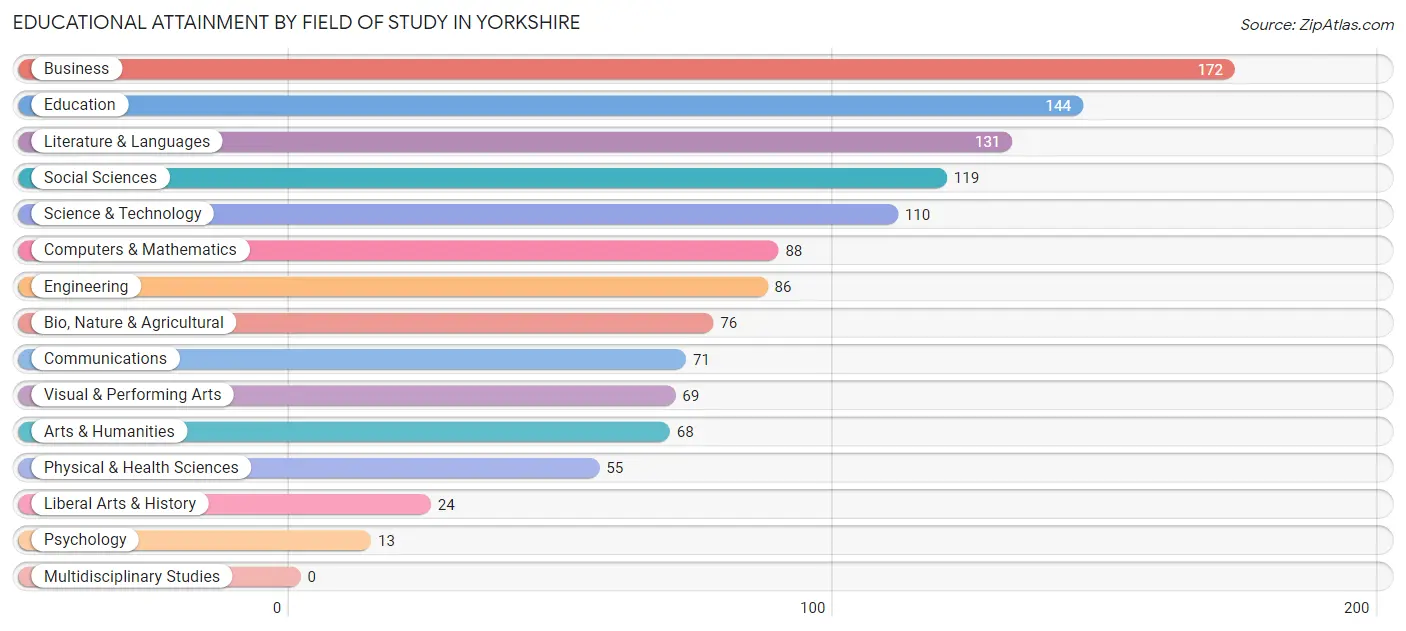
| Field of Study | # Graduates | % Graduates |
| Computers & Mathematics | 88 | 7.2% |
| Bio, Nature & Agricultural | 76 | 6.2% |
| Physical & Health Sciences | 55 | 4.5% |
| Psychology | 13 | 1.1% |
| Social Sciences | 119 | 9.7% |
| Engineering | 86 | 7.0% |
| Multidisciplinary Studies | 0 | 0.0% |
| Science & Technology | 110 | 9.0% |
| Business | 172 | 14.0% |
| Education | 144 | 11.7% |
| Literature & Languages | 131 | 10.7% |
| Liberal Arts & History | 24 | 2.0% |
| Visual & Performing Arts | 69 | 5.6% |
| Communications | 71 | 5.8% |
| Arts & Humanities | 68 | 5.6% |
| Total | 1,226 | 100.0% |
Transportation & Commute in Yorkshire
Vehicle Availability by Sex in Yorkshire
The most prevalent vehicle ownership categories in Yorkshire are males with 2 vehicles (1,053, accounting for 34.2%) and females with 2 vehicles (761, making up 43.0%).
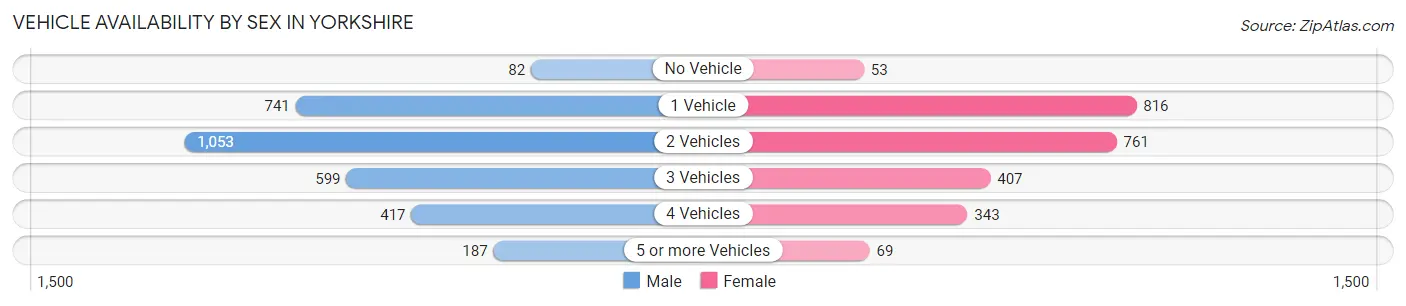
| Vehicles Available | Male | Female |
| No Vehicle | 82 (2.7%) | 53 (2.2%) |
| 1 Vehicle | 741 (24.1%) | 816 (33.3%) |
| 2 Vehicles | 1,053 (34.2%) | 761 (31.1%) |
| 3 Vehicles | 599 (19.5%) | 407 (16.6%) |
| 4 Vehicles | 417 (13.5%) | 343 (14.0%) |
| 5 or more Vehicles | 187 (6.1%) | 69 (2.8%) |
| Total | 3,079 (100.0%) | 2,449 (100.0%) |
Commute Time in Yorkshire
The most frequently occuring commute durations in Yorkshire are 15 to 19 minutes (860 commuters, 17.0%), 20 to 24 minutes (705 commuters, 13.9%), and 60 to 89 minutes (701 commuters, 13.8%).
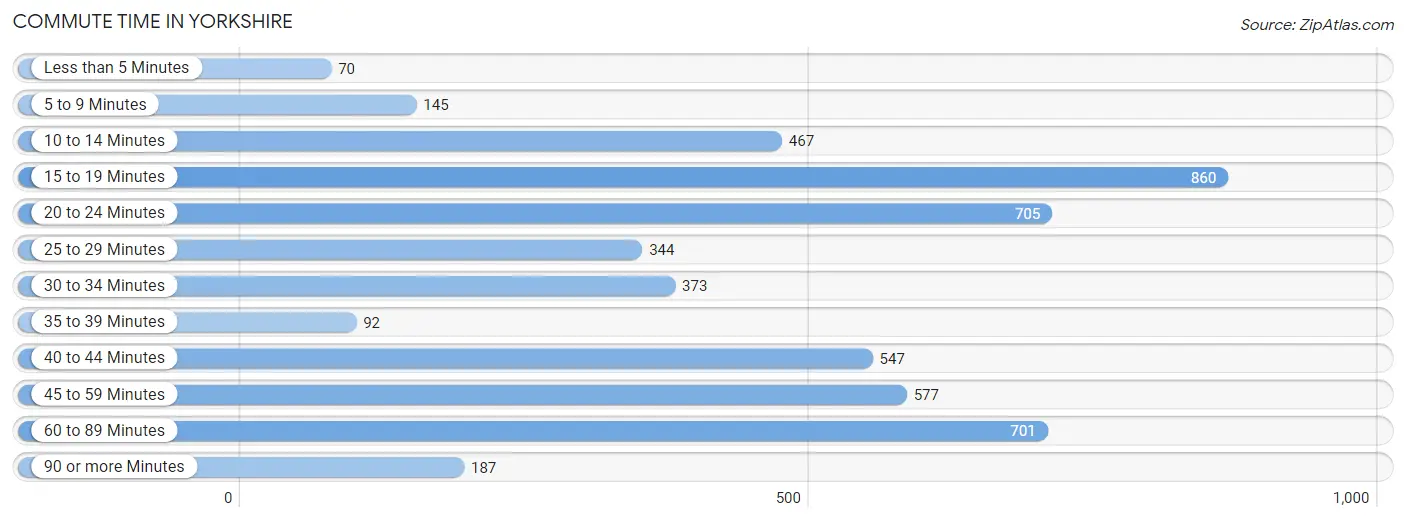
| Commute Time | # Commuters | % Commuters |
| Less than 5 Minutes | 70 | 1.4% |
| 5 to 9 Minutes | 145 | 2.9% |
| 10 to 14 Minutes | 467 | 9.2% |
| 15 to 19 Minutes | 860 | 17.0% |
| 20 to 24 Minutes | 705 | 13.9% |
| 25 to 29 Minutes | 344 | 6.8% |
| 30 to 34 Minutes | 373 | 7.4% |
| 35 to 39 Minutes | 92 | 1.8% |
| 40 to 44 Minutes | 547 | 10.8% |
| 45 to 59 Minutes | 577 | 11.4% |
| 60 to 89 Minutes | 701 | 13.8% |
| 90 or more Minutes | 187 | 3.7% |
Commute Time by Sex in Yorkshire
The most common commute times in Yorkshire are 60 to 89 minutes (499 commuters, 17.6%) for males and 15 to 19 minutes (452 commuters, 20.2%) for females.
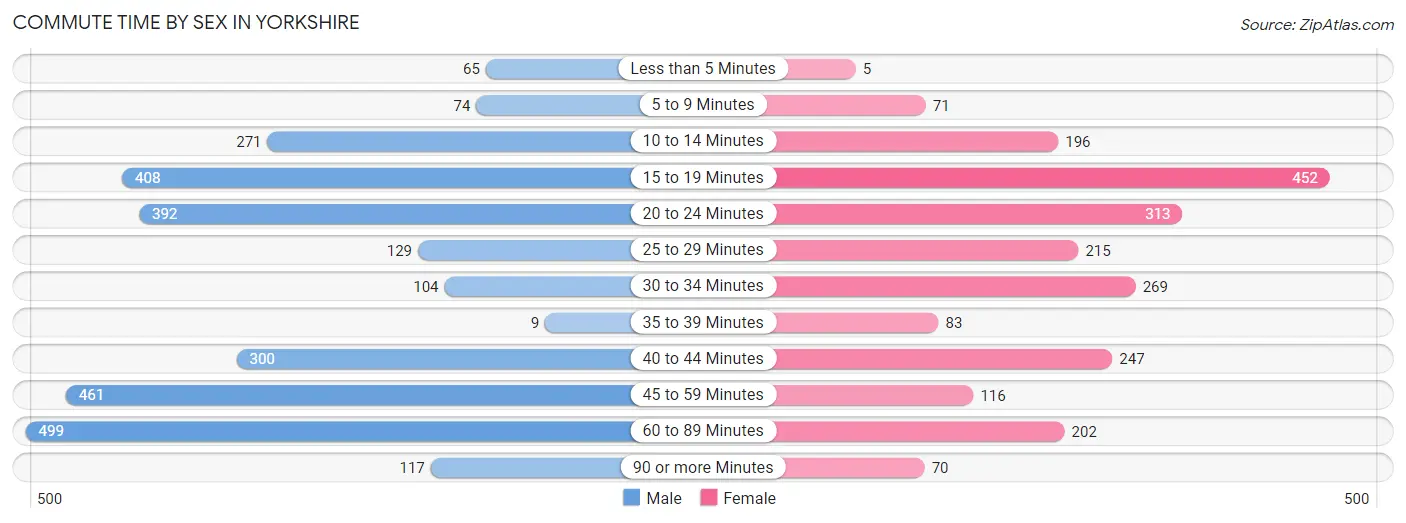
| Commute Time | Male | Female |
| Less than 5 Minutes | 65 (2.3%) | 5 (0.2%) |
| 5 to 9 Minutes | 74 (2.6%) | 71 (3.2%) |
| 10 to 14 Minutes | 271 (9.6%) | 196 (8.7%) |
| 15 to 19 Minutes | 408 (14.4%) | 452 (20.2%) |
| 20 to 24 Minutes | 392 (13.9%) | 313 (14.0%) |
| 25 to 29 Minutes | 129 (4.6%) | 215 (9.6%) |
| 30 to 34 Minutes | 104 (3.7%) | 269 (12.0%) |
| 35 to 39 Minutes | 9 (0.3%) | 83 (3.7%) |
| 40 to 44 Minutes | 300 (10.6%) | 247 (11.0%) |
| 45 to 59 Minutes | 461 (16.3%) | 116 (5.2%) |
| 60 to 89 Minutes | 499 (17.6%) | 202 (9.0%) |
| 90 or more Minutes | 117 (4.1%) | 70 (3.1%) |
Time of Departure to Work by Sex in Yorkshire
The most frequent times of departure to work in Yorkshire are 6:00 AM to 6:29 AM (567, 20.0%) for males and 7:30 AM to 7:59 AM (276, 12.3%) for females.
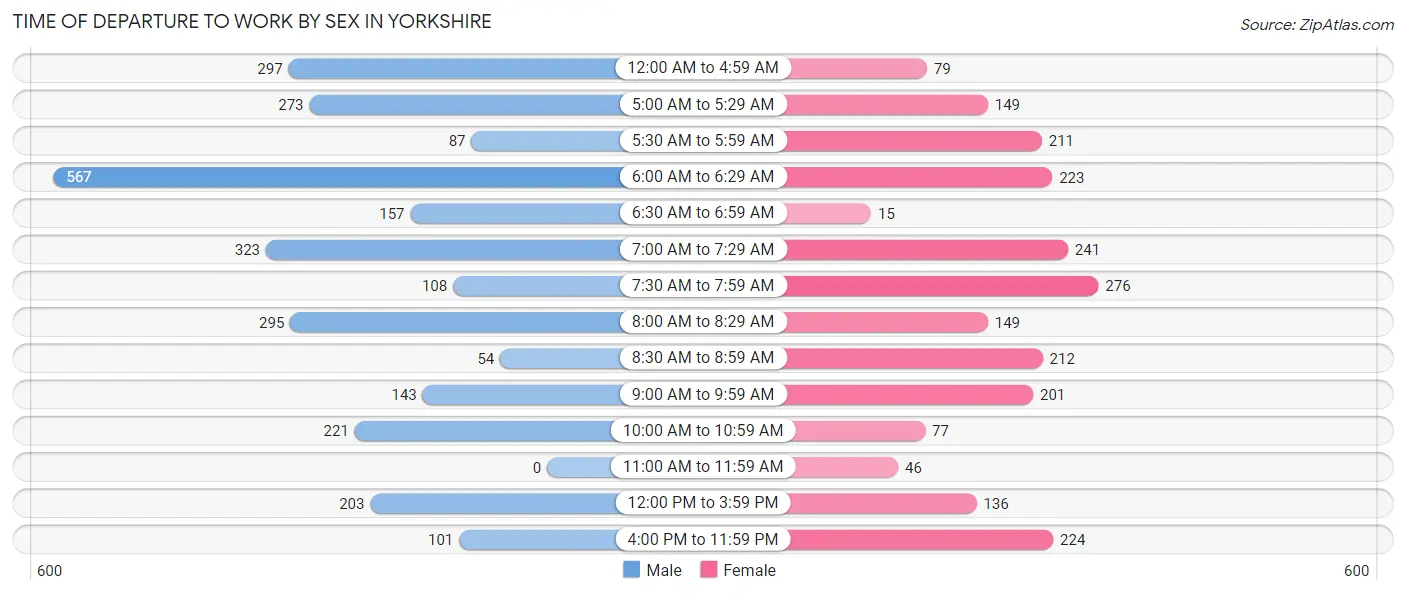
| Time of Departure | Male | Female |
| 12:00 AM to 4:59 AM | 297 (10.5%) | 79 (3.5%) |
| 5:00 AM to 5:29 AM | 273 (9.7%) | 149 (6.7%) |
| 5:30 AM to 5:59 AM | 87 (3.1%) | 211 (9.4%) |
| 6:00 AM to 6:29 AM | 567 (20.0%) | 223 (10.0%) |
| 6:30 AM to 6:59 AM | 157 (5.6%) | 15 (0.7%) |
| 7:00 AM to 7:29 AM | 323 (11.4%) | 241 (10.8%) |
| 7:30 AM to 7:59 AM | 108 (3.8%) | 276 (12.3%) |
| 8:00 AM to 8:29 AM | 295 (10.4%) | 149 (6.7%) |
| 8:30 AM to 8:59 AM | 54 (1.9%) | 212 (9.5%) |
| 9:00 AM to 9:59 AM | 143 (5.1%) | 201 (9.0%) |
| 10:00 AM to 10:59 AM | 221 (7.8%) | 77 (3.4%) |
| 11:00 AM to 11:59 AM | 0 (0.0%) | 46 (2.1%) |
| 12:00 PM to 3:59 PM | 203 (7.2%) | 136 (6.1%) |
| 4:00 PM to 11:59 PM | 101 (3.6%) | 224 (10.0%) |
| Total | 2,829 (100.0%) | 2,239 (100.0%) |
Housing Occupancy in Yorkshire
Occupancy by Ownership in Yorkshire
Of the total 3,008 dwellings in Yorkshire, owner-occupied units account for 1,491 (49.6%), while renter-occupied units make up 1,517 (50.4%).
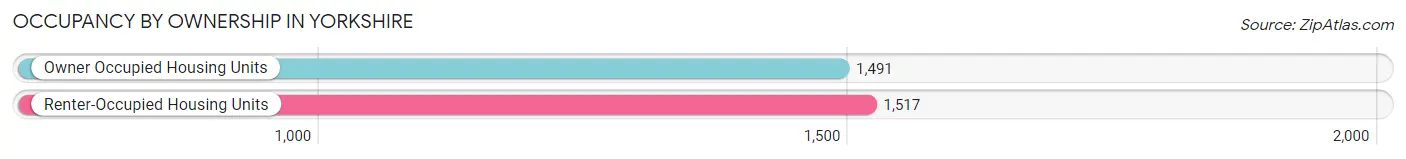
| Occupancy | # Housing Units | % Housing Units |
| Owner Occupied Housing Units | 1,491 | 49.6% |
| Renter-Occupied Housing Units | 1,517 | 50.4% |
| Total Occupied Housing Units | 3,008 | 100.0% |
Occupancy by Household Size in Yorkshire
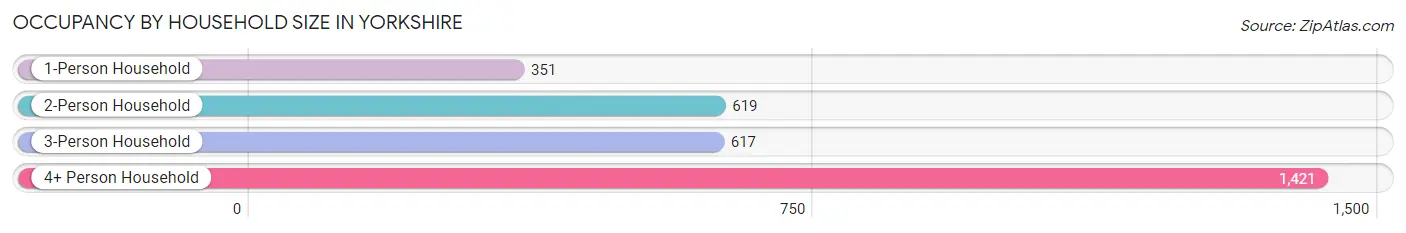
| Household Size | # Housing Units | % Housing Units |
| 1-Person Household | 351 | 11.7% |
| 2-Person Household | 619 | 20.6% |
| 3-Person Household | 617 | 20.5% |
| 4+ Person Household | 1,421 | 47.2% |
| Total Housing Units | 3,008 | 100.0% |
Occupancy by Ownership by Household Size in Yorkshire
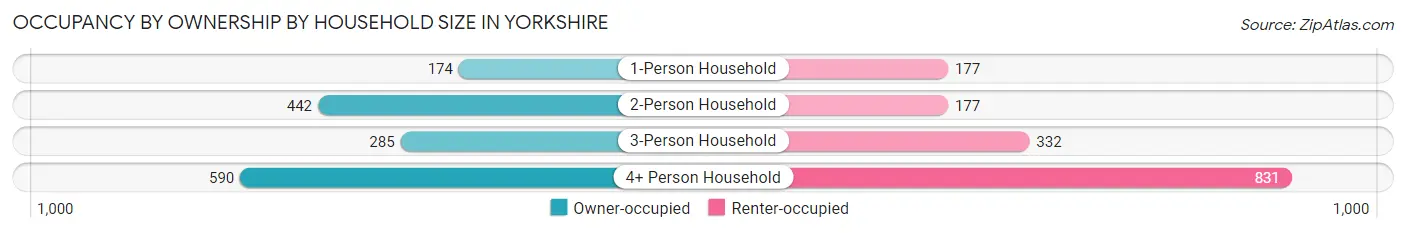
| Household Size | Owner-occupied | Renter-occupied |
| 1-Person Household | 174 (49.6%) | 177 (50.4%) |
| 2-Person Household | 442 (71.4%) | 177 (28.6%) |
| 3-Person Household | 285 (46.2%) | 332 (53.8%) |
| 4+ Person Household | 590 (41.5%) | 831 (58.5%) |
| Total Housing Units | 1,491 (49.6%) | 1,517 (50.4%) |
Occupancy by Educational Attainment in Yorkshire
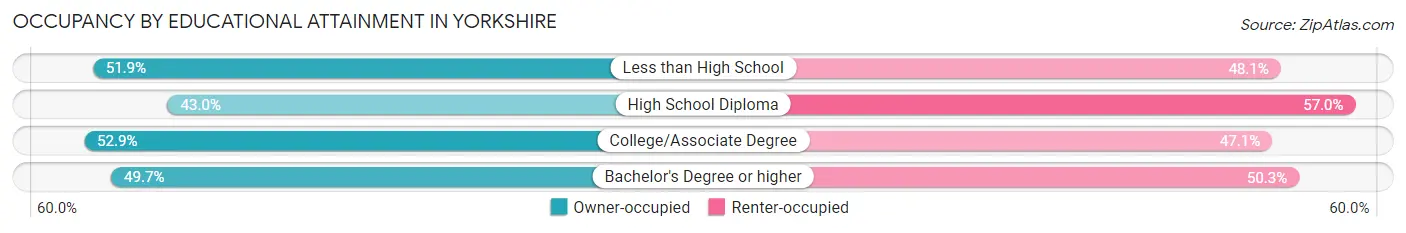
| Household Size | Owner-occupied | Renter-occupied |
| Less than High School | 386 (51.9%) | 358 (48.1%) |
| High School Diploma | 310 (43.0%) | 411 (57.0%) |
| College/Associate Degree | 463 (52.9%) | 412 (47.1%) |
| Bachelor's Degree or higher | 332 (49.7%) | 336 (50.3%) |
Occupancy by Age of Householder in Yorkshire
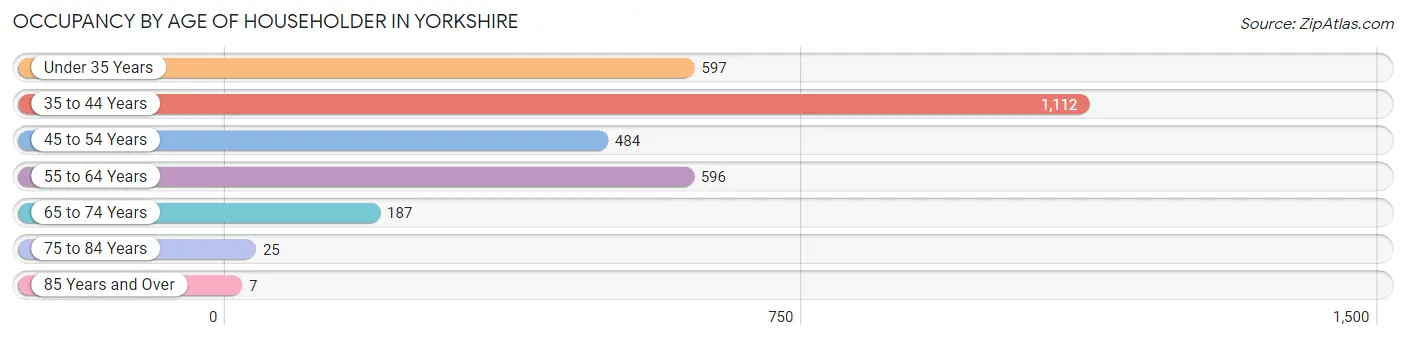
| Age Bracket | # Households | % Households |
| Under 35 Years | 597 | 19.9% |
| 35 to 44 Years | 1,112 | 37.0% |
| 45 to 54 Years | 484 | 16.1% |
| 55 to 64 Years | 596 | 19.8% |
| 65 to 74 Years | 187 | 6.2% |
| 75 to 84 Years | 25 | 0.8% |
| 85 Years and Over | 7 | 0.2% |
| Total | 3,008 | 100.0% |
Housing Finances in Yorkshire
Median Income by Occupancy in Yorkshire
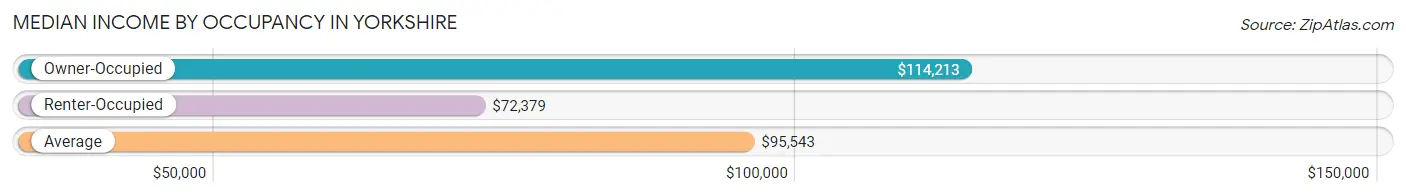
| Occupancy Type | # Households | Median Income |
| Owner-Occupied | 1,491 (49.6%) | $114,213 |
| Renter-Occupied | 1,517 (50.4%) | $72,379 |
| Average | 3,008 (100.0%) | $95,543 |
Occupancy by Householder Income Bracket in Yorkshire
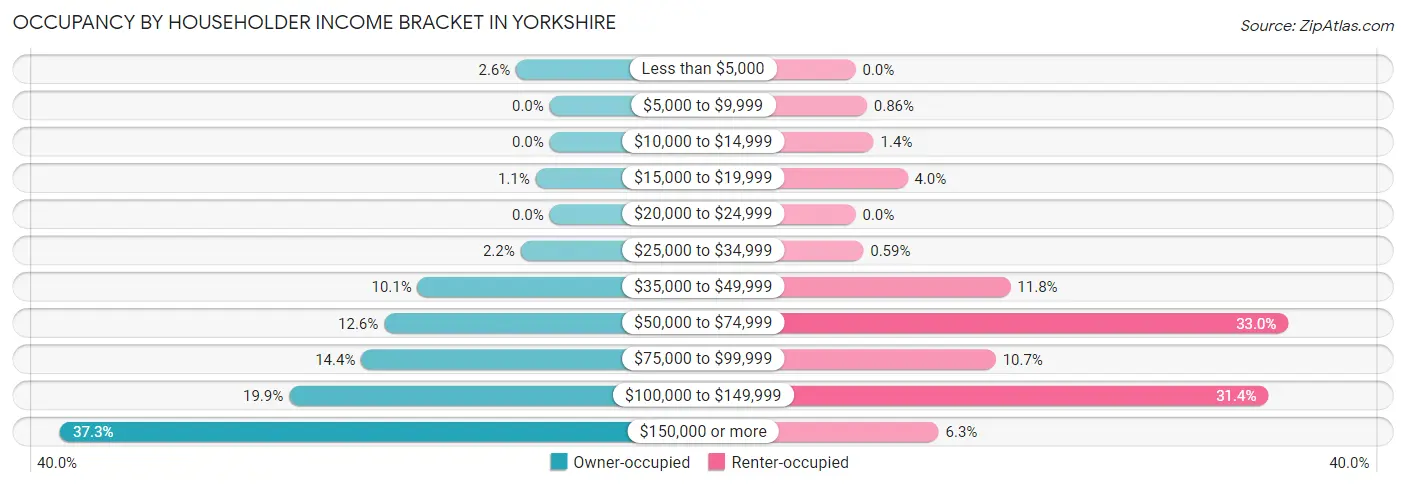
| Income Bracket | Owner-occupied | Renter-occupied |
| Less than $5,000 | 38 (2.5%) | 0 (0.0%) |
| $5,000 to $9,999 | 0 (0.0%) | 13 (0.9%) |
| $10,000 to $14,999 | 0 (0.0%) | 21 (1.4%) |
| $15,000 to $19,999 | 16 (1.1%) | 60 (4.0%) |
| $20,000 to $24,999 | 0 (0.0%) | 0 (0.0%) |
| $25,000 to $34,999 | 33 (2.2%) | 9 (0.6%) |
| $35,000 to $49,999 | 150 (10.1%) | 179 (11.8%) |
| $50,000 to $74,999 | 188 (12.6%) | 500 (33.0%) |
| $75,000 to $99,999 | 214 (14.3%) | 162 (10.7%) |
| $100,000 to $149,999 | 296 (19.9%) | 477 (31.4%) |
| $150,000 or more | 556 (37.3%) | 96 (6.3%) |
| Total | 1,491 (100.0%) | 1,517 (100.0%) |
Monthly Housing Cost Tiers in Yorkshire
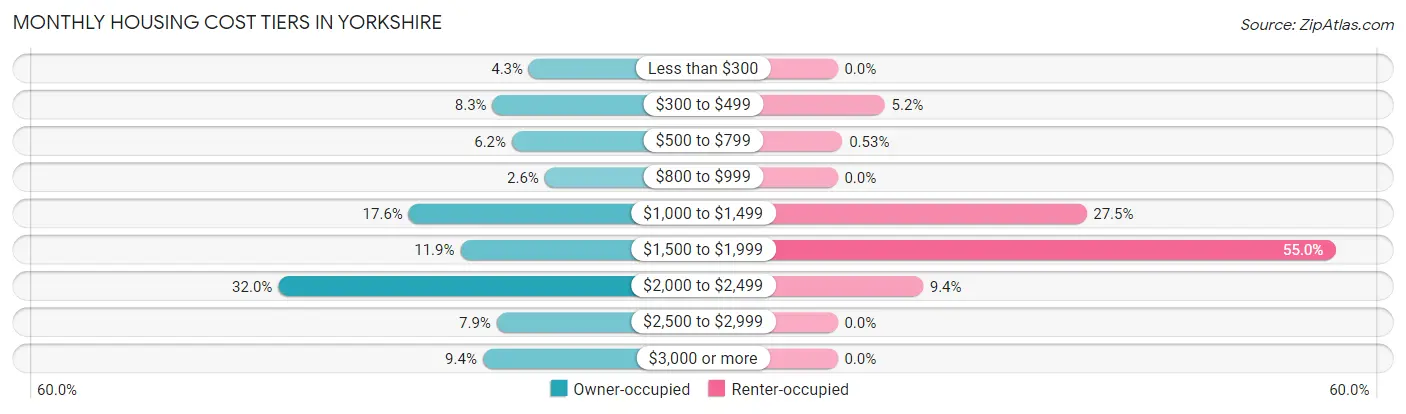
| Monthly Cost | Owner-occupied | Renter-occupied |
| Less than $300 | 64 (4.3%) | 0 (0.0%) |
| $300 to $499 | 124 (8.3%) | 79 (5.2%) |
| $500 to $799 | 92 (6.2%) | 8 (0.5%) |
| $800 to $999 | 38 (2.5%) | 0 (0.0%) |
| $1,000 to $1,499 | 262 (17.6%) | 417 (27.5%) |
| $1,500 to $1,999 | 177 (11.9%) | 834 (55.0%) |
| $2,000 to $2,499 | 477 (32.0%) | 143 (9.4%) |
| $2,500 to $2,999 | 117 (7.9%) | 0 (0.0%) |
| $3,000 or more | 140 (9.4%) | 0 (0.0%) |
| Total | 1,491 (100.0%) | 1,517 (100.0%) |
Physical Housing Characteristics in Yorkshire
Housing Structures in Yorkshire
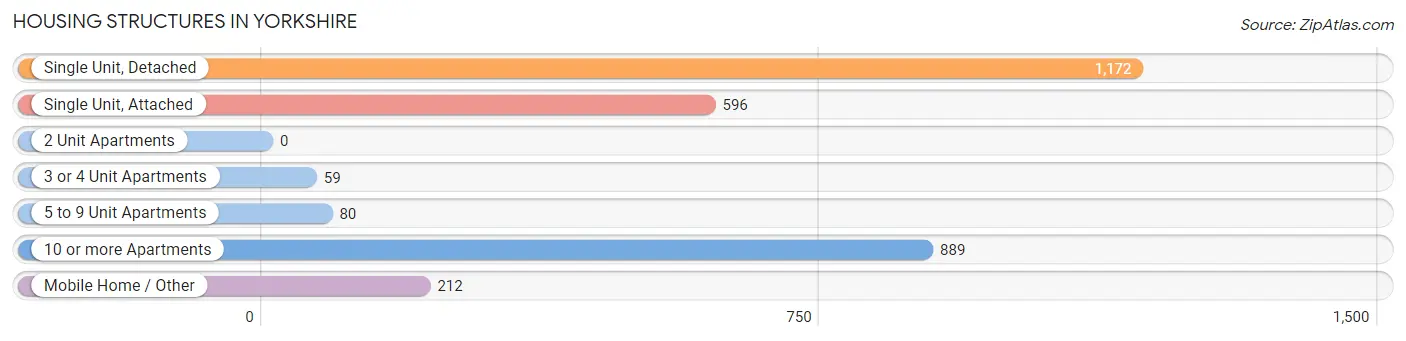
| Structure Type | # Housing Units | % Housing Units |
| Single Unit, Detached | 1,172 | 39.0% |
| Single Unit, Attached | 596 | 19.8% |
| 2 Unit Apartments | 0 | 0.0% |
| 3 or 4 Unit Apartments | 59 | 2.0% |
| 5 to 9 Unit Apartments | 80 | 2.7% |
| 10 or more Apartments | 889 | 29.5% |
| Mobile Home / Other | 212 | 7.0% |
| Total | 3,008 | 100.0% |
Housing Structures by Occupancy in Yorkshire
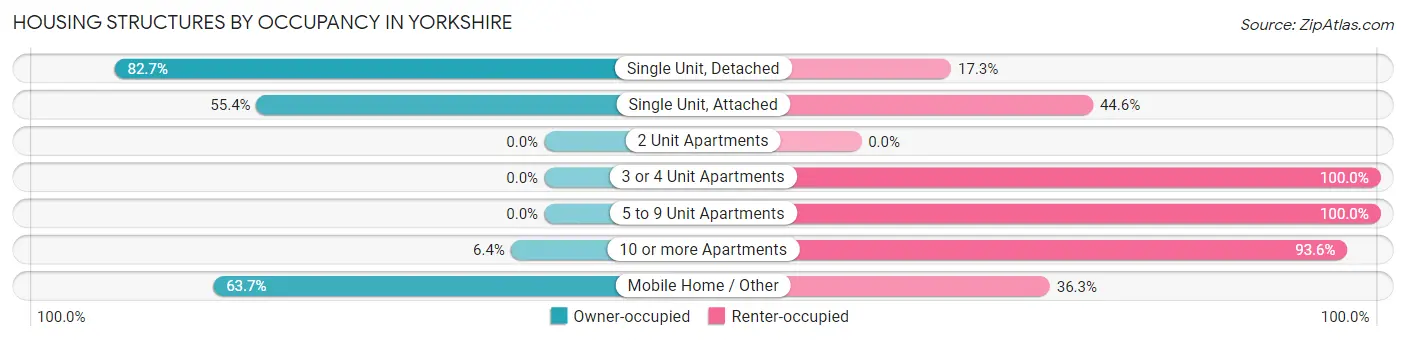
| Structure Type | Owner-occupied | Renter-occupied |
| Single Unit, Detached | 969 (82.7%) | 203 (17.3%) |
| Single Unit, Attached | 330 (55.4%) | 266 (44.6%) |
| 2 Unit Apartments | 0 (0.0%) | 0 (0.0%) |
| 3 or 4 Unit Apartments | 0 (0.0%) | 59 (100.0%) |
| 5 to 9 Unit Apartments | 0 (0.0%) | 80 (100.0%) |
| 10 or more Apartments | 57 (6.4%) | 832 (93.6%) |
| Mobile Home / Other | 135 (63.7%) | 77 (36.3%) |
| Total | 1,491 (49.6%) | 1,517 (50.4%) |
Housing Structures by Number of Rooms in Yorkshire
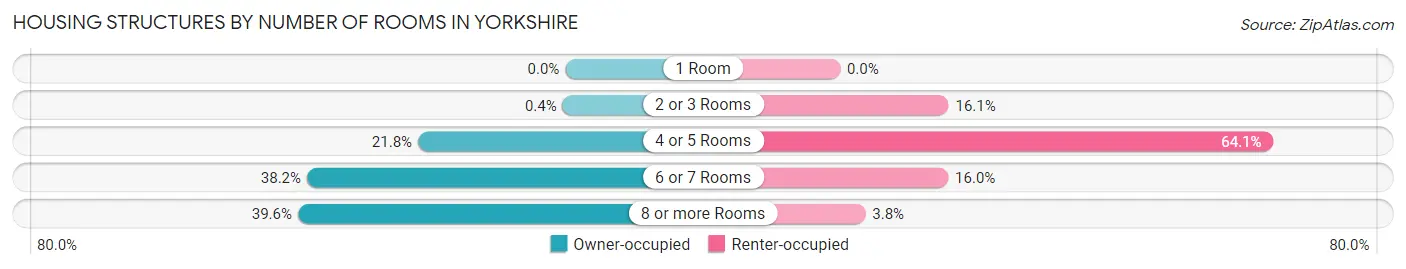
| Number of Rooms | Owner-occupied | Renter-occupied |
| 1 Room | 0 (0.0%) | 0 (0.0%) |
| 2 or 3 Rooms | 6 (0.4%) | 244 (16.1%) |
| 4 or 5 Rooms | 325 (21.8%) | 973 (64.1%) |
| 6 or 7 Rooms | 570 (38.2%) | 243 (16.0%) |
| 8 or more Rooms | 590 (39.6%) | 57 (3.8%) |
| Total | 1,491 (100.0%) | 1,517 (100.0%) |
Housing Structure by Heating Type in Yorkshire
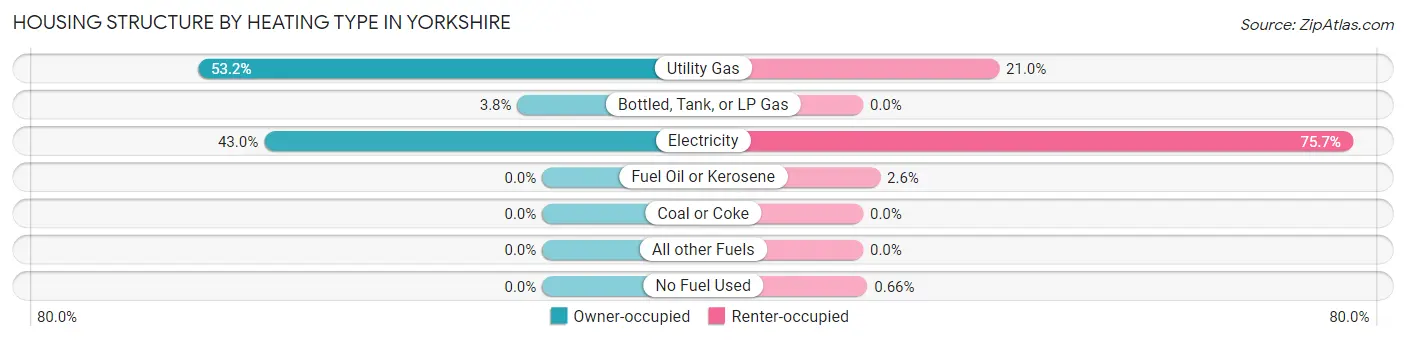
| Heating Type | Owner-occupied | Renter-occupied |
| Utility Gas | 793 (53.2%) | 319 (21.0%) |
| Bottled, Tank, or LP Gas | 57 (3.8%) | 0 (0.0%) |
| Electricity | 641 (43.0%) | 1,148 (75.7%) |
| Fuel Oil or Kerosene | 0 (0.0%) | 40 (2.6%) |
| Coal or Coke | 0 (0.0%) | 0 (0.0%) |
| All other Fuels | 0 (0.0%) | 0 (0.0%) |
| No Fuel Used | 0 (0.0%) | 10 (0.7%) |
| Total | 1,491 (100.0%) | 1,517 (100.0%) |
Household Vehicle Usage in Yorkshire
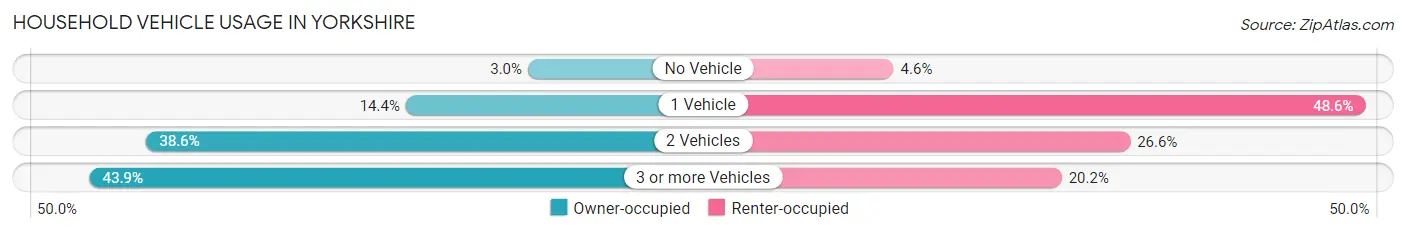
| Vehicles per Household | Owner-occupied | Renter-occupied |
| No Vehicle | 45 (3.0%) | 69 (4.5%) |
| 1 Vehicle | 215 (14.4%) | 737 (48.6%) |
| 2 Vehicles | 576 (38.6%) | 404 (26.6%) |
| 3 or more Vehicles | 655 (43.9%) | 307 (20.2%) |
| Total | 1,491 (100.0%) | 1,517 (100.0%) |
Real Estate & Mortgages in Yorkshire
Real Estate and Mortgage Overview in Yorkshire
| Characteristic | Without Mortgage | With Mortgage |
| Housing Units | 497 | 994 |
| Median Property Value | $386,500 | $427,200 |
| Median Household Income | $113,071 | $406 |
| Monthly Housing Costs | $651 | $140 |
| Real Estate Taxes | $4,773 | $62 |
Property Value by Mortgage Status in Yorkshire
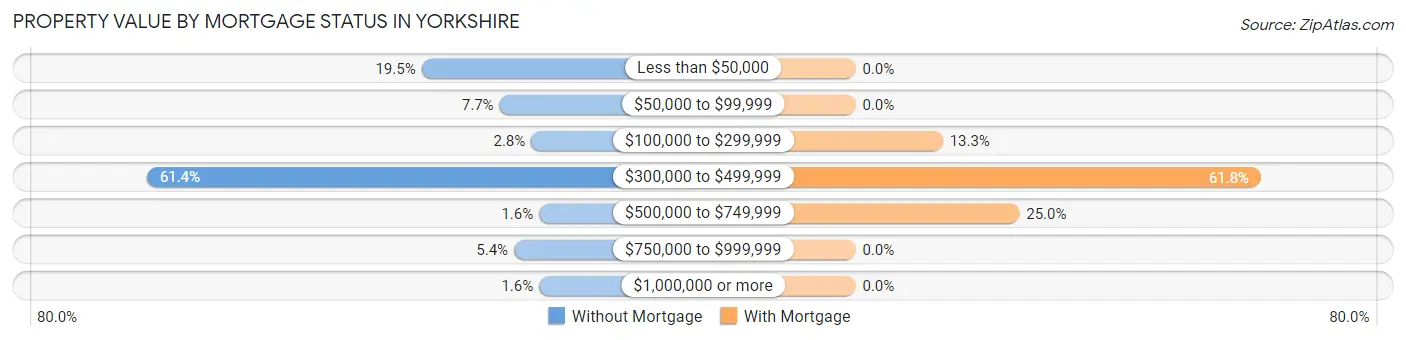
| Property Value | Without Mortgage | With Mortgage |
| Less than $50,000 | 97 (19.5%) | 0 (0.0%) |
| $50,000 to $99,999 | 38 (7.6%) | 0 (0.0%) |
| $100,000 to $299,999 | 14 (2.8%) | 132 (13.3%) |
| $300,000 to $499,999 | 305 (61.4%) | 614 (61.8%) |
| $500,000 to $749,999 | 8 (1.6%) | 248 (24.9%) |
| $750,000 to $999,999 | 27 (5.4%) | 0 (0.0%) |
| $1,000,000 or more | 8 (1.6%) | 0 (0.0%) |
| Total | 497 (100.0%) | 994 (100.0%) |
Household Income by Mortgage Status in Yorkshire
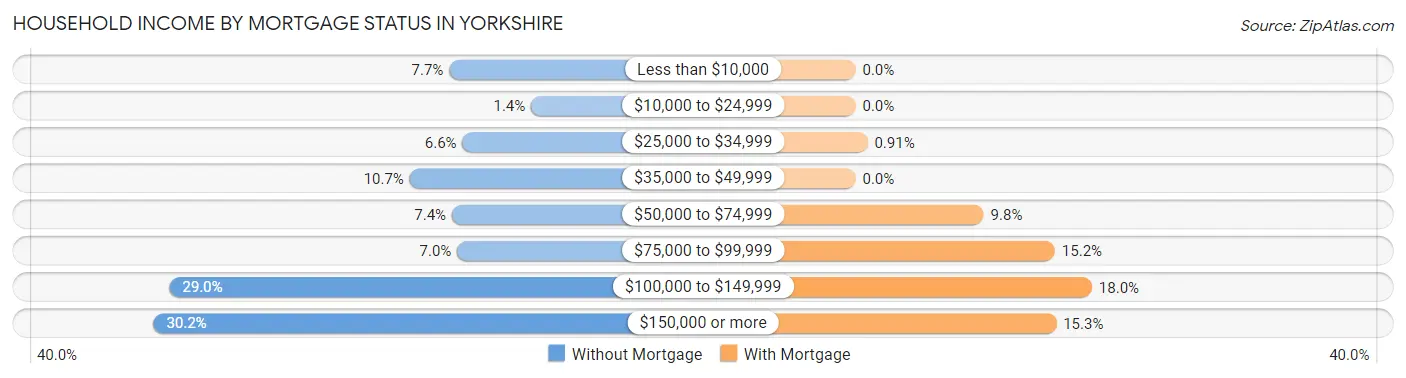
| Household Income | Without Mortgage | With Mortgage |
| Less than $10,000 | 38 (7.6%) | 0 (0.0%) |
| $10,000 to $24,999 | 7 (1.4%) | 0 (0.0%) |
| $25,000 to $34,999 | 33 (6.6%) | 9 (0.9%) |
| $35,000 to $49,999 | 53 (10.7%) | 0 (0.0%) |
| $50,000 to $74,999 | 37 (7.4%) | 97 (9.8%) |
| $75,000 to $99,999 | 35 (7.0%) | 151 (15.2%) |
| $100,000 to $149,999 | 144 (29.0%) | 179 (18.0%) |
| $150,000 or more | 150 (30.2%) | 152 (15.3%) |
| Total | 497 (100.0%) | 994 (100.0%) |
Property Value to Household Income Ratio in Yorkshire
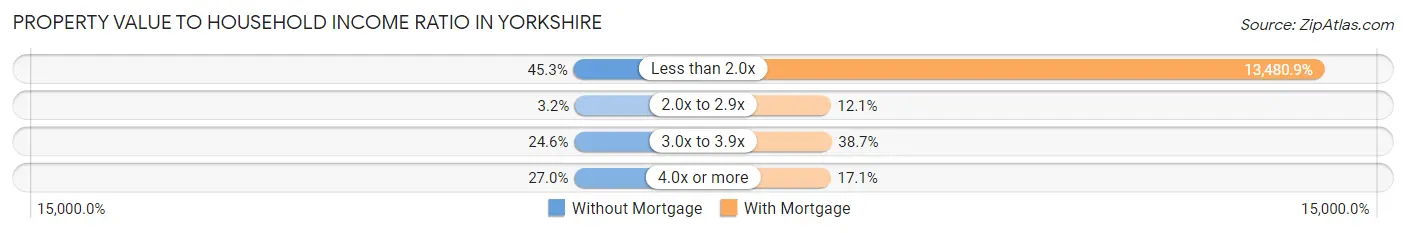
| Value-to-Income Ratio | Without Mortgage | With Mortgage |
| Less than 2.0x | 225 (45.3%) | 134,000 (13,480.9%) |
| 2.0x to 2.9x | 16 (3.2%) | 120 (12.1%) |
| 3.0x to 3.9x | 122 (24.5%) | 385 (38.7%) |
| 4.0x or more | 134 (27.0%) | 170 (17.1%) |
| Total | 497 (100.0%) | 994 (100.0%) |
Real Estate Taxes by Mortgage Status in Yorkshire
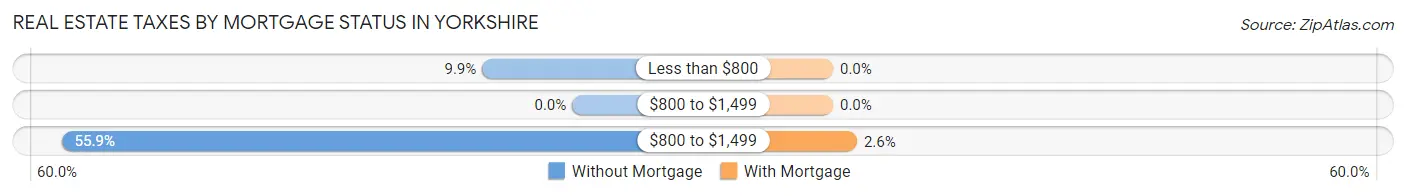
| Property Taxes | Without Mortgage | With Mortgage |
| Less than $800 | 49 (9.9%) | 0 (0.0%) |
| $800 to $1,499 | 0 (0.0%) | 0 (0.0%) |
| $800 to $1,499 | 278 (55.9%) | 26 (2.6%) |
| Total | 497 (100.0%) | 994 (100.0%) |
Health & Disability in Yorkshire
Health Insurance Coverage by Age in Yorkshire
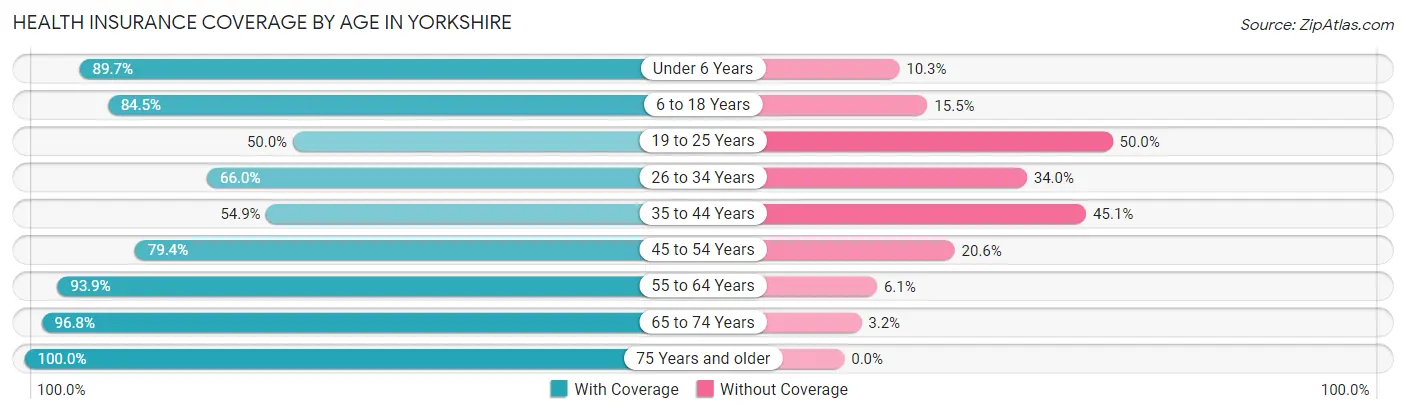
| Age Bracket | With Coverage | Without Coverage |
| Under 6 Years | 980 (89.7%) | 112 (10.3%) |
| 6 to 18 Years | 1,946 (84.5%) | 357 (15.5%) |
| 19 to 25 Years | 622 (50.0%) | 623 (50.0%) |
| 26 to 34 Years | 818 (66.0%) | 422 (34.0%) |
| 35 to 44 Years | 1,110 (54.9%) | 912 (45.1%) |
| 45 to 54 Years | 730 (79.4%) | 189 (20.6%) |
| 55 to 64 Years | 955 (93.9%) | 62 (6.1%) |
| 65 to 74 Years | 548 (96.8%) | 18 (3.2%) |
| 75 Years and older | 78 (100.0%) | 0 (0.0%) |
| Total | 7,787 (74.3%) | 2,695 (25.7%) |
Health Insurance Coverage by Citizenship Status in Yorkshire
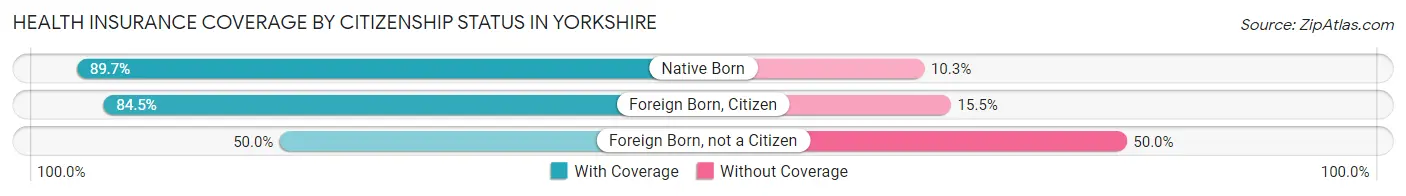
| Citizenship Status | With Coverage | Without Coverage |
| Native Born | 980 (89.7%) | 112 (10.3%) |
| Foreign Born, Citizen | 1,946 (84.5%) | 357 (15.5%) |
| Foreign Born, not a Citizen | 622 (50.0%) | 623 (50.0%) |
Health Insurance Coverage by Household Income in Yorkshire
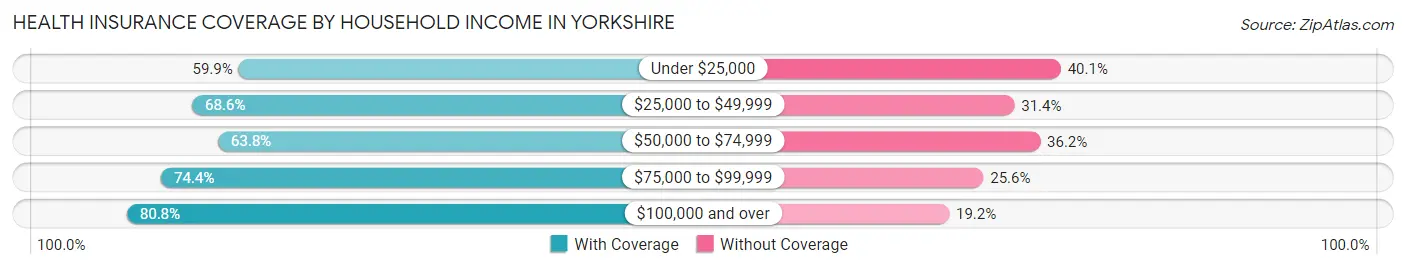
| Household Income | With Coverage | Without Coverage |
| Under $25,000 | 287 (59.9%) | 192 (40.1%) |
| $25,000 to $49,999 | 796 (68.6%) | 364 (31.4%) |
| $50,000 to $74,999 | 1,303 (63.8%) | 740 (36.2%) |
| $75,000 to $99,999 | 1,112 (74.4%) | 382 (25.6%) |
| $100,000 and over | 4,282 (80.8%) | 1,015 (19.2%) |
Public vs Private Health Insurance Coverage by Age in Yorkshire
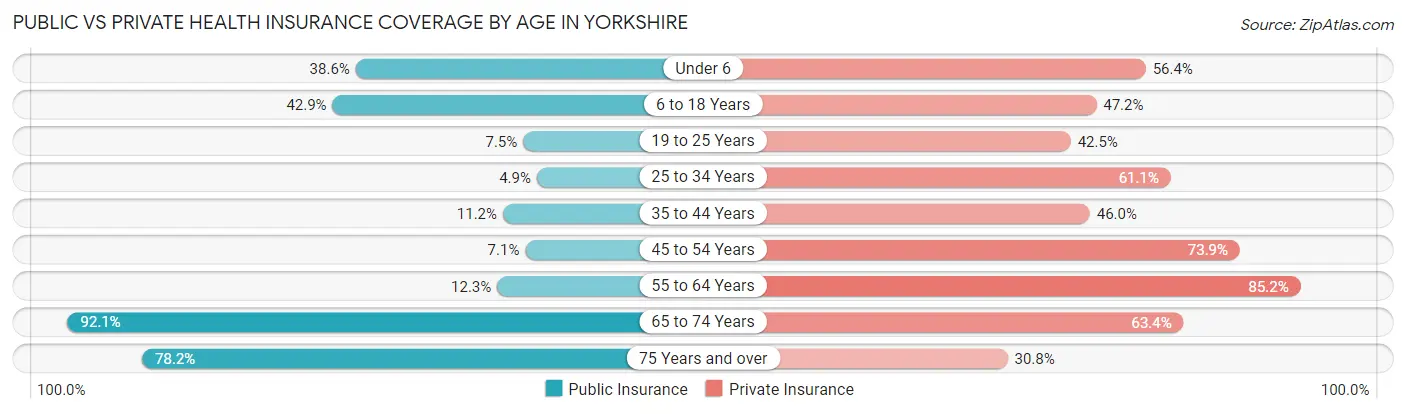
| Age Bracket | Public Insurance | Private Insurance |
| Under 6 | 421 (38.6%) | 616 (56.4%) |
| 6 to 18 Years | 987 (42.9%) | 1,088 (47.2%) |
| 19 to 25 Years | 93 (7.5%) | 529 (42.5%) |
| 25 to 34 Years | 61 (4.9%) | 757 (61.1%) |
| 35 to 44 Years | 227 (11.2%) | 931 (46.0%) |
| 45 to 54 Years | 65 (7.1%) | 679 (73.9%) |
| 55 to 64 Years | 125 (12.3%) | 866 (85.2%) |
| 65 to 74 Years | 521 (92.0%) | 359 (63.4%) |
| 75 Years and over | 61 (78.2%) | 24 (30.8%) |
| Total | 2,561 (24.4%) | 5,849 (55.8%) |
Disability Status by Sex by Age in Yorkshire
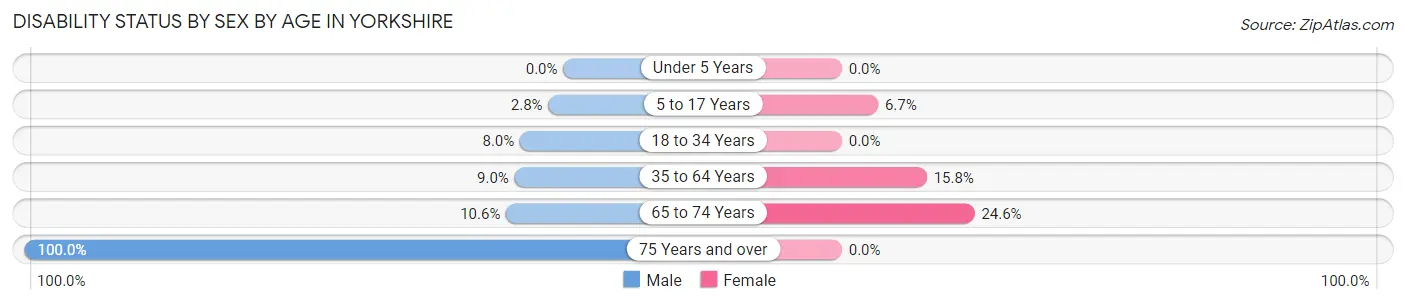
| Age Bracket | Male | Female |
| Under 5 Years | 0 (0.0%) | 0 (0.0%) |
| 5 to 17 Years | 35 (2.8%) | 72 (6.7%) |
| 18 to 34 Years | 82 (8.0%) | 0 (0.0%) |
| 35 to 64 Years | 215 (9.0%) | 249 (15.8%) |
| 65 to 74 Years | 32 (10.6%) | 65 (24.6%) |
| 75 Years and over | 24 (100.0%) | 0 (0.0%) |
Disability Class by Sex by Age in Yorkshire
Disability Class: Hearing Difficulty
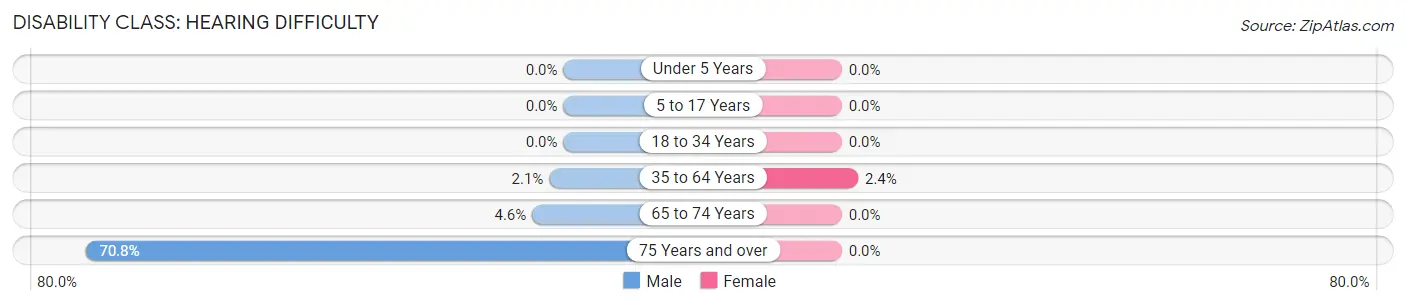
| Age Bracket | Male | Female |
| Under 5 Years | 0 (0.0%) | 0 (0.0%) |
| 5 to 17 Years | 0 (0.0%) | 0 (0.0%) |
| 18 to 34 Years | 0 (0.0%) | 0 (0.0%) |
| 35 to 64 Years | 50 (2.1%) | 38 (2.4%) |
| 65 to 74 Years | 14 (4.6%) | 0 (0.0%) |
| 75 Years and over | 17 (70.8%) | 0 (0.0%) |
Disability Class: Vision Difficulty
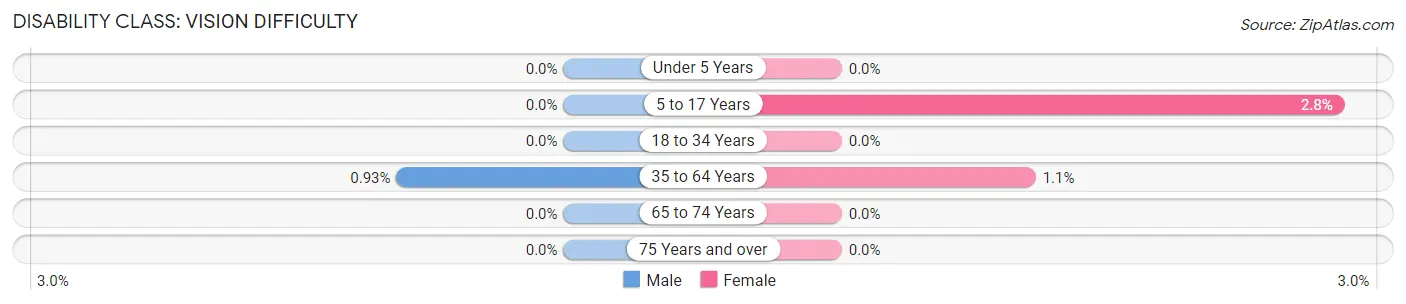
| Age Bracket | Male | Female |
| Under 5 Years | 0 (0.0%) | 0 (0.0%) |
| 5 to 17 Years | 0 (0.0%) | 30 (2.8%) |
| 18 to 34 Years | 0 (0.0%) | 0 (0.0%) |
| 35 to 64 Years | 22 (0.9%) | 17 (1.1%) |
| 65 to 74 Years | 0 (0.0%) | 0 (0.0%) |
| 75 Years and over | 0 (0.0%) | 0 (0.0%) |
Disability Class: Cognitive Difficulty
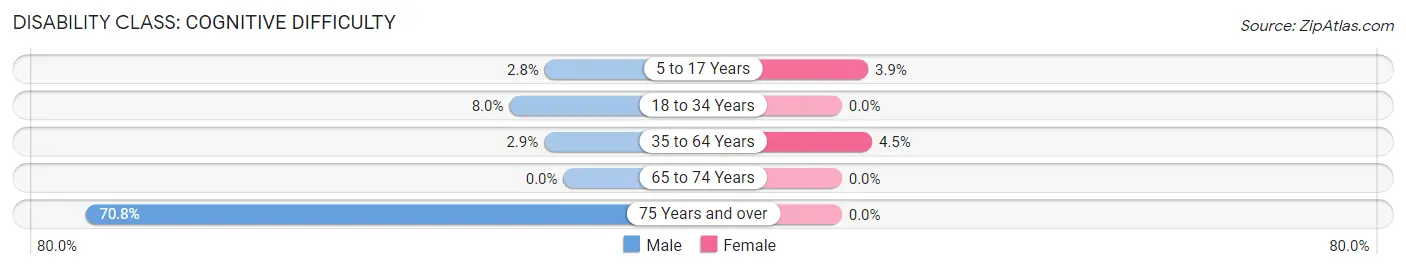
| Age Bracket | Male | Female |
| 5 to 17 Years | 35 (2.8%) | 42 (3.9%) |
| 18 to 34 Years | 82 (8.0%) | 0 (0.0%) |
| 35 to 64 Years | 68 (2.9%) | 71 (4.5%) |
| 65 to 74 Years | 0 (0.0%) | 0 (0.0%) |
| 75 Years and over | 17 (70.8%) | 0 (0.0%) |
Disability Class: Ambulatory Difficulty
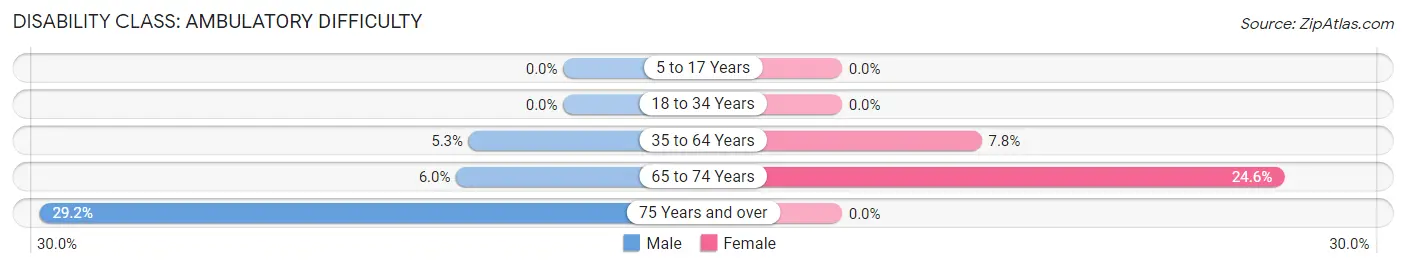
| Age Bracket | Male | Female |
| 5 to 17 Years | 0 (0.0%) | 0 (0.0%) |
| 18 to 34 Years | 0 (0.0%) | 0 (0.0%) |
| 35 to 64 Years | 125 (5.3%) | 123 (7.8%) |
| 65 to 74 Years | 18 (6.0%) | 65 (24.6%) |
| 75 Years and over | 7 (29.2%) | 0 (0.0%) |
Disability Class: Self-Care Difficulty
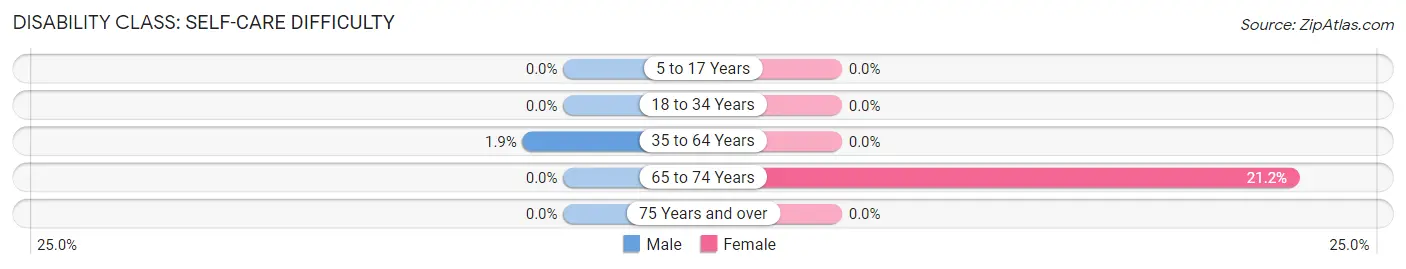
| Age Bracket | Male | Female |
| 5 to 17 Years | 0 (0.0%) | 0 (0.0%) |
| 18 to 34 Years | 0 (0.0%) | 0 (0.0%) |
| 35 to 64 Years | 45 (1.9%) | 0 (0.0%) |
| 65 to 74 Years | 0 (0.0%) | 56 (21.2%) |
| 75 Years and over | 0 (0.0%) | 0 (0.0%) |
Technology Access in Yorkshire
Computing Device Access in Yorkshire
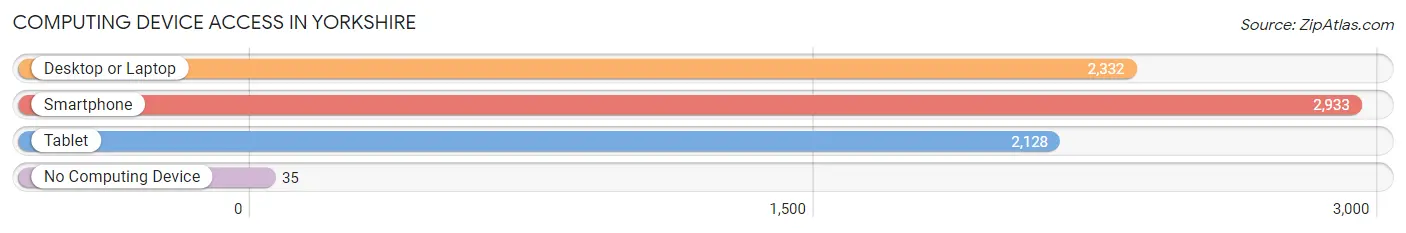
| Device Type | # Households | % Households |
| Desktop or Laptop | 2,332 | 77.5% |
| Smartphone | 2,933 | 97.5% |
| Tablet | 2,128 | 70.7% |
| No Computing Device | 35 | 1.2% |
| Total | 3,008 | 100.0% |
Internet Access in Yorkshire
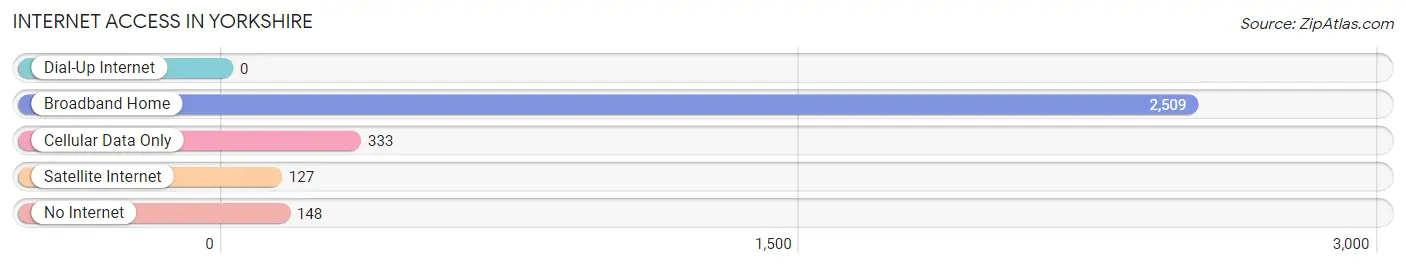
| Internet Type | # Households | % Households |
| Dial-Up Internet | 0 | 0.0% |
| Broadband Home | 2,509 | 83.4% |
| Cellular Data Only | 333 | 11.1% |
| Satellite Internet | 127 | 4.2% |
| No Internet | 148 | 4.9% |
| Total | 3,008 | 100.0% |
Yorkshire Summary
Yorkshire is a small town located in the state of Virginia, United States. It is situated in the northern part of the state, in the Shenandoah Valley region. The town is located in the county of Augusta, and is part of the Staunton-Waynesboro Metropolitan Statistical Area. The population of Yorkshire was estimated to be 1,845 in the year 2020.
History
Yorkshire was first settled in the late 1700s by German immigrants. The town was originally known as “New Germany” and was later renamed Yorkshire in 1820. The town was incorporated in 1836 and was named after the English county of Yorkshire.
The town was an important stop on the Valley Turnpike, which connected Staunton to Winchester. The turnpike was a major transportation route for goods and people in the region. The town was also a stop on the Chesapeake and Ohio Railway, which ran from Richmond to Clifton Forge.
Geography
Yorkshire is located in the northern part of the state of Virginia, in the Shenandoah Valley region. The town is situated in the county of Augusta, and is part of the Staunton-Waynesboro Metropolitan Statistical Area. The town is located at the intersection of US Route 11 and US Route 340.
The town is situated in a valley surrounded by the Blue Ridge Mountains to the east and the Allegheny Mountains to the west. The town is located at an elevation of 1,845 feet above sea level. The climate in Yorkshire is humid subtropical, with hot summers and cold winters.
Economy
Yorkshire’s economy is largely based on agriculture and tourism. The town is home to several farms, which produce a variety of crops, including corn, wheat, soybeans, and hay. The town is also home to several wineries, which produce a variety of wines.
The town is also home to several small businesses, including restaurants, shops, and other services. The town is also home to several manufacturing companies, which produce a variety of products, including furniture, clothing, and electronics.
Demographics
As of the 2020 census, the population of Yorkshire was estimated to be 1,845. The racial makeup of the town was 94.3% White, 2.2% African American, 0.3% Native American, 0.7% Asian, 0.1% Pacific Islander, and 2.4% from other races. The median household income in Yorkshire was estimated to be $45,945 in 2020. The median age of the population was estimated to be 43.7 years.
Conclusion
Yorkshire is a small town located in the state of Virginia, United States. It is situated in the northern part of the state, in the Shenandoah Valley region. The town was first settled in the late 1700s by German immigrants and was later renamed Yorkshire in 1820. The town is largely based on agriculture and tourism, and is home to several farms, wineries, and small businesses. The population of Yorkshire was estimated to be 1,845 in the year 2020.
Common Questions
What is Per Capita Income in Yorkshire?
Per Capita income in Yorkshire is $33,398.
What is the Median Family Income in Yorkshire?
Median Family Income in Yorkshire is $93,542.
What is the Median Household income in Yorkshire?
Median Household Income in Yorkshire is $95,543.
What is Income or Wage Gap in Yorkshire?
Income or Wage Gap in Yorkshire is 37.1%.
Women in Yorkshire earn 62.9 cents for every dollar earned by a man.
What is Inequality or Gini Index in Yorkshire?
Inequality or Gini Index in Yorkshire is 0.36.
What is the Total Population of Yorkshire?
Total Population of Yorkshire is 10,563.
What is the Total Male Population of Yorkshire?
Total Male Population of Yorkshire is 5,422.
What is the Total Female Population of Yorkshire?
Total Female Population of Yorkshire is 5,141.
What is the Ratio of Males per 100 Females in Yorkshire?
There are 105.47 Males per 100 Females in Yorkshire.
What is the Ratio of Females per 100 Males in Yorkshire?
There are 94.82 Females per 100 Males in Yorkshire.
What is the Median Population Age in Yorkshire?
Median Population Age in Yorkshire is 28.7 Years.
What is the Average Family Size in Yorkshire
Average Family Size in Yorkshire is 3.7 People.
What is the Average Household Size in Yorkshire
Average Household Size in Yorkshire is 3.5 People.
How Large is the Labor Force in Yorkshire?
There are 5,774 People in the Labor Forcein in Yorkshire.
What is the Percentage of People in the Labor Force in Yorkshire?
75.9% of People are in the Labor Force in Yorkshire.
What is the Unemployment Rate in Yorkshire?
Unemployment Rate in Yorkshire is 3.4%.