Herndon, VA Map & Demographics
Herndon Map
Herndon Overview
$55,686
PER CAPITA INCOME
$155,901
AVG FAMILY INCOME
$133,403
AVG HOUSEHOLD INCOME
32.0%
WAGE / INCOME GAP [ % ]
68.0¢/ $1
WAGE / INCOME GAP [ $ ]
0.39
INEQUALITY / GINI INDEX
24,456
TOTAL POPULATION
12,996
MALE POPULATION
11,460
FEMALE POPULATION
113.40
MALES / 100 FEMALES
88.18
FEMALES / 100 MALES
35.5
MEDIAN AGE
3.5
AVG FAMILY SIZE
3.1
AVG HOUSEHOLD SIZE
15,189
LABOR FORCE [ PEOPLE ]
79.2%
PERCENT IN LABOR FORCE
2.7%
UNEMPLOYMENT RATE
Income in Herndon
Income Overview in Herndon
Per Capita Income in Herndon is $55,686, while median incomes of families and households are $155,901 and $133,403 respectively.
| Characteristic | Number | Measure |
| Per Capita Income | 24,456 | $55,686 |
| Median Family Income | 5,685 | $155,901 |
| Mean Family Income | 5,685 | $182,258 |
| Median Household Income | 7,897 | $133,403 |
| Mean Household Income | 7,897 | $168,416 |
| Income Deficit | 5,685 | $0 |
| Wage / Income Gap (%) | 24,456 | 32.04% |
| Wage / Income Gap ($) | 24,456 | 67.96¢ per $1 |
| Gini / Inequality Index | 24,456 | 0.39 |
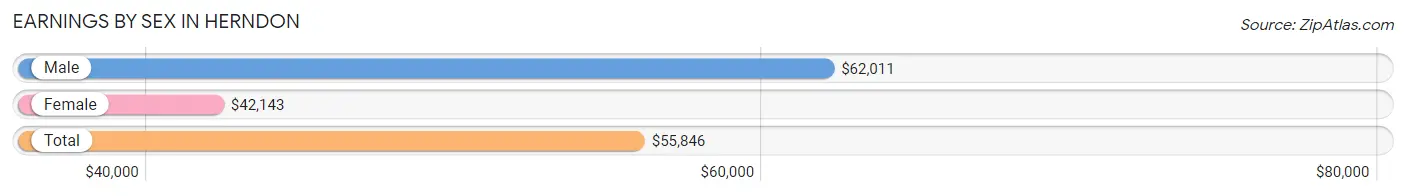
Earnings by Sex in Herndon
Average Earnings in Herndon are $55,846, $62,011 for men and $42,143 for women, a difference of 32.0%.
| Sex | Number | Average Earnings |
| Male | 8,856 (57.6%) | $62,011 |
| Female | 6,532 (42.4%) | $42,143 |
| Total | 15,388 (100.0%) | $55,846 |
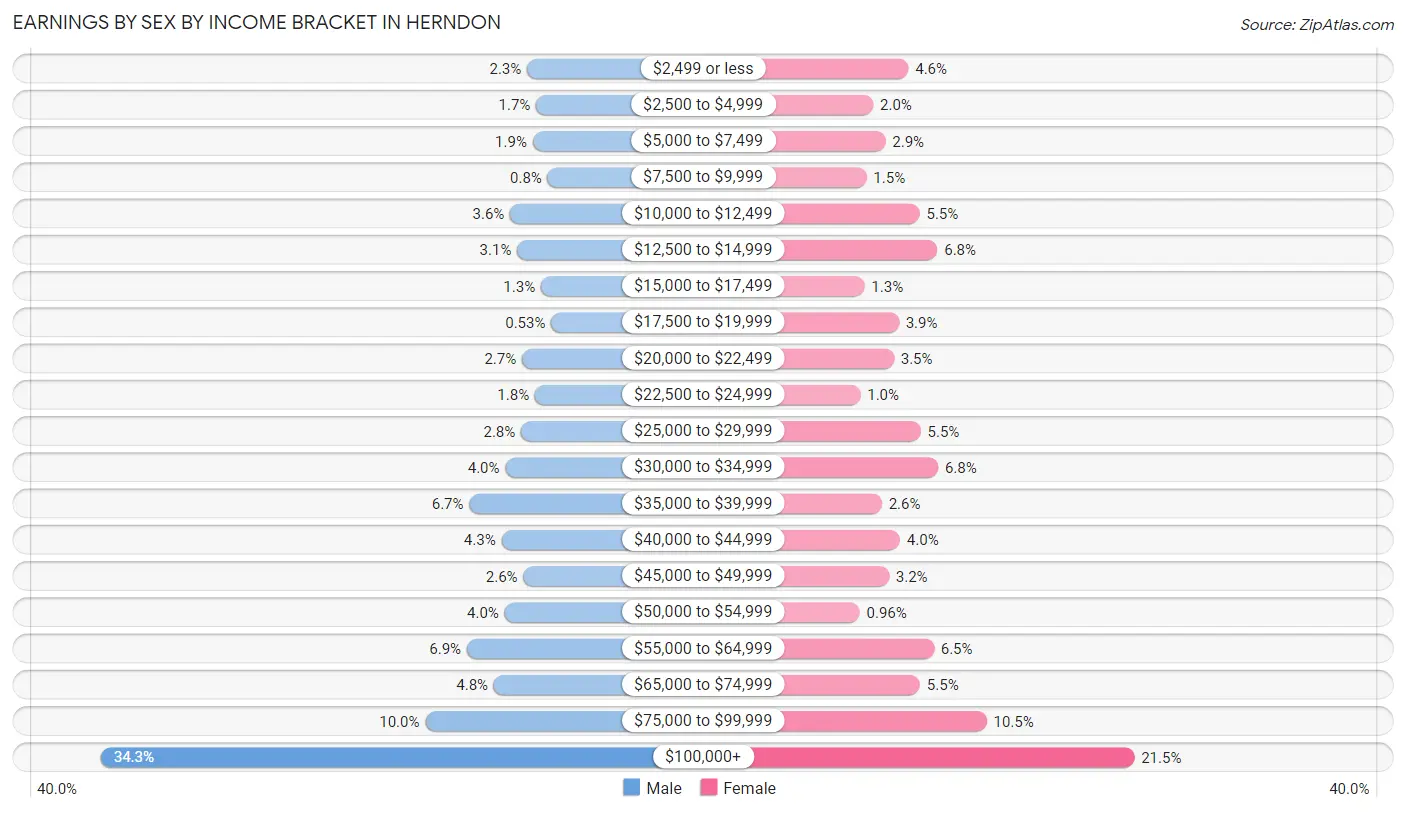
Earnings by Sex by Income Bracket in Herndon
The most common earnings brackets in Herndon are $100,000+ for men (3,037 | 34.3%) and $100,000+ for women (1,407 | 21.5%).
| Income | Male | Female |
| $2,499 or less | 207 (2.3%) | 301 (4.6%) |
| $2,500 to $4,999 | 147 (1.7%) | 129 (2.0%) |
| $5,000 to $7,499 | 170 (1.9%) | 189 (2.9%) |
| $7,500 to $9,999 | 71 (0.8%) | 96 (1.5%) |
| $10,000 to $12,499 | 320 (3.6%) | 356 (5.4%) |
| $12,500 to $14,999 | 273 (3.1%) | 443 (6.8%) |
| $15,000 to $17,499 | 115 (1.3%) | 86 (1.3%) |
| $17,500 to $19,999 | 47 (0.5%) | 254 (3.9%) |
| $20,000 to $22,499 | 241 (2.7%) | 230 (3.5%) |
| $22,500 to $24,999 | 155 (1.8%) | 66 (1.0%) |
| $25,000 to $29,999 | 247 (2.8%) | 361 (5.5%) |
| $30,000 to $34,999 | 352 (4.0%) | 446 (6.8%) |
| $35,000 to $39,999 | 591 (6.7%) | 171 (2.6%) |
| $40,000 to $44,999 | 377 (4.3%) | 260 (4.0%) |
| $45,000 to $49,999 | 232 (2.6%) | 206 (3.2%) |
| $50,000 to $54,999 | 356 (4.0%) | 63 (1.0%) |
| $55,000 to $64,999 | 607 (6.9%) | 426 (6.5%) |
| $65,000 to $74,999 | 428 (4.8%) | 358 (5.5%) |
| $75,000 to $99,999 | 883 (10.0%) | 684 (10.5%) |
| $100,000+ | 3,037 (34.3%) | 1,407 (21.5%) |
| Total | 8,856 (100.0%) | 6,532 (100.0%) |
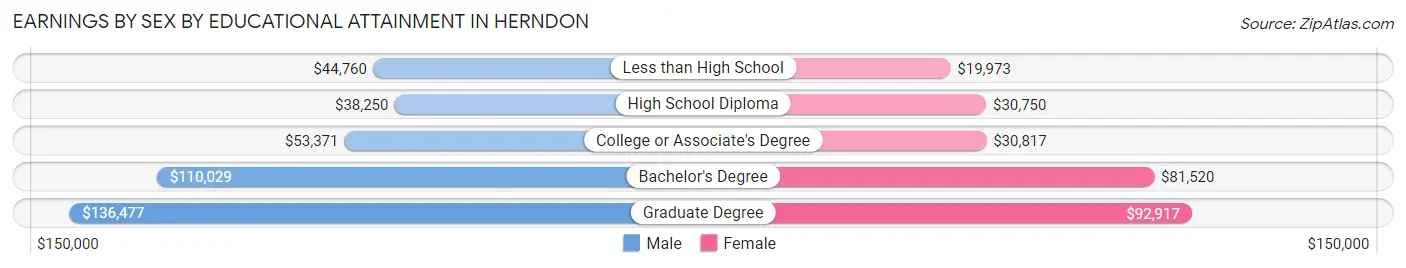
Earnings by Sex by Educational Attainment in Herndon
Average earnings in Herndon are $73,138 for men and $56,407 for women, a difference of 22.9%. Men with an educational attainment of graduate degree enjoy the highest average annual earnings of $136,477, while those with high school diploma education earn the least with $38,250. Women with an educational attainment of graduate degree earn the most with the average annual earnings of $92,917, while those with less than high school education have the smallest earnings of $19,973.
| Educational Attainment | Male Income | Female Income |
| Less than High School | $44,760 | $19,973 |
| High School Diploma | $38,250 | $30,750 |
| College or Associate's Degree | $53,371 | $30,817 |
| Bachelor's Degree | $110,029 | $81,520 |
| Graduate Degree | $136,477 | $92,917 |
| Total | $73,138 | $56,407 |
Family Income in Herndon
Family Income Brackets in Herndon
According to the Herndon family income data, there are 2,206 families falling into the $200,000+ income range, which is the most common income bracket and makes up 38.8% of all families. Conversely, the $10,000 to $14,999 income bracket is the least frequent group with only 40 families (0.7%) belonging to this category.
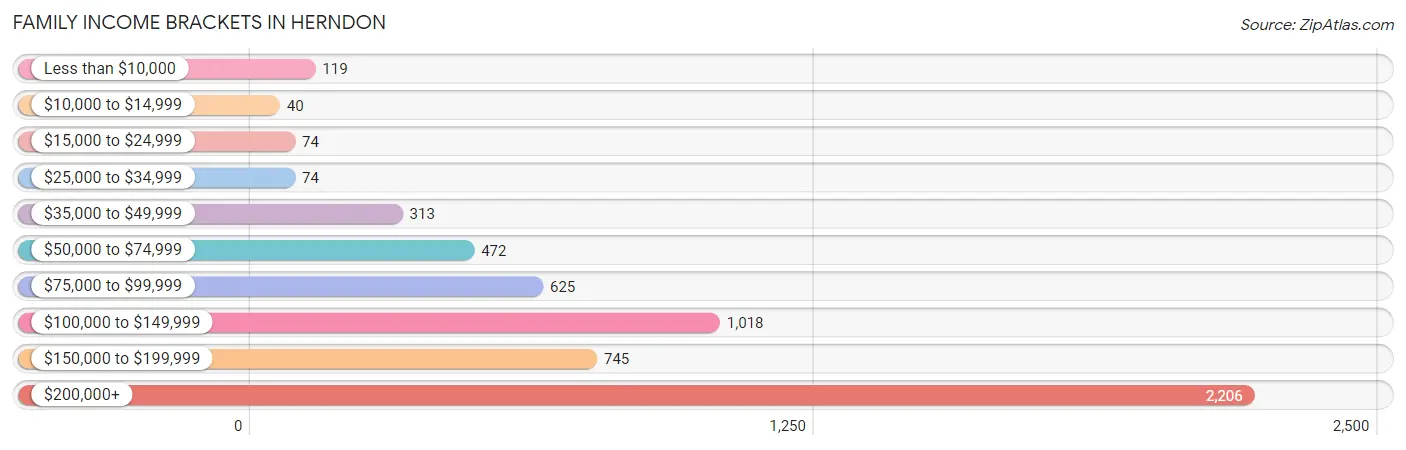
| Income Bracket | # Families | % Families |
| Less than $10,000 | 119 | 2.1% |
| $10,000 to $14,999 | 40 | 0.7% |
| $15,000 to $24,999 | 74 | 1.3% |
| $25,000 to $34,999 | 74 | 1.3% |
| $35,000 to $49,999 | 313 | 5.5% |
| $50,000 to $74,999 | 472 | 8.3% |
| $75,000 to $99,999 | 625 | 11.0% |
| $100,000 to $149,999 | 1,018 | 17.9% |
| $150,000 to $199,999 | 745 | 13.1% |
| $200,000+ | 2,206 | 38.8% |
Family Income by Famaliy Size in Herndon
5-person families (649 | 11.4%) account for the highest median family income in Herndon with $212,829 per family, while 2-person families (2,075 | 36.5%) have the highest median income of $72,074 per family member.
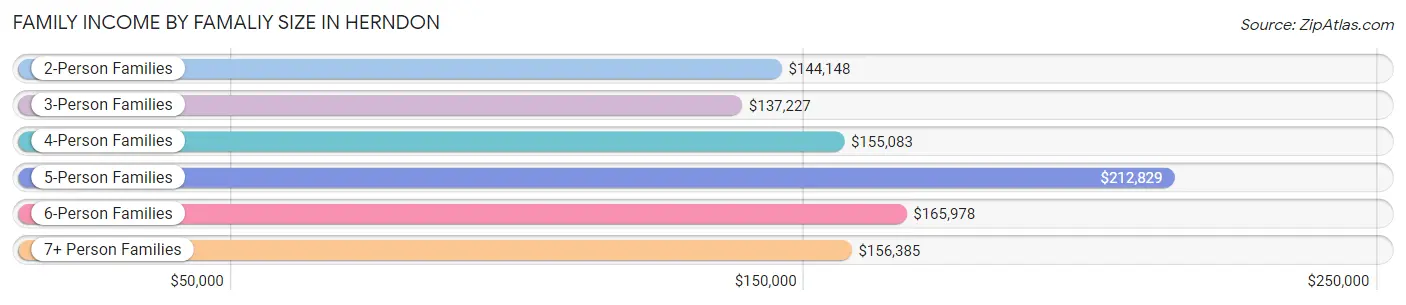
| Income Bracket | # Families | Median Income |
| 2-Person Families | 2,075 (36.5%) | $144,148 |
| 3-Person Families | 1,323 (23.3%) | $137,227 |
| 4-Person Families | 1,113 (19.6%) | $155,083 |
| 5-Person Families | 649 (11.4%) | $212,829 |
| 6-Person Families | 326 (5.7%) | $165,978 |
| 7+ Person Families | 199 (3.5%) | $156,385 |
| Total | 5,685 (100.0%) | $155,901 |
Family Income by Number of Earners in Herndon
The median family income in Herndon is $155,901, with families comprising 2 earners (3,015) having the highest median family income of $201,750, while families with no earners (355) have the lowest median family income of $69,125, accounting for 53.0% and 6.2% of families, respectively.
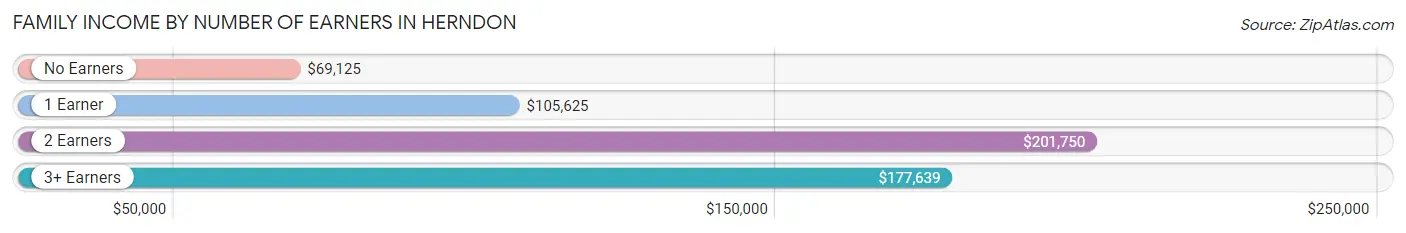
| Number of Earners | # Families | Median Income |
| No Earners | 355 (6.2%) | $69,125 |
| 1 Earner | 1,117 (19.7%) | $105,625 |
| 2 Earners | 3,015 (53.0%) | $201,750 |
| 3+ Earners | 1,198 (21.1%) | $177,639 |
| Total | 5,685 (100.0%) | $155,901 |
Household Income in Herndon
Household Income Brackets in Herndon
With 2,582 households falling in the category, the $200,000+ income range is the most frequent in Herndon, accounting for 32.7% of all households. In contrast, only 103 households (1.3%) fall into the $15,000 to $24,999 income bracket, making it the least populous group.
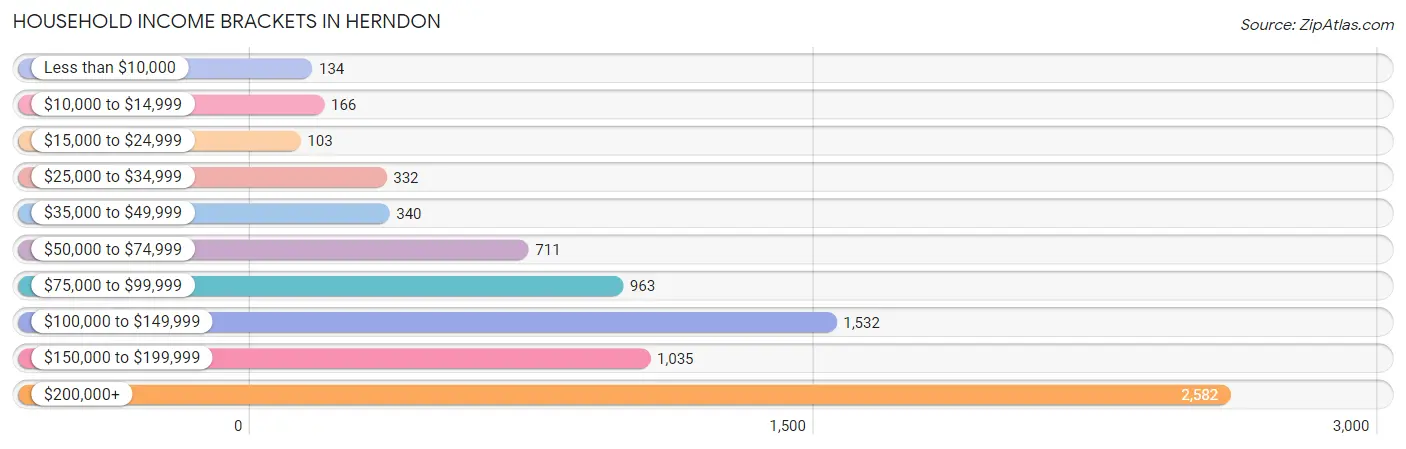
| Income Bracket | # Households | % Households |
| Less than $10,000 | 134 | 1.7% |
| $10,000 to $14,999 | 166 | 2.1% |
| $15,000 to $24,999 | 103 | 1.3% |
| $25,000 to $34,999 | 332 | 4.2% |
| $35,000 to $49,999 | 340 | 4.3% |
| $50,000 to $74,999 | 711 | 9.0% |
| $75,000 to $99,999 | 963 | 12.2% |
| $100,000 to $149,999 | 1,532 | 19.4% |
| $150,000 to $199,999 | 1,035 | 13.1% |
| $200,000+ | 2,582 | 32.7% |
Household Income by Householder Age in Herndon
The median household income in Herndon is $133,403, with the highest median household income of $165,028 found in the 25 to 44 years age bracket for the primary householder. A total of 3,123 households (39.6%) fall into this category. Meanwhile, the 65+ years age bracket for the primary householder has the lowest median household income of $91,042, with 1,316 households (16.7%) in this group.
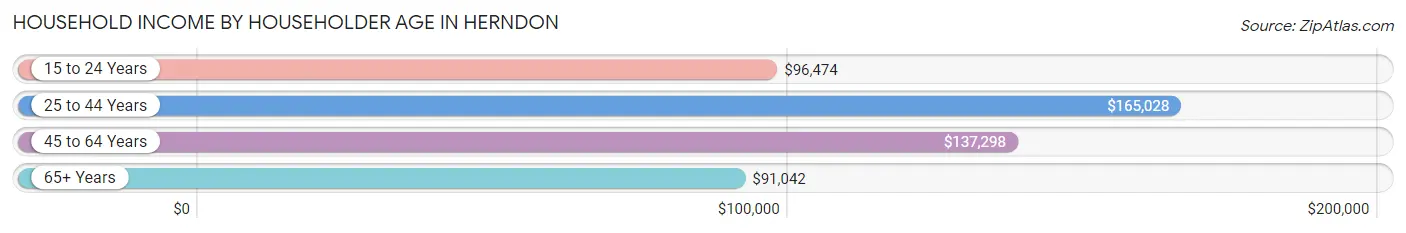
| Income Bracket | # Households | Median Income |
| 15 to 24 Years | 248 (3.1%) | $96,474 |
| 25 to 44 Years | 3,123 (39.6%) | $165,028 |
| 45 to 64 Years | 3,210 (40.6%) | $137,298 |
| 65+ Years | 1,316 (16.7%) | $91,042 |
| Total | 7,897 (100.0%) | $133,403 |
Poverty in Herndon
Income Below Poverty by Sex and Age in Herndon
With 5.9% poverty level for males and 8.4% for females among the residents of Herndon, 18 to 24 year old males and 12 to 14 year old females are the most vulnerable to poverty, with 147 males (12.4%) and 195 females (37.4%) in their respective age groups living below the poverty level.
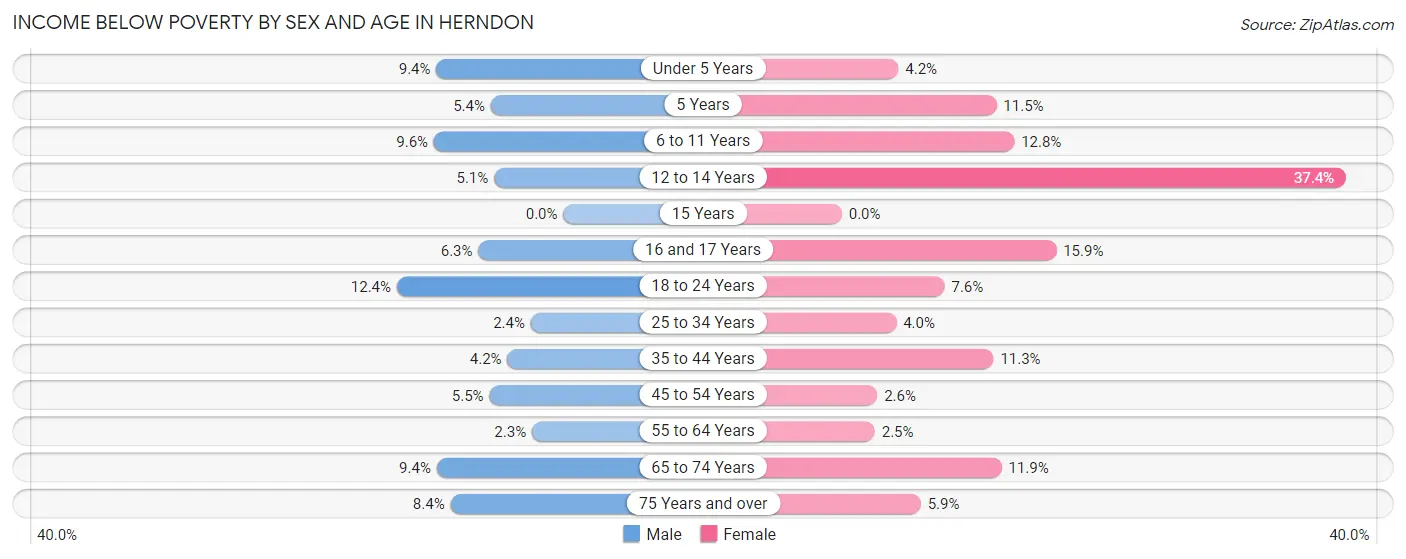
| Age Bracket | Male | Female |
| Under 5 Years | 98 (9.4%) | 29 (4.2%) |
| 5 Years | 11 (5.4%) | 7 (11.5%) |
| 6 to 11 Years | 91 (9.6%) | 121 (12.8%) |
| 12 to 14 Years | 18 (5.1%) | 195 (37.4%) |
| 15 Years | 0 (0.0%) | 0 (0.0%) |
| 16 and 17 Years | 20 (6.3%) | 60 (15.9%) |
| 18 to 24 Years | 147 (12.4%) | 80 (7.6%) |
| 25 to 34 Years | 52 (2.4%) | 65 (4.0%) |
| 35 to 44 Years | 91 (4.2%) | 204 (11.3%) |
| 45 to 54 Years | 89 (5.5%) | 39 (2.6%) |
| 55 to 64 Years | 36 (2.3%) | 32 (2.5%) |
| 65 to 74 Years | 82 (9.4%) | 91 (11.9%) |
| 75 Years and over | 32 (8.4%) | 30 (5.9%) |
| Total | 767 (5.9%) | 953 (8.4%) |
Income Above Poverty by Sex and Age in Herndon
According to the poverty statistics in Herndon, males aged 15 years and females aged 15 years are the age groups that are most secure financially, with 100.0% of males and 100.0% of females in these age groups living above the poverty line.
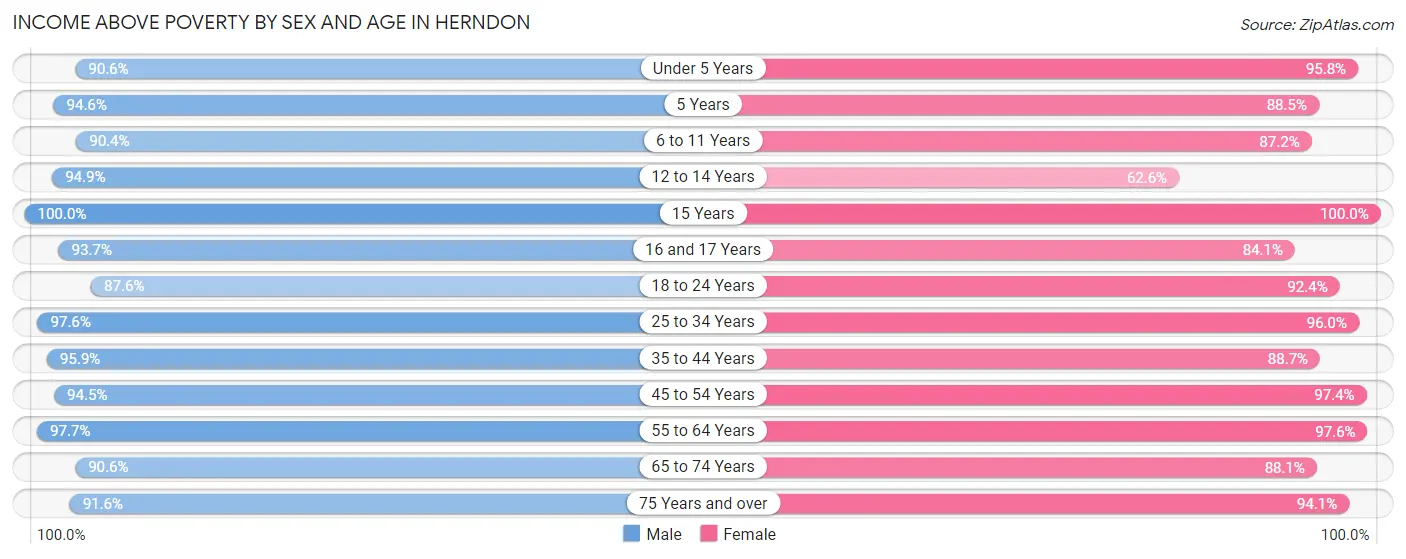
| Age Bracket | Male | Female |
| Under 5 Years | 941 (90.6%) | 662 (95.8%) |
| 5 Years | 193 (94.6%) | 54 (88.5%) |
| 6 to 11 Years | 856 (90.4%) | 824 (87.2%) |
| 12 to 14 Years | 332 (94.9%) | 326 (62.6%) |
| 15 Years | 131 (100.0%) | 169 (100.0%) |
| 16 and 17 Years | 297 (93.7%) | 317 (84.1%) |
| 18 to 24 Years | 1,042 (87.6%) | 968 (92.4%) |
| 25 to 34 Years | 2,098 (97.6%) | 1,542 (96.0%) |
| 35 to 44 Years | 2,104 (95.9%) | 1,607 (88.7%) |
| 45 to 54 Years | 1,531 (94.5%) | 1,442 (97.4%) |
| 55 to 64 Years | 1,509 (97.7%) | 1,273 (97.6%) |
| 65 to 74 Years | 790 (90.6%) | 676 (88.1%) |
| 75 Years and over | 350 (91.6%) | 482 (94.1%) |
| Total | 12,174 (94.1%) | 10,342 (91.6%) |
Income Below Poverty Among Married-Couple Families in Herndon
The poverty statistics for married-couple families in Herndon show that 2.0% or 90 of the total 4,559 families live below the poverty line. Families with 5 or more children have the highest poverty rate of 43.6%, comprising of 34 families. On the other hand, families with 1 or 2 children have the lowest poverty rate of 0.7%, which includes 12 families.
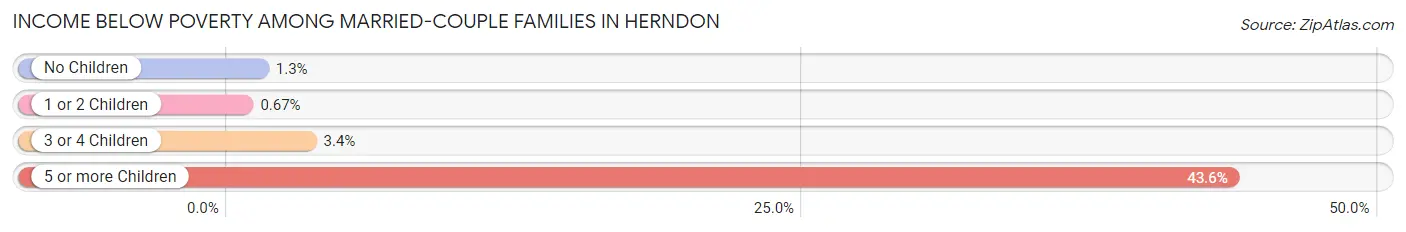
| Children | Above Poverty | Below Poverty |
| No Children | 2,282 (98.7%) | 31 (1.3%) |
| 1 or 2 Children | 1,776 (99.3%) | 12 (0.7%) |
| 3 or 4 Children | 367 (96.6%) | 13 (3.4%) |
| 5 or more Children | 44 (56.4%) | 34 (43.6%) |
| Total | 4,469 (98.0%) | 90 (2.0%) |
Income Below Poverty Among Single-Parent Households in Herndon
According to the poverty data in Herndon, 6.5% or 34 single-father households and 19.6% or 118 single-mother households are living below the poverty line. Among single-father households, those with no children have the highest poverty rate, with 34 households (13.2%) experiencing poverty. Likewise, among single-mother households, those with 3 or 4 children have the highest poverty rate, with 60 households (44.4%) falling below the poverty line.
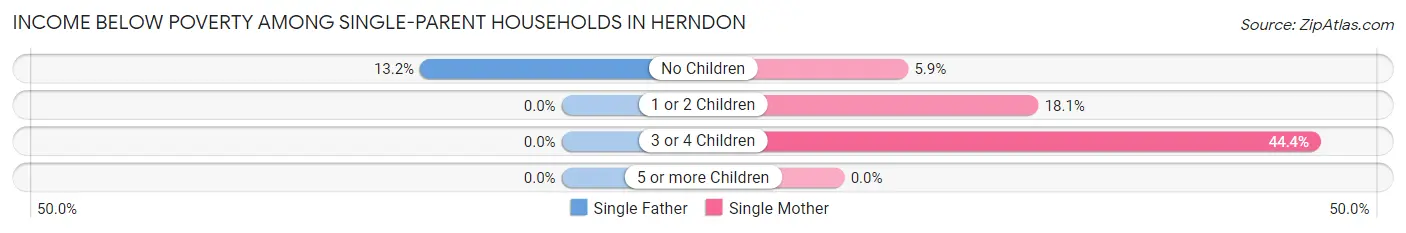
| Children | Single Father | Single Mother |
| No Children | 34 (13.2%) | 13 (5.9%) |
| 1 or 2 Children | 0 (0.0%) | 45 (18.1%) |
| 3 or 4 Children | 0 (0.0%) | 60 (44.4%) |
| 5 or more Children | 0 (0.0%) | 0 (0.0%) |
| Total | 34 (6.5%) | 118 (19.6%) |
Income Below Poverty Among Married-Couple vs Single-Parent Households in Herndon
The poverty data for Herndon shows that 90 of the married-couple family households (2.0%) and 152 of the single-parent households (13.5%) are living below the poverty level. Within the married-couple family households, those with 5 or more children have the highest poverty rate, with 34 households (43.6%) falling below the poverty line. Among the single-parent households, those with 3 or 4 children have the highest poverty rate, with 60 household (28.2%) living below poverty.
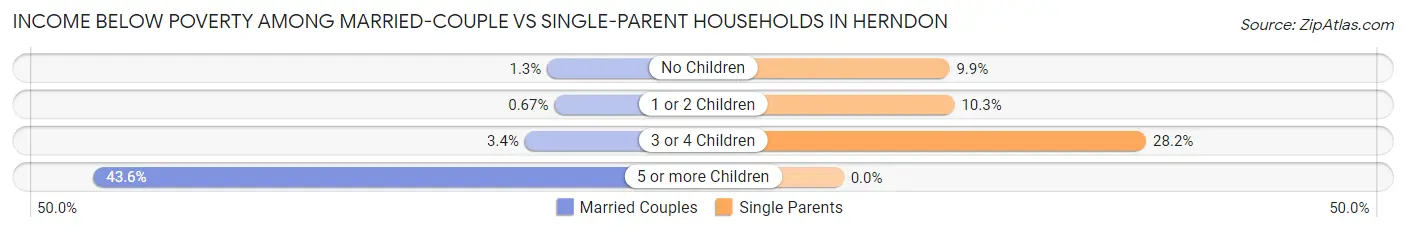
| Children | Married-Couple Families | Single-Parent Households |
| No Children | 31 (1.3%) | 47 (9.9%) |
| 1 or 2 Children | 12 (0.7%) | 45 (10.3%) |
| 3 or 4 Children | 13 (3.4%) | 60 (28.2%) |
| 5 or more Children | 34 (43.6%) | 0 (0.0%) |
| Total | 90 (2.0%) | 152 (13.5%) |
Race in Herndon
The most populous races in Herndon are White / Caucasian (10,563 | 43.2%), Hispanic or Latino (9,143 | 37.4%), and Some other Race (5,297 | 21.7%).
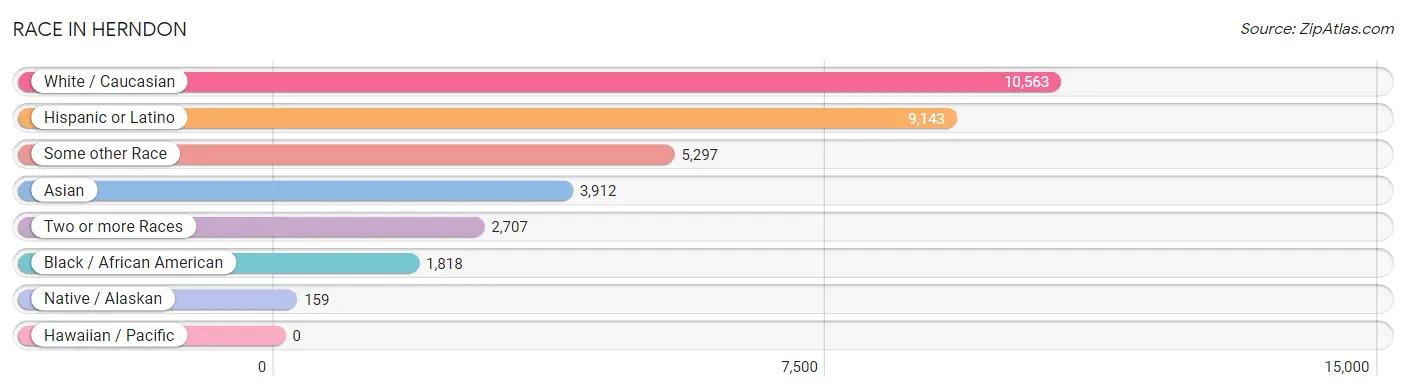
| Race | # Population | % Population |
| Asian | 3,912 | 16.0% |
| Black / African American | 1,818 | 7.4% |
| Hawaiian / Pacific | 0 | 0.0% |
| Hispanic or Latino | 9,143 | 37.4% |
| Native / Alaskan | 159 | 0.6% |
| White / Caucasian | 10,563 | 43.2% |
| Two or more Races | 2,707 | 11.1% |
| Some other Race | 5,297 | 21.7% |
| Total | 24,456 | 100.0% |
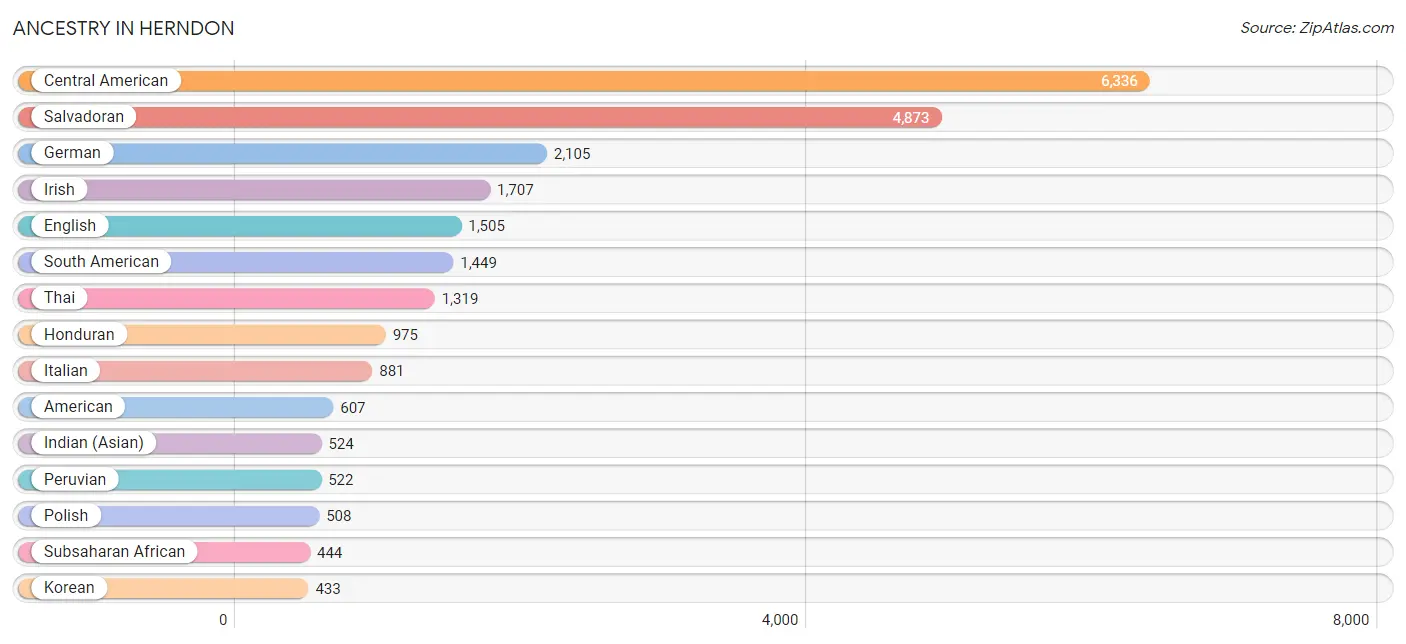
Ancestry in Herndon
The most populous ancestries reported in Herndon are Central American (6,336 | 25.9%), Salvadoran (4,873 | 19.9%), German (2,105 | 8.6%), Irish (1,707 | 7.0%), and English (1,505 | 6.1%), together accounting for 67.6% of all Herndon residents.
| Ancestry | # Population | % Population |
| Afghan | 76 | 0.3% |
| African | 107 | 0.4% |
| American | 607 | 2.5% |
| Arab | 305 | 1.3% |
| Argentinean | 94 | 0.4% |
| Armenian | 122 | 0.5% |
| Australian | 17 | 0.1% |
| Austrian | 12 | 0.1% |
| Barbadian | 9 | 0.0% |
| Belgian | 25 | 0.1% |
| Bhutanese | 61 | 0.3% |
| Bolivian | 249 | 1.0% |
| Brazilian | 21 | 0.1% |
| British | 302 | 1.2% |
| British West Indian | 33 | 0.1% |
| Bulgarian | 6 | 0.0% |
| Burmese | 59 | 0.2% |
| Central American | 6,336 | 25.9% |
| Central American Indian | 120 | 0.5% |
| Cherokee | 19 | 0.1% |
| Chilean | 26 | 0.1% |
| Chinese | 17 | 0.1% |
| Colombian | 303 | 1.2% |
| Costa Rican | 13 | 0.1% |
| Croatian | 36 | 0.2% |
| Cuban | 65 | 0.3% |
| Czech | 14 | 0.1% |
| Danish | 100 | 0.4% |
| Dominican | 108 | 0.4% |
| Dutch | 76 | 0.3% |
| Eastern European | 104 | 0.4% |
| Ecuadorian | 41 | 0.2% |
| Egyptian | 67 | 0.3% |
| English | 1,505 | 6.1% |
| Ethiopian | 186 | 0.8% |
| European | 382 | 1.6% |
| Filipino | 26 | 0.1% |
| Finnish | 10 | 0.0% |
| French | 288 | 1.2% |
| French Canadian | 105 | 0.4% |
| German | 2,105 | 8.6% |
| Greek | 25 | 0.1% |
| Guatemalan | 359 | 1.5% |
| Haitian | 15 | 0.1% |
| Honduran | 975 | 4.0% |
| Hungarian | 56 | 0.2% |
| Icelander | 11 | 0.0% |
| Indian (Asian) | 524 | 2.1% |
| Iranian | 82 | 0.3% |
| Iraqi | 26 | 0.1% |
| Irish | 1,707 | 7.0% |
| Israeli | 17 | 0.1% |
| Italian | 881 | 3.6% |
| Jamaican | 52 | 0.2% |
| Japanese | 40 | 0.2% |
| Korean | 433 | 1.8% |
| Laotian | 25 | 0.1% |
| Lebanese | 64 | 0.3% |
| Lithuanian | 17 | 0.1% |
| Malaysian | 25 | 0.1% |
| Mexican | 311 | 1.3% |
| Nicaraguan | 116 | 0.5% |
| Nigerian | 46 | 0.2% |
| Northern European | 54 | 0.2% |
| Norwegian | 69 | 0.3% |
| Pakistani | 219 | 0.9% |
| Paraguayan | 45 | 0.2% |
| Peruvian | 522 | 2.1% |
| Polish | 508 | 2.1% |
| Portuguese | 8 | 0.0% |
| Puerto Rican | 156 | 0.6% |
| Romanian | 89 | 0.4% |
| Russian | 354 | 1.5% |
| Salvadoran | 4,873 | 19.9% |
| Scandinavian | 58 | 0.2% |
| Scotch-Irish | 166 | 0.7% |
| Scottish | 157 | 0.6% |
| Slavic | 6 | 0.0% |
| Slovak | 37 | 0.2% |
| Slovene | 26 | 0.1% |
| South American | 1,449 | 5.9% |
| South American Indian | 29 | 0.1% |
| Spaniard | 46 | 0.2% |
| Spanish | 32 | 0.1% |
| Sri Lankan | 386 | 1.6% |
| Subsaharan African | 444 | 1.8% |
| Sudanese | 85 | 0.4% |
| Swedish | 170 | 0.7% |
| Swiss | 87 | 0.4% |
| Syrian | 84 | 0.3% |
| Taiwanese | 13 | 0.1% |
| Thai | 1,319 | 5.4% |
| Trinidadian and Tobagonian | 36 | 0.2% |
| Turkish | 10 | 0.0% |
| Ukrainian | 63 | 0.3% |
| Venezuelan | 169 | 0.7% |
| Vietnamese | 11 | 0.0% |
| Welsh | 84 | 0.3% |
| Yugoslavian | 26 | 0.1% | View All 99 Rows |
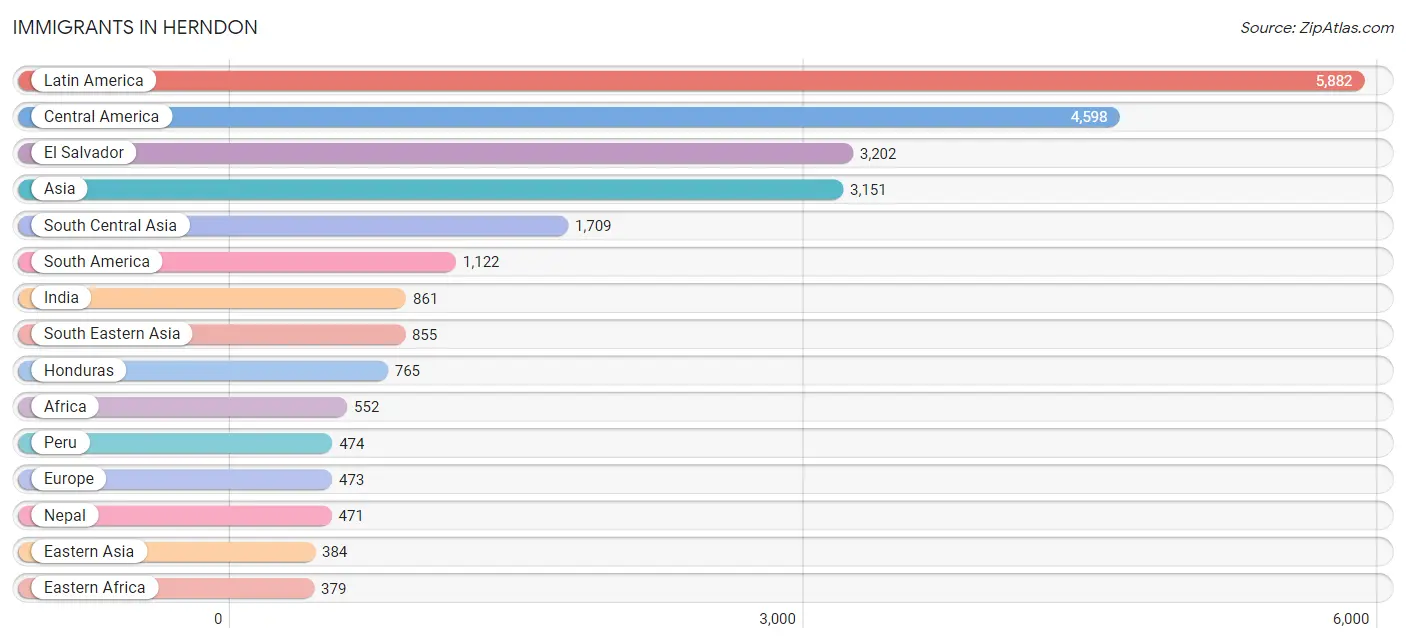
Immigrants in Herndon
The most numerous immigrant groups reported in Herndon came from Latin America (5,882 | 24.0%), Central America (4,598 | 18.8%), El Salvador (3,202 | 13.1%), Asia (3,151 | 12.9%), and South Central Asia (1,709 | 7.0%), together accounting for 75.8% of all Herndon residents.
| Immigration Origin | # Population | % Population |
| Afghanistan | 29 | 0.1% |
| Africa | 552 | 2.3% |
| Argentina | 47 | 0.2% |
| Asia | 3,151 | 12.9% |
| Bangladesh | 86 | 0.4% |
| Barbados | 9 | 0.0% |
| Belarus | 27 | 0.1% |
| Bolivia | 218 | 0.9% |
| Bosnia and Herzegovina | 10 | 0.0% |
| Brazil | 15 | 0.1% |
| Cambodia | 66 | 0.3% |
| Cameroon | 20 | 0.1% |
| Canada | 164 | 0.7% |
| Caribbean | 162 | 0.7% |
| Central America | 4,598 | 18.8% |
| Chile | 26 | 0.1% |
| China | 338 | 1.4% |
| Colombia | 161 | 0.7% |
| Cuba | 19 | 0.1% |
| Czechoslovakia | 7 | 0.0% |
| Dominica | 41 | 0.2% |
| Dominican Republic | 23 | 0.1% |
| Eastern Africa | 379 | 1.5% |
| Eastern Asia | 384 | 1.6% |
| Eastern Europe | 319 | 1.3% |
| Ecuador | 41 | 0.2% |
| Egypt | 51 | 0.2% |
| El Salvador | 3,202 | 13.1% |
| England | 27 | 0.1% |
| Ethiopia | 379 | 1.5% |
| Europe | 473 | 1.9% |
| France | 13 | 0.1% |
| Germany | 47 | 0.2% |
| Guatemala | 315 | 1.3% |
| Honduras | 765 | 3.1% |
| Hong Kong | 18 | 0.1% |
| Hungary | 6 | 0.0% |
| India | 861 | 3.5% |
| Indonesia | 25 | 0.1% |
| Iran | 39 | 0.2% |
| Iraq | 12 | 0.1% |
| Ireland | 16 | 0.1% |
| Italy | 27 | 0.1% |
| Jamaica | 22 | 0.1% |
| Japan | 15 | 0.1% |
| Korea | 31 | 0.1% |
| Latin America | 5,882 | 24.0% |
| Lebanon | 87 | 0.4% |
| Malaysia | 139 | 0.6% |
| Mexico | 200 | 0.8% |
| Middle Africa | 20 | 0.1% |
| Nepal | 471 | 1.9% |
| Nicaragua | 116 | 0.5% |
| Nigeria | 20 | 0.1% |
| Northern Africa | 93 | 0.4% |
| Northern Europe | 67 | 0.3% |
| Oceania | 10 | 0.0% |
| Pakistan | 213 | 0.9% |
| Peru | 474 | 1.9% |
| Philippines | 224 | 0.9% |
| Poland | 9 | 0.0% |
| Romania | 61 | 0.3% |
| Russia | 153 | 0.6% |
| Saudi Arabia | 8 | 0.0% |
| Sierra Leone | 11 | 0.0% |
| South Africa | 7 | 0.0% |
| South America | 1,122 | 4.6% |
| South Central Asia | 1,709 | 7.0% |
| South Eastern Asia | 855 | 3.5% |
| Southern Europe | 27 | 0.1% |
| Sudan | 21 | 0.1% |
| Syria | 43 | 0.2% |
| Taiwan | 26 | 0.1% |
| Thailand | 84 | 0.3% |
| Trinidad and Tobago | 15 | 0.1% |
| Turkey | 53 | 0.2% |
| Ukraine | 28 | 0.1% |
| Uzbekistan | 10 | 0.0% |
| Venezuela | 95 | 0.4% |
| Vietnam | 317 | 1.3% |
| Western Africa | 31 | 0.1% |
| Western Asia | 203 | 0.8% |
| Western Europe | 60 | 0.3% | View All 83 Rows |
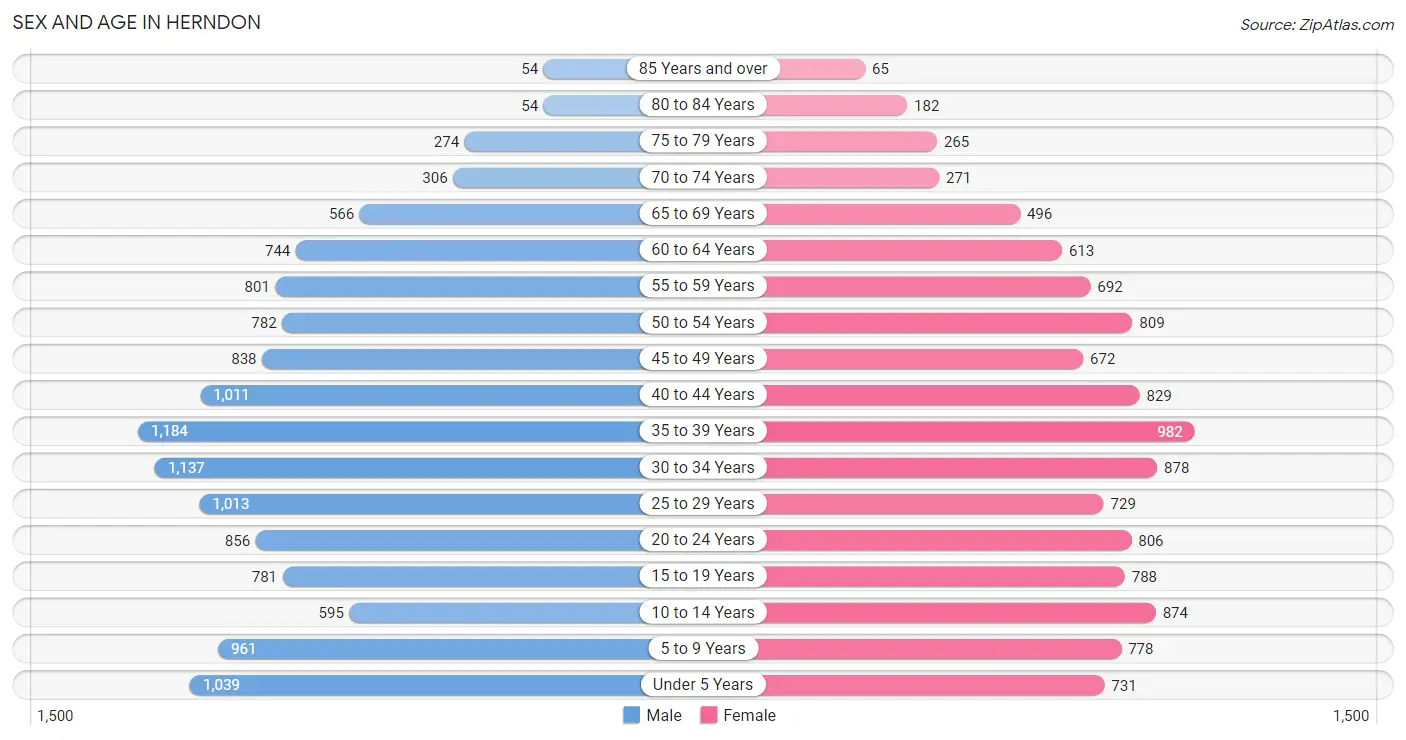
Sex and Age in Herndon
Sex and Age in Herndon
The most populous age groups in Herndon are 35 to 39 Years (1,184 | 9.1%) for men and 35 to 39 Years (982 | 8.6%) for women.
| Age Bracket | Male | Female |
| Under 5 Years | 1,039 (8.0%) | 731 (6.4%) |
| 5 to 9 Years | 961 (7.4%) | 778 (6.8%) |
| 10 to 14 Years | 595 (4.6%) | 874 (7.6%) |
| 15 to 19 Years | 781 (6.0%) | 788 (6.9%) |
| 20 to 24 Years | 856 (6.6%) | 806 (7.0%) |
| 25 to 29 Years | 1,013 (7.8%) | 729 (6.4%) |
| 30 to 34 Years | 1,137 (8.7%) | 878 (7.7%) |
| 35 to 39 Years | 1,184 (9.1%) | 982 (8.6%) |
| 40 to 44 Years | 1,011 (7.8%) | 829 (7.2%) |
| 45 to 49 Years | 838 (6.5%) | 672 (5.9%) |
| 50 to 54 Years | 782 (6.0%) | 809 (7.1%) |
| 55 to 59 Years | 801 (6.2%) | 692 (6.0%) |
| 60 to 64 Years | 744 (5.7%) | 613 (5.3%) |
| 65 to 69 Years | 566 (4.4%) | 496 (4.3%) |
| 70 to 74 Years | 306 (2.4%) | 271 (2.4%) |
| 75 to 79 Years | 274 (2.1%) | 265 (2.3%) |
| 80 to 84 Years | 54 (0.4%) | 182 (1.6%) |
| 85 Years and over | 54 (0.4%) | 65 (0.6%) |
| Total | 12,996 (100.0%) | 11,460 (100.0%) |
Families and Households in Herndon
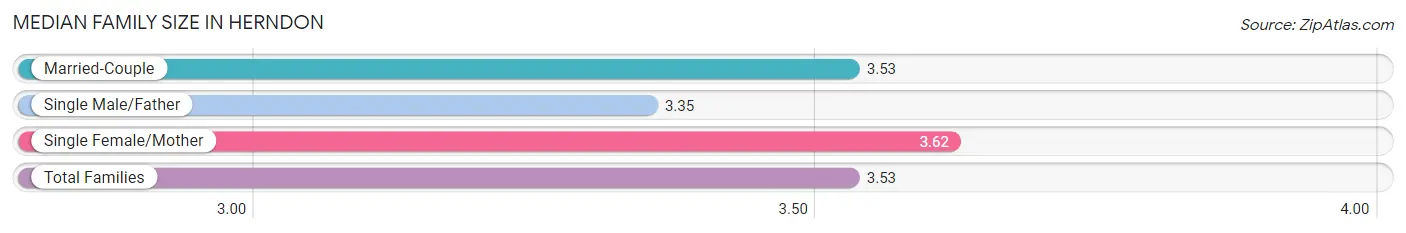
Median Family Size in Herndon
The median family size in Herndon is 3.53 persons per family, with single female/mother families (603 | 10.6%) accounting for the largest median family size of 3.62 persons per family. On the other hand, single male/father families (523 | 9.2%) represent the smallest median family size with 3.35 persons per family.
| Family Type | # Families | Family Size |
| Married-Couple | 4,559 (80.2%) | 3.53 |
| Single Male/Father | 523 (9.2%) | 3.35 |
| Single Female/Mother | 603 (10.6%) | 3.62 |
| Total Families | 5,685 (100.0%) | 3.53 |
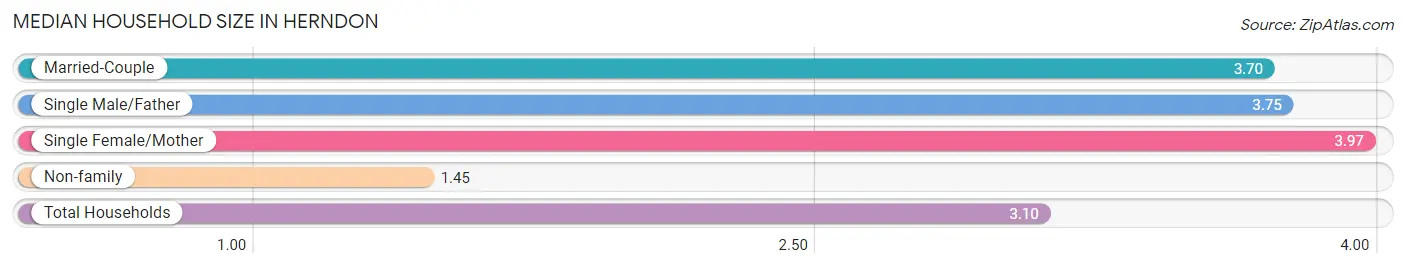
Median Household Size in Herndon
The median household size in Herndon is 3.10 persons per household, with single female/mother households (603 | 7.6%) accounting for the largest median household size of 3.97 persons per household. non-family households (2,212 | 28.0%) represent the smallest median household size with 1.45 persons per household.
| Household Type | # Households | Household Size |
| Married-Couple | 4,559 (57.7%) | 3.70 |
| Single Male/Father | 523 (6.6%) | 3.75 |
| Single Female/Mother | 603 (7.6%) | 3.97 |
| Non-family | 2,212 (28.0%) | 1.45 |
| Total Households | 7,897 (100.0%) | 3.10 |
Household Size by Marriage Status in Herndon
Out of a total of 7,897 households in Herndon, 5,685 (72.0%) are family households, while 2,212 (28.0%) are nonfamily households. The most numerous type of family households are 2-person households, comprising 1,938, and the most common type of nonfamily households are 1-person households, comprising 1,522.
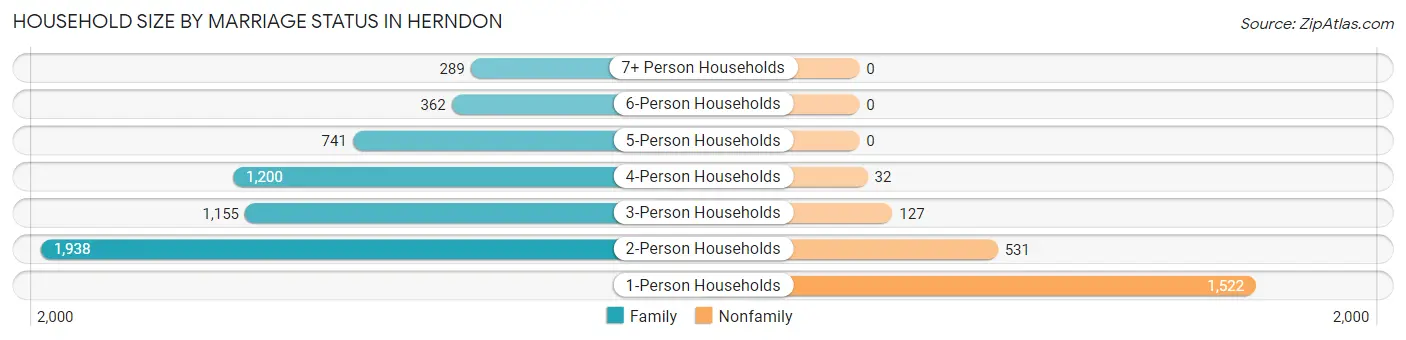
| Household Size | Family Households | Nonfamily Households |
| 1-Person Households | - | 1,522 (19.3%) |
| 2-Person Households | 1,938 (24.5%) | 531 (6.7%) |
| 3-Person Households | 1,155 (14.6%) | 127 (1.6%) |
| 4-Person Households | 1,200 (15.2%) | 32 (0.4%) |
| 5-Person Households | 741 (9.4%) | 0 (0.0%) |
| 6-Person Households | 362 (4.6%) | 0 (0.0%) |
| 7+ Person Households | 289 (3.7%) | 0 (0.0%) |
| Total | 5,685 (72.0%) | 2,212 (28.0%) |
Female Fertility in Herndon
Fertility by Age in Herndon
Average fertility rate in Herndon is 46.0 births per 1,000 women. Women in the age bracket of 20 to 34 years have the highest fertility rate with 48.0 births per 1,000 women. Women in the age bracket of 35 to 50 years acount for 43.9% of all women with births.
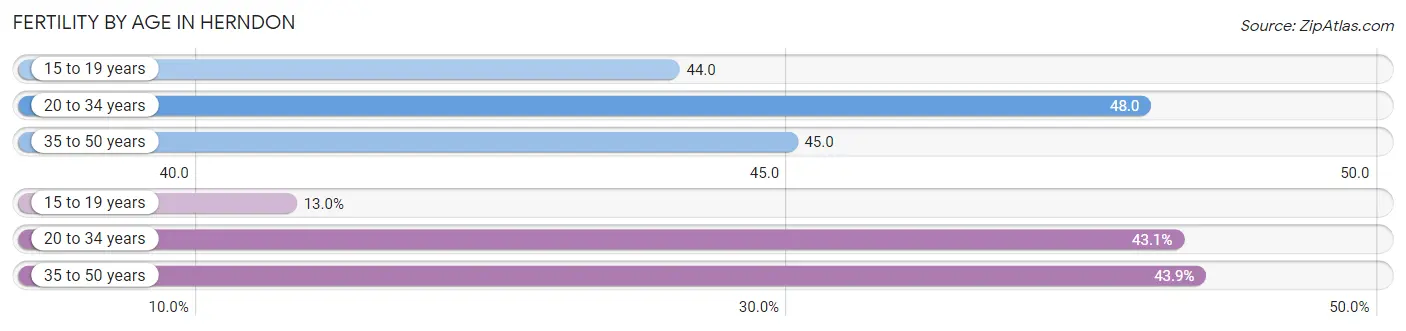
| Age Bracket | Women with Births | Births / 1,000 Women |
| 15 to 19 years | 35 (13.0%) | 44.0 |
| 20 to 34 years | 116 (43.1%) | 48.0 |
| 35 to 50 years | 118 (43.9%) | 45.0 |
| Total | 269 (100.0%) | 46.0 |
Fertility by Age by Marriage Status in Herndon
74.0% of women with births (269) in Herndon are married. The highest percentage of unmarried women with births falls into 15 to 19 years age bracket with 100.0% of them unmarried at the time of birth, while the lowest percentage of unmarried women with births belong to 35 to 50 years age bracket with 0.0% of them unmarried.
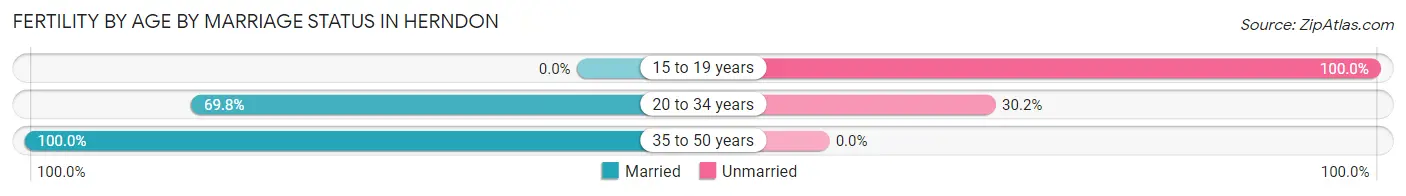
| Age Bracket | Married | Unmarried |
| 15 to 19 years | 0 (0.0%) | 35 (100.0%) |
| 20 to 34 years | 81 (69.8%) | 35 (30.2%) |
| 35 to 50 years | 118 (100.0%) | 0 (0.0%) |
| Total | 199 (74.0%) | 70 (26.0%) |
Fertility by Education in Herndon
Average fertility rate in Herndon is 46.0 births per 1,000 women. Women with the education attainment of graduate degree have the highest fertility rate of 145.0 births per 1,000 women, while women with the education attainment of high school diploma have the lowest fertility at 6.0 births per 1,000 women. Women with the education attainment of graduate degree represent 54.6% of all women with births.
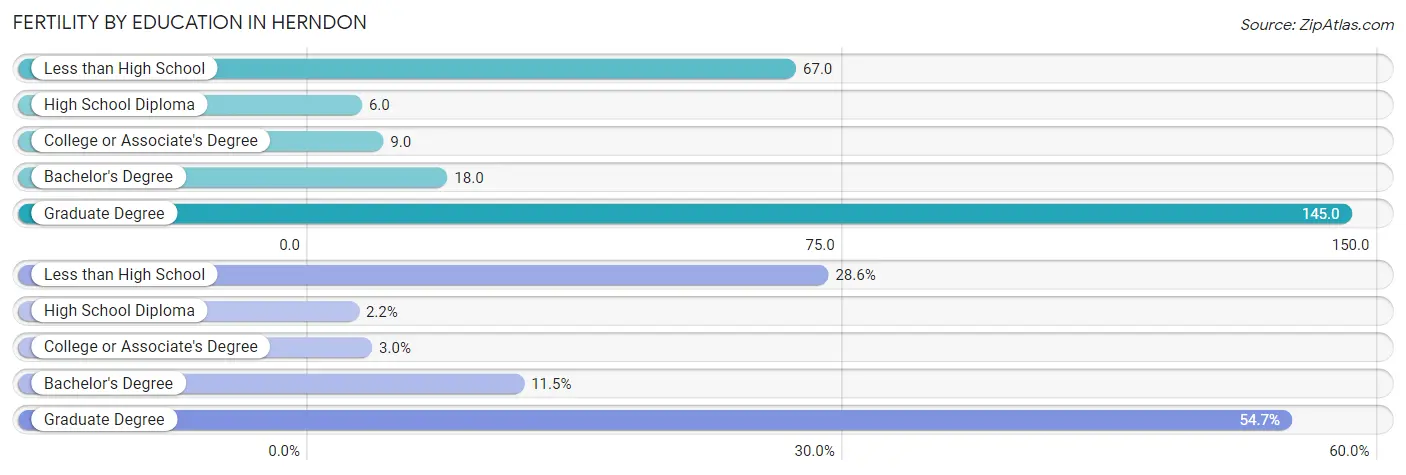
| Educational Attainment | Women with Births | Births / 1,000 Women |
| Less than High School | 77 (28.6%) | 67.0 |
| High School Diploma | 6 (2.2%) | 6.0 |
| College or Associate's Degree | 8 (3.0%) | 9.0 |
| Bachelor's Degree | 31 (11.5%) | 18.0 |
| Graduate Degree | 147 (54.6%) | 145.0 |
| Total | 269 (100.0%) | 46.0 |
Fertility by Education by Marriage Status in Herndon
26.0% of women with births in Herndon are unmarried. Women with the educational attainment of high school diploma are most likely to be married with 100.0% of them married at childbirth, while women with the educational attainment of less than high school are least likely to be married with 90.9% of them unmarried at childbirth.
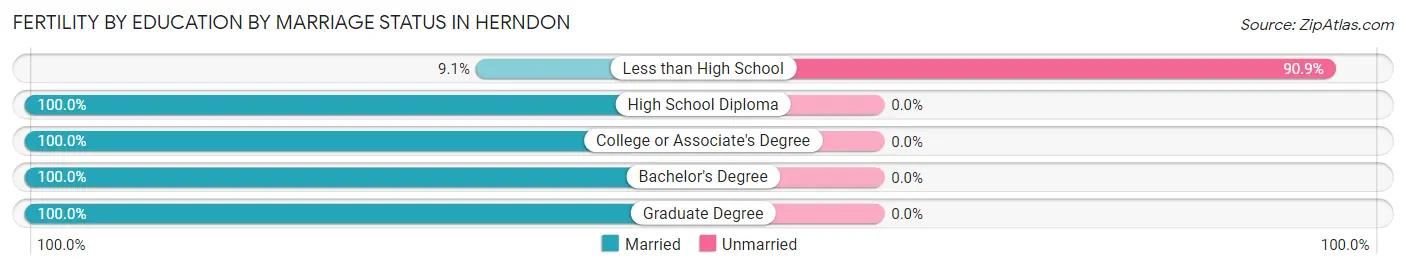
| Educational Attainment | Married | Unmarried |
| Less than High School | 7 (9.1%) | 70 (90.9%) |
| High School Diploma | 6 (100.0%) | 0 (0.0%) |
| College or Associate's Degree | 8 (100.0%) | 0 (0.0%) |
| Bachelor's Degree | 31 (100.0%) | 0 (0.0%) |
| Graduate Degree | 147 (100.0%) | 0 (0.0%) |
| Total | 199 (74.0%) | 70 (26.0%) |
Employment Characteristics in Herndon
Employment by Class of Employer in Herndon
Among the 14,505 employed individuals in Herndon, private company employees (10,429 | 71.9%), federal government employees (1,144 | 7.9%), and self-employed (not incorporated) (898 | 6.2%) make up the most common classes of employment.
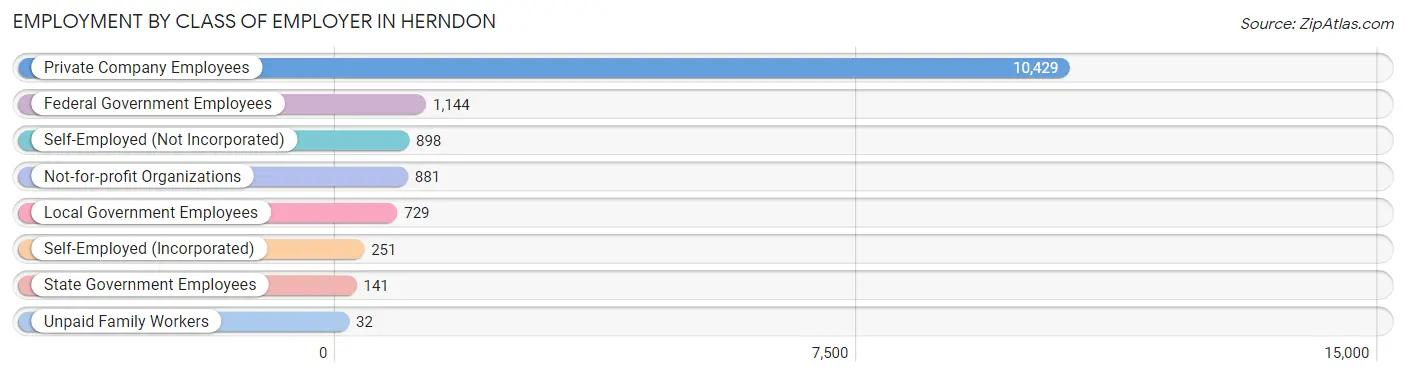
| Employer Class | # Employees | % Employees |
| Private Company Employees | 10,429 | 71.9% |
| Self-Employed (Incorporated) | 251 | 1.7% |
| Self-Employed (Not Incorporated) | 898 | 6.2% |
| Not-for-profit Organizations | 881 | 6.1% |
| Local Government Employees | 729 | 5.0% |
| State Government Employees | 141 | 1.0% |
| Federal Government Employees | 1,144 | 7.9% |
| Unpaid Family Workers | 32 | 0.2% |
| Total | 14,505 | 100.0% |
Employment Status by Age in Herndon
According to the labor force statistics for Herndon, out of the total population over 16 years of age (19,178), 79.2% or 15,189 individuals are in the labor force, with 2.7% or 410 of them unemployed. The age group with the highest labor force participation rate is 35 to 44 years, with 95.3% or 3,818 individuals in the labor force. Within the labor force, the 16 to 19 years age range has the highest percentage of unemployed individuals, with 11.1% or 56 of them being unemployed.
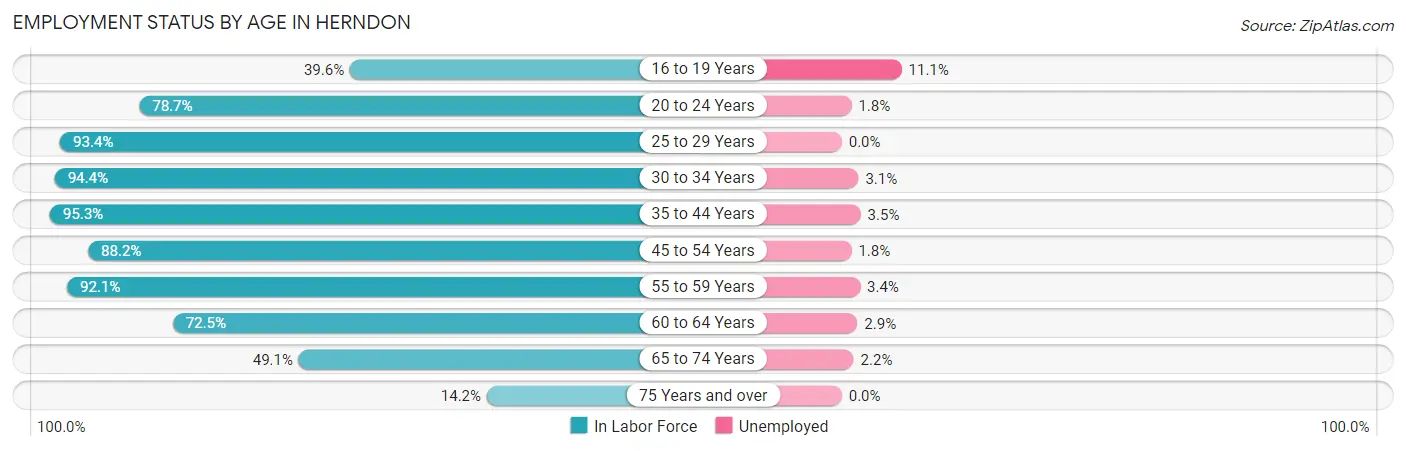
| Age Bracket | In Labor Force | Unemployed |
| 16 to 19 Years | 503 (39.6%) | 56 (11.1%) |
| 20 to 24 Years | 1,308 (78.7%) | 24 (1.8%) |
| 25 to 29 Years | 1,627 (93.4%) | 0 (0.0%) |
| 30 to 34 Years | 1,902 (94.4%) | 59 (3.1%) |
| 35 to 44 Years | 3,818 (95.3%) | 134 (3.5%) |
| 45 to 54 Years | 2,735 (88.2%) | 49 (1.8%) |
| 55 to 59 Years | 1,375 (92.1%) | 47 (3.4%) |
| 60 to 64 Years | 984 (72.5%) | 29 (2.9%) |
| 65 to 74 Years | 805 (49.1%) | 18 (2.2%) |
| 75 Years and over | 127 (14.2%) | 0 (0.0%) |
| Total | 15,189 (79.2%) | 410 (2.7%) |
Employment Status by Educational Attainment in Herndon
According to labor force statistics for Herndon, 90.7% of individuals (12,439) out of the total population between 25 and 64 years of age (13,714) are in the labor force, with 2.6% or 323 of them being unemployed. The group with the highest labor force participation rate are those with the educational attainment of bachelor's degree or higher, with 92.6% or 6,851 individuals in the labor force. Within the labor force, individuals with high school diploma education have the highest percentage of unemployment, with 2.9% or 52 of them being unemployed.
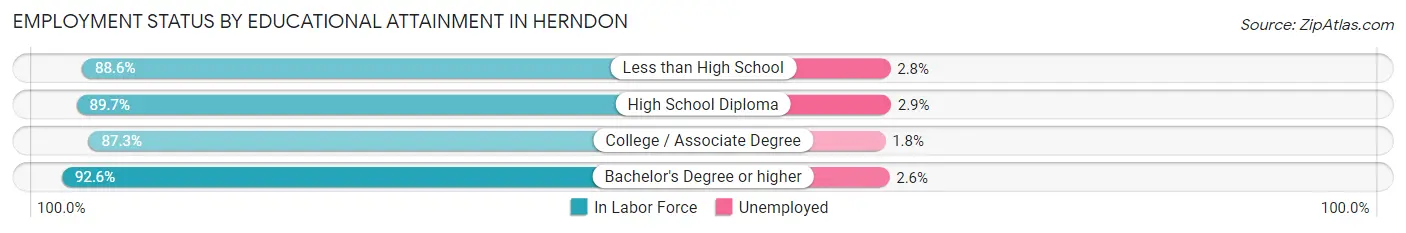
| Educational Attainment | In Labor Force | Unemployed |
| Less than High School | 1,867 (88.6%) | 59 (2.8%) |
| High School Diploma | 1,798 (89.7%) | 58 (2.9%) |
| College / Associate Degree | 1,924 (87.3%) | 40 (1.8%) |
| Bachelor's Degree or higher | 6,851 (92.6%) | 192 (2.6%) |
| Total | 12,439 (90.7%) | 357 (2.6%) |
Employment Occupations by Sex in Herndon
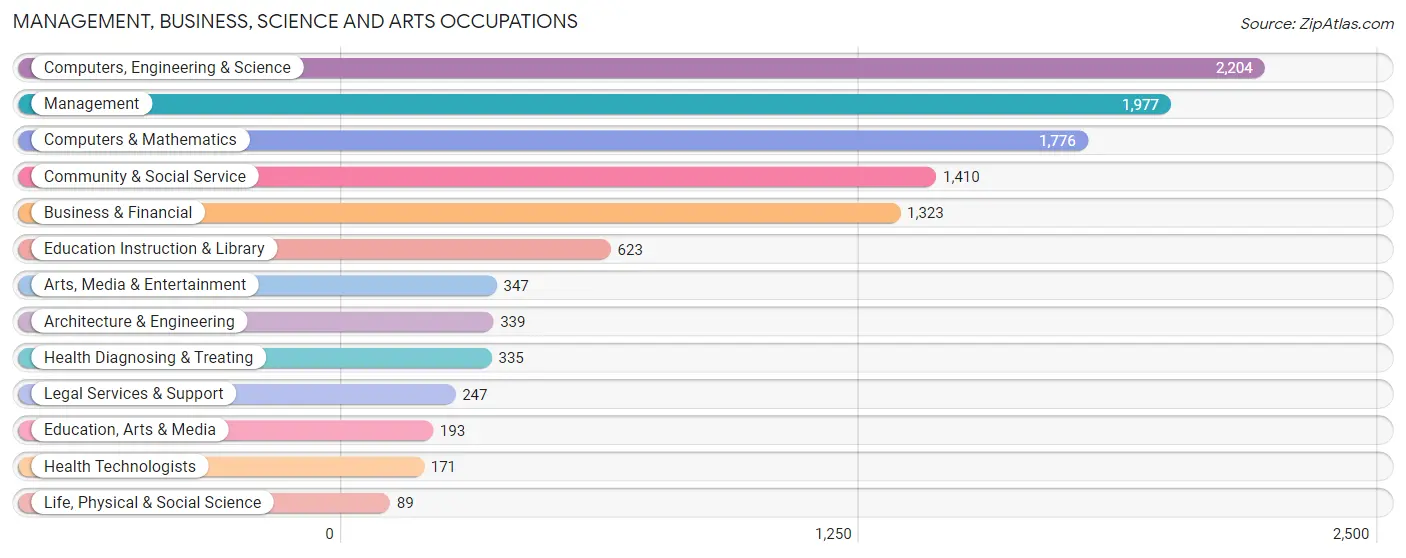
Management, Business, Science and Arts Occupations
The most common Management, Business, Science and Arts occupations in Herndon are Computers, Engineering & Science (2,204 | 15.0%), Management (1,977 | 13.4%), Computers & Mathematics (1,776 | 12.0%), Community & Social Service (1,410 | 9.6%), and Business & Financial (1,323 | 9.0%).
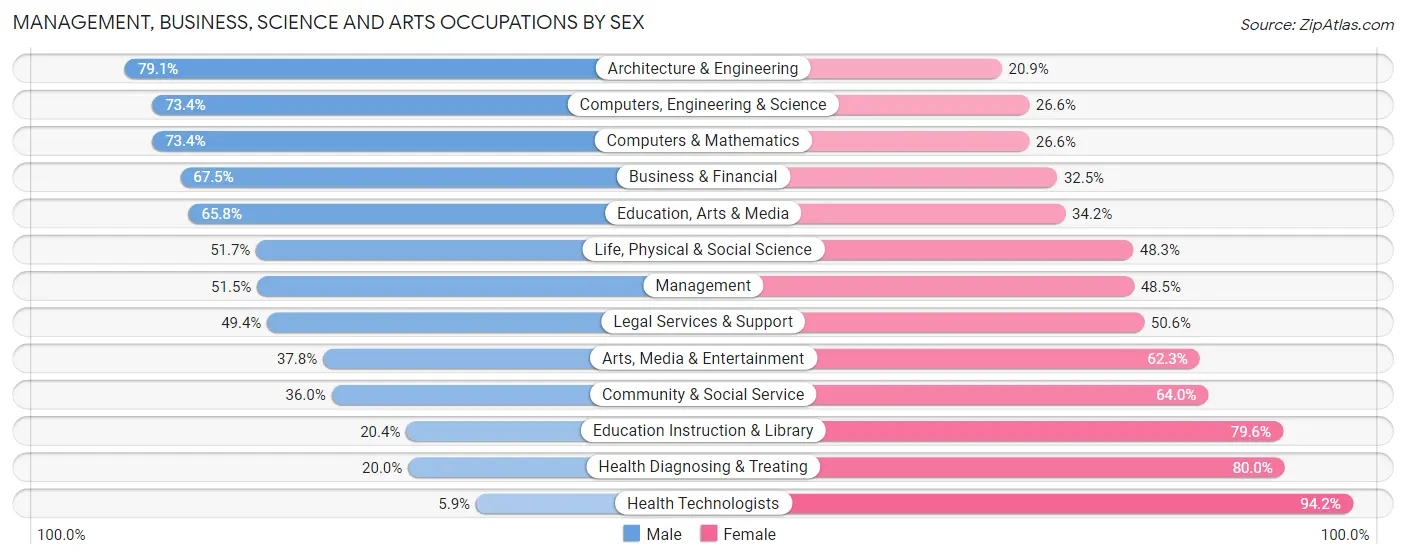
Management, Business, Science and Arts Occupations by Sex
Within the Management, Business, Science and Arts occupations in Herndon, the most male-oriented occupations are Architecture & Engineering (79.1%), Computers, Engineering & Science (73.4%), and Computers & Mathematics (73.4%), while the most female-oriented occupations are Health Technologists (94.2%), Health Diagnosing & Treating (80.0%), and Education Instruction & Library (79.6%).
| Occupation | Male | Female |
| Management | 1,018 (51.5%) | 959 (48.5%) |
| Business & Financial | 893 (67.5%) | 430 (32.5%) |
| Computers, Engineering & Science | 1,617 (73.4%) | 587 (26.6%) |
| Computers & Mathematics | 1,303 (73.4%) | 473 (26.6%) |
| Architecture & Engineering | 268 (79.1%) | 71 (20.9%) |
| Life, Physical & Social Science | 46 (51.7%) | 43 (48.3%) |
| Community & Social Service | 507 (36.0%) | 903 (64.0%) |
| Education, Arts & Media | 127 (65.8%) | 66 (34.2%) |
| Legal Services & Support | 122 (49.4%) | 125 (50.6%) |
| Education Instruction & Library | 127 (20.4%) | 496 (79.6%) |
| Arts, Media & Entertainment | 131 (37.8%) | 216 (62.3%) |
| Health Diagnosing & Treating | 67 (20.0%) | 268 (80.0%) |
| Health Technologists | 10 (5.9%) | 161 (94.2%) |
| Total (Category) | 4,102 (56.6%) | 3,147 (43.4%) |
| Total (Overall) | 8,524 (57.8%) | 6,213 (42.2%) |
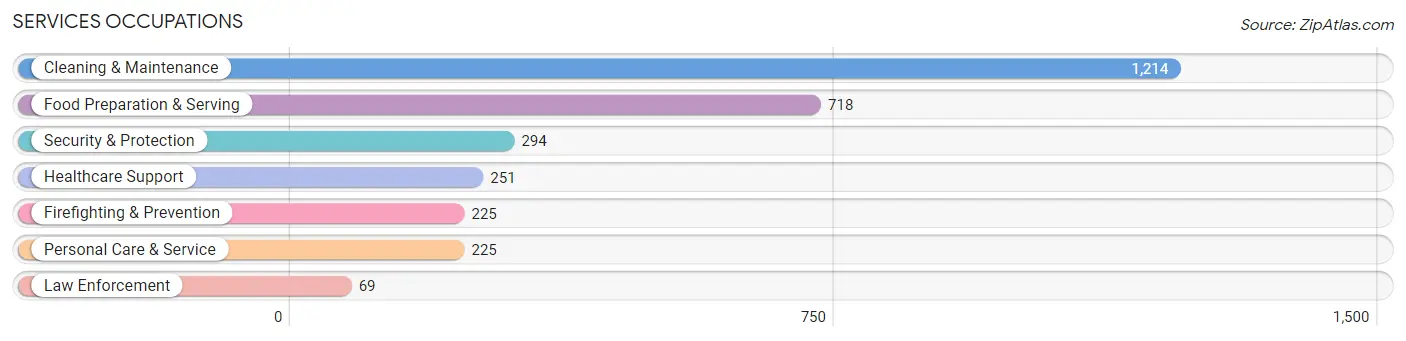
Services Occupations
The most common Services occupations in Herndon are Cleaning & Maintenance (1,214 | 8.2%), Food Preparation & Serving (718 | 4.9%), Security & Protection (294 | 2.0%), Healthcare Support (251 | 1.7%), and Firefighting & Prevention (225 | 1.5%).
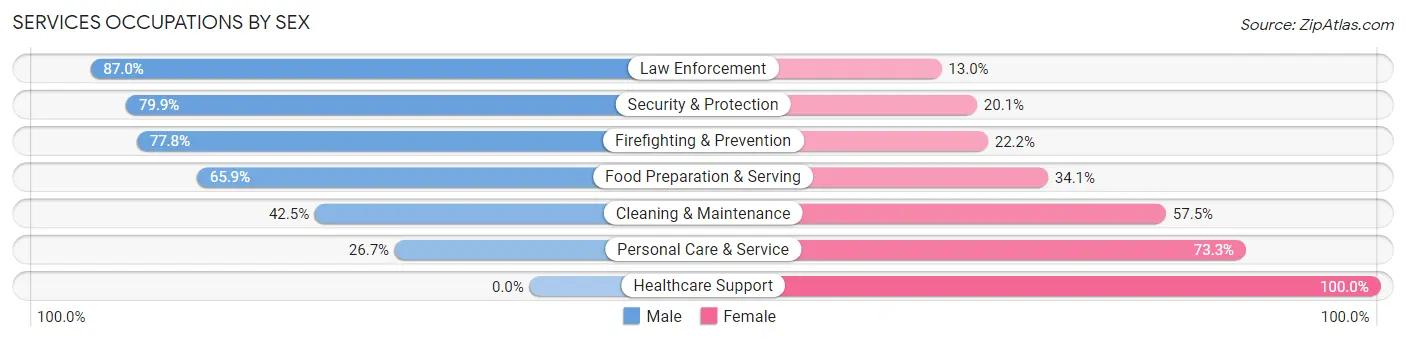
Services Occupations by Sex
Within the Services occupations in Herndon, the most male-oriented occupations are Law Enforcement (87.0%), Security & Protection (79.9%), and Firefighting & Prevention (77.8%), while the most female-oriented occupations are Healthcare Support (100.0%), Personal Care & Service (73.3%), and Cleaning & Maintenance (57.5%).
| Occupation | Male | Female |
| Healthcare Support | 0 (0.0%) | 251 (100.0%) |
| Security & Protection | 235 (79.9%) | 59 (20.1%) |
| Firefighting & Prevention | 175 (77.8%) | 50 (22.2%) |
| Law Enforcement | 60 (87.0%) | 9 (13.0%) |
| Food Preparation & Serving | 473 (65.9%) | 245 (34.1%) |
| Cleaning & Maintenance | 516 (42.5%) | 698 (57.5%) |
| Personal Care & Service | 60 (26.7%) | 165 (73.3%) |
| Total (Category) | 1,284 (47.5%) | 1,418 (52.5%) |
| Total (Overall) | 8,524 (57.8%) | 6,213 (42.2%) |
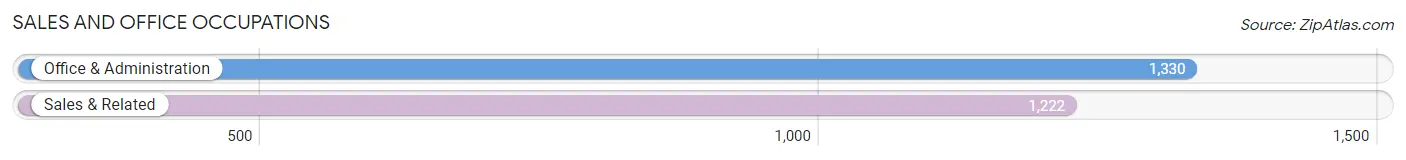
Sales and Office Occupations
The most common Sales and Office occupations in Herndon are Office & Administration (1,330 | 9.0%), and Sales & Related (1,222 | 8.3%).
Sales and Office Occupations by Sex
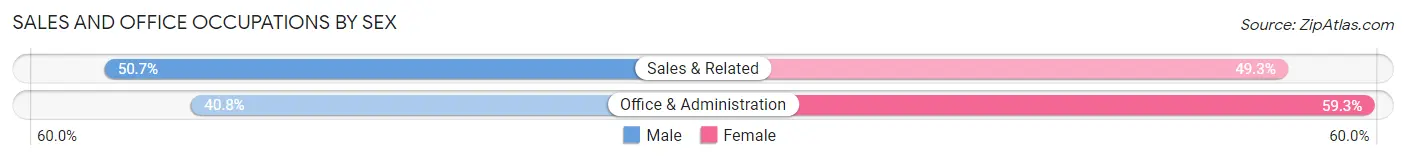
| Occupation | Male | Female |
| Sales & Related | 620 (50.7%) | 602 (49.3%) |
| Office & Administration | 542 (40.7%) | 788 (59.3%) |
| Total (Category) | 1,162 (45.5%) | 1,390 (54.5%) |
| Total (Overall) | 8,524 (57.8%) | 6,213 (42.2%) |
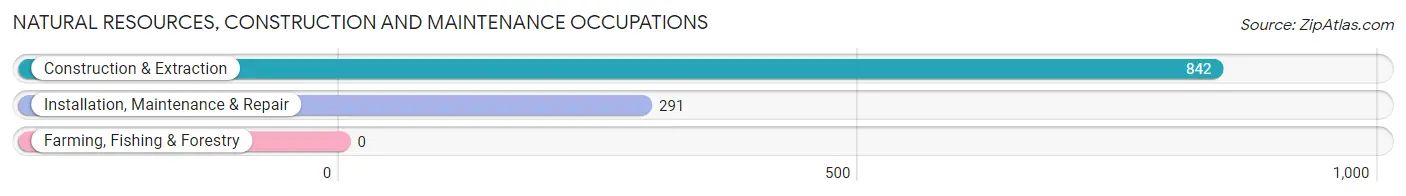
Natural Resources, Construction and Maintenance Occupations
The most common Natural Resources, Construction and Maintenance occupations in Herndon are Construction & Extraction (842 | 5.7%), and Installation, Maintenance & Repair (291 | 2.0%).
Natural Resources, Construction and Maintenance Occupations by Sex
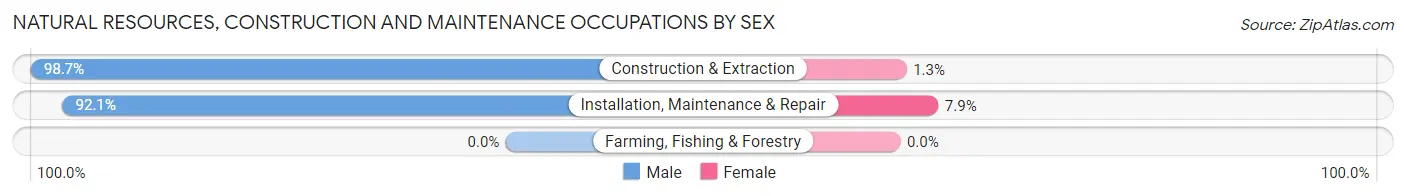
| Occupation | Male | Female |
| Farming, Fishing & Forestry | 0 (0.0%) | 0 (0.0%) |
| Construction & Extraction | 831 (98.7%) | 11 (1.3%) |
| Installation, Maintenance & Repair | 268 (92.1%) | 23 (7.9%) |
| Total (Category) | 1,099 (97.0%) | 34 (3.0%) |
| Total (Overall) | 8,524 (57.8%) | 6,213 (42.2%) |
Production, Transportation and Moving Occupations
The most common Production, Transportation and Moving occupations in Herndon are Material Moving (395 | 2.7%), Transportation (387 | 2.6%), and Production (319 | 2.2%).
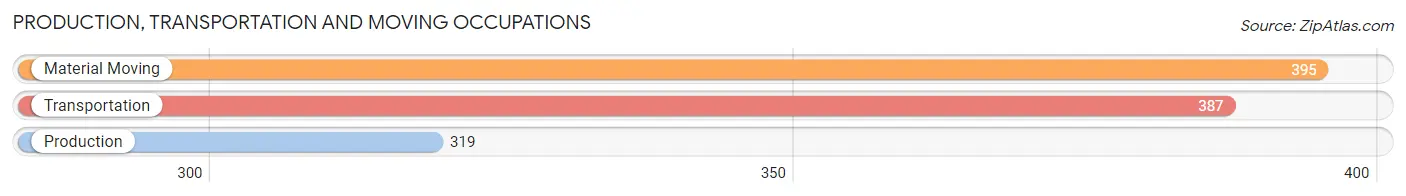
Production, Transportation and Moving Occupations by Sex
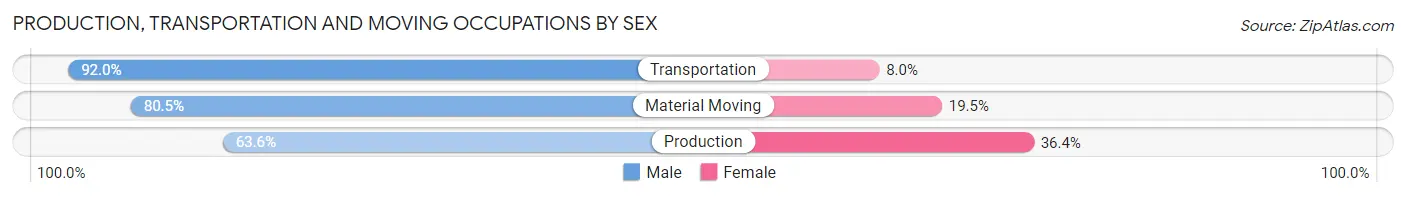
| Occupation | Male | Female |
| Production | 203 (63.6%) | 116 (36.4%) |
| Transportation | 356 (92.0%) | 31 (8.0%) |
| Material Moving | 318 (80.5%) | 77 (19.5%) |
| Total (Category) | 877 (79.6%) | 224 (20.3%) |
| Total (Overall) | 8,524 (57.8%) | 6,213 (42.2%) |
Employment Industries by Sex in Herndon
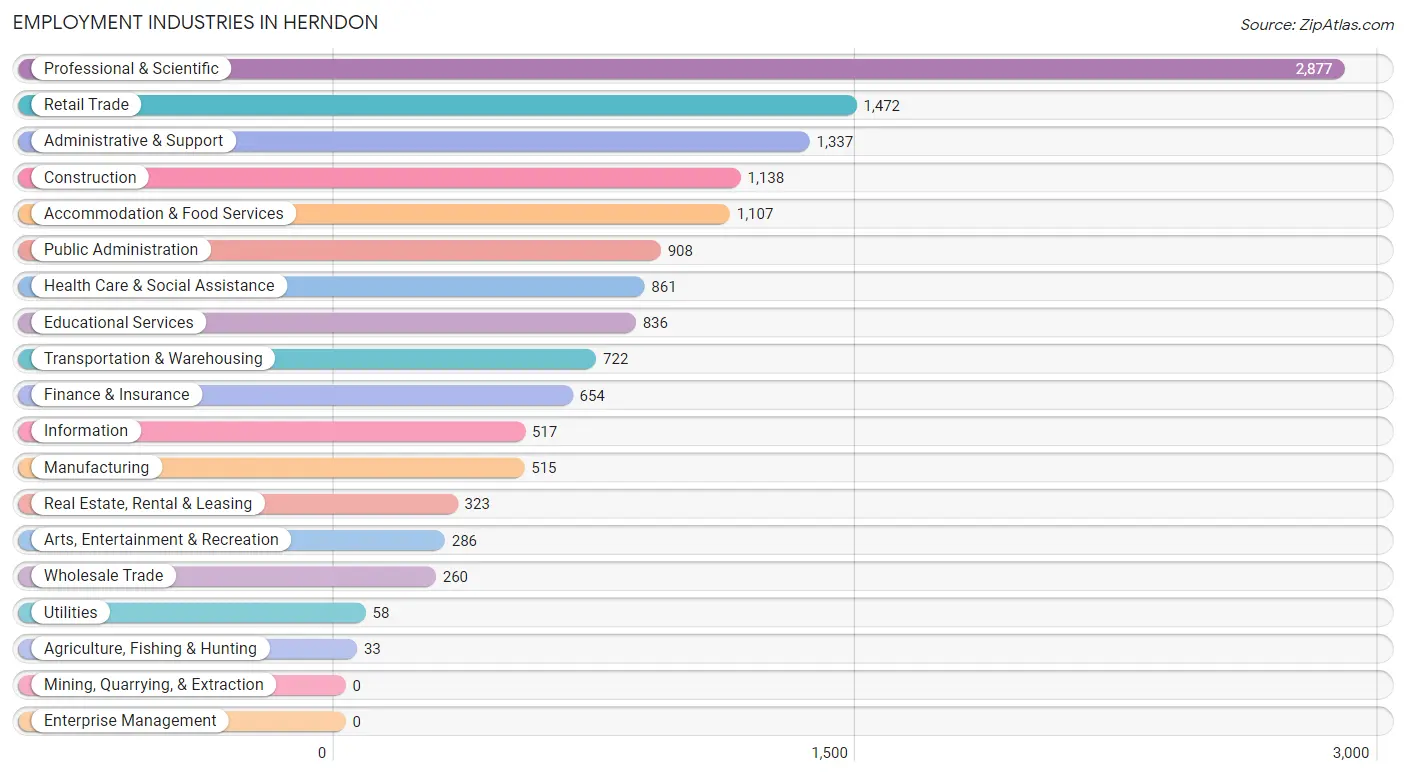
Employment Industries in Herndon
The major employment industries in Herndon include Professional & Scientific (2,877 | 19.5%), Retail Trade (1,472 | 10.0%), Administrative & Support (1,337 | 9.1%), Construction (1,138 | 7.7%), and Accommodation & Food Services (1,107 | 7.5%).
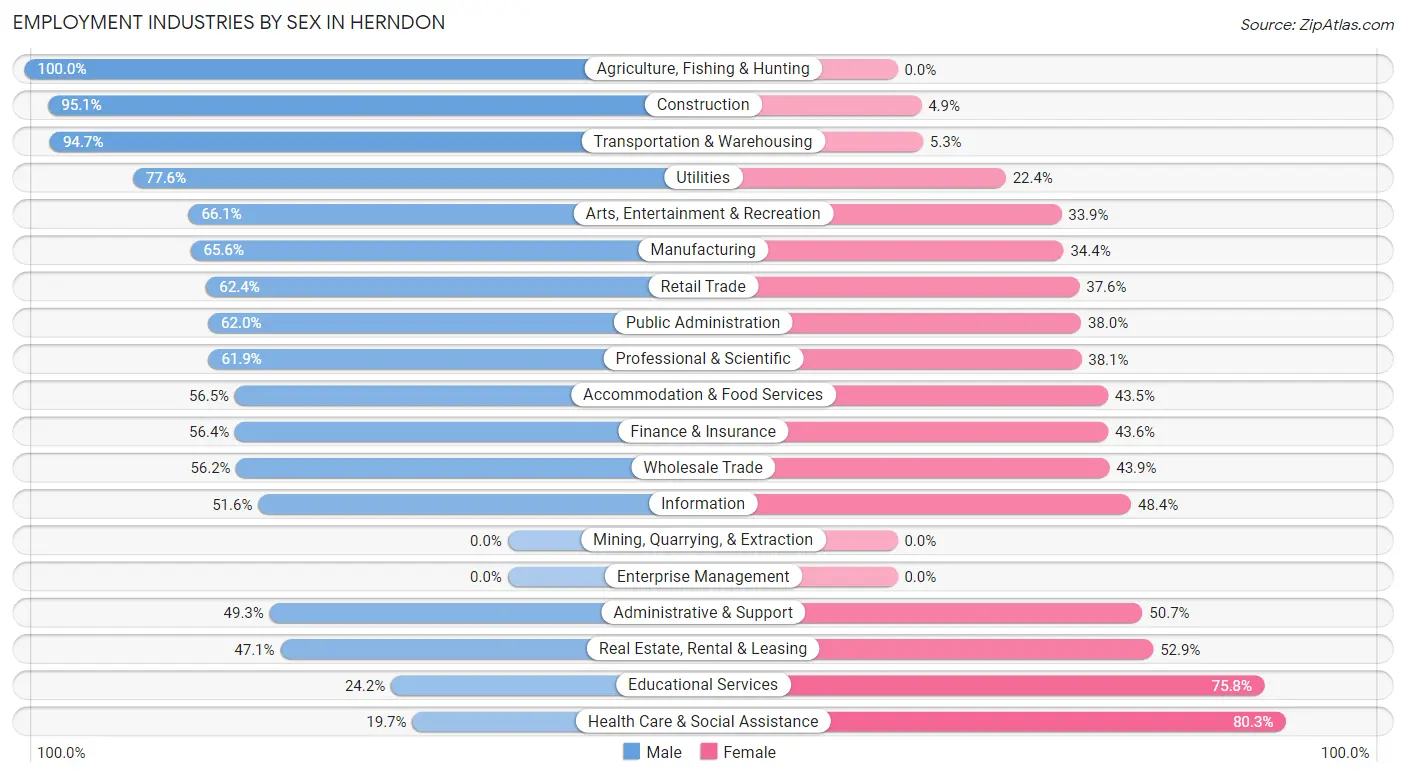
Employment Industries by Sex in Herndon
The Herndon industries that see more men than women are Agriculture, Fishing & Hunting (100.0%), Construction (95.1%), and Transportation & Warehousing (94.7%), whereas the industries that tend to have a higher number of women are Health Care & Social Assistance (80.3%), Educational Services (75.8%), and Real Estate, Rental & Leasing (52.9%).
| Industry | Male | Female |
| Agriculture, Fishing & Hunting | 33 (100.0%) | 0 (0.0%) |
| Mining, Quarrying, & Extraction | 0 (0.0%) | 0 (0.0%) |
| Construction | 1,082 (95.1%) | 56 (4.9%) |
| Manufacturing | 338 (65.6%) | 177 (34.4%) |
| Wholesale Trade | 146 (56.1%) | 114 (43.9%) |
| Retail Trade | 918 (62.4%) | 554 (37.6%) |
| Transportation & Warehousing | 684 (94.7%) | 38 (5.3%) |
| Utilities | 45 (77.6%) | 13 (22.4%) |
| Information | 267 (51.6%) | 250 (48.4%) |
| Finance & Insurance | 369 (56.4%) | 285 (43.6%) |
| Real Estate, Rental & Leasing | 152 (47.1%) | 171 (52.9%) |
| Professional & Scientific | 1,782 (61.9%) | 1,095 (38.1%) |
| Enterprise Management | 0 (0.0%) | 0 (0.0%) |
| Administrative & Support | 659 (49.3%) | 678 (50.7%) |
| Educational Services | 202 (24.2%) | 634 (75.8%) |
| Health Care & Social Assistance | 170 (19.7%) | 691 (80.3%) |
| Arts, Entertainment & Recreation | 189 (66.1%) | 97 (33.9%) |
| Accommodation & Food Services | 625 (56.5%) | 482 (43.5%) |
| Public Administration | 563 (62.0%) | 345 (38.0%) |
| Total | 8,524 (57.8%) | 6,213 (42.2%) |
Education in Herndon
School Enrollment in Herndon
The most common levels of schooling among the 6,342 students in Herndon are high school (1,397 | 22.0%), elementary school (1,274 | 20.1%), and college / undergraduate (1,249 | 19.7%).
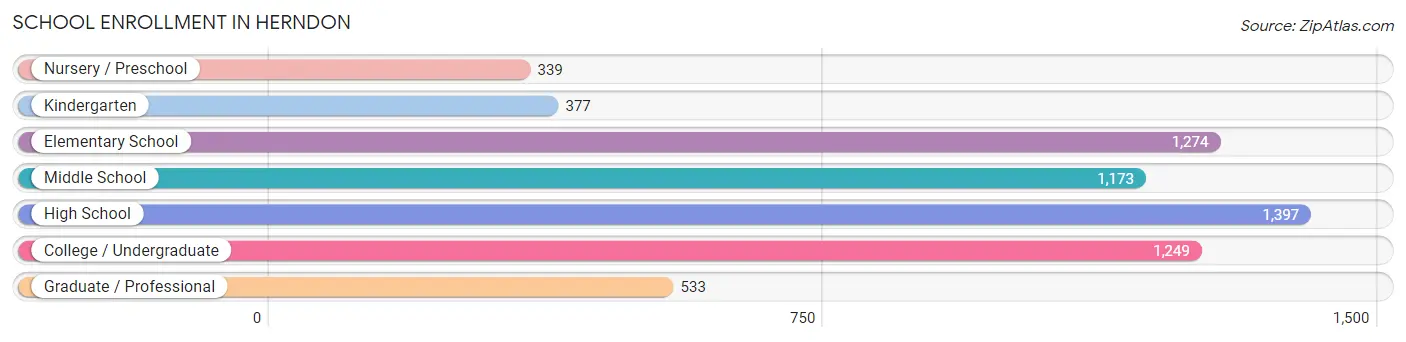
| School Level | # Students | % Students |
| Nursery / Preschool | 339 | 5.3% |
| Kindergarten | 377 | 5.9% |
| Elementary School | 1,274 | 20.1% |
| Middle School | 1,173 | 18.5% |
| High School | 1,397 | 22.0% |
| College / Undergraduate | 1,249 | 19.7% |
| Graduate / Professional | 533 | 8.4% |
| Total | 6,342 | 100.0% |
School Enrollment by Age by Funding Source in Herndon
Out of a total of 6,342 students who are enrolled in schools in Herndon, 1,503 (23.7%) attend a private institution, while the remaining 4,839 (76.3%) are enrolled in public schools. The age group of 3 to 4 year olds has the highest likelihood of being enrolled in private schools, with 263 (89.1% in the age bracket) enrolled. Conversely, the age group of 18 to 19 year olds has the lowest likelihood of being enrolled in a private school, with 347 (100.0% in the age bracket) attending a public institution.
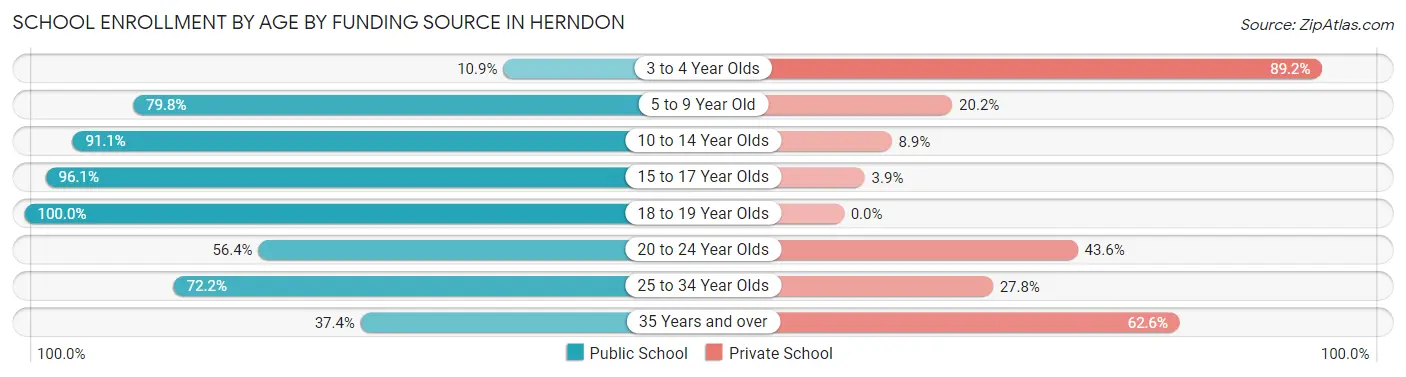
| Age Bracket | Public School | Private School |
| 3 to 4 Year Olds | 32 (10.8%) | 263 (89.1%) |
| 5 to 9 Year Old | 1,319 (79.8%) | 334 (20.2%) |
| 10 to 14 Year Olds | 1,328 (91.1%) | 130 (8.9%) |
| 15 to 17 Year Olds | 861 (96.1%) | 35 (3.9%) |
| 18 to 19 Year Olds | 347 (100.0%) | 0 (0.0%) |
| 20 to 24 Year Olds | 355 (56.4%) | 274 (43.6%) |
| 25 to 34 Year Olds | 419 (72.2%) | 161 (27.8%) |
| 35 Years and over | 181 (37.4%) | 303 (62.6%) |
| Total | 4,839 (76.3%) | 1,503 (23.7%) |
Educational Attainment by Field of Study in Herndon
Business (1,935 | 20.9%), engineering (1,252 | 13.5%), social sciences (1,109 | 12.0%), computers & mathematics (807 | 8.7%), and education (678 | 7.3%) are the most common fields of study among 9,251 individuals in Herndon who have obtained a bachelor's degree or higher.
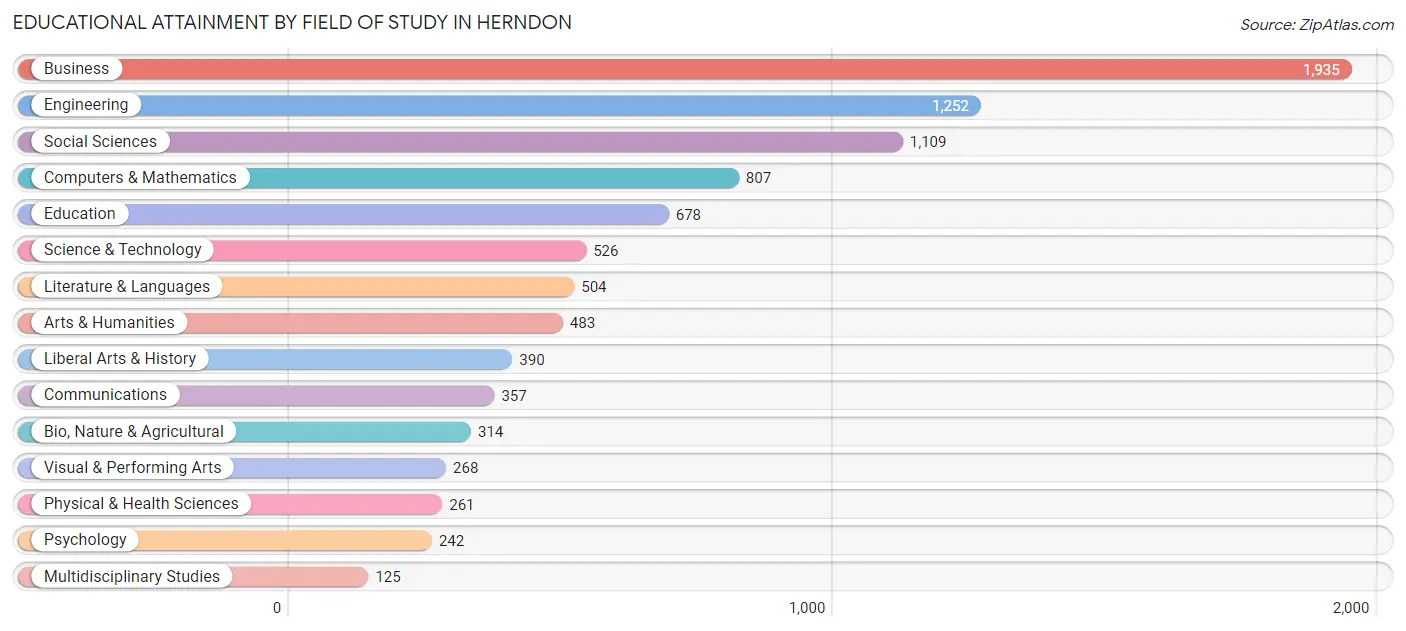
| Field of Study | # Graduates | % Graduates |
| Computers & Mathematics | 807 | 8.7% |
| Bio, Nature & Agricultural | 314 | 3.4% |
| Physical & Health Sciences | 261 | 2.8% |
| Psychology | 242 | 2.6% |
| Social Sciences | 1,109 | 12.0% |
| Engineering | 1,252 | 13.5% |
| Multidisciplinary Studies | 125 | 1.3% |
| Science & Technology | 526 | 5.7% |
| Business | 1,935 | 20.9% |
| Education | 678 | 7.3% |
| Literature & Languages | 504 | 5.4% |
| Liberal Arts & History | 390 | 4.2% |
| Visual & Performing Arts | 268 | 2.9% |
| Communications | 357 | 3.9% |
| Arts & Humanities | 483 | 5.2% |
| Total | 9,251 | 100.0% |
Transportation & Commute in Herndon
Vehicle Availability by Sex in Herndon
The most prevalent vehicle ownership categories in Herndon are males with 2 vehicles (3,490, accounting for 41.3%) and females with 2 vehicles (2,737, making up 57.7%).
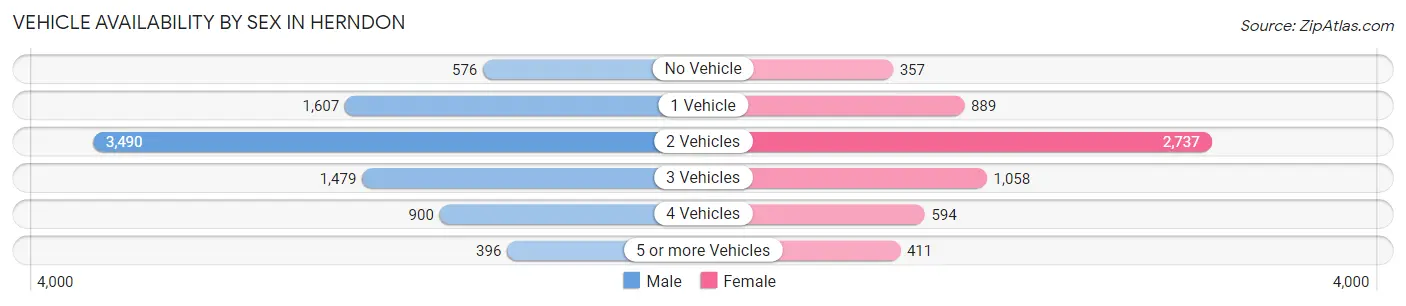
| Vehicles Available | Male | Female |
| No Vehicle | 576 (6.8%) | 357 (5.9%) |
| 1 Vehicle | 1,607 (19.0%) | 889 (14.7%) |
| 2 Vehicles | 3,490 (41.3%) | 2,737 (45.3%) |
| 3 Vehicles | 1,479 (17.5%) | 1,058 (17.5%) |
| 4 Vehicles | 900 (10.6%) | 594 (9.8%) |
| 5 or more Vehicles | 396 (4.7%) | 411 (6.8%) |
| Total | 8,448 (100.0%) | 6,046 (100.0%) |
Commute Time in Herndon
The most frequently occuring commute durations in Herndon are 15 to 19 minutes (2,284 commuters, 19.1%), 30 to 34 minutes (1,800 commuters, 15.0%), and 20 to 24 minutes (1,708 commuters, 14.3%).
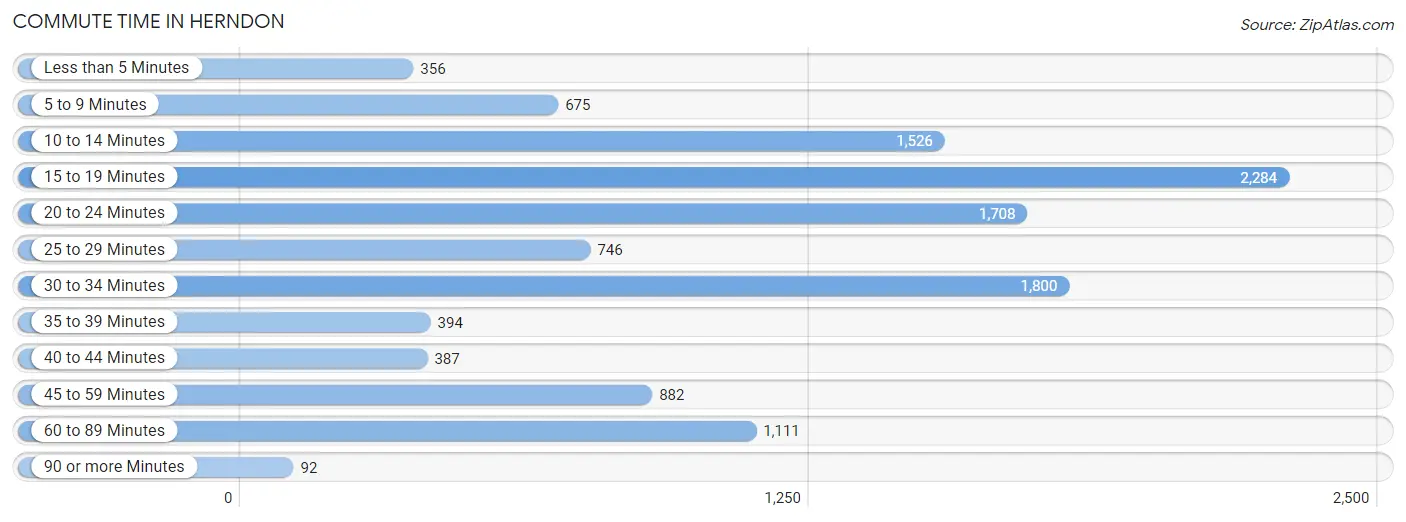
| Commute Time | # Commuters | % Commuters |
| Less than 5 Minutes | 356 | 3.0% |
| 5 to 9 Minutes | 675 | 5.6% |
| 10 to 14 Minutes | 1,526 | 12.8% |
| 15 to 19 Minutes | 2,284 | 19.1% |
| 20 to 24 Minutes | 1,708 | 14.3% |
| 25 to 29 Minutes | 746 | 6.2% |
| 30 to 34 Minutes | 1,800 | 15.0% |
| 35 to 39 Minutes | 394 | 3.3% |
| 40 to 44 Minutes | 387 | 3.2% |
| 45 to 59 Minutes | 882 | 7.4% |
| 60 to 89 Minutes | 1,111 | 9.3% |
| 90 or more Minutes | 92 | 0.8% |
Commute Time by Sex in Herndon
The most common commute times in Herndon are 15 to 19 minutes (1,382 commuters, 19.4%) for males and 15 to 19 minutes (902 commuters, 18.6%) for females.
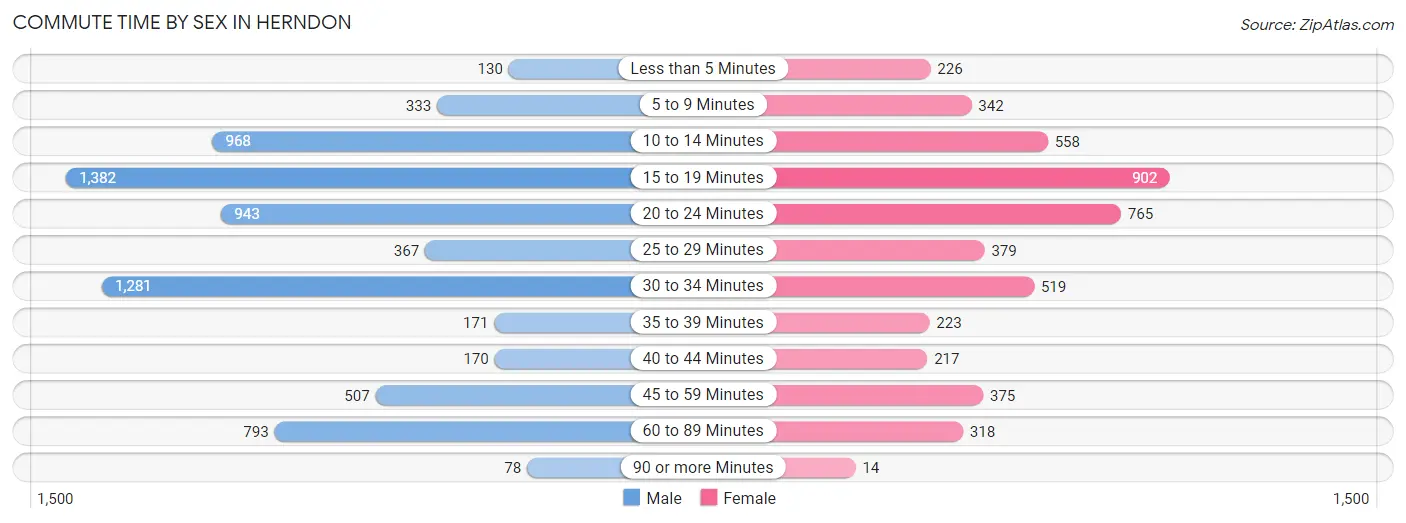
| Commute Time | Male | Female |
| Less than 5 Minutes | 130 (1.8%) | 226 (4.7%) |
| 5 to 9 Minutes | 333 (4.7%) | 342 (7.1%) |
| 10 to 14 Minutes | 968 (13.6%) | 558 (11.5%) |
| 15 to 19 Minutes | 1,382 (19.4%) | 902 (18.6%) |
| 20 to 24 Minutes | 943 (13.2%) | 765 (15.8%) |
| 25 to 29 Minutes | 367 (5.1%) | 379 (7.8%) |
| 30 to 34 Minutes | 1,281 (18.0%) | 519 (10.7%) |
| 35 to 39 Minutes | 171 (2.4%) | 223 (4.6%) |
| 40 to 44 Minutes | 170 (2.4%) | 217 (4.5%) |
| 45 to 59 Minutes | 507 (7.1%) | 375 (7.7%) |
| 60 to 89 Minutes | 793 (11.1%) | 318 (6.6%) |
| 90 or more Minutes | 78 (1.1%) | 14 (0.3%) |
Time of Departure to Work by Sex in Herndon
The most frequent times of departure to work in Herndon are 8:00 AM to 8:29 AM (993, 13.9%) for males and 7:30 AM to 7:59 AM (760, 15.7%) for females.
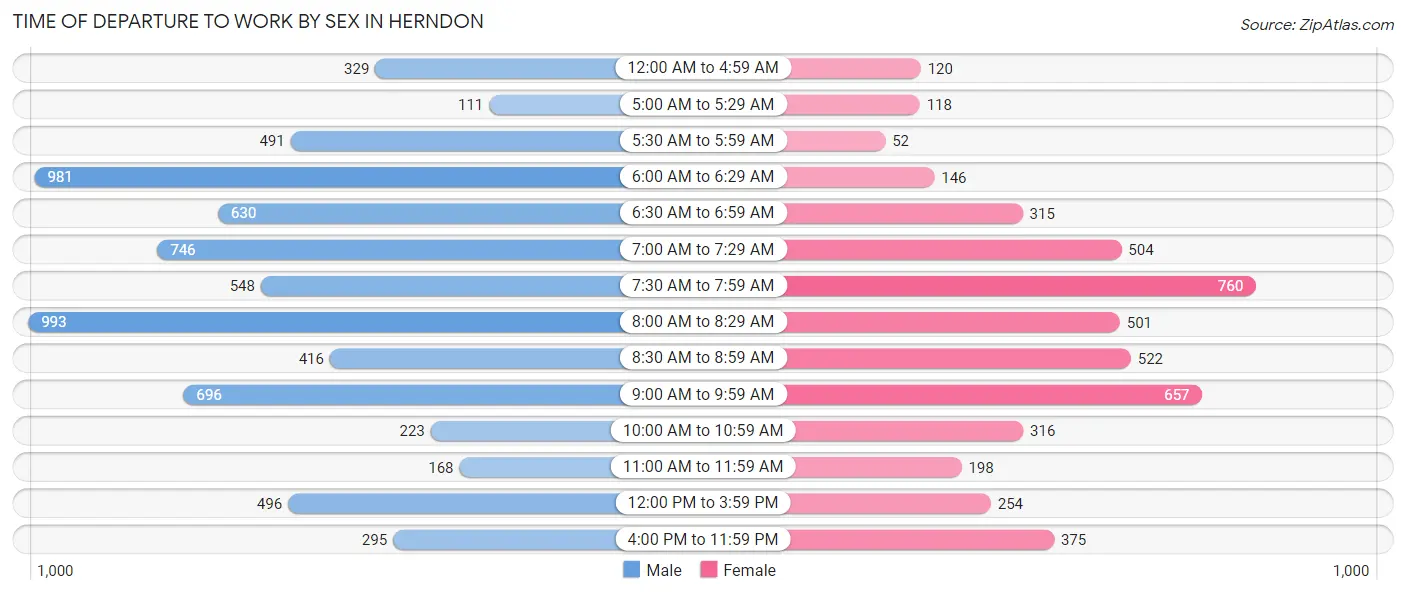
| Time of Departure | Male | Female |
| 12:00 AM to 4:59 AM | 329 (4.6%) | 120 (2.5%) |
| 5:00 AM to 5:29 AM | 111 (1.6%) | 118 (2.4%) |
| 5:30 AM to 5:59 AM | 491 (6.9%) | 52 (1.1%) |
| 6:00 AM to 6:29 AM | 981 (13.8%) | 146 (3.0%) |
| 6:30 AM to 6:59 AM | 630 (8.8%) | 315 (6.5%) |
| 7:00 AM to 7:29 AM | 746 (10.5%) | 504 (10.4%) |
| 7:30 AM to 7:59 AM | 548 (7.7%) | 760 (15.7%) |
| 8:00 AM to 8:29 AM | 993 (13.9%) | 501 (10.4%) |
| 8:30 AM to 8:59 AM | 416 (5.8%) | 522 (10.8%) |
| 9:00 AM to 9:59 AM | 696 (9.8%) | 657 (13.6%) |
| 10:00 AM to 10:59 AM | 223 (3.1%) | 316 (6.5%) |
| 11:00 AM to 11:59 AM | 168 (2.4%) | 198 (4.1%) |
| 12:00 PM to 3:59 PM | 496 (7.0%) | 254 (5.2%) |
| 4:00 PM to 11:59 PM | 295 (4.1%) | 375 (7.7%) |
| Total | 7,123 (100.0%) | 4,838 (100.0%) |
Housing Occupancy in Herndon
Occupancy by Ownership in Herndon
Of the total 7,897 dwellings in Herndon, owner-occupied units account for 5,101 (64.6%), while renter-occupied units make up 2,796 (35.4%).
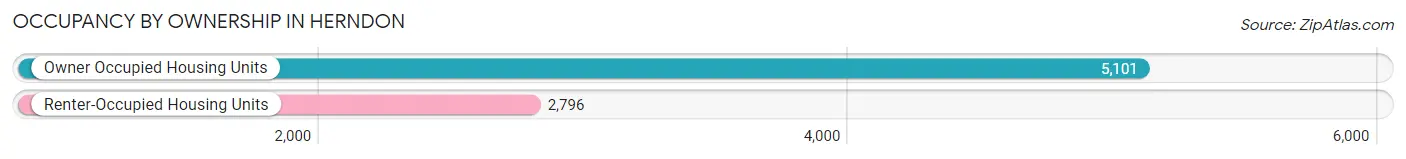
| Occupancy | # Housing Units | % Housing Units |
| Owner Occupied Housing Units | 5,101 | 64.6% |
| Renter-Occupied Housing Units | 2,796 | 35.4% |
| Total Occupied Housing Units | 7,897 | 100.0% |
Occupancy by Household Size in Herndon
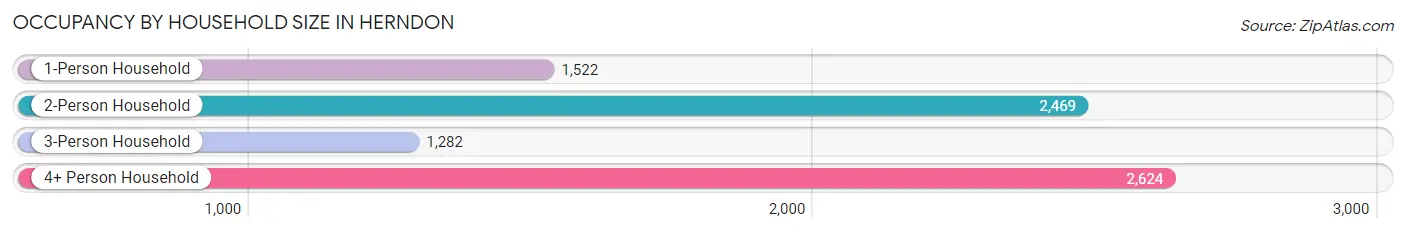
| Household Size | # Housing Units | % Housing Units |
| 1-Person Household | 1,522 | 19.3% |
| 2-Person Household | 2,469 | 31.3% |
| 3-Person Household | 1,282 | 16.2% |
| 4+ Person Household | 2,624 | 33.2% |
| Total Housing Units | 7,897 | 100.0% |
Occupancy by Ownership by Household Size in Herndon
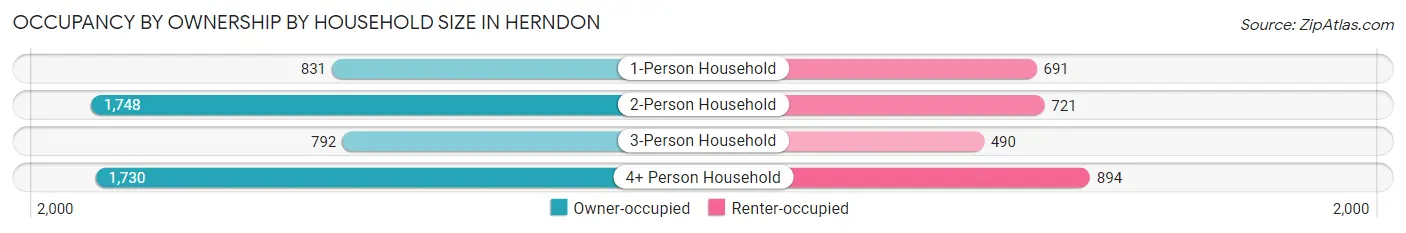
| Household Size | Owner-occupied | Renter-occupied |
| 1-Person Household | 831 (54.6%) | 691 (45.4%) |
| 2-Person Household | 1,748 (70.8%) | 721 (29.2%) |
| 3-Person Household | 792 (61.8%) | 490 (38.2%) |
| 4+ Person Household | 1,730 (65.9%) | 894 (34.1%) |
| Total Housing Units | 5,101 (64.6%) | 2,796 (35.4%) |
Occupancy by Educational Attainment in Herndon
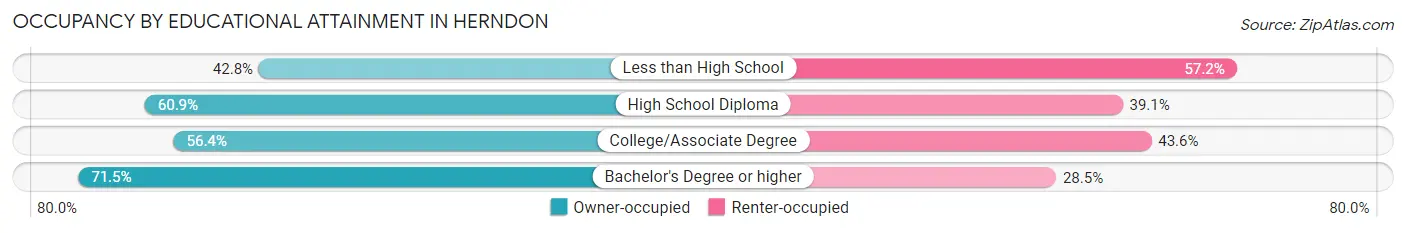
| Household Size | Owner-occupied | Renter-occupied |
| Less than High School | 401 (42.8%) | 535 (57.2%) |
| High School Diploma | 633 (60.9%) | 406 (39.1%) |
| College/Associate Degree | 620 (56.4%) | 480 (43.6%) |
| Bachelor's Degree or higher | 3,447 (71.5%) | 1,375 (28.5%) |
Occupancy by Age of Householder in Herndon
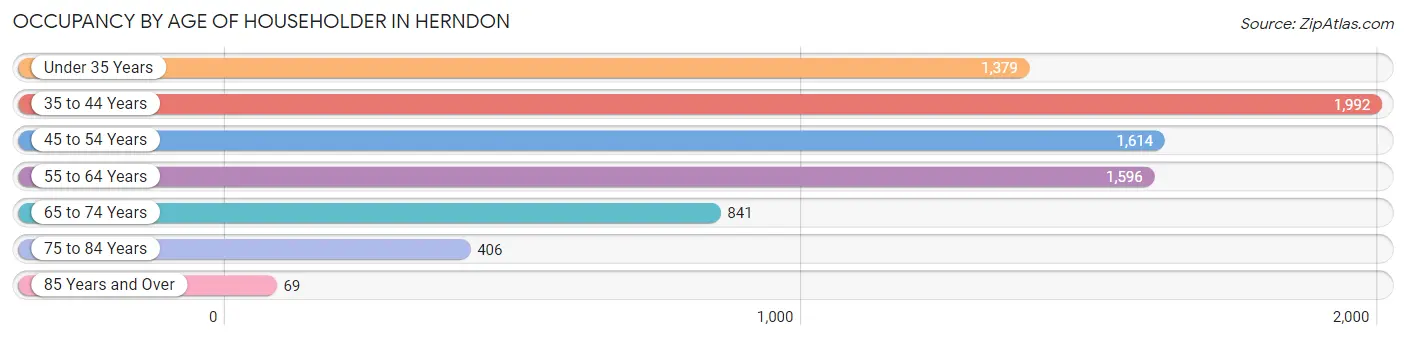
| Age Bracket | # Households | % Households |
| Under 35 Years | 1,379 | 17.5% |
| 35 to 44 Years | 1,992 | 25.2% |
| 45 to 54 Years | 1,614 | 20.4% |
| 55 to 64 Years | 1,596 | 20.2% |
| 65 to 74 Years | 841 | 10.6% |
| 75 to 84 Years | 406 | 5.1% |
| 85 Years and Over | 69 | 0.9% |
| Total | 7,897 | 100.0% |
Housing Finances in Herndon
Median Income by Occupancy in Herndon
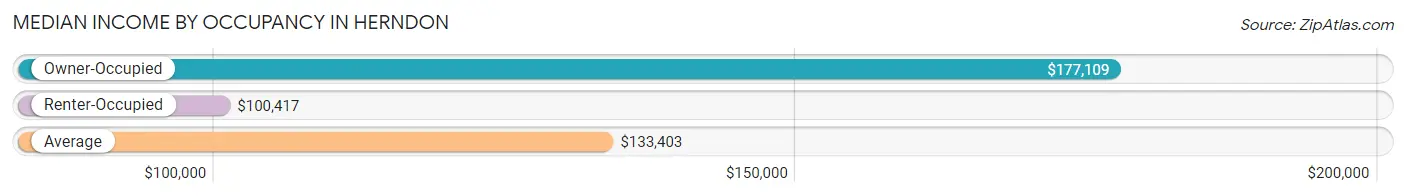
| Occupancy Type | # Households | Median Income |
| Owner-Occupied | 5,101 (64.6%) | $177,109 |
| Renter-Occupied | 2,796 (35.4%) | $100,417 |
| Average | 7,897 (100.0%) | $133,403 |
Occupancy by Householder Income Bracket in Herndon
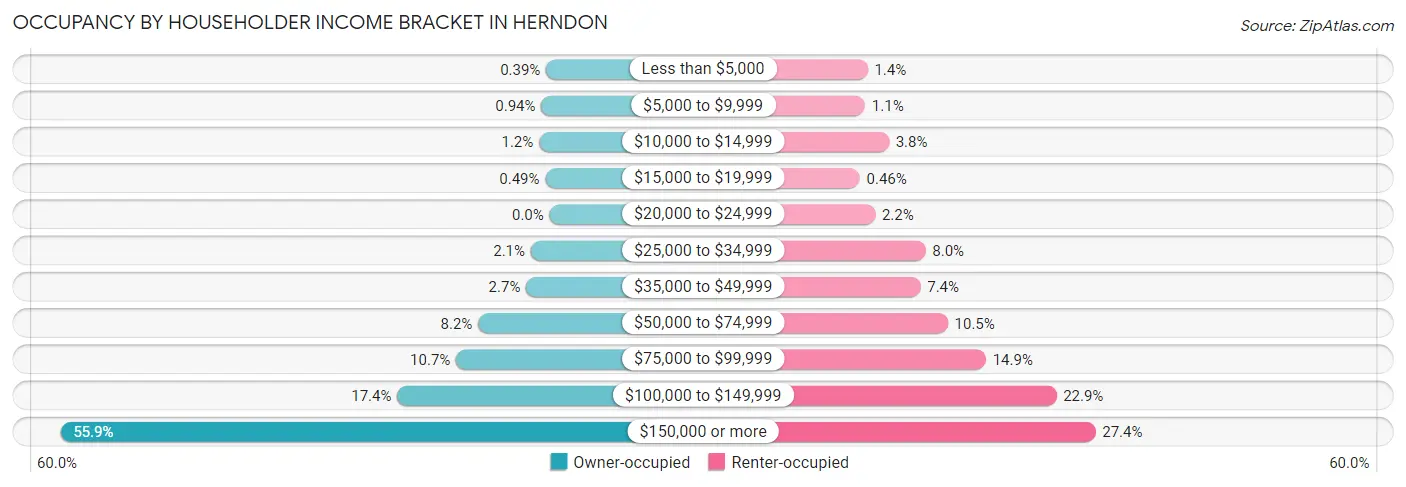
| Income Bracket | Owner-occupied | Renter-occupied |
| Less than $5,000 | 20 (0.4%) | 38 (1.4%) |
| $5,000 to $9,999 | 48 (0.9%) | 30 (1.1%) |
| $10,000 to $14,999 | 61 (1.2%) | 106 (3.8%) |
| $15,000 to $19,999 | 25 (0.5%) | 13 (0.5%) |
| $20,000 to $24,999 | 0 (0.0%) | 62 (2.2%) |
| $25,000 to $34,999 | 109 (2.1%) | 223 (8.0%) |
| $35,000 to $49,999 | 136 (2.7%) | 207 (7.4%) |
| $50,000 to $74,999 | 416 (8.2%) | 294 (10.5%) |
| $75,000 to $99,999 | 545 (10.7%) | 416 (14.9%) |
| $100,000 to $149,999 | 888 (17.4%) | 641 (22.9%) |
| $150,000 or more | 2,853 (55.9%) | 766 (27.4%) |
| Total | 5,101 (100.0%) | 2,796 (100.0%) |
Monthly Housing Cost Tiers in Herndon
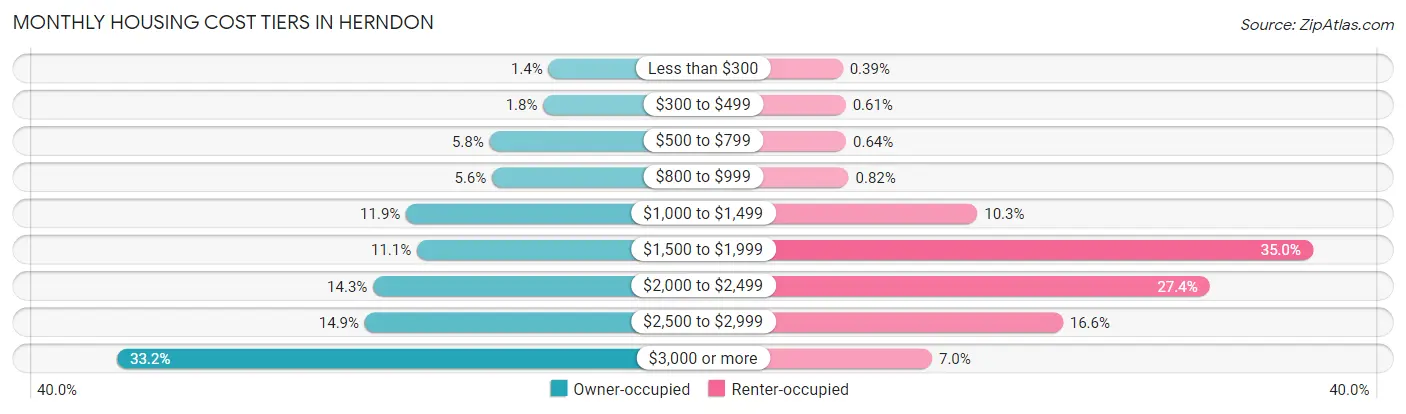
| Monthly Cost | Owner-occupied | Renter-occupied |
| Less than $300 | 72 (1.4%) | 11 (0.4%) |
| $300 to $499 | 92 (1.8%) | 17 (0.6%) |
| $500 to $799 | 294 (5.8%) | 18 (0.6%) |
| $800 to $999 | 284 (5.6%) | 23 (0.8%) |
| $1,000 to $1,499 | 607 (11.9%) | 288 (10.3%) |
| $1,500 to $1,999 | 566 (11.1%) | 979 (35.0%) |
| $2,000 to $2,499 | 731 (14.3%) | 766 (27.4%) |
| $2,500 to $2,999 | 762 (14.9%) | 464 (16.6%) |
| $3,000 or more | 1,693 (33.2%) | 195 (7.0%) |
| Total | 5,101 (100.0%) | 2,796 (100.0%) |
Physical Housing Characteristics in Herndon
Housing Structures in Herndon
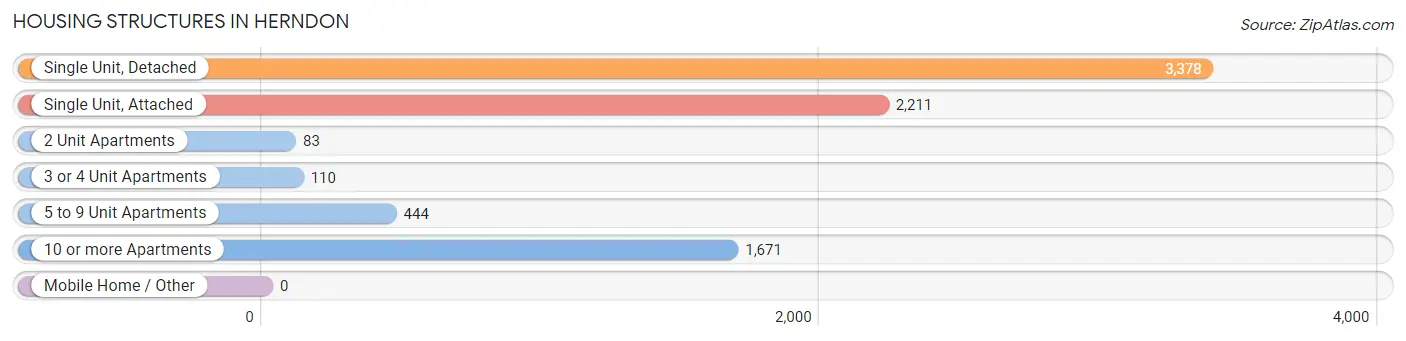
| Structure Type | # Housing Units | % Housing Units |
| Single Unit, Detached | 3,378 | 42.8% |
| Single Unit, Attached | 2,211 | 28.0% |
| 2 Unit Apartments | 83 | 1.1% |
| 3 or 4 Unit Apartments | 110 | 1.4% |
| 5 to 9 Unit Apartments | 444 | 5.6% |
| 10 or more Apartments | 1,671 | 21.2% |
| Mobile Home / Other | 0 | 0.0% |
| Total | 7,897 | 100.0% |
Housing Structures by Occupancy in Herndon
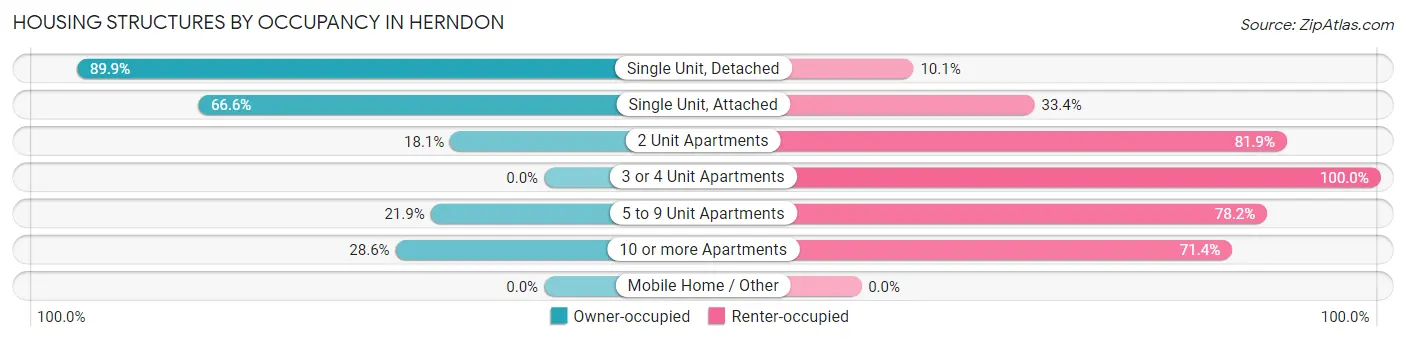
| Structure Type | Owner-occupied | Renter-occupied |
| Single Unit, Detached | 3,038 (89.9%) | 340 (10.1%) |
| Single Unit, Attached | 1,473 (66.6%) | 738 (33.4%) |
| 2 Unit Apartments | 15 (18.1%) | 68 (81.9%) |
| 3 or 4 Unit Apartments | 0 (0.0%) | 110 (100.0%) |
| 5 to 9 Unit Apartments | 97 (21.8%) | 347 (78.1%) |
| 10 or more Apartments | 478 (28.6%) | 1,193 (71.4%) |
| Mobile Home / Other | 0 (0.0%) | 0 (0.0%) |
| Total | 5,101 (64.6%) | 2,796 (35.4%) |
Housing Structures by Number of Rooms in Herndon
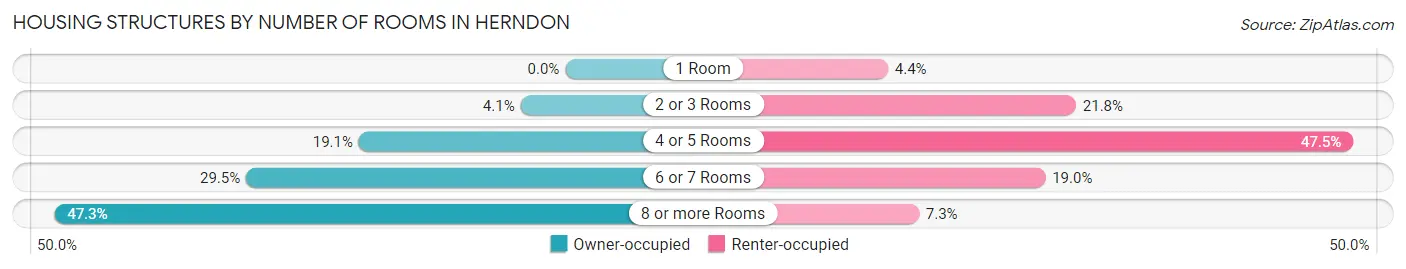
| Number of Rooms | Owner-occupied | Renter-occupied |
| 1 Room | 0 (0.0%) | 124 (4.4%) |
| 2 or 3 Rooms | 211 (4.1%) | 610 (21.8%) |
| 4 or 5 Rooms | 974 (19.1%) | 1,327 (47.5%) |
| 6 or 7 Rooms | 1,506 (29.5%) | 531 (19.0%) |
| 8 or more Rooms | 2,410 (47.2%) | 204 (7.3%) |
| Total | 5,101 (100.0%) | 2,796 (100.0%) |
Housing Structure by Heating Type in Herndon
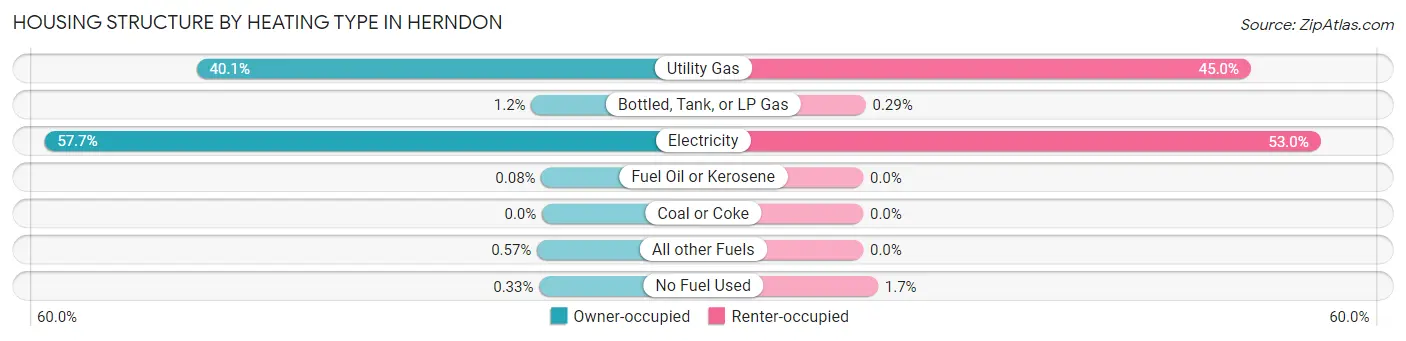
| Heating Type | Owner-occupied | Renter-occupied |
| Utility Gas | 2,044 (40.1%) | 1,257 (45.0%) |
| Bottled, Tank, or LP Gas | 63 (1.2%) | 8 (0.3%) |
| Electricity | 2,944 (57.7%) | 1,483 (53.0%) |
| Fuel Oil or Kerosene | 4 (0.1%) | 0 (0.0%) |
| Coal or Coke | 0 (0.0%) | 0 (0.0%) |
| All other Fuels | 29 (0.6%) | 0 (0.0%) |
| No Fuel Used | 17 (0.3%) | 48 (1.7%) |
| Total | 5,101 (100.0%) | 2,796 (100.0%) |
Household Vehicle Usage in Herndon
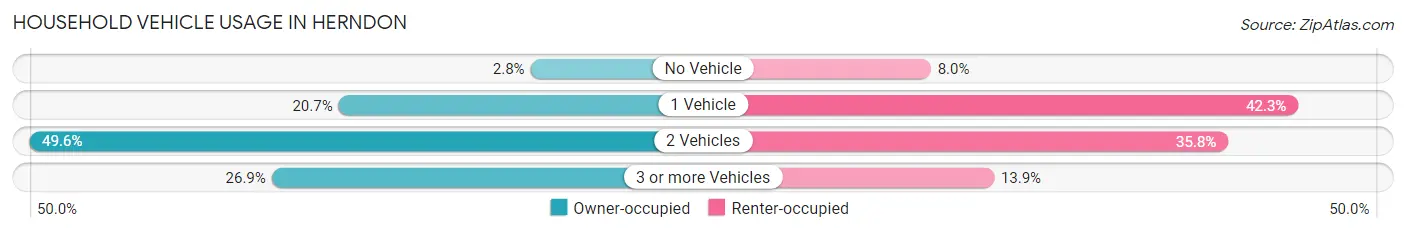
| Vehicles per Household | Owner-occupied | Renter-occupied |
| No Vehicle | 142 (2.8%) | 224 (8.0%) |
| 1 Vehicle | 1,056 (20.7%) | 1,183 (42.3%) |
| 2 Vehicles | 2,529 (49.6%) | 1,000 (35.8%) |
| 3 or more Vehicles | 1,374 (26.9%) | 389 (13.9%) |
| Total | 5,101 (100.0%) | 2,796 (100.0%) |
Real Estate & Mortgages in Herndon
Real Estate and Mortgage Overview in Herndon
| Characteristic | Without Mortgage | With Mortgage |
| Housing Units | 1,089 | 4,012 |
| Median Property Value | $538,900 | $519,100 |
| Median Household Income | $104,792 | $2,379 |
| Monthly Housing Costs | $868 | $1,693 |
| Real Estate Taxes | $6,216 | $161 |
Property Value by Mortgage Status in Herndon
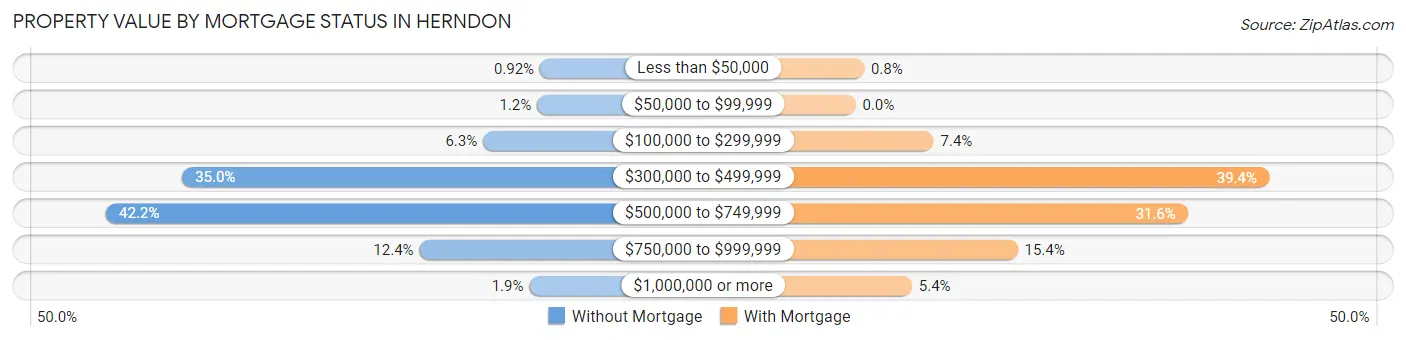
| Property Value | Without Mortgage | With Mortgage |
| Less than $50,000 | 10 (0.9%) | 32 (0.8%) |
| $50,000 to $99,999 | 13 (1.2%) | 0 (0.0%) |
| $100,000 to $299,999 | 69 (6.3%) | 298 (7.4%) |
| $300,000 to $499,999 | 381 (35.0%) | 1,579 (39.4%) |
| $500,000 to $749,999 | 460 (42.2%) | 1,269 (31.6%) |
| $750,000 to $999,999 | 135 (12.4%) | 619 (15.4%) |
| $1,000,000 or more | 21 (1.9%) | 215 (5.4%) |
| Total | 1,089 (100.0%) | 4,012 (100.0%) |
Household Income by Mortgage Status in Herndon
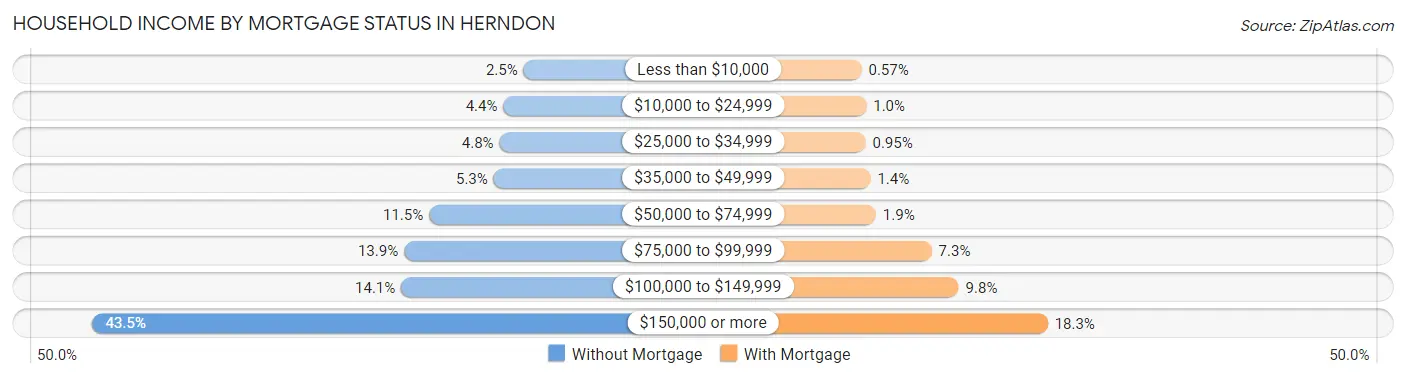
| Household Income | Without Mortgage | With Mortgage |
| Less than $10,000 | 27 (2.5%) | 23 (0.6%) |
| $10,000 to $24,999 | 48 (4.4%) | 41 (1.0%) |
| $25,000 to $34,999 | 52 (4.8%) | 38 (0.9%) |
| $35,000 to $49,999 | 58 (5.3%) | 57 (1.4%) |
| $50,000 to $74,999 | 125 (11.5%) | 78 (1.9%) |
| $75,000 to $99,999 | 151 (13.9%) | 291 (7.2%) |
| $100,000 to $149,999 | 154 (14.1%) | 394 (9.8%) |
| $150,000 or more | 474 (43.5%) | 734 (18.3%) |
| Total | 1,089 (100.0%) | 4,012 (100.0%) |
Property Value to Household Income Ratio in Herndon
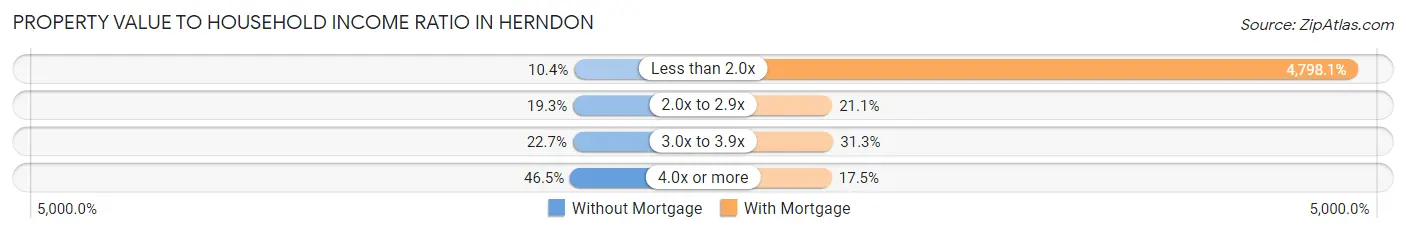
| Value-to-Income Ratio | Without Mortgage | With Mortgage |
| Less than 2.0x | 113 (10.4%) | 192,500 (4,798.1%) |
| 2.0x to 2.9x | 210 (19.3%) | 847 (21.1%) |
| 3.0x to 3.9x | 247 (22.7%) | 1,255 (31.3%) |
| 4.0x or more | 506 (46.5%) | 703 (17.5%) |
| Total | 1,089 (100.0%) | 4,012 (100.0%) |
Real Estate Taxes by Mortgage Status in Herndon
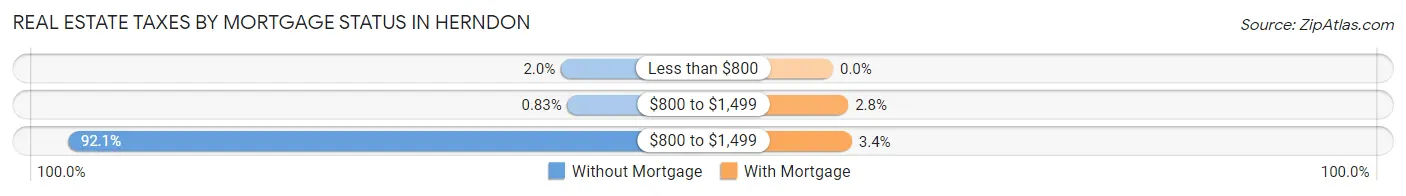
| Property Taxes | Without Mortgage | With Mortgage |
| Less than $800 | 22 (2.0%) | 0 (0.0%) |
| $800 to $1,499 | 9 (0.8%) | 111 (2.8%) |
| $800 to $1,499 | 1,003 (92.1%) | 138 (3.4%) |
| Total | 1,089 (100.0%) | 4,012 (100.0%) |
Health & Disability in Herndon
Health Insurance Coverage by Age in Herndon
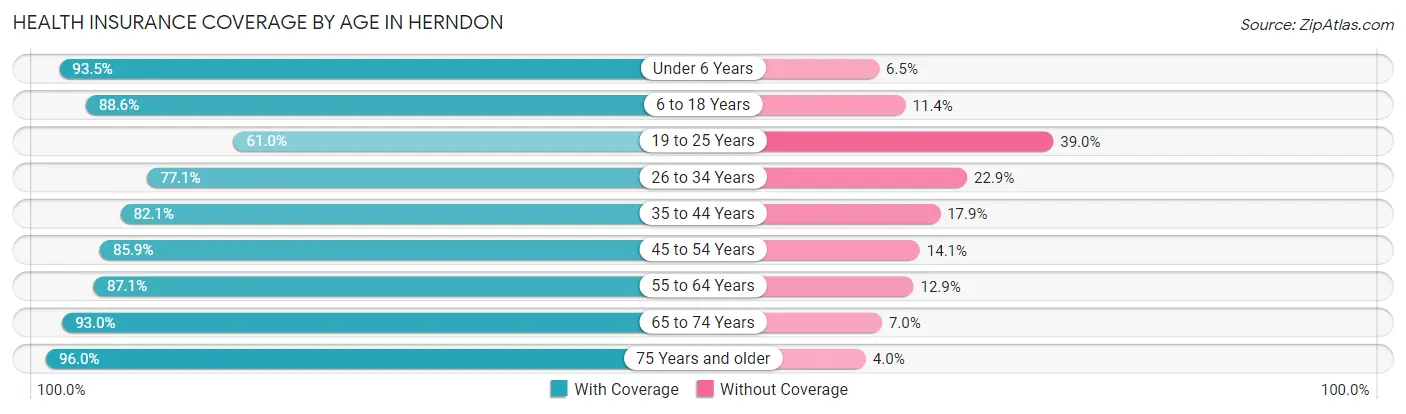
| Age Bracket | With Coverage | Without Coverage |
| Under 6 Years | 1,914 (93.5%) | 133 (6.5%) |
| 6 to 18 Years | 3,780 (88.6%) | 488 (11.4%) |
| 19 to 25 Years | 1,406 (61.0%) | 898 (39.0%) |
| 26 to 34 Years | 2,581 (77.1%) | 766 (22.9%) |
| 35 to 44 Years | 3,264 (82.1%) | 711 (17.9%) |
| 45 to 54 Years | 2,664 (85.9%) | 437 (14.1%) |
| 55 to 64 Years | 2,482 (87.1%) | 368 (12.9%) |
| 65 to 74 Years | 1,524 (93.0%) | 115 (7.0%) |
| 75 Years and older | 858 (96.0%) | 36 (4.0%) |
| Total | 20,473 (83.8%) | 3,952 (16.2%) |
Health Insurance Coverage by Citizenship Status in Herndon
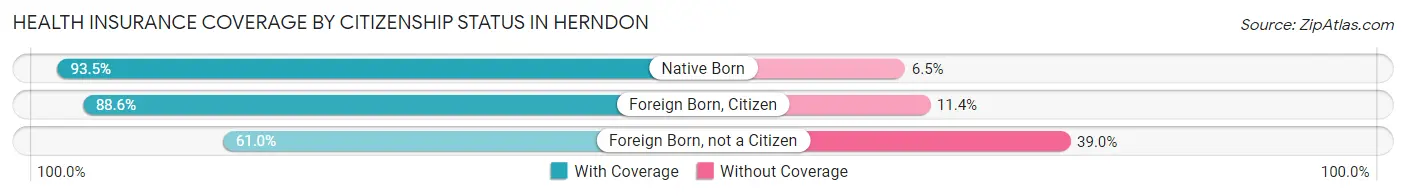
| Citizenship Status | With Coverage | Without Coverage |
| Native Born | 1,914 (93.5%) | 133 (6.5%) |
| Foreign Born, Citizen | 3,780 (88.6%) | 488 (11.4%) |
| Foreign Born, not a Citizen | 1,406 (61.0%) | 898 (39.0%) |
Health Insurance Coverage by Household Income in Herndon
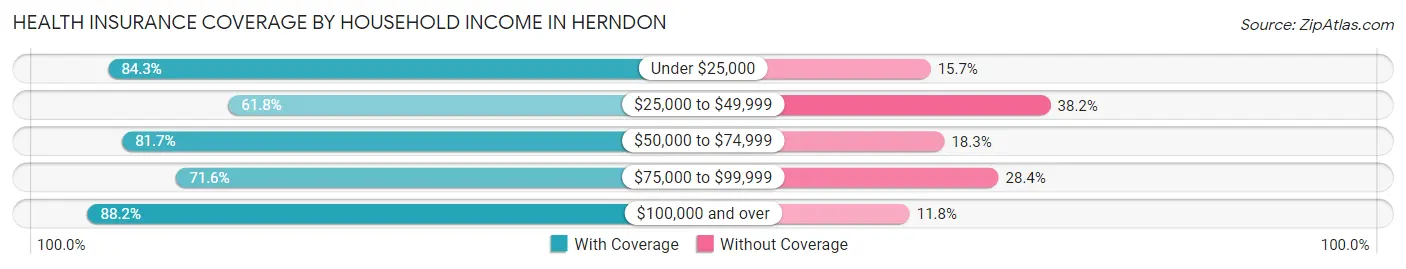
| Household Income | With Coverage | Without Coverage |
| Under $25,000 | 729 (84.3%) | 136 (15.7%) |
| $25,000 to $49,999 | 1,123 (61.8%) | 694 (38.2%) |
| $50,000 to $74,999 | 1,402 (81.7%) | 314 (18.3%) |
| $75,000 to $99,999 | 1,910 (71.6%) | 759 (28.4%) |
| $100,000 and over | 15,295 (88.2%) | 2,049 (11.8%) |
Public vs Private Health Insurance Coverage by Age in Herndon
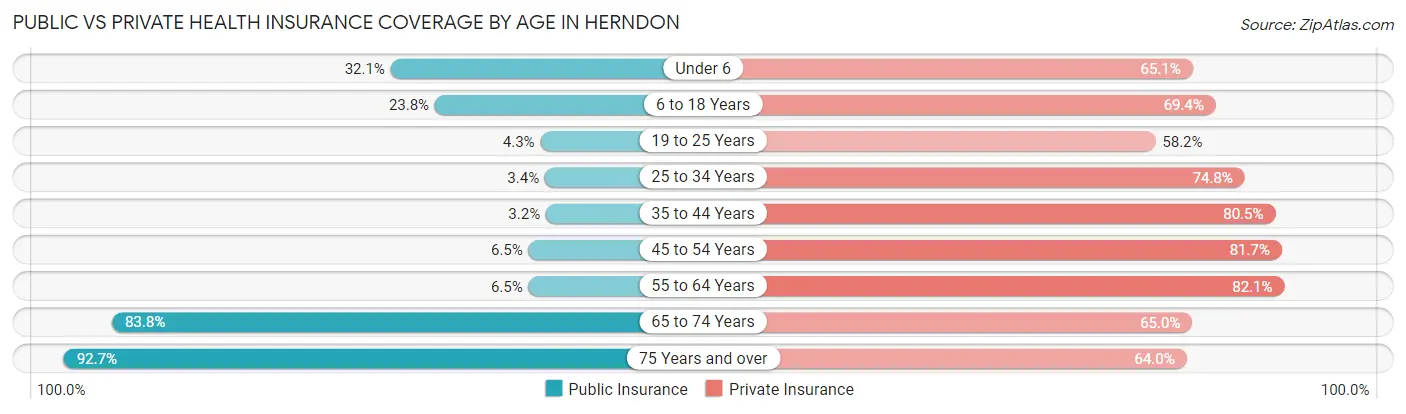
| Age Bracket | Public Insurance | Private Insurance |
| Under 6 | 656 (32.1%) | 1,333 (65.1%) |
| 6 to 18 Years | 1,017 (23.8%) | 2,962 (69.4%) |
| 19 to 25 Years | 98 (4.3%) | 1,341 (58.2%) |
| 25 to 34 Years | 114 (3.4%) | 2,503 (74.8%) |
| 35 to 44 Years | 128 (3.2%) | 3,198 (80.4%) |
| 45 to 54 Years | 200 (6.5%) | 2,532 (81.7%) |
| 55 to 64 Years | 184 (6.5%) | 2,341 (82.1%) |
| 65 to 74 Years | 1,373 (83.8%) | 1,066 (65.0%) |
| 75 Years and over | 829 (92.7%) | 572 (64.0%) |
| Total | 4,599 (18.8%) | 17,848 (73.1%) |
Disability Status by Sex by Age in Herndon
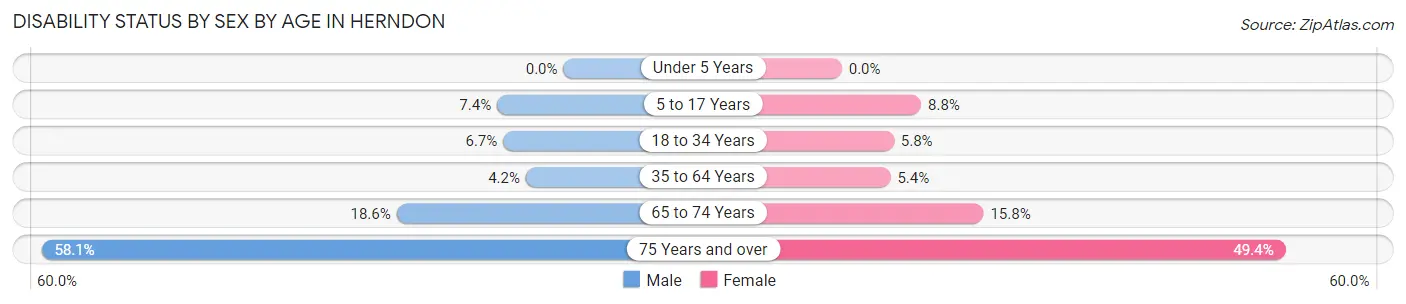
| Age Bracket | Male | Female |
| Under 5 Years | 0 (0.0%) | 0 (0.0%) |
| 5 to 17 Years | 148 (7.4%) | 194 (8.8%) |
| 18 to 34 Years | 224 (6.7%) | 154 (5.8%) |
| 35 to 64 Years | 223 (4.2%) | 249 (5.4%) |
| 65 to 74 Years | 162 (18.6%) | 121 (15.8%) |
| 75 Years and over | 222 (58.1%) | 253 (49.4%) |
Disability Class by Sex by Age in Herndon
Disability Class: Hearing Difficulty
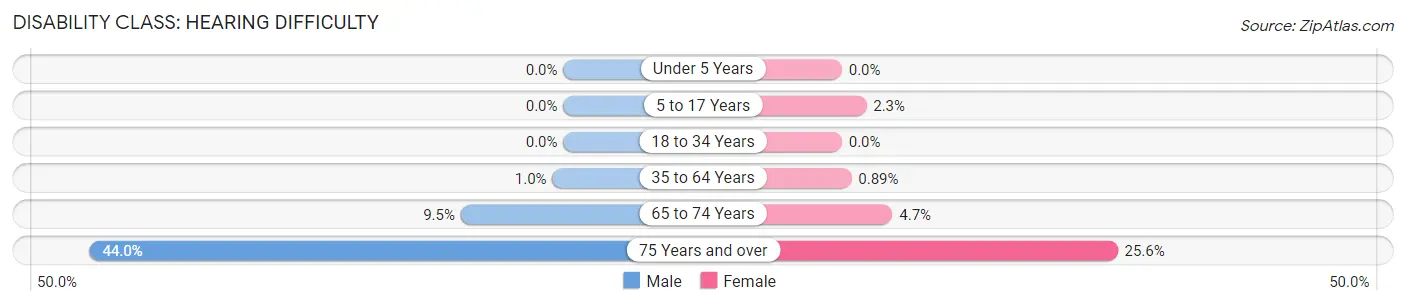
| Age Bracket | Male | Female |
| Under 5 Years | 0 (0.0%) | 0 (0.0%) |
| 5 to 17 Years | 0 (0.0%) | 50 (2.3%) |
| 18 to 34 Years | 0 (0.0%) | 0 (0.0%) |
| 35 to 64 Years | 54 (1.0%) | 41 (0.9%) |
| 65 to 74 Years | 83 (9.5%) | 36 (4.7%) |
| 75 Years and over | 168 (44.0%) | 131 (25.6%) |
Disability Class: Vision Difficulty
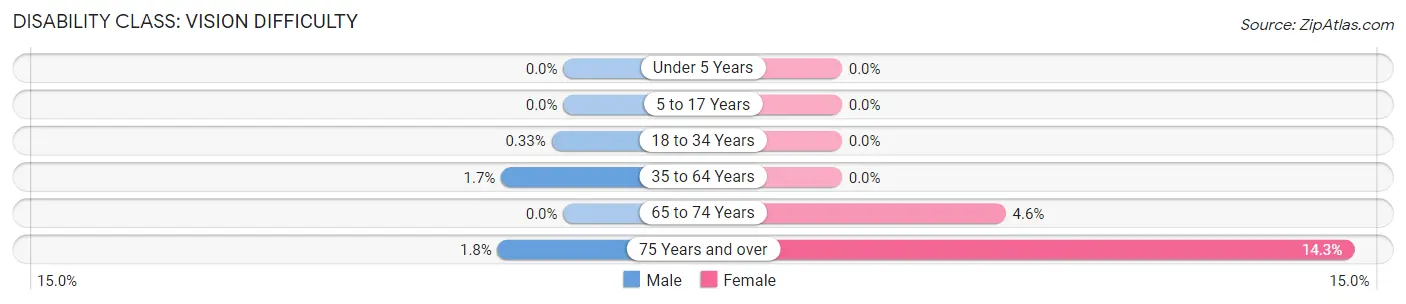
| Age Bracket | Male | Female |
| Under 5 Years | 0 (0.0%) | 0 (0.0%) |
| 5 to 17 Years | 0 (0.0%) | 0 (0.0%) |
| 18 to 34 Years | 11 (0.3%) | 0 (0.0%) |
| 35 to 64 Years | 92 (1.7%) | 0 (0.0%) |
| 65 to 74 Years | 0 (0.0%) | 35 (4.6%) |
| 75 Years and over | 7 (1.8%) | 73 (14.3%) |
Disability Class: Cognitive Difficulty
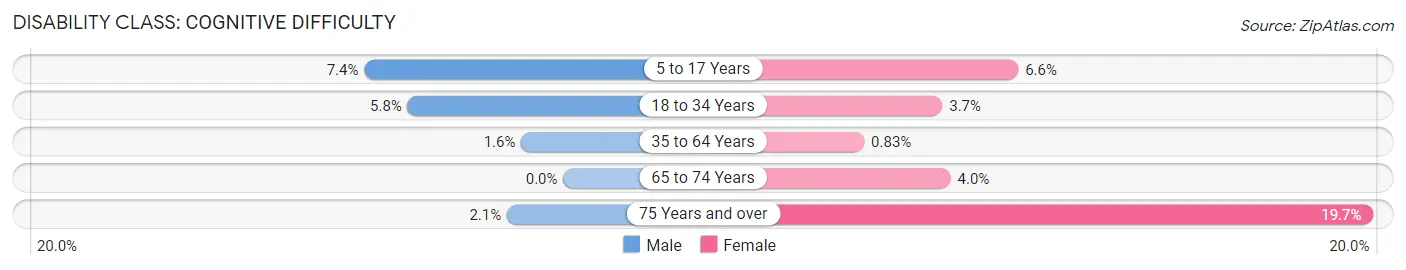
| Age Bracket | Male | Female |
| 5 to 17 Years | 148 (7.4%) | 144 (6.6%) |
| 18 to 34 Years | 193 (5.8%) | 99 (3.7%) |
| 35 to 64 Years | 83 (1.6%) | 38 (0.8%) |
| 65 to 74 Years | 0 (0.0%) | 31 (4.0%) |
| 75 Years and over | 8 (2.1%) | 101 (19.7%) |
Disability Class: Ambulatory Difficulty
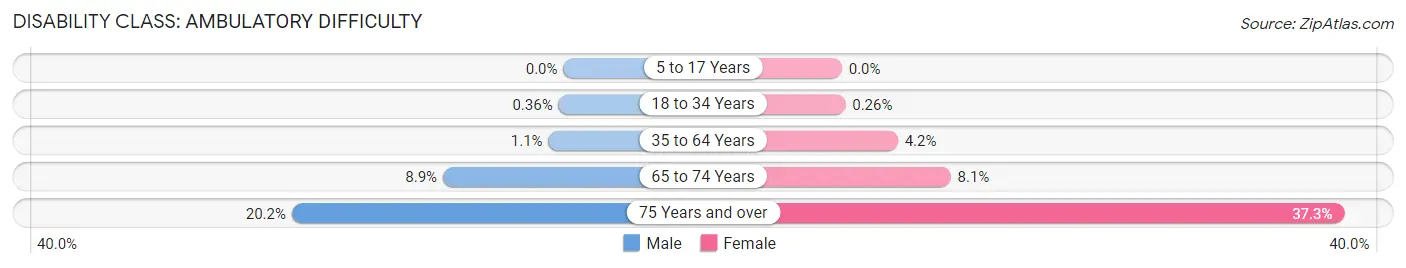
| Age Bracket | Male | Female |
| 5 to 17 Years | 0 (0.0%) | 0 (0.0%) |
| 18 to 34 Years | 12 (0.4%) | 7 (0.3%) |
| 35 to 64 Years | 59 (1.1%) | 191 (4.2%) |
| 65 to 74 Years | 78 (8.9%) | 62 (8.1%) |
| 75 Years and over | 77 (20.2%) | 191 (37.3%) |
Disability Class: Self-Care Difficulty
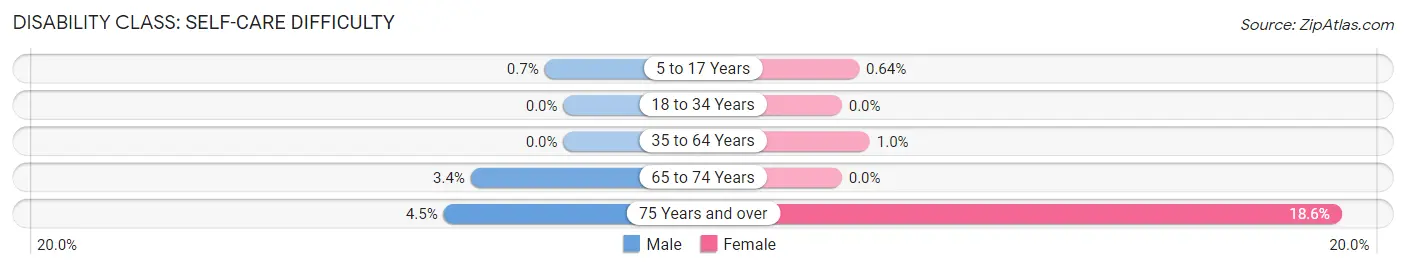
| Age Bracket | Male | Female |
| 5 to 17 Years | 14 (0.7%) | 14 (0.6%) |
| 18 to 34 Years | 0 (0.0%) | 0 (0.0%) |
| 35 to 64 Years | 0 (0.0%) | 48 (1.0%) |
| 65 to 74 Years | 30 (3.4%) | 0 (0.0%) |
| 75 Years and over | 17 (4.4%) | 95 (18.5%) |
Technology Access in Herndon
Computing Device Access in Herndon
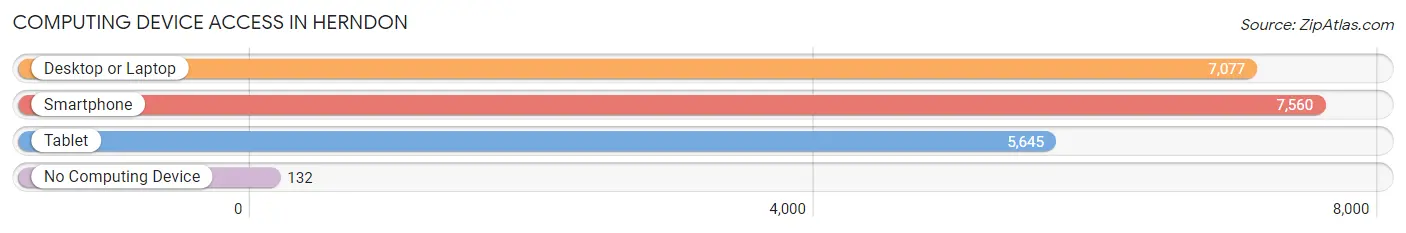
| Device Type | # Households | % Households |
| Desktop or Laptop | 7,077 | 89.6% |
| Smartphone | 7,560 | 95.7% |
| Tablet | 5,645 | 71.5% |
| No Computing Device | 132 | 1.7% |
| Total | 7,897 | 100.0% |
Internet Access in Herndon
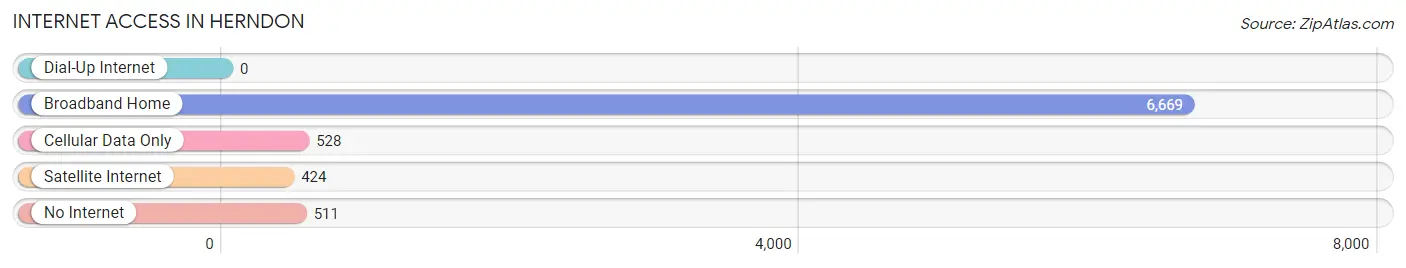
| Internet Type | # Households | % Households |
| Dial-Up Internet | 0 | 0.0% |
| Broadband Home | 6,669 | 84.5% |
| Cellular Data Only | 528 | 6.7% |
| Satellite Internet | 424 | 5.4% |
| No Internet | 511 | 6.5% |
| Total | 7,897 | 100.0% |
Herndon Summary
Herndon, Virginia is a town located in Fairfax County, Virginia, United States. It is part of the Washington metropolitan area and is located approximately 25 miles west of Washington, D.C. The town was founded in 1858 and incorporated in 1879. As of the 2010 census, the town had a population of 23,292.
Geography
Herndon is located at 38°58'N 77°23'W (38.967, -77.383). According to the United States Census Bureau, the town has a total area of 12.2 square miles (31.6 km2), of which 12.1 square miles (31.4 km2) is land and 0.1 square miles (0.2 km2) (0.58%) is water.
The town is situated in the Piedmont region of Virginia, with the foothills of the Blue Ridge Mountains to the west and the Potomac River to the east. The town is bordered by Reston to the north, Dulles International Airport to the west, and Fairfax County to the south and east.
Economy
Herndon is home to a variety of businesses, including technology, retail, and professional services. The town is home to several large employers, including Verizon Business, Northrop Grumman, and the U.S. Department of Homeland Security. Herndon is also home to the headquarters of the National Automobile Dealers Association.
Demographics
As of the 2010 census, there were 23,292 people, 8,890 households, and 5,845 families residing in the town. The population density was 1,919.3 people per square mile (739.7/km2). There were 9,541 housing units at an average density of 786.3 per square mile (303.7/km2). The racial makeup of the town was 57.2% White, 16.3% African American, 0.7% Native American, 17.3% Asian, 0.1% Pacific Islander, 5.2% from other races, and 3.3% from two or more races. Hispanic or Latino of any race were 13.3% of the population.
The median income for a household in the town was $90,902, and the median income for a family was $106,735. Males had a median income of $71,919 versus $50,867 for females. The per capita income for the town was $41,945. About 4.2% of families and 6.2% of the population were below the poverty line, including 8.2% of those under age 18 and 5.2% of those age 65 or over.
Herndon is a diverse community, with a population that is approximately 40% foreign-born. The largest foreign-born populations are from India, El Salvador, and Korea. The town is also home to a large population of immigrants from Latin America, Africa, and the Middle East.
Common Questions
What is Per Capita Income in Herndon?
Per Capita income in Herndon is $55,686.
What is the Median Family Income in Herndon?
Median Family Income in Herndon is $155,901.
What is the Median Household income in Herndon?
Median Household Income in Herndon is $133,403.
What is Income or Wage Gap in Herndon?
Income or Wage Gap in Herndon is 32.0%.
Women in Herndon earn 68.0 cents for every dollar earned by a man.
What is Inequality or Gini Index in Herndon?
Inequality or Gini Index in Herndon is 0.39.
What is the Total Population of Herndon?
Total Population of Herndon is 24,456.
What is the Total Male Population of Herndon?
Total Male Population of Herndon is 12,996.
What is the Total Female Population of Herndon?
Total Female Population of Herndon is 11,460.
What is the Ratio of Males per 100 Females in Herndon?
There are 113.40 Males per 100 Females in Herndon.
What is the Ratio of Females per 100 Males in Herndon?
There are 88.18 Females per 100 Males in Herndon.
What is the Median Population Age in Herndon?
Median Population Age in Herndon is 35.5 Years.
What is the Average Family Size in Herndon
Average Family Size in Herndon is 3.5 People.
What is the Average Household Size in Herndon
Average Household Size in Herndon is 3.1 People.
How Large is the Labor Force in Herndon?
There are 15,189 People in the Labor Forcein in Herndon.
What is the Percentage of People in the Labor Force in Herndon?
79.2% of People are in the Labor Force in Herndon.
What is the Unemployment Rate in Herndon?
Unemployment Rate in Herndon is 2.7%.