Potomac Mills, VA Map & Demographics
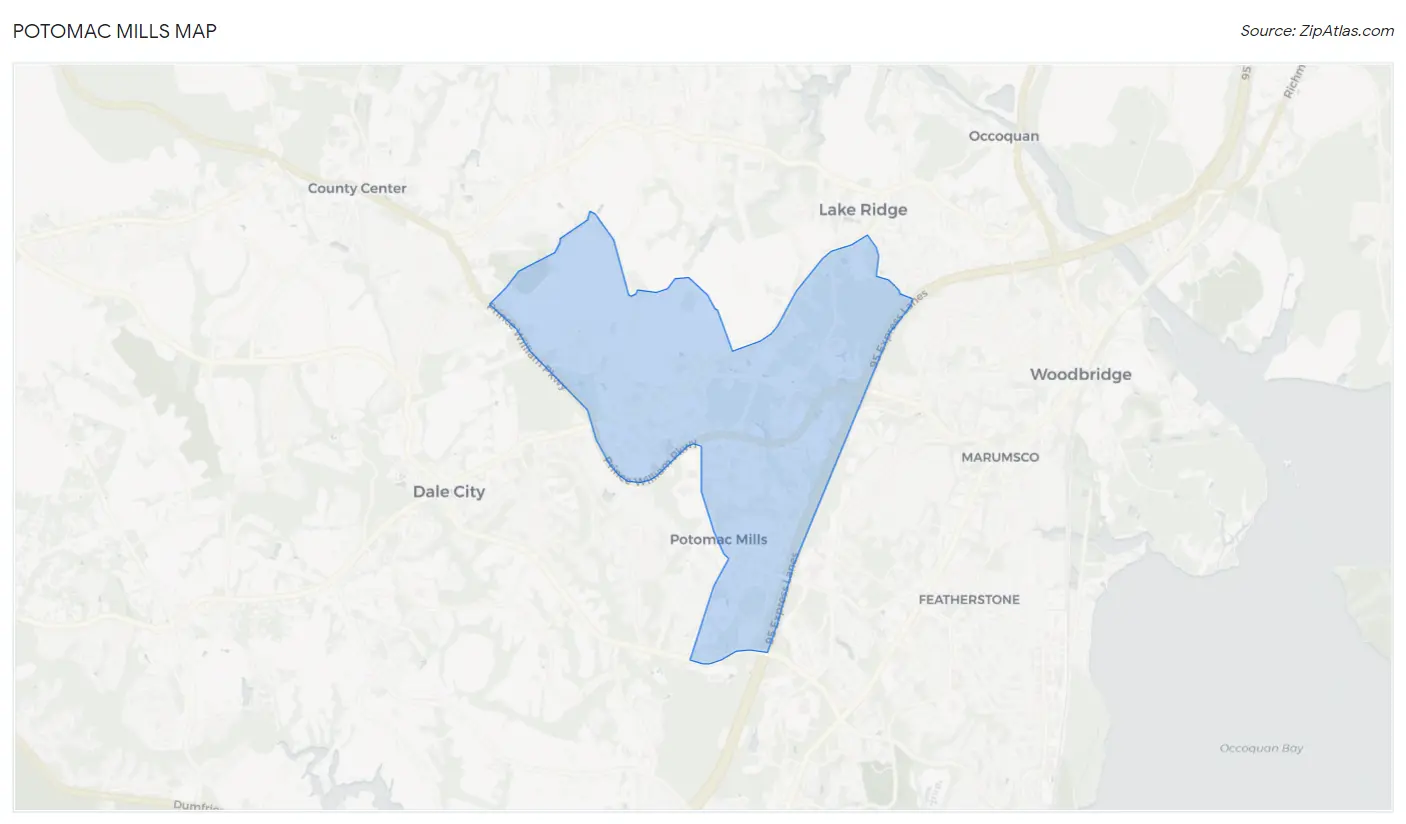
Potomac Mills Map
Potomac Mills Overview
$42,506
PER CAPITA INCOME
$111,724
AVG FAMILY INCOME
$109,265
AVG HOUSEHOLD INCOME
45.5%
WAGE / INCOME GAP [ % ]
54.5¢/ $1
WAGE / INCOME GAP [ $ ]
0.39
INEQUALITY / GINI INDEX
6,510
TOTAL POPULATION
3,443
MALE POPULATION
3,067
FEMALE POPULATION
112.26
MALES / 100 FEMALES
89.08
FEMALES / 100 MALES
37.1
MEDIAN AGE
3.7
AVG FAMILY SIZE
3.3
AVG HOUSEHOLD SIZE
3,248
LABOR FORCE [ PEOPLE ]
66.2%
PERCENT IN LABOR FORCE
3.8%
UNEMPLOYMENT RATE
Income in Potomac Mills
Income Overview in Potomac Mills
Per Capita Income in Potomac Mills is $42,506, while median incomes of families and households are $111,724 and $109,265 respectively.
| Characteristic | Number | Measure |
| Per Capita Income | 6,510 | $42,506 |
| Median Family Income | 1,564 | $111,724 |
| Mean Family Income | 1,564 | $145,511 |
| Median Household Income | 1,954 | $109,265 |
| Mean Household Income | 1,954 | $139,093 |
| Income Deficit | 1,564 | $0 |
| Wage / Income Gap (%) | 6,510 | 45.46% |
| Wage / Income Gap ($) | 6,510 | 54.54¢ per $1 |
| Gini / Inequality Index | 6,510 | 0.39 |
Earnings by Sex in Potomac Mills
Average Earnings in Potomac Mills are $48,886, $57,818 for men and $31,532 for women, a difference of 45.5%.
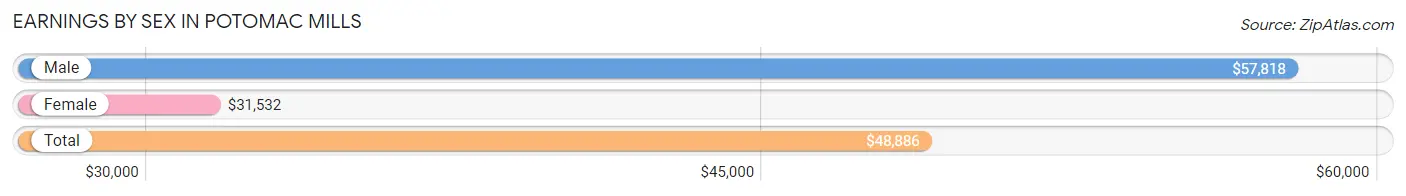
| Sex | Number | Average Earnings |
| Male | 1,890 (55.0%) | $57,818 |
| Female | 1,546 (45.0%) | $31,532 |
| Total | 3,436 (100.0%) | $48,886 |
Earnings by Sex by Income Bracket in Potomac Mills
The most common earnings brackets in Potomac Mills are $100,000+ for men (550 | 29.1%) and $75,000 to $99,999 for women (258 | 16.7%).
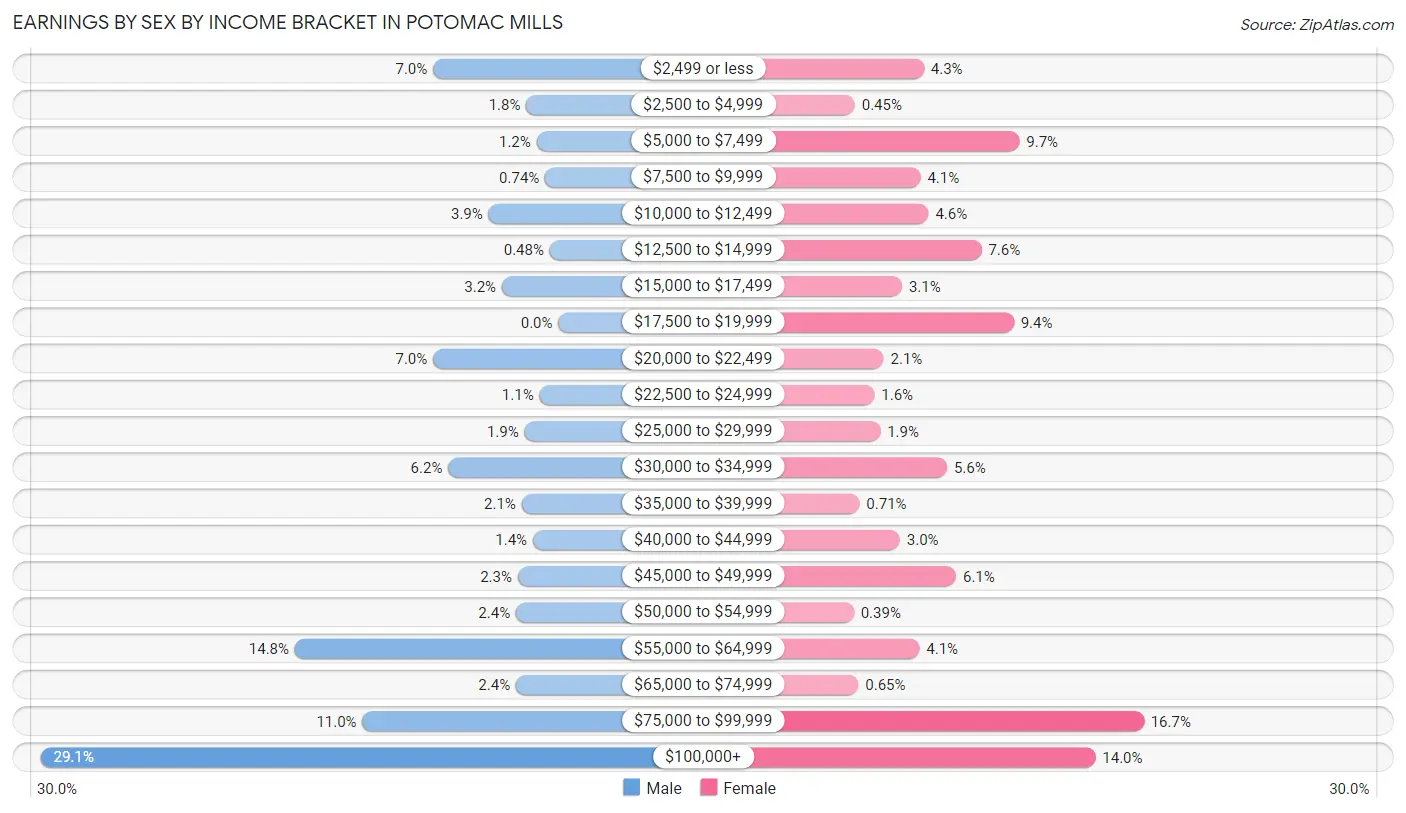
| Income | Male | Female |
| $2,499 or less | 133 (7.0%) | 67 (4.3%) |
| $2,500 to $4,999 | 34 (1.8%) | 7 (0.4%) |
| $5,000 to $7,499 | 23 (1.2%) | 150 (9.7%) |
| $7,500 to $9,999 | 14 (0.7%) | 64 (4.1%) |
| $10,000 to $12,499 | 74 (3.9%) | 71 (4.6%) |
| $12,500 to $14,999 | 9 (0.5%) | 117 (7.6%) |
| $15,000 to $17,499 | 60 (3.2%) | 48 (3.1%) |
| $17,500 to $19,999 | 0 (0.0%) | 145 (9.4%) |
| $20,000 to $22,499 | 133 (7.0%) | 32 (2.1%) |
| $22,500 to $24,999 | 20 (1.1%) | 24 (1.5%) |
| $25,000 to $29,999 | 36 (1.9%) | 29 (1.9%) |
| $30,000 to $34,999 | 117 (6.2%) | 87 (5.6%) |
| $35,000 to $39,999 | 39 (2.1%) | 11 (0.7%) |
| $40,000 to $44,999 | 27 (1.4%) | 46 (3.0%) |
| $45,000 to $49,999 | 43 (2.3%) | 95 (6.1%) |
| $50,000 to $54,999 | 45 (2.4%) | 6 (0.4%) |
| $55,000 to $64,999 | 280 (14.8%) | 63 (4.1%) |
| $65,000 to $74,999 | 45 (2.4%) | 10 (0.6%) |
| $75,000 to $99,999 | 208 (11.0%) | 258 (16.7%) |
| $100,000+ | 550 (29.1%) | 216 (14.0%) |
| Total | 1,890 (100.0%) | 1,546 (100.0%) |
Earnings by Sex by Educational Attainment in Potomac Mills
Average earnings in Potomac Mills are $61,516 for men and $34,598 for women, a difference of 43.8%. Men with an educational attainment of bachelor's degree enjoy the highest average annual earnings of $158,521, while those with less than high school education earn the least with $32,157. Women with an educational attainment of graduate degree earn the most with the average annual earnings of $90,974, while those with less than high school education have the smallest earnings of $18,116.
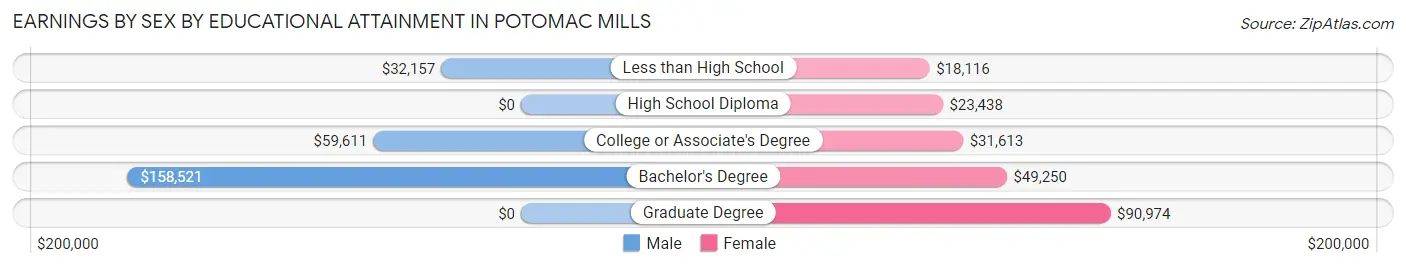
| Educational Attainment | Male Income | Female Income |
| Less than High School | $32,157 | $18,116 |
| High School Diploma | - | - |
| College or Associate's Degree | $59,611 | $31,613 |
| Bachelor's Degree | $158,521 | $49,250 |
| Graduate Degree | - | - |
| Total | $61,516 | $34,598 |
Family Income in Potomac Mills
Family Income Brackets in Potomac Mills
According to the Potomac Mills family income data, there are 461 families falling into the $200,000+ income range, which is the most common income bracket and makes up 29.5% of all families.
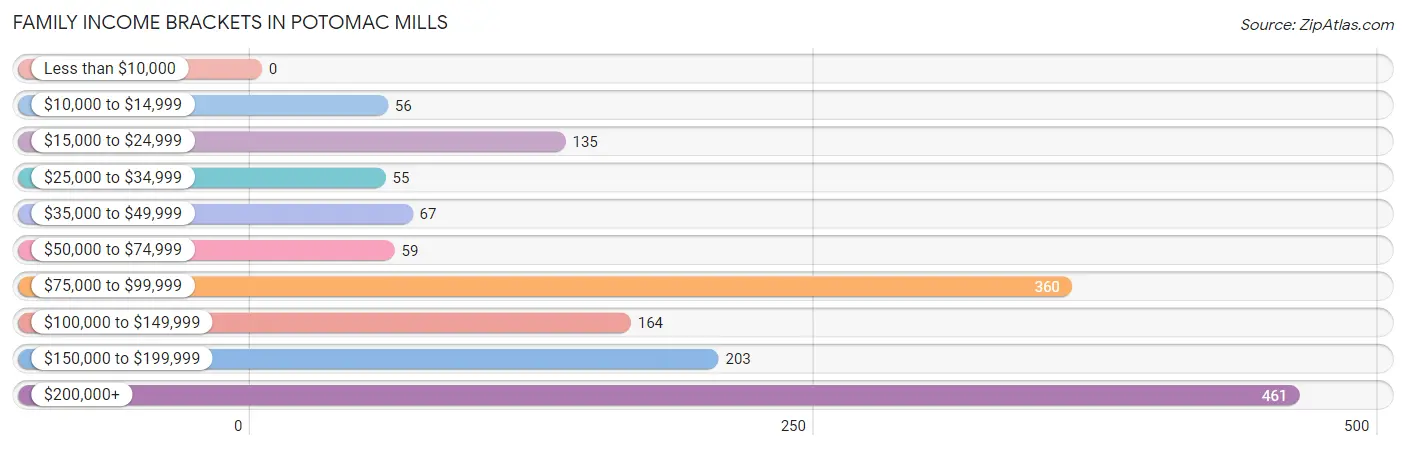
| Income Bracket | # Families | % Families |
| Less than $10,000 | 0 | 0.0% |
| $10,000 to $14,999 | 56 | 3.6% |
| $15,000 to $24,999 | 135 | 8.6% |
| $25,000 to $34,999 | 55 | 3.5% |
| $35,000 to $49,999 | 67 | 4.3% |
| $50,000 to $74,999 | 59 | 3.8% |
| $75,000 to $99,999 | 360 | 23.0% |
| $100,000 to $149,999 | 164 | 10.5% |
| $150,000 to $199,999 | 203 | 13.0% |
| $200,000+ | 461 | 29.5% |
Family Income by Famaliy Size in Potomac Mills
7+ person families (77 | 4.9%) account for the highest median family income in Potomac Mills with $205,430 per family, while 2-person families (489 | 31.3%) have the highest median income of $49,916 per family member.
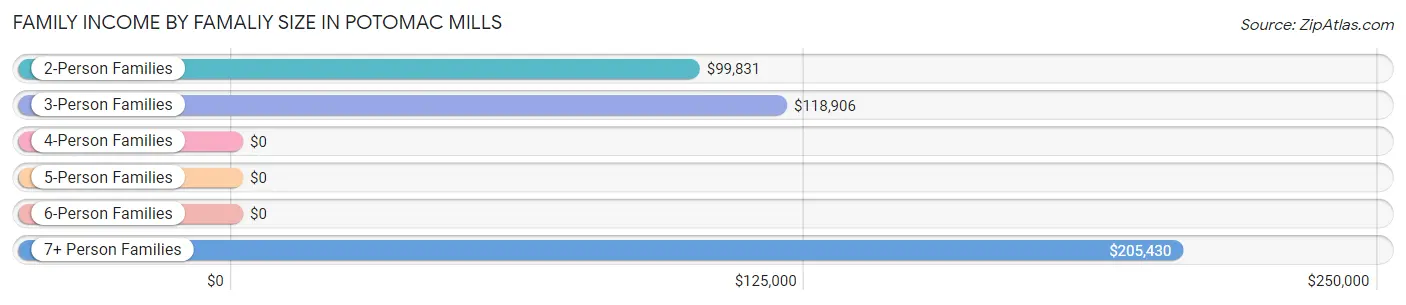
| Income Bracket | # Families | Median Income |
| 2-Person Families | 489 (31.3%) | $99,831 |
| 3-Person Families | 301 (19.3%) | $118,906 |
| 4-Person Families | 471 (30.1%) | $0 |
| 5-Person Families | 177 (11.3%) | $0 |
| 6-Person Families | 49 (3.1%) | $0 |
| 7+ Person Families | 77 (4.9%) | $205,430 |
| Total | 1,564 (100.0%) | $111,724 |
Family Income by Number of Earners in Potomac Mills
The median family income in Potomac Mills is $111,724, with families comprising 2 earners (487) having the highest median family income of $218,203, while families with 1 earner (619) have the lowest median family income of $76,028, accounting for 31.1% and 39.6% of families, respectively.
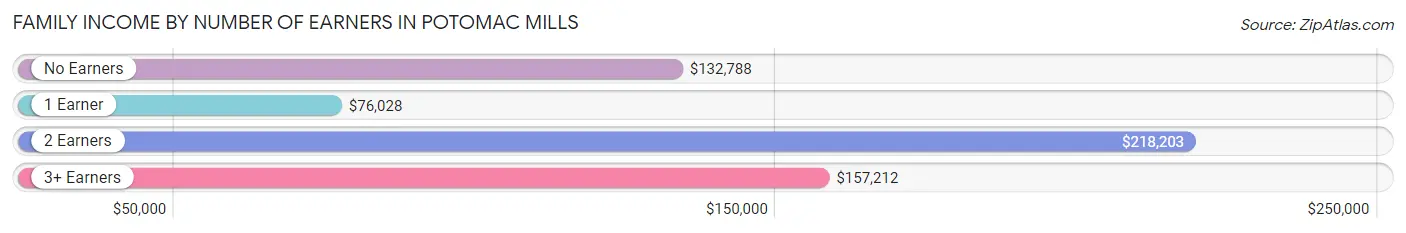
| Number of Earners | # Families | Median Income |
| No Earners | 111 (7.1%) | $132,788 |
| 1 Earner | 619 (39.6%) | $76,028 |
| 2 Earners | 487 (31.1%) | $218,203 |
| 3+ Earners | 347 (22.2%) | $157,212 |
| Total | 1,564 (100.0%) | $111,724 |
Household Income in Potomac Mills
Household Income Brackets in Potomac Mills
With 488 households falling in the category, the $200,000+ income range is the most frequent in Potomac Mills, accounting for 25.0% of all households. In contrast, only 43 households (2.2%) fall into the less than $10,000 income bracket, making it the least populous group.
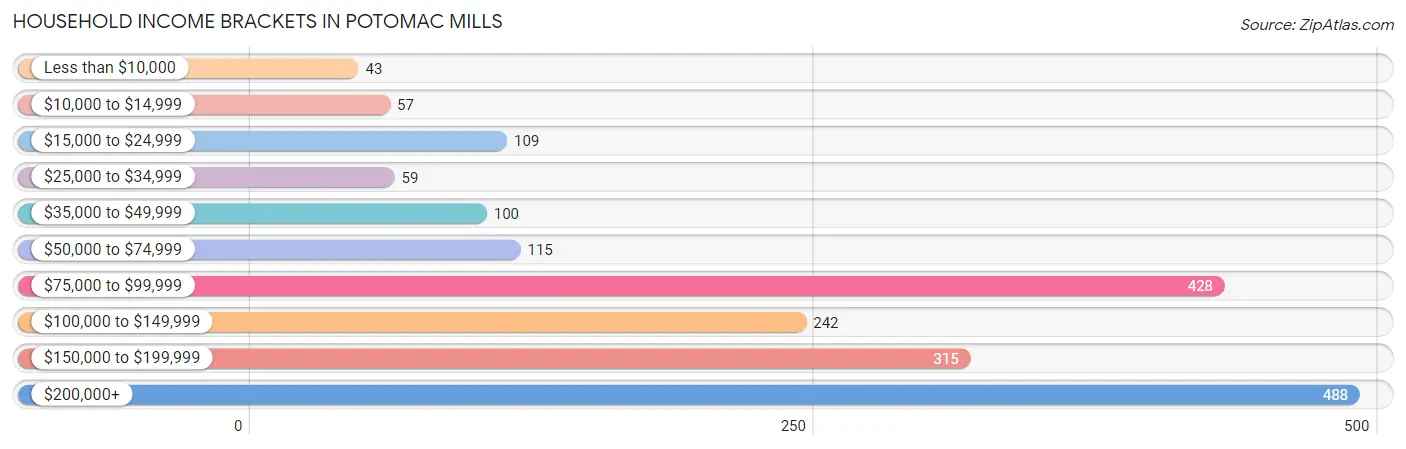
| Income Bracket | # Households | % Households |
| Less than $10,000 | 43 | 2.2% |
| $10,000 to $14,999 | 57 | 2.9% |
| $15,000 to $24,999 | 109 | 5.6% |
| $25,000 to $34,999 | 59 | 3.0% |
| $35,000 to $49,999 | 100 | 5.1% |
| $50,000 to $74,999 | 115 | 5.9% |
| $75,000 to $99,999 | 428 | 21.9% |
| $100,000 to $149,999 | 242 | 12.4% |
| $150,000 to $199,999 | 315 | 16.1% |
| $200,000+ | 488 | 25.0% |
Household Income by Householder Age in Potomac Mills
The median household income in Potomac Mills is $109,265, with the highest median household income of $143,750 found in the 45 to 64 years age bracket for the primary householder. A total of 762 households (39.0%) fall into this category. Meanwhile, the 15 to 24 years age bracket for the primary householder has the lowest median household income of $0, with 17 households (0.9%) in this group.
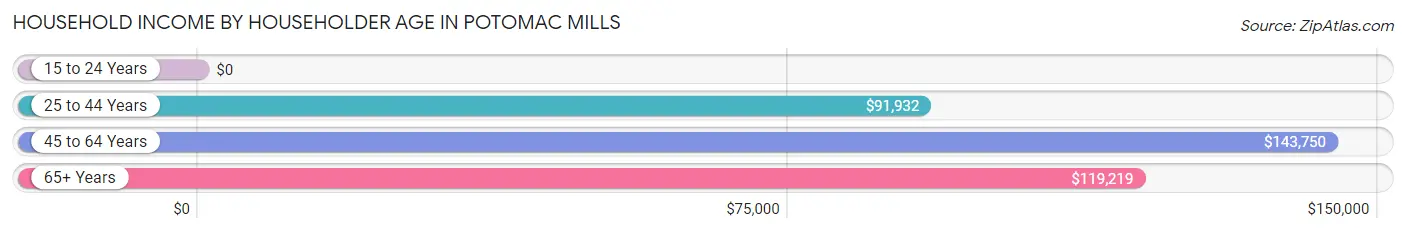
| Income Bracket | # Households | Median Income |
| 15 to 24 Years | 17 (0.9%) | $0 |
| 25 to 44 Years | 806 (41.2%) | $91,932 |
| 45 to 64 Years | 762 (39.0%) | $143,750 |
| 65+ Years | 369 (18.9%) | $119,219 |
| Total | 1,954 (100.0%) | $109,265 |
Poverty in Potomac Mills
Income Below Poverty by Sex and Age in Potomac Mills
With 6.5% poverty level for males and 17.2% for females among the residents of Potomac Mills, 35 to 44 year old males and 6 to 11 year old females are the most vulnerable to poverty, with 140 males (20.3%) and 176 females (69.3%) in their respective age groups living below the poverty level.
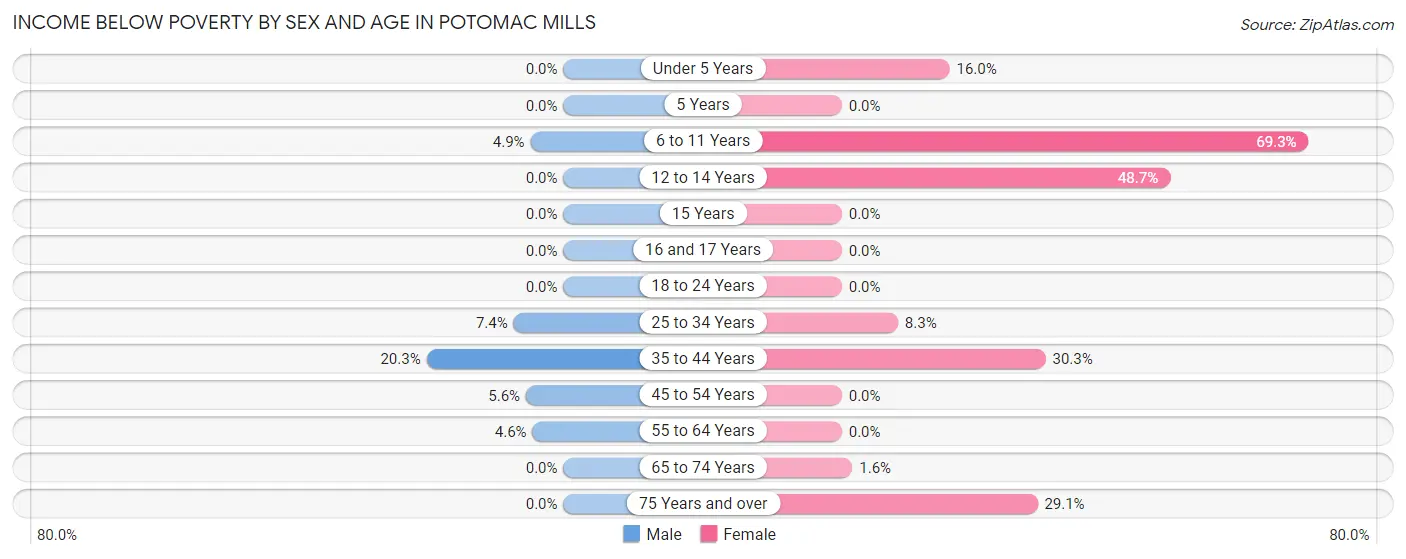
| Age Bracket | Male | Female |
| Under 5 Years | 0 (0.0%) | 20 (16.0%) |
| 5 Years | 0 (0.0%) | 0 (0.0%) |
| 6 to 11 Years | 18 (4.9%) | 176 (69.3%) |
| 12 to 14 Years | 0 (0.0%) | 96 (48.7%) |
| 15 Years | 0 (0.0%) | 0 (0.0%) |
| 16 and 17 Years | 0 (0.0%) | 0 (0.0%) |
| 18 to 24 Years | 0 (0.0%) | 0 (0.0%) |
| 25 to 34 Years | 26 (7.4%) | 28 (8.3%) |
| 35 to 44 Years | 140 (20.3%) | 161 (30.3%) |
| 45 to 54 Years | 22 (5.6%) | 0 (0.0%) |
| 55 to 64 Years | 15 (4.6%) | 0 (0.0%) |
| 65 to 74 Years | 0 (0.0%) | 4 (1.6%) |
| 75 Years and over | 0 (0.0%) | 43 (29.0%) |
| Total | 221 (6.5%) | 528 (17.2%) |
Income Above Poverty by Sex and Age in Potomac Mills
According to the poverty statistics in Potomac Mills, males aged under 5 years and females aged 5 years are the age groups that are most secure financially, with 100.0% of males and 100.0% of females in these age groups living above the poverty line.
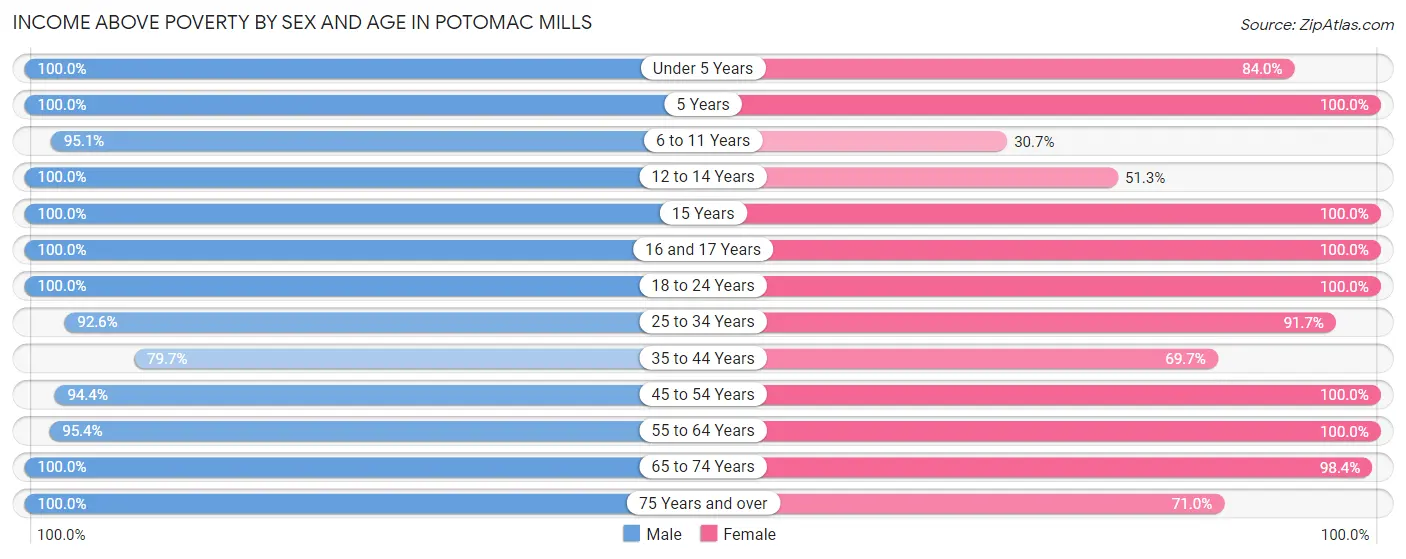
| Age Bracket | Male | Female |
| Under 5 Years | 221 (100.0%) | 105 (84.0%) |
| 5 Years | 57 (100.0%) | 54 (100.0%) |
| 6 to 11 Years | 350 (95.1%) | 78 (30.7%) |
| 12 to 14 Years | 271 (100.0%) | 101 (51.3%) |
| 15 Years | 31 (100.0%) | 2 (100.0%) |
| 16 and 17 Years | 123 (100.0%) | 281 (100.0%) |
| 18 to 24 Years | 286 (100.0%) | 148 (100.0%) |
| 25 to 34 Years | 326 (92.6%) | 308 (91.7%) |
| 35 to 44 Years | 549 (79.7%) | 371 (69.7%) |
| 45 to 54 Years | 374 (94.4%) | 448 (100.0%) |
| 55 to 64 Years | 312 (95.4%) | 288 (100.0%) |
| 65 to 74 Years | 246 (100.0%) | 250 (98.4%) |
| 75 Years and over | 46 (100.0%) | 105 (71.0%) |
| Total | 3,192 (93.5%) | 2,539 (82.8%) |
Income Below Poverty Among Married-Couple Families in Potomac Mills
The poverty statistics for married-couple families in Potomac Mills show that 8.8% or 112 of the total 1,275 families live below the poverty line. Families with 3 or 4 children have the highest poverty rate of 50.9%, comprising of 108 families. On the other hand, families with 1 or 2 children have the lowest poverty rate of 0.0%, which includes 0 families.
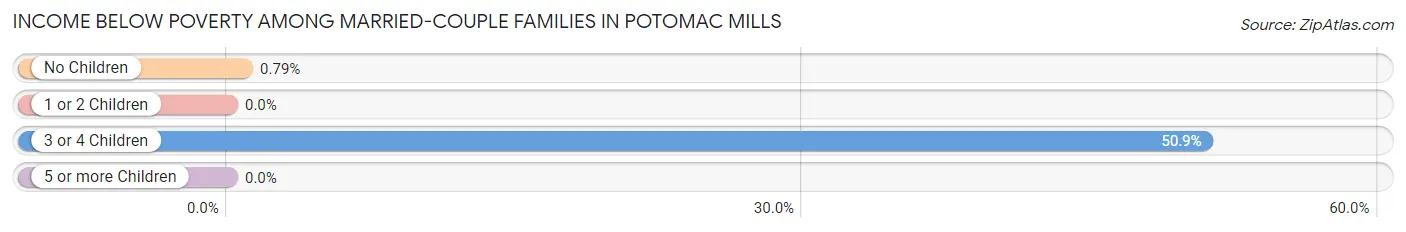
| Children | Above Poverty | Below Poverty |
| No Children | 505 (99.2%) | 4 (0.8%) |
| 1 or 2 Children | 554 (100.0%) | 0 (0.0%) |
| 3 or 4 Children | 104 (49.1%) | 108 (50.9%) |
| 5 or more Children | 0 (0.0%) | 0 (0.0%) |
| Total | 1,163 (91.2%) | 112 (8.8%) |
Income Below Poverty Among Single-Parent Households in Potomac Mills
| Children | Single Father | Single Mother |
| No Children | 0 (0.0%) | 0 (0.0%) |
| 1 or 2 Children | 0 (0.0%) | 96 (52.7%) |
| 3 or 4 Children | 0 (0.0%) | 0 (0.0%) |
| 5 or more Children | 0 (0.0%) | 0 (0.0%) |
| Total | 0 (0.0%) | 96 (39.0%) |
Income Below Poverty Among Married-Couple vs Single-Parent Households in Potomac Mills
The poverty data for Potomac Mills shows that 112 of the married-couple family households (8.8%) and 96 of the single-parent households (33.2%) are living below the poverty level. Within the married-couple family households, those with 3 or 4 children have the highest poverty rate, with 108 households (50.9%) falling below the poverty line. Among the single-parent households, those with 1 or 2 children have the highest poverty rate, with 96 household (48.2%) living below poverty.
| Children | Married-Couple Families | Single-Parent Households |
| No Children | 4 (0.8%) | 0 (0.0%) |
| 1 or 2 Children | 0 (0.0%) | 96 (48.2%) |
| 3 or 4 Children | 108 (50.9%) | 0 (0.0%) |
| 5 or more Children | 0 (0.0%) | 0 (0.0%) |
| Total | 112 (8.8%) | 96 (33.2%) |
Race in Potomac Mills
The most populous races in Potomac Mills are White / Caucasian (3,504 | 53.8%), Hispanic or Latino (1,511 | 23.2%), and Black / African American (1,257 | 19.3%).
| Race | # Population | % Population |
| Asian | 778 | 11.9% |
| Black / African American | 1,257 | 19.3% |
| Hawaiian / Pacific | 0 | 0.0% |
| Hispanic or Latino | 1,511 | 23.2% |
| Native / Alaskan | 64 | 1.0% |
| White / Caucasian | 3,504 | 53.8% |
| Two or more Races | 240 | 3.7% |
| Some other Race | 667 | 10.2% |
| Total | 6,510 | 100.0% |
Ancestry in Potomac Mills
The most populous ancestries reported in Potomac Mills are German (673 | 10.3%), Italian (576 | 8.8%), Polish (522 | 8.0%), Mexican (504 | 7.7%), and South American (404 | 6.2%), together accounting for 41.2% of all Potomac Mills residents.
| Ancestry | # Population | % Population |
| Afghan | 41 | 0.6% |
| African | 13 | 0.2% |
| American | 256 | 3.9% |
| Arab | 96 | 1.5% |
| Argentinean | 21 | 0.3% |
| Bhutanese | 17 | 0.3% |
| Bolivian | 339 | 5.2% |
| Brazilian | 40 | 0.6% |
| British West Indian | 85 | 1.3% |
| Burmese | 10 | 0.2% |
| Central American | 322 | 5.0% |
| English | 270 | 4.2% |
| Estonian | 18 | 0.3% |
| Ethiopian | 8 | 0.1% |
| European | 212 | 3.3% |
| French | 34 | 0.5% |
| French Canadian | 11 | 0.2% |
| German | 673 | 10.3% |
| Greek | 36 | 0.5% |
| Guatemalan | 281 | 4.3% |
| Haitian | 73 | 1.1% |
| Hungarian | 15 | 0.2% |
| Indian (Asian) | 30 | 0.5% |
| Iranian | 115 | 1.8% |
| Irish | 155 | 2.4% |
| Italian | 576 | 8.8% |
| Jamaican | 34 | 0.5% |
| Korean | 112 | 1.7% |
| Macedonian | 11 | 0.2% |
| Mexican | 504 | 7.7% |
| Moroccan | 52 | 0.8% |
| Norwegian | 23 | 0.4% |
| Pakistani | 13 | 0.2% |
| Palestinian | 27 | 0.4% |
| Polish | 522 | 8.0% |
| Portuguese | 39 | 0.6% |
| Puerto Rican | 186 | 2.9% |
| Romanian | 16 | 0.3% |
| Russian | 18 | 0.3% |
| Salvadoran | 41 | 0.6% |
| Scandinavian | 12 | 0.2% |
| Scotch-Irish | 7 | 0.1% |
| Scottish | 11 | 0.2% |
| Slovak | 18 | 0.3% |
| South American | 404 | 6.2% |
| Subsaharan African | 155 | 2.4% |
| Sudanese | 134 | 2.1% |
| Thai | 194 | 3.0% |
| Turkish | 11 | 0.2% |
| U.S. Virgin Islander | 11 | 0.2% |
| Ukrainian | 15 | 0.2% |
| Venezuelan | 44 | 0.7% |
| Vietnamese | 335 | 5.1% |
| West Indian | 10 | 0.2% |
| Yaqui | 90 | 1.4% | View All 55 Rows |
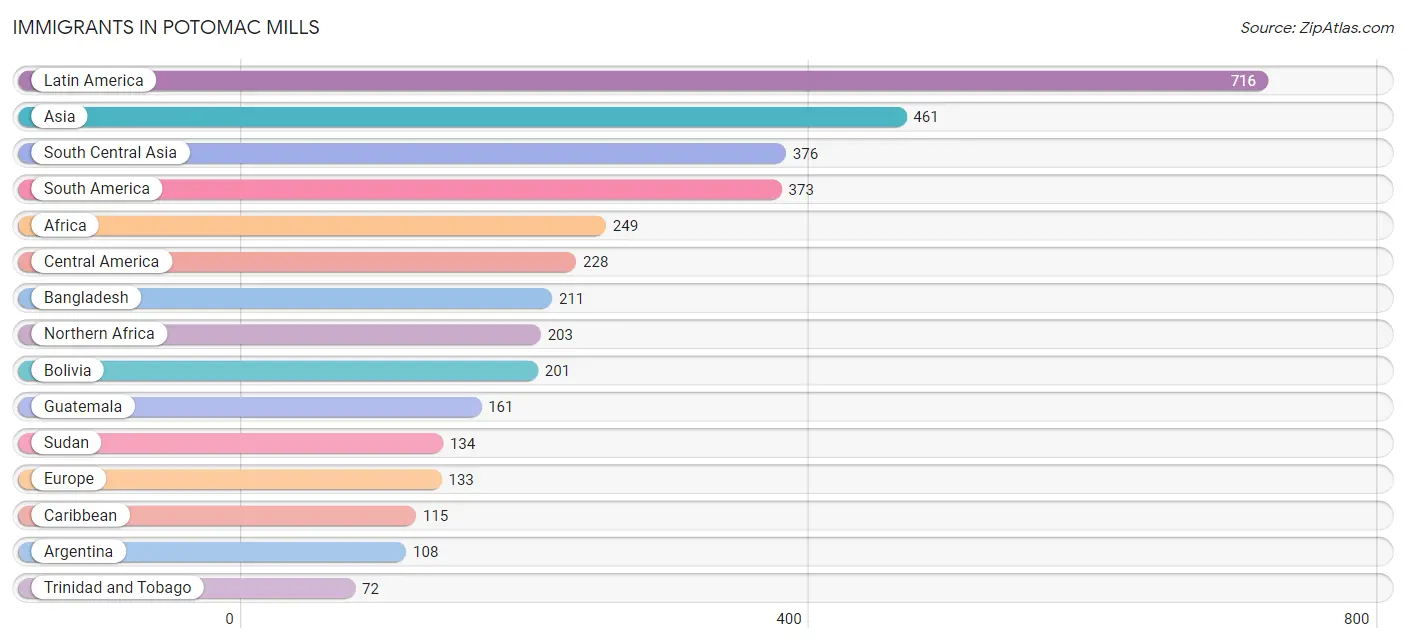
Immigrants in Potomac Mills
The most numerous immigrant groups reported in Potomac Mills came from Latin America (716 | 11.0%), Asia (461 | 7.1%), South Central Asia (376 | 5.8%), South America (373 | 5.7%), and Africa (249 | 3.8%), together accounting for 33.4% of all Potomac Mills residents.
| Immigration Origin | # Population | % Population |
| Afghanistan | 39 | 0.6% |
| Africa | 249 | 3.8% |
| Argentina | 108 | 1.7% |
| Asia | 461 | 7.1% |
| Bangladesh | 211 | 3.2% |
| Belgium | 13 | 0.2% |
| Bolivia | 201 | 3.1% |
| Brazil | 20 | 0.3% |
| Caribbean | 115 | 1.8% |
| Central America | 228 | 3.5% |
| China | 5 | 0.1% |
| Eastern Africa | 4 | 0.1% |
| Eastern Asia | 15 | 0.2% |
| Eastern Europe | 57 | 0.9% |
| England | 23 | 0.4% |
| Ethiopia | 4 | 0.1% |
| Europe | 133 | 2.0% |
| Germany | 11 | 0.2% |
| Ghana | 35 | 0.5% |
| Guatemala | 161 | 2.5% |
| Hungary | 6 | 0.1% |
| India | 61 | 0.9% |
| Ireland | 27 | 0.4% |
| Israel | 11 | 0.2% |
| Jamaica | 22 | 0.3% |
| Jordan | 12 | 0.2% |
| Korea | 10 | 0.2% |
| Latin America | 716 | 11.0% |
| Mexico | 67 | 1.0% |
| Moldova | 15 | 0.2% |
| Morocco | 52 | 0.8% |
| Nepal | 65 | 1.0% |
| Nigeria | 7 | 0.1% |
| Northern Africa | 203 | 3.1% |
| Northern Europe | 50 | 0.8% |
| Philippines | 47 | 0.7% |
| Poland | 1 | 0.0% |
| Romania | 13 | 0.2% |
| Russia | 14 | 0.2% |
| South America | 373 | 5.7% |
| South Central Asia | 376 | 5.8% |
| South Eastern Asia | 47 | 0.7% |
| Sudan | 134 | 2.1% |
| Trinidad and Tobago | 72 | 1.1% |
| Venezuela | 44 | 0.7% |
| Western Africa | 42 | 0.6% |
| Western Asia | 23 | 0.4% |
| Western Europe | 24 | 0.4% | View All 48 Rows |
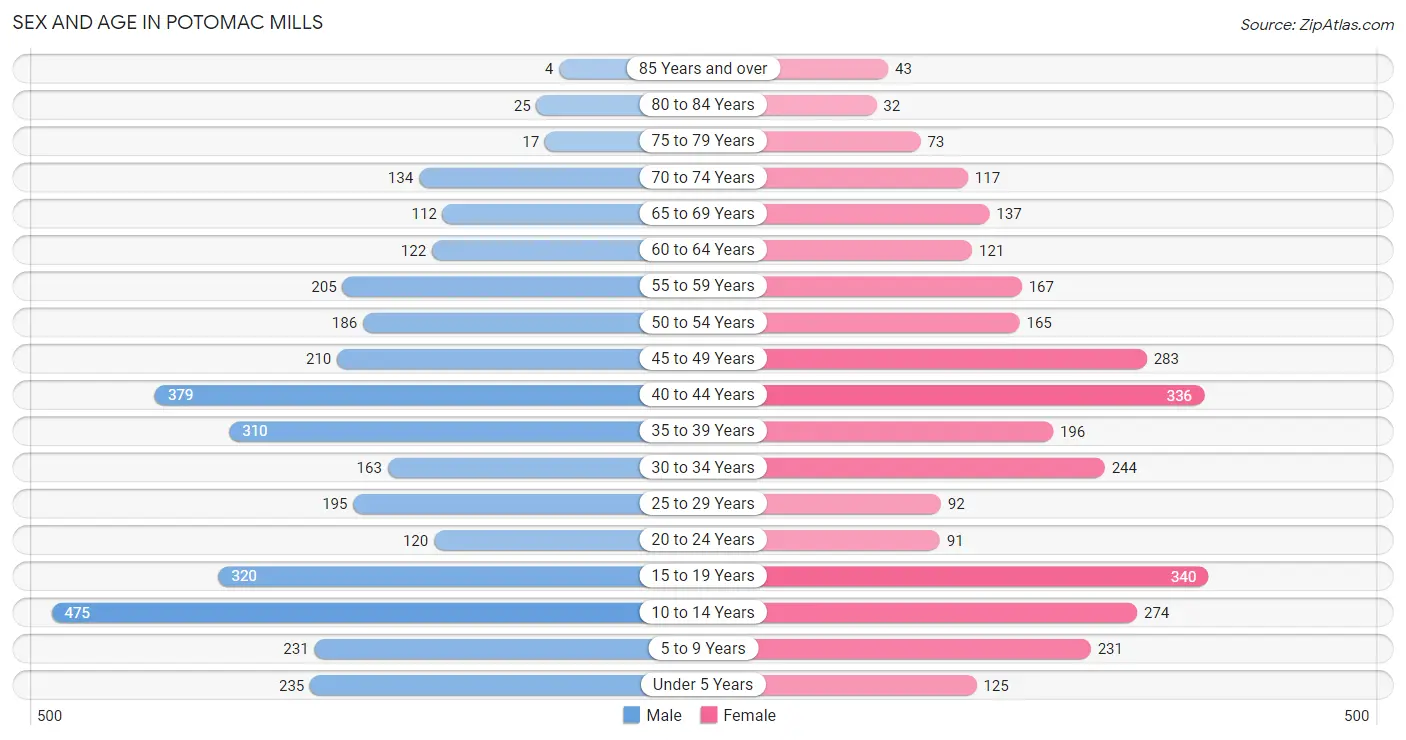
Sex and Age in Potomac Mills
Sex and Age in Potomac Mills
The most populous age groups in Potomac Mills are 10 to 14 Years (475 | 13.8%) for men and 15 to 19 Years (340 | 11.1%) for women.
| Age Bracket | Male | Female |
| Under 5 Years | 235 (6.8%) | 125 (4.1%) |
| 5 to 9 Years | 231 (6.7%) | 231 (7.5%) |
| 10 to 14 Years | 475 (13.8%) | 274 (8.9%) |
| 15 to 19 Years | 320 (9.3%) | 340 (11.1%) |
| 20 to 24 Years | 120 (3.5%) | 91 (3.0%) |
| 25 to 29 Years | 195 (5.7%) | 92 (3.0%) |
| 30 to 34 Years | 163 (4.7%) | 244 (8.0%) |
| 35 to 39 Years | 310 (9.0%) | 196 (6.4%) |
| 40 to 44 Years | 379 (11.0%) | 336 (11.0%) |
| 45 to 49 Years | 210 (6.1%) | 283 (9.2%) |
| 50 to 54 Years | 186 (5.4%) | 165 (5.4%) |
| 55 to 59 Years | 205 (5.9%) | 167 (5.4%) |
| 60 to 64 Years | 122 (3.5%) | 121 (4.0%) |
| 65 to 69 Years | 112 (3.3%) | 137 (4.5%) |
| 70 to 74 Years | 134 (3.9%) | 117 (3.8%) |
| 75 to 79 Years | 17 (0.5%) | 73 (2.4%) |
| 80 to 84 Years | 25 (0.7%) | 32 (1.0%) |
| 85 Years and over | 4 (0.1%) | 43 (1.4%) |
| Total | 3,443 (100.0%) | 3,067 (100.0%) |
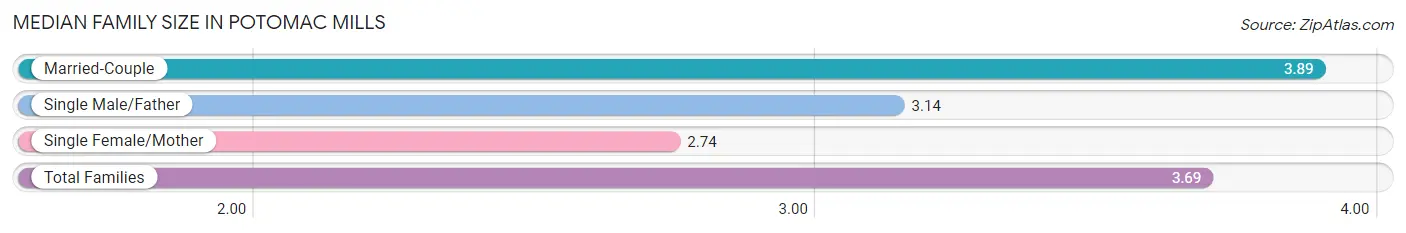
Families and Households in Potomac Mills
Median Family Size in Potomac Mills
The median family size in Potomac Mills is 3.69 persons per family, with married-couple families (1,275 | 81.5%) accounting for the largest median family size of 3.89 persons per family. On the other hand, single female/mother families (246 | 15.7%) represent the smallest median family size with 2.74 persons per family.
| Family Type | # Families | Family Size |
| Married-Couple | 1,275 (81.5%) | 3.89 |
| Single Male/Father | 43 (2.8%) | 3.14 |
| Single Female/Mother | 246 (15.7%) | 2.74 |
| Total Families | 1,564 (100.0%) | 3.69 |
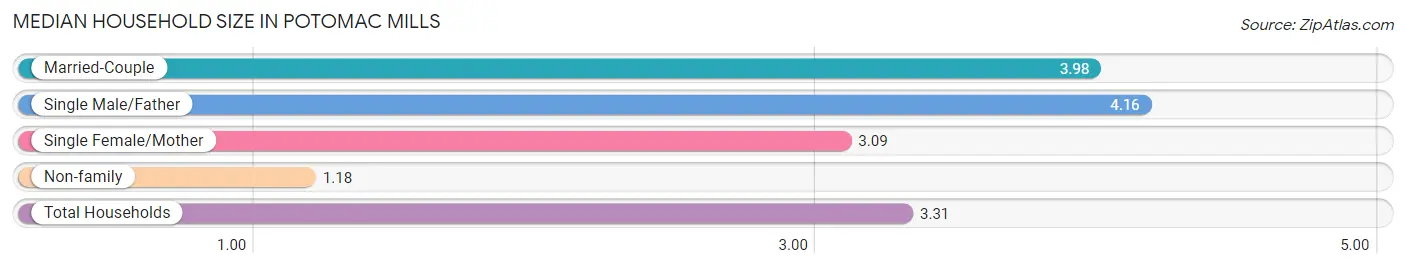
Median Household Size in Potomac Mills
The median household size in Potomac Mills is 3.31 persons per household, with single male/father households (43 | 2.2%) accounting for the largest median household size of 4.16 persons per household. non-family households (390 | 20.0%) represent the smallest median household size with 1.18 persons per household.
| Household Type | # Households | Household Size |
| Married-Couple | 1,275 (65.2%) | 3.98 |
| Single Male/Father | 43 (2.2%) | 4.16 |
| Single Female/Mother | 246 (12.6%) | 3.09 |
| Non-family | 390 (20.0%) | 1.18 |
| Total Households | 1,954 (100.0%) | 3.31 |
Household Size by Marriage Status in Potomac Mills
Out of a total of 1,954 households in Potomac Mills, 1,564 (80.0%) are family households, while 390 (20.0%) are nonfamily households. The most numerous type of family households are 4-person households, comprising 480, and the most common type of nonfamily households are 1-person households, comprising 337.
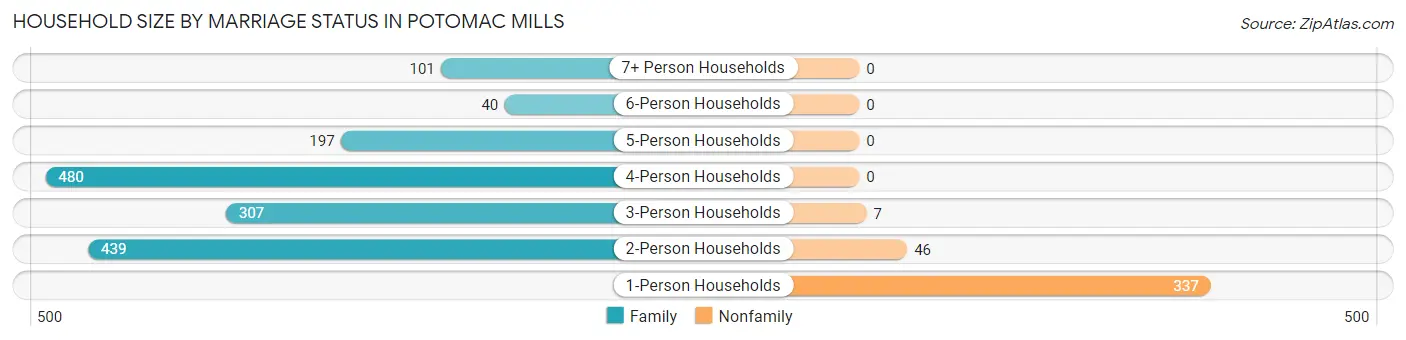
| Household Size | Family Households | Nonfamily Households |
| 1-Person Households | - | 337 (17.2%) |
| 2-Person Households | 439 (22.5%) | 46 (2.4%) |
| 3-Person Households | 307 (15.7%) | 7 (0.4%) |
| 4-Person Households | 480 (24.6%) | 0 (0.0%) |
| 5-Person Households | 197 (10.1%) | 0 (0.0%) |
| 6-Person Households | 40 (2.1%) | 0 (0.0%) |
| 7+ Person Households | 101 (5.2%) | 0 (0.0%) |
| Total | 1,564 (80.0%) | 390 (20.0%) |
Female Fertility in Potomac Mills
Fertility by Age in Potomac Mills
Average fertility rate in Potomac Mills is 38.0 births per 1,000 women. Women in the age bracket of 35 to 50 years have the highest fertility rate with 53.0 births per 1,000 women. Women in the age bracket of 35 to 50 years acount for 72.6% of all women with births.
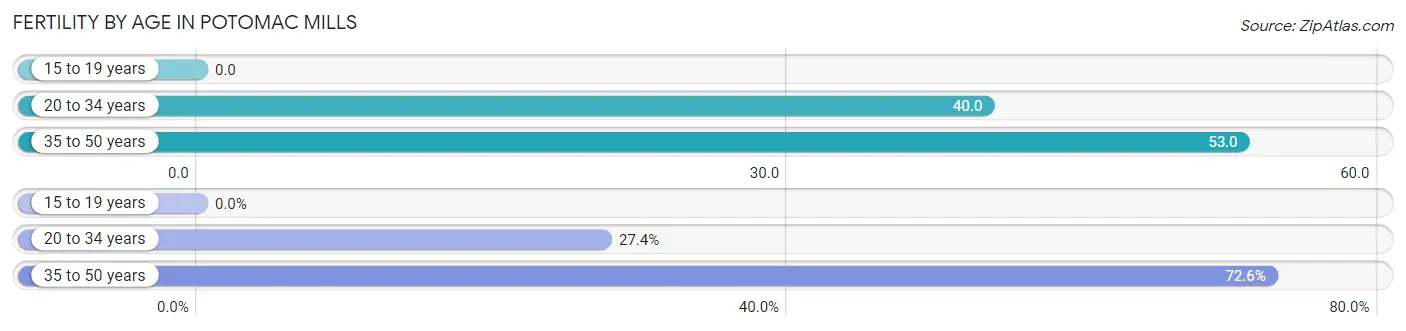
| Age Bracket | Women with Births | Births / 1,000 Women |
| 15 to 19 years | 0 (0.0%) | 0.0 |
| 20 to 34 years | 17 (27.4%) | 40.0 |
| 35 to 50 years | 45 (72.6%) | 53.0 |
| Total | 62 (100.0%) | 38.0 |
Fertility by Age by Marriage Status in Potomac Mills
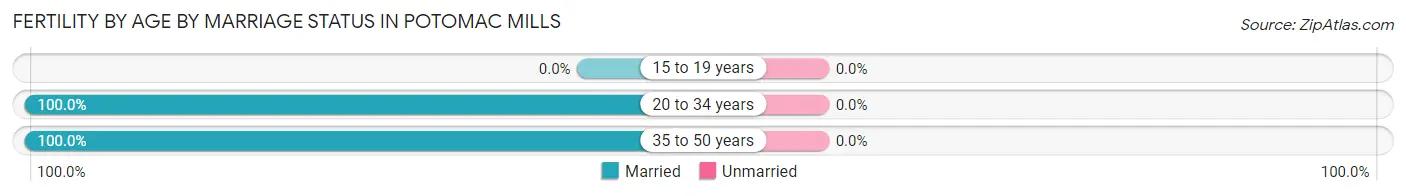
| Age Bracket | Married | Unmarried |
| 15 to 19 years | 0 (0.0%) | 0 (0.0%) |
| 20 to 34 years | 17 (100.0%) | 0 (0.0%) |
| 35 to 50 years | 45 (100.0%) | 0 (0.0%) |
| Total | 62 (100.0%) | 0 (0.0%) |
Fertility by Education in Potomac Mills
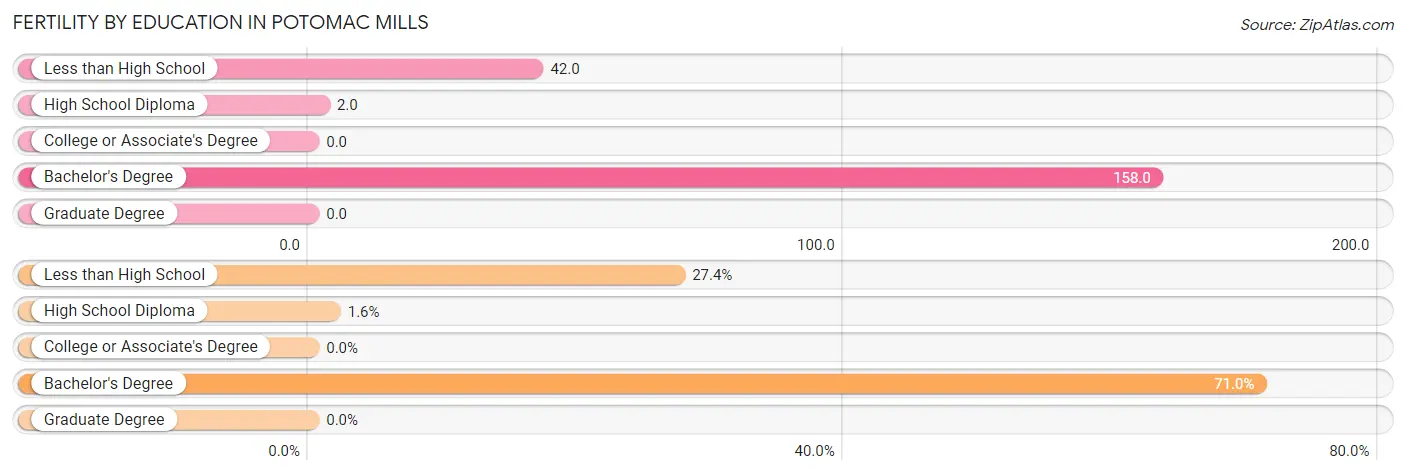
| Educational Attainment | Women with Births | Births / 1,000 Women |
| Less than High School | 17 (27.4%) | 42.0 |
| High School Diploma | 1 (1.6%) | 2.0 |
| College or Associate's Degree | 0 (0.0%) | 0.0 |
| Bachelor's Degree | 44 (71.0%) | 158.0 |
| Graduate Degree | 0 (0.0%) | 0.0 |
| Total | 62 (100.0%) | 38.0 |
Fertility by Education by Marriage Status in Potomac Mills
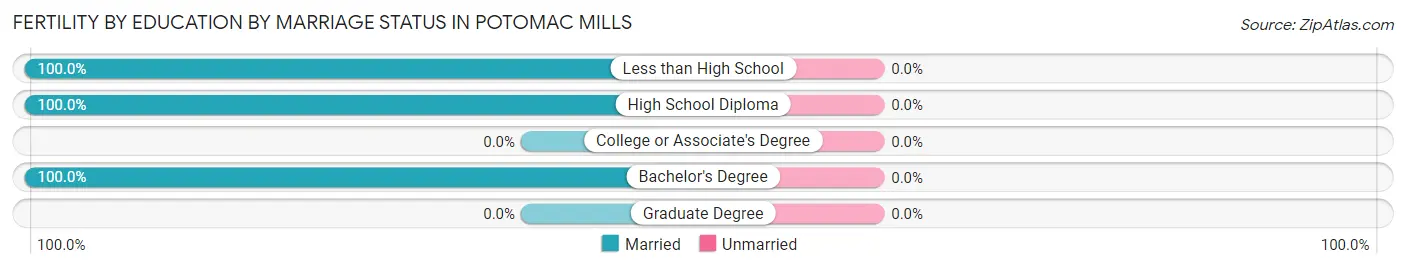
| Educational Attainment | Married | Unmarried |
| Less than High School | 17 (100.0%) | 0 (0.0%) |
| High School Diploma | 1 (100.0%) | 0 (0.0%) |
| College or Associate's Degree | 0 (0.0%) | 0 (0.0%) |
| Bachelor's Degree | 44 (100.0%) | 0 (0.0%) |
| Graduate Degree | 0 (0.0%) | 0 (0.0%) |
| Total | 62 (100.0%) | 0 (0.0%) |
Employment Characteristics in Potomac Mills
Employment by Class of Employer in Potomac Mills
Among the 3,116 employed individuals in Potomac Mills, private company employees (2,183 | 70.1%), federal government employees (273 | 8.8%), and local government employees (262 | 8.4%) make up the most common classes of employment.
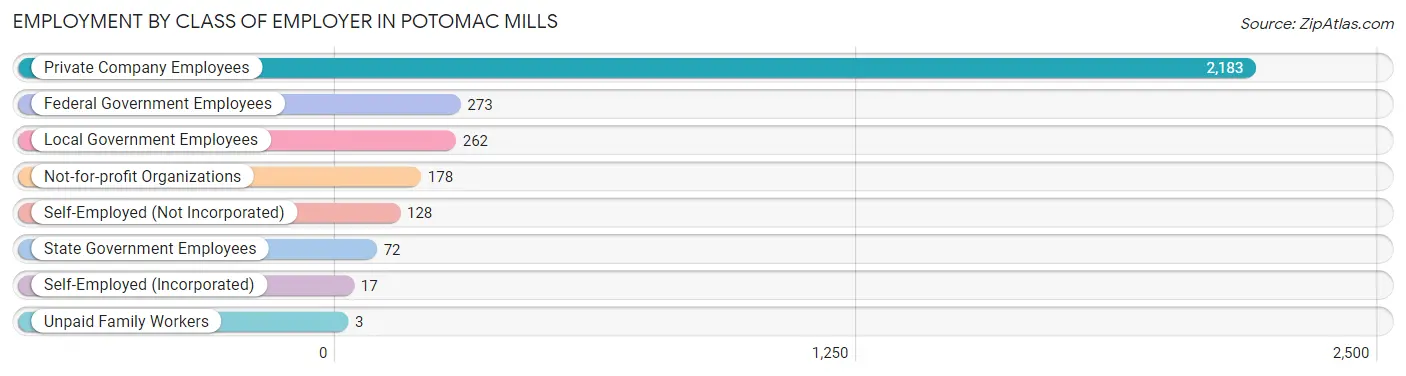
| Employer Class | # Employees | % Employees |
| Private Company Employees | 2,183 | 70.1% |
| Self-Employed (Incorporated) | 17 | 0.5% |
| Self-Employed (Not Incorporated) | 128 | 4.1% |
| Not-for-profit Organizations | 178 | 5.7% |
| Local Government Employees | 262 | 8.4% |
| State Government Employees | 72 | 2.3% |
| Federal Government Employees | 273 | 8.8% |
| Unpaid Family Workers | 3 | 0.1% |
| Total | 3,116 | 100.0% |
Employment Status by Age in Potomac Mills
According to the labor force statistics for Potomac Mills, out of the total population over 16 years of age (4,906), 66.2% or 3,248 individuals are in the labor force, with 3.8% or 123 of them unemployed. The age group with the highest labor force participation rate is 55 to 59 years, with 90.1% or 335 individuals in the labor force. Within the labor force, the 25 to 29 years age range has the highest percentage of unemployed individuals, with 16.5% or 31 of them being unemployed.
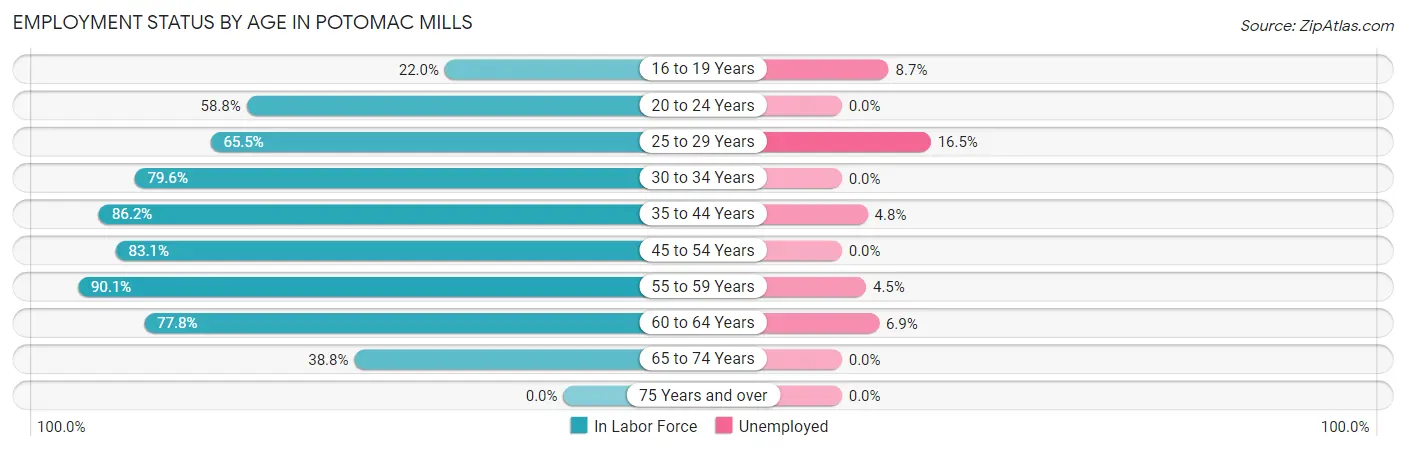
| Age Bracket | In Labor Force | Unemployed |
| 16 to 19 Years | 138 (22.0%) | 12 (8.7%) |
| 20 to 24 Years | 124 (58.8%) | 0 (0.0%) |
| 25 to 29 Years | 188 (65.5%) | 31 (16.5%) |
| 30 to 34 Years | 324 (79.6%) | 0 (0.0%) |
| 35 to 44 Years | 1,053 (86.2%) | 51 (4.8%) |
| 45 to 54 Years | 701 (83.1%) | 0 (0.0%) |
| 55 to 59 Years | 335 (90.1%) | 15 (4.5%) |
| 60 to 64 Years | 189 (77.8%) | 13 (6.9%) |
| 65 to 74 Years | 194 (38.8%) | 0 (0.0%) |
| 75 Years and over | 0 (0.0%) | 0 (0.0%) |
| Total | 3,248 (66.2%) | 123 (3.8%) |
Employment Status by Educational Attainment in Potomac Mills
According to labor force statistics for Potomac Mills, 82.7% of individuals (2,790) out of the total population between 25 and 64 years of age (3,374) are in the labor force, with 3.9% or 109 of them being unemployed. The group with the highest labor force participation rate are those with the educational attainment of bachelor's degree or higher, with 88.0% or 1,095 individuals in the labor force. Within the labor force, individuals with college / associate degree education have the highest percentage of unemployment, with 6.6% or 44 of them being unemployed.
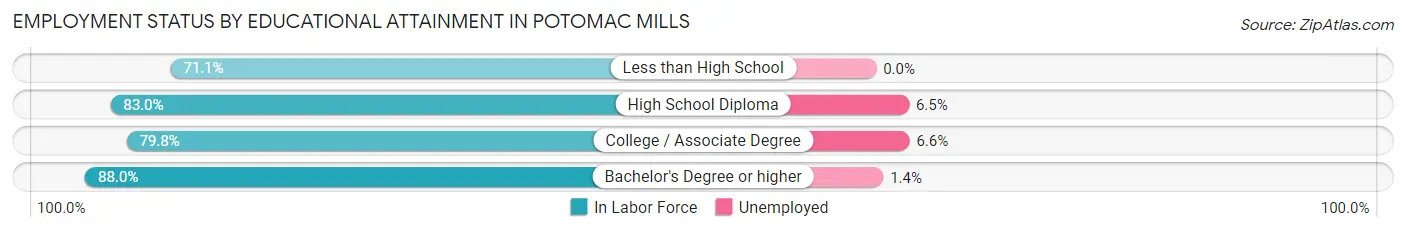
| Educational Attainment | In Labor Force | Unemployed |
| Less than High School | 275 (71.1%) | 0 (0.0%) |
| High School Diploma | 758 (83.0%) | 59 (6.5%) |
| College / Associate Degree | 662 (79.8%) | 55 (6.6%) |
| Bachelor's Degree or higher | 1,095 (88.0%) | 17 (1.4%) |
| Total | 2,790 (82.7%) | 132 (3.9%) |
Employment Occupations by Sex in Potomac Mills
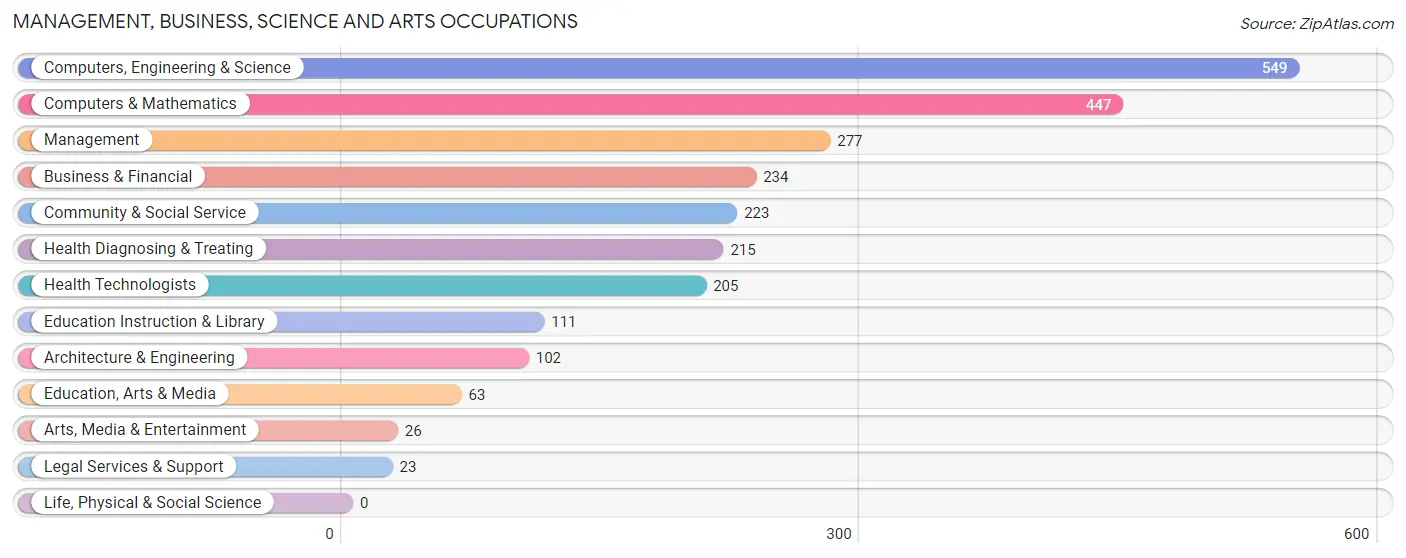
Management, Business, Science and Arts Occupations
The most common Management, Business, Science and Arts occupations in Potomac Mills are Computers, Engineering & Science (549 | 17.9%), Computers & Mathematics (447 | 14.5%), Management (277 | 9.0%), Business & Financial (234 | 7.6%), and Community & Social Service (223 | 7.3%).
Management, Business, Science and Arts Occupations by Sex
Within the Management, Business, Science and Arts occupations in Potomac Mills, the most male-oriented occupations are Architecture & Engineering (100.0%), Computers, Engineering & Science (91.6%), and Computers & Mathematics (89.7%), while the most female-oriented occupations are Education, Arts & Media (100.0%), Health Technologists (96.6%), and Health Diagnosing & Treating (93.0%).
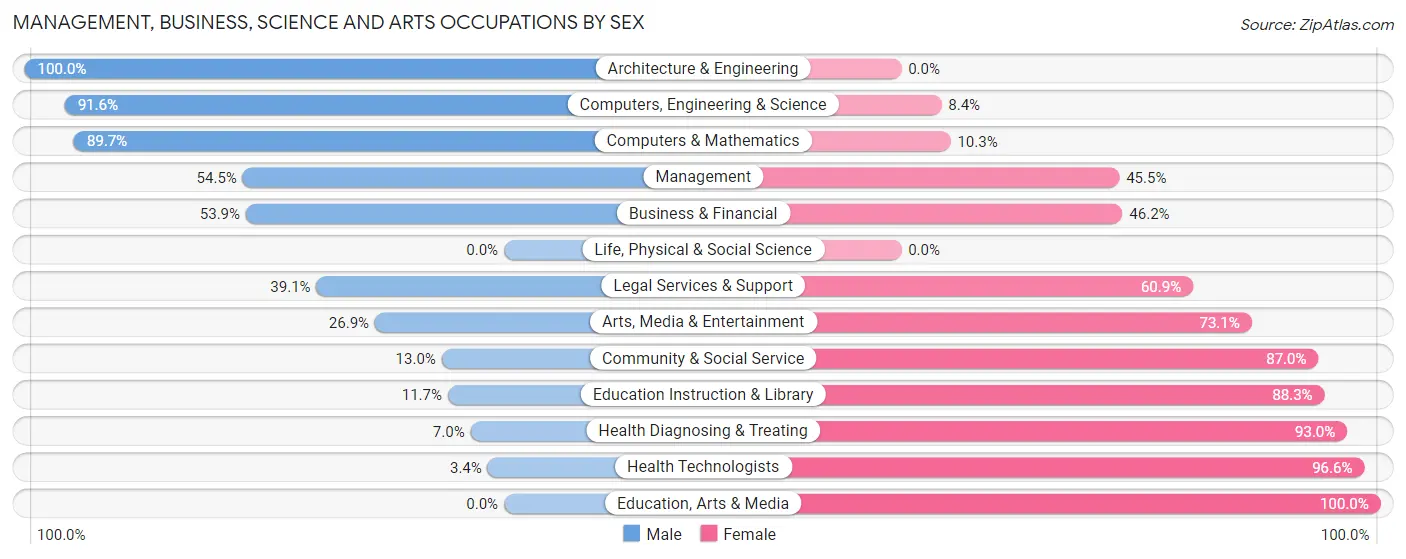
| Occupation | Male | Female |
| Management | 151 (54.5%) | 126 (45.5%) |
| Business & Financial | 126 (53.8%) | 108 (46.2%) |
| Computers, Engineering & Science | 503 (91.6%) | 46 (8.4%) |
| Computers & Mathematics | 401 (89.7%) | 46 (10.3%) |
| Architecture & Engineering | 102 (100.0%) | 0 (0.0%) |
| Life, Physical & Social Science | 0 (0.0%) | 0 (0.0%) |
| Community & Social Service | 29 (13.0%) | 194 (87.0%) |
| Education, Arts & Media | 0 (0.0%) | 63 (100.0%) |
| Legal Services & Support | 9 (39.1%) | 14 (60.9%) |
| Education Instruction & Library | 13 (11.7%) | 98 (88.3%) |
| Arts, Media & Entertainment | 7 (26.9%) | 19 (73.1%) |
| Health Diagnosing & Treating | 15 (7.0%) | 200 (93.0%) |
| Health Technologists | 7 (3.4%) | 198 (96.6%) |
| Total (Category) | 824 (55.0%) | 674 (45.0%) |
| Total (Overall) | 1,716 (55.9%) | 1,356 (44.1%) |
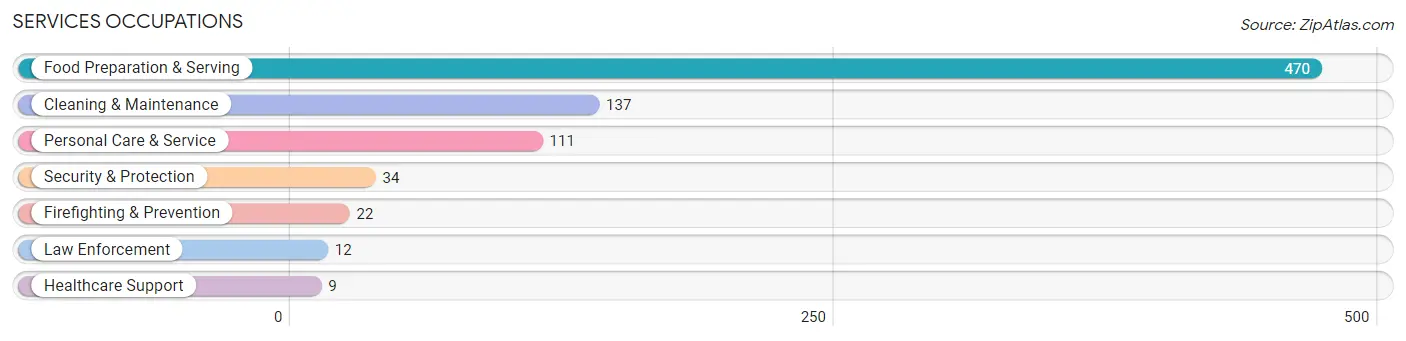
Services Occupations
The most common Services occupations in Potomac Mills are Food Preparation & Serving (470 | 15.3%), Cleaning & Maintenance (137 | 4.5%), Personal Care & Service (111 | 3.6%), Security & Protection (34 | 1.1%), and Firefighting & Prevention (22 | 0.7%).
Services Occupations by Sex
Within the Services occupations in Potomac Mills, the most male-oriented occupations are Healthcare Support (100.0%), Security & Protection (100.0%), and Firefighting & Prevention (100.0%), while the most female-oriented occupations are Personal Care & Service (83.8%), Cleaning & Maintenance (75.9%), and Food Preparation & Serving (36.6%).
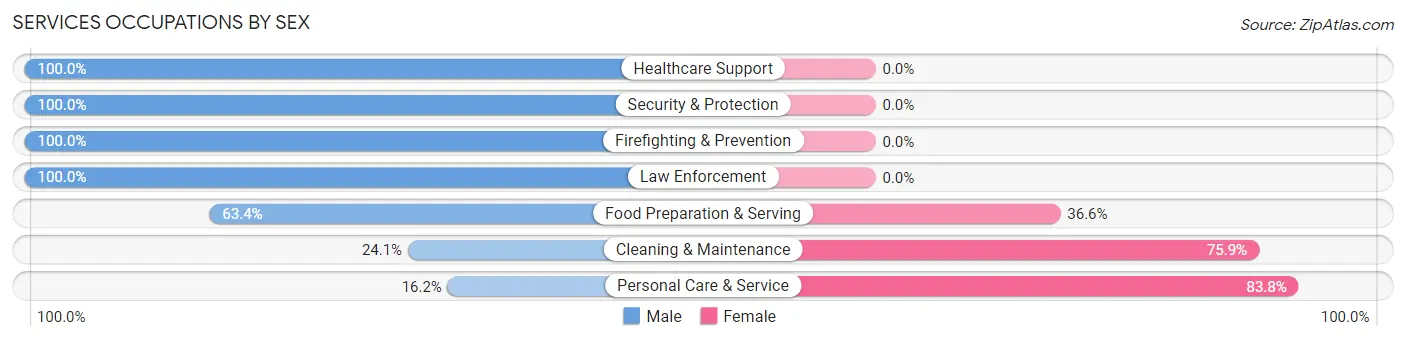
| Occupation | Male | Female |
| Healthcare Support | 9 (100.0%) | 0 (0.0%) |
| Security & Protection | 34 (100.0%) | 0 (0.0%) |
| Firefighting & Prevention | 22 (100.0%) | 0 (0.0%) |
| Law Enforcement | 12 (100.0%) | 0 (0.0%) |
| Food Preparation & Serving | 298 (63.4%) | 172 (36.6%) |
| Cleaning & Maintenance | 33 (24.1%) | 104 (75.9%) |
| Personal Care & Service | 18 (16.2%) | 93 (83.8%) |
| Total (Category) | 392 (51.5%) | 369 (48.5%) |
| Total (Overall) | 1,716 (55.9%) | 1,356 (44.1%) |
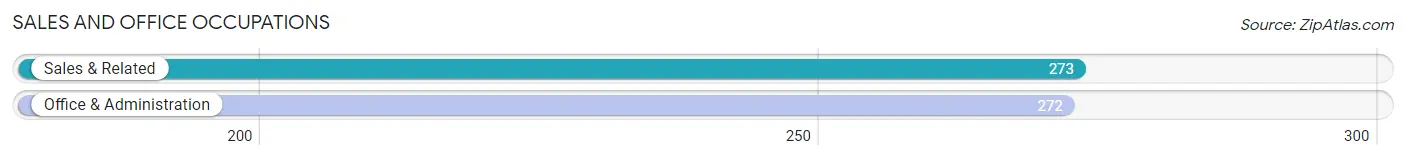
Sales and Office Occupations
The most common Sales and Office occupations in Potomac Mills are Sales & Related (273 | 8.9%), and Office & Administration (272 | 8.8%).
Sales and Office Occupations by Sex
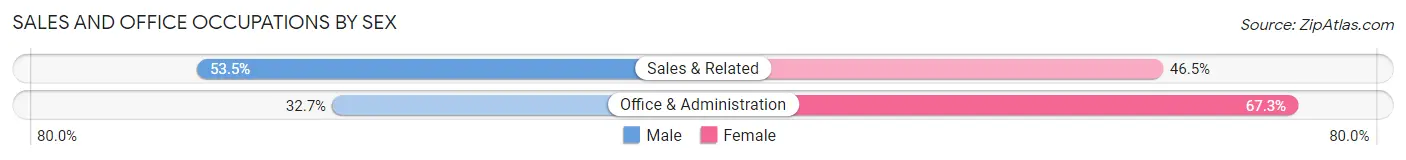
| Occupation | Male | Female |
| Sales & Related | 146 (53.5%) | 127 (46.5%) |
| Office & Administration | 89 (32.7%) | 183 (67.3%) |
| Total (Category) | 235 (43.1%) | 310 (56.9%) |
| Total (Overall) | 1,716 (55.9%) | 1,356 (44.1%) |
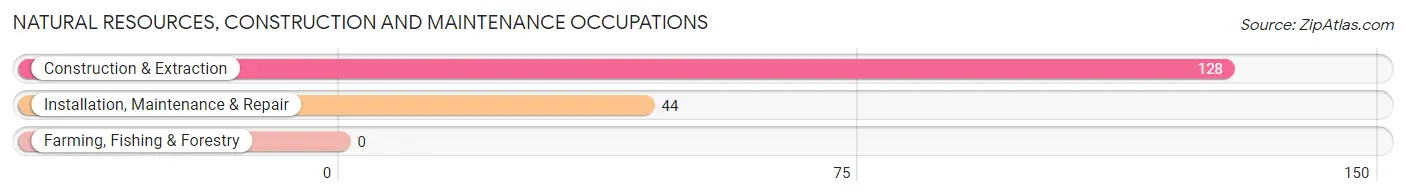
Natural Resources, Construction and Maintenance Occupations
The most common Natural Resources, Construction and Maintenance occupations in Potomac Mills are Construction & Extraction (128 | 4.2%), and Installation, Maintenance & Repair (44 | 1.4%).
Natural Resources, Construction and Maintenance Occupations by Sex
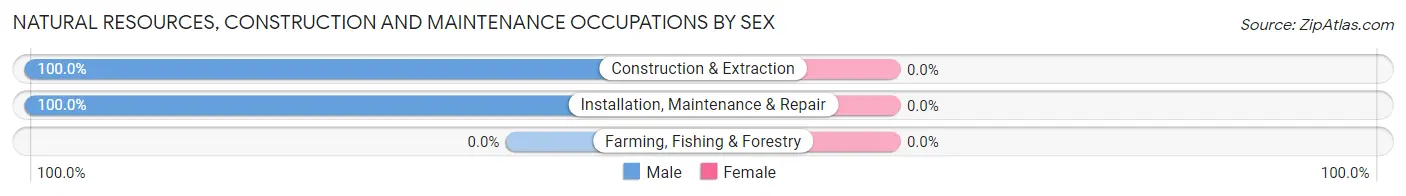
| Occupation | Male | Female |
| Farming, Fishing & Forestry | 0 (0.0%) | 0 (0.0%) |
| Construction & Extraction | 128 (100.0%) | 0 (0.0%) |
| Installation, Maintenance & Repair | 44 (100.0%) | 0 (0.0%) |
| Total (Category) | 172 (100.0%) | 0 (0.0%) |
| Total (Overall) | 1,716 (55.9%) | 1,356 (44.1%) |
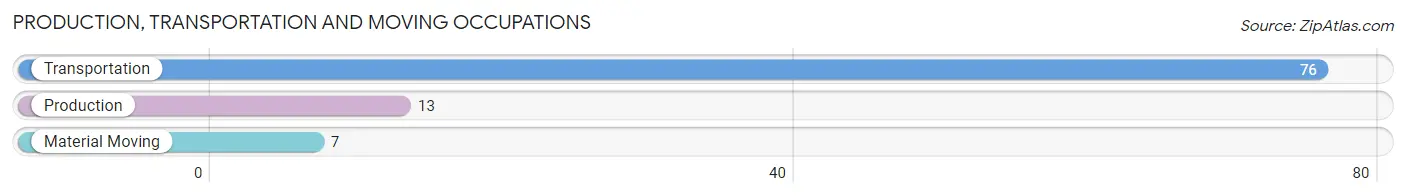
Production, Transportation and Moving Occupations
The most common Production, Transportation and Moving occupations in Potomac Mills are Transportation (76 | 2.5%), Production (13 | 0.4%), and Material Moving (7 | 0.2%).
Production, Transportation and Moving Occupations by Sex
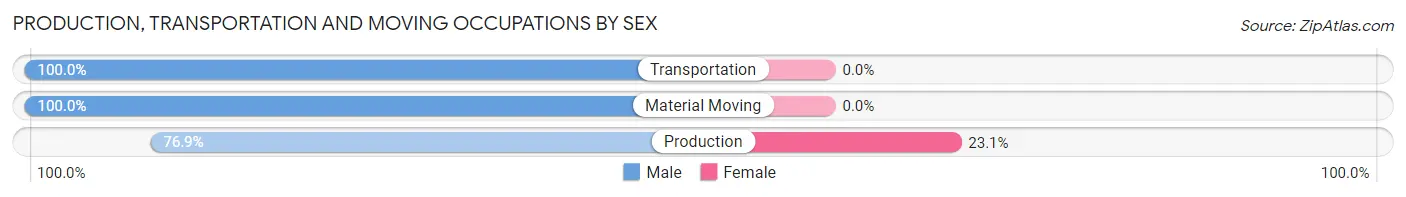
| Occupation | Male | Female |
| Production | 10 (76.9%) | 3 (23.1%) |
| Transportation | 76 (100.0%) | 0 (0.0%) |
| Material Moving | 7 (100.0%) | 0 (0.0%) |
| Total (Category) | 93 (96.9%) | 3 (3.1%) |
| Total (Overall) | 1,716 (55.9%) | 1,356 (44.1%) |
Employment Industries by Sex in Potomac Mills
Employment Industries in Potomac Mills
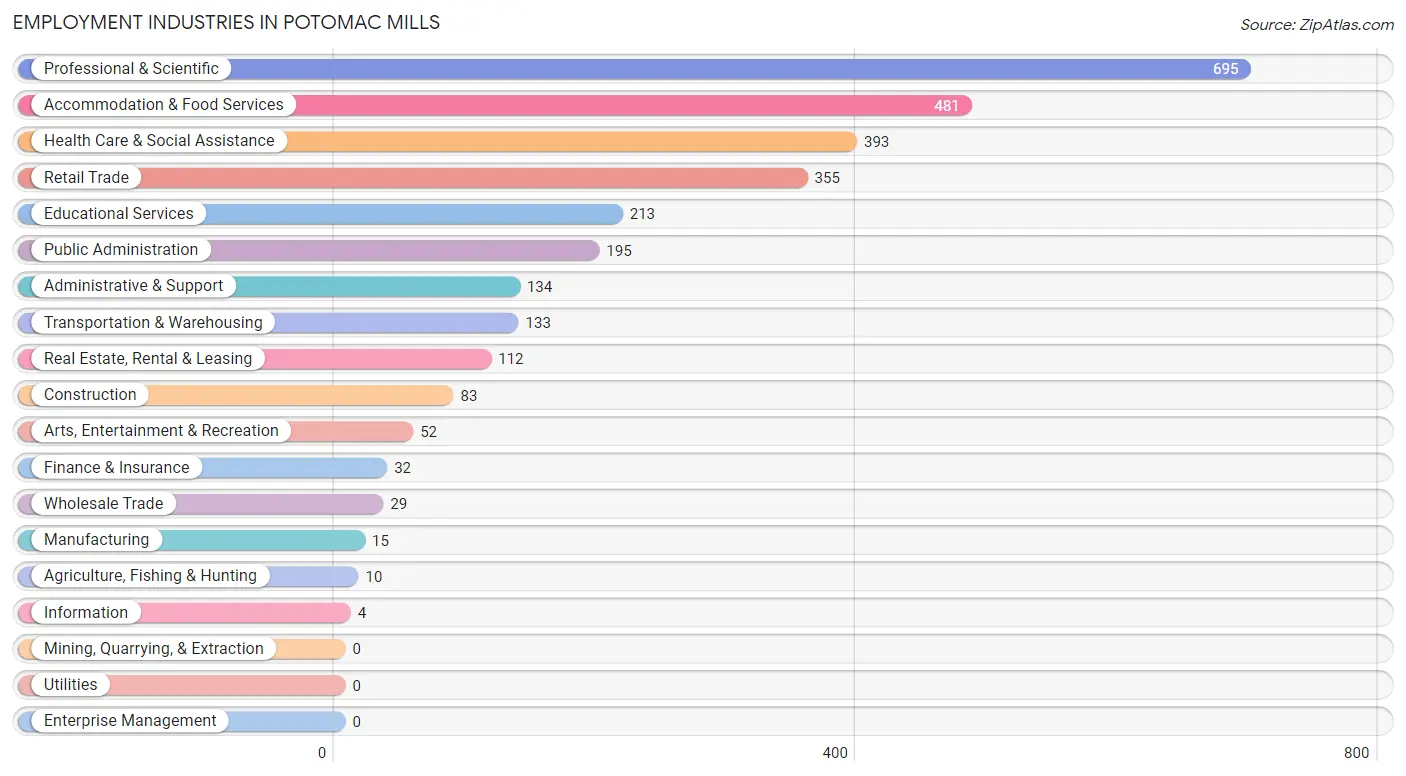
The major employment industries in Potomac Mills include Professional & Scientific (695 | 22.6%), Accommodation & Food Services (481 | 15.7%), Health Care & Social Assistance (393 | 12.8%), Retail Trade (355 | 11.6%), and Educational Services (213 | 6.9%).
Employment Industries by Sex in Potomac Mills
The Potomac Mills industries that see more men than women are Agriculture, Fishing & Hunting (100.0%), Wholesale Trade (100.0%), and Transportation & Warehousing (94.7%), whereas the industries that tend to have a higher number of women are Information (100.0%), Finance & Insurance (100.0%), and Health Care & Social Assistance (86.3%).
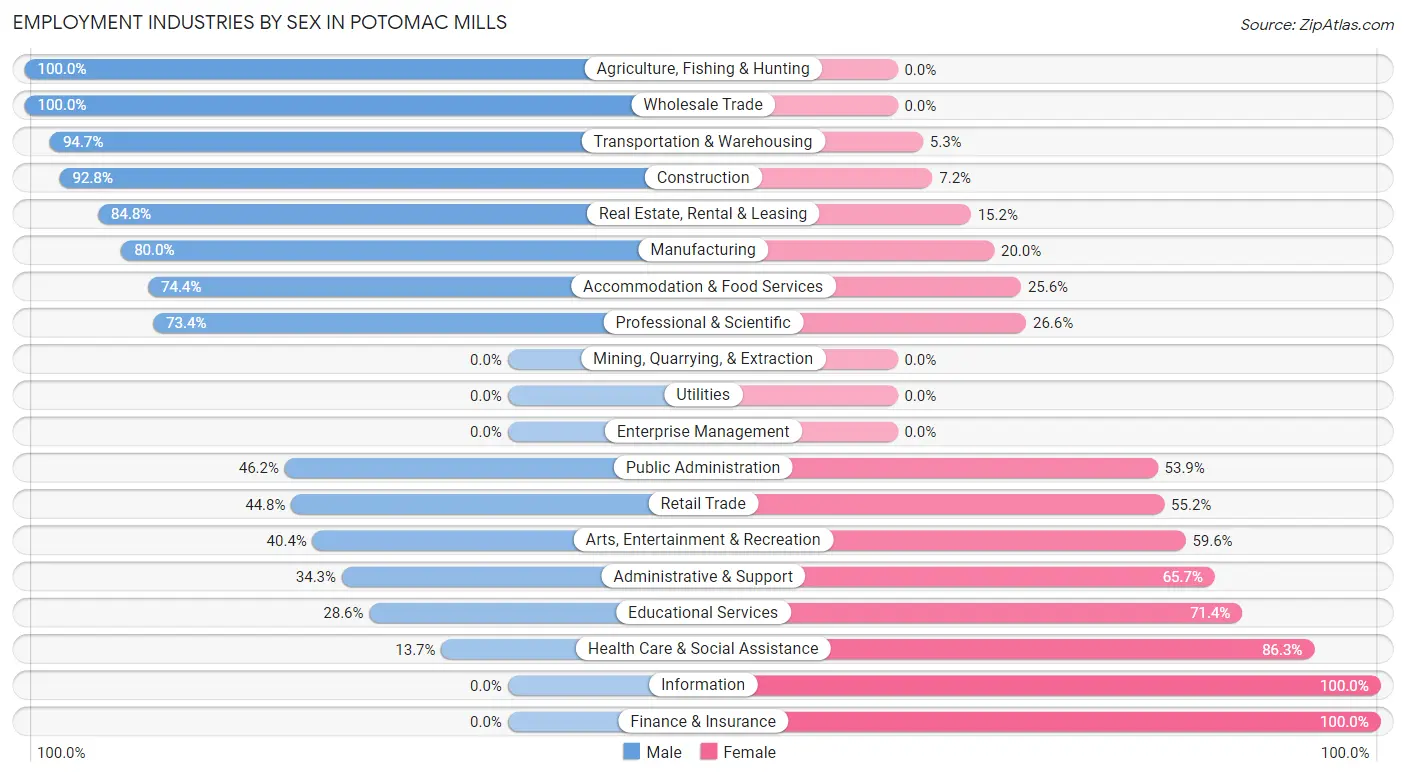
| Industry | Male | Female |
| Agriculture, Fishing & Hunting | 10 (100.0%) | 0 (0.0%) |
| Mining, Quarrying, & Extraction | 0 (0.0%) | 0 (0.0%) |
| Construction | 77 (92.8%) | 6 (7.2%) |
| Manufacturing | 12 (80.0%) | 3 (20.0%) |
| Wholesale Trade | 29 (100.0%) | 0 (0.0%) |
| Retail Trade | 159 (44.8%) | 196 (55.2%) |
| Transportation & Warehousing | 126 (94.7%) | 7 (5.3%) |
| Utilities | 0 (0.0%) | 0 (0.0%) |
| Information | 0 (0.0%) | 4 (100.0%) |
| Finance & Insurance | 0 (0.0%) | 32 (100.0%) |
| Real Estate, Rental & Leasing | 95 (84.8%) | 17 (15.2%) |
| Professional & Scientific | 510 (73.4%) | 185 (26.6%) |
| Enterprise Management | 0 (0.0%) | 0 (0.0%) |
| Administrative & Support | 46 (34.3%) | 88 (65.7%) |
| Educational Services | 61 (28.6%) | 152 (71.4%) |
| Health Care & Social Assistance | 54 (13.7%) | 339 (86.3%) |
| Arts, Entertainment & Recreation | 21 (40.4%) | 31 (59.6%) |
| Accommodation & Food Services | 358 (74.4%) | 123 (25.6%) |
| Public Administration | 90 (46.2%) | 105 (53.8%) |
| Total | 1,716 (55.9%) | 1,356 (44.1%) |
Education in Potomac Mills
School Enrollment in Potomac Mills
The most common levels of schooling among the 2,228 students in Potomac Mills are middle school (746 | 33.5%), high school (535 | 24.0%), and college / undergraduate (397 | 17.8%).
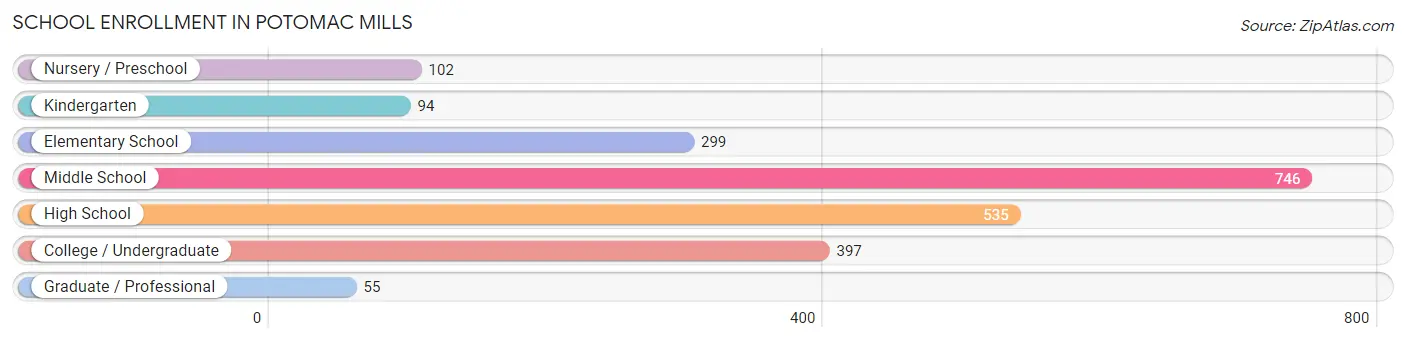
| School Level | # Students | % Students |
| Nursery / Preschool | 102 | 4.6% |
| Kindergarten | 94 | 4.2% |
| Elementary School | 299 | 13.4% |
| Middle School | 746 | 33.5% |
| High School | 535 | 24.0% |
| College / Undergraduate | 397 | 17.8% |
| Graduate / Professional | 55 | 2.5% |
| Total | 2,228 | 100.0% |
School Enrollment by Age by Funding Source in Potomac Mills
Out of a total of 2,228 students who are enrolled in schools in Potomac Mills, 254 (11.4%) attend a private institution, while the remaining 1,974 (88.6%) are enrolled in public schools. The age group of 3 to 4 year olds has the highest likelihood of being enrolled in private schools, with 58 (80.6% in the age bracket) enrolled. Conversely, the age group of 10 to 14 year olds has the lowest likelihood of being enrolled in a private school, with 749 (100.0% in the age bracket) attending a public institution.
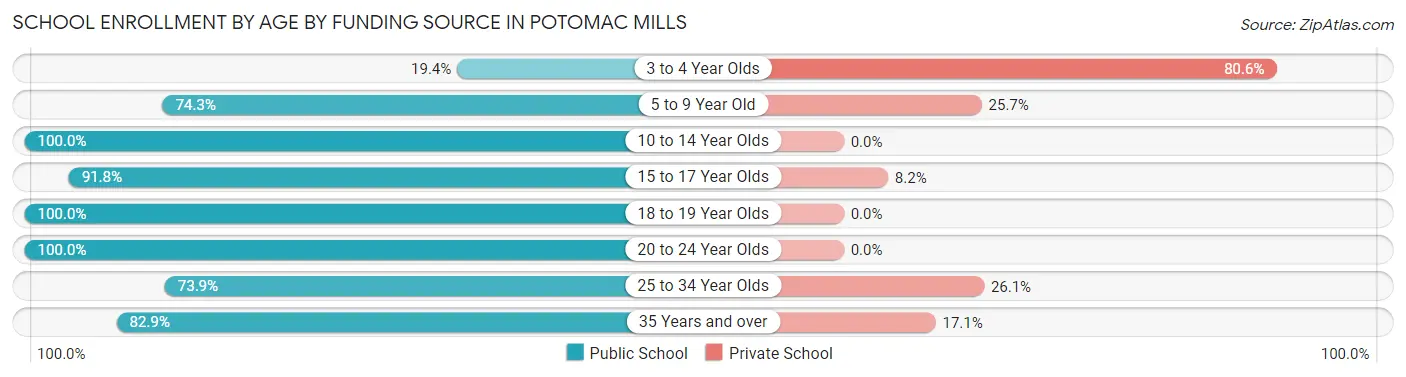
| Age Bracket | Public School | Private School |
| 3 to 4 Year Olds | 14 (19.4%) | 58 (80.6%) |
| 5 to 9 Year Old | 324 (74.3%) | 112 (25.7%) |
| 10 to 14 Year Olds | 749 (100.0%) | 0 (0.0%) |
| 15 to 17 Year Olds | 401 (91.8%) | 36 (8.2%) |
| 18 to 19 Year Olds | 200 (100.0%) | 0 (0.0%) |
| 20 to 24 Year Olds | 112 (100.0%) | 0 (0.0%) |
| 25 to 34 Year Olds | 82 (73.9%) | 29 (26.1%) |
| 35 Years and over | 92 (82.9%) | 19 (17.1%) |
| Total | 1,974 (88.6%) | 254 (11.4%) |
Educational Attainment by Field of Study in Potomac Mills
Business (475 | 29.8%), science & technology (198 | 12.4%), education (170 | 10.6%), engineering (121 | 7.6%), and computers & mathematics (119 | 7.5%) are the most common fields of study among 1,596 individuals in Potomac Mills who have obtained a bachelor's degree or higher.
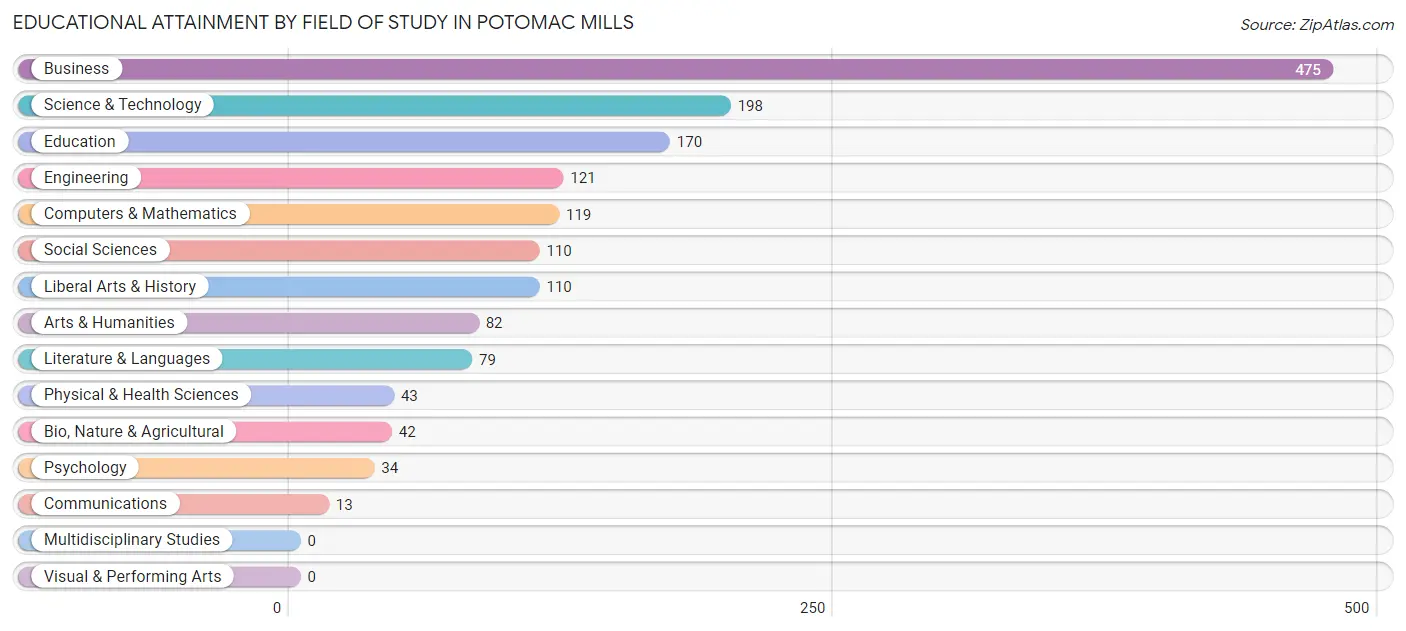
| Field of Study | # Graduates | % Graduates |
| Computers & Mathematics | 119 | 7.5% |
| Bio, Nature & Agricultural | 42 | 2.6% |
| Physical & Health Sciences | 43 | 2.7% |
| Psychology | 34 | 2.1% |
| Social Sciences | 110 | 6.9% |
| Engineering | 121 | 7.6% |
| Multidisciplinary Studies | 0 | 0.0% |
| Science & Technology | 198 | 12.4% |
| Business | 475 | 29.8% |
| Education | 170 | 10.6% |
| Literature & Languages | 79 | 5.0% |
| Liberal Arts & History | 110 | 6.9% |
| Visual & Performing Arts | 0 | 0.0% |
| Communications | 13 | 0.8% |
| Arts & Humanities | 82 | 5.1% |
| Total | 1,596 | 100.0% |
Transportation & Commute in Potomac Mills
Vehicle Availability by Sex in Potomac Mills
The most prevalent vehicle ownership categories in Potomac Mills are males with 2 vehicles (820, accounting for 46.6%) and females with 2 vehicles (576, making up 61.0%).
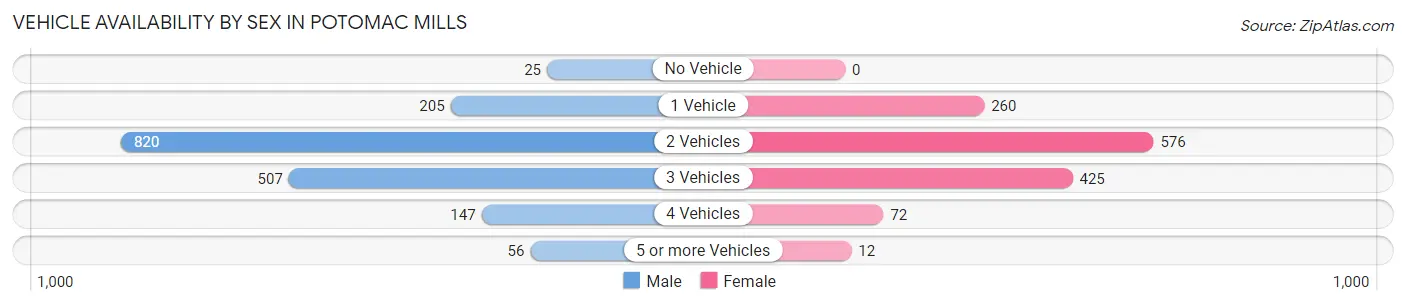
| Vehicles Available | Male | Female |
| No Vehicle | 25 (1.4%) | 0 (0.0%) |
| 1 Vehicle | 205 (11.7%) | 260 (19.3%) |
| 2 Vehicles | 820 (46.6%) | 576 (42.8%) |
| 3 Vehicles | 507 (28.8%) | 425 (31.6%) |
| 4 Vehicles | 147 (8.4%) | 72 (5.3%) |
| 5 or more Vehicles | 56 (3.2%) | 12 (0.9%) |
| Total | 1,760 (100.0%) | 1,345 (100.0%) |
Commute Time in Potomac Mills
The most frequently occuring commute durations in Potomac Mills are 45 to 59 minutes (577 commuters, 21.0%), 30 to 34 minutes (550 commuters, 20.0%), and 15 to 19 minutes (527 commuters, 19.2%).
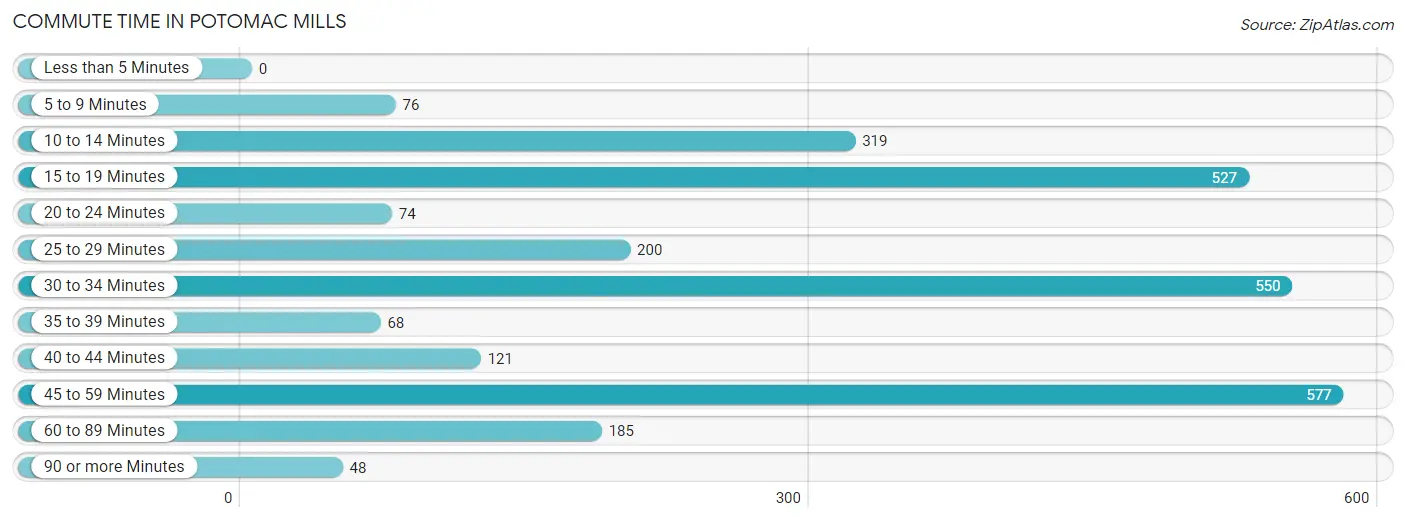
| Commute Time | # Commuters | % Commuters |
| Less than 5 Minutes | 0 | 0.0% |
| 5 to 9 Minutes | 76 | 2.8% |
| 10 to 14 Minutes | 319 | 11.6% |
| 15 to 19 Minutes | 527 | 19.2% |
| 20 to 24 Minutes | 74 | 2.7% |
| 25 to 29 Minutes | 200 | 7.3% |
| 30 to 34 Minutes | 550 | 20.0% |
| 35 to 39 Minutes | 68 | 2.5% |
| 40 to 44 Minutes | 121 | 4.4% |
| 45 to 59 Minutes | 577 | 21.0% |
| 60 to 89 Minutes | 185 | 6.7% |
| 90 or more Minutes | 48 | 1.8% |
Commute Time by Sex in Potomac Mills
The most common commute times in Potomac Mills are 30 to 34 minutes (374 commuters, 25.2%) for males and 15 to 19 minutes (306 commuters, 24.3%) for females.
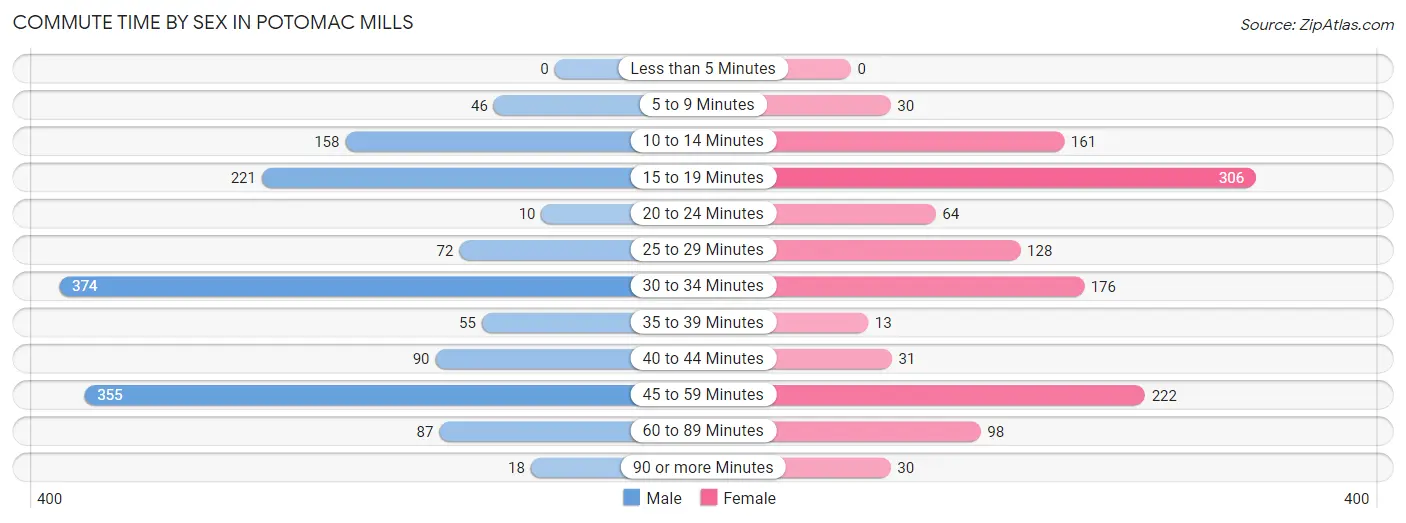
| Commute Time | Male | Female |
| Less than 5 Minutes | 0 (0.0%) | 0 (0.0%) |
| 5 to 9 Minutes | 46 (3.1%) | 30 (2.4%) |
| 10 to 14 Minutes | 158 (10.6%) | 161 (12.8%) |
| 15 to 19 Minutes | 221 (14.9%) | 306 (24.3%) |
| 20 to 24 Minutes | 10 (0.7%) | 64 (5.1%) |
| 25 to 29 Minutes | 72 (4.9%) | 128 (10.2%) |
| 30 to 34 Minutes | 374 (25.2%) | 176 (14.0%) |
| 35 to 39 Minutes | 55 (3.7%) | 13 (1.0%) |
| 40 to 44 Minutes | 90 (6.1%) | 31 (2.5%) |
| 45 to 59 Minutes | 355 (23.9%) | 222 (17.6%) |
| 60 to 89 Minutes | 87 (5.9%) | 98 (7.8%) |
| 90 or more Minutes | 18 (1.2%) | 30 (2.4%) |
Time of Departure to Work by Sex in Potomac Mills
The most frequent times of departure to work in Potomac Mills are 6:00 AM to 6:29 AM (277, 18.6%) for males and 7:30 AM to 7:59 AM (235, 18.7%) for females.
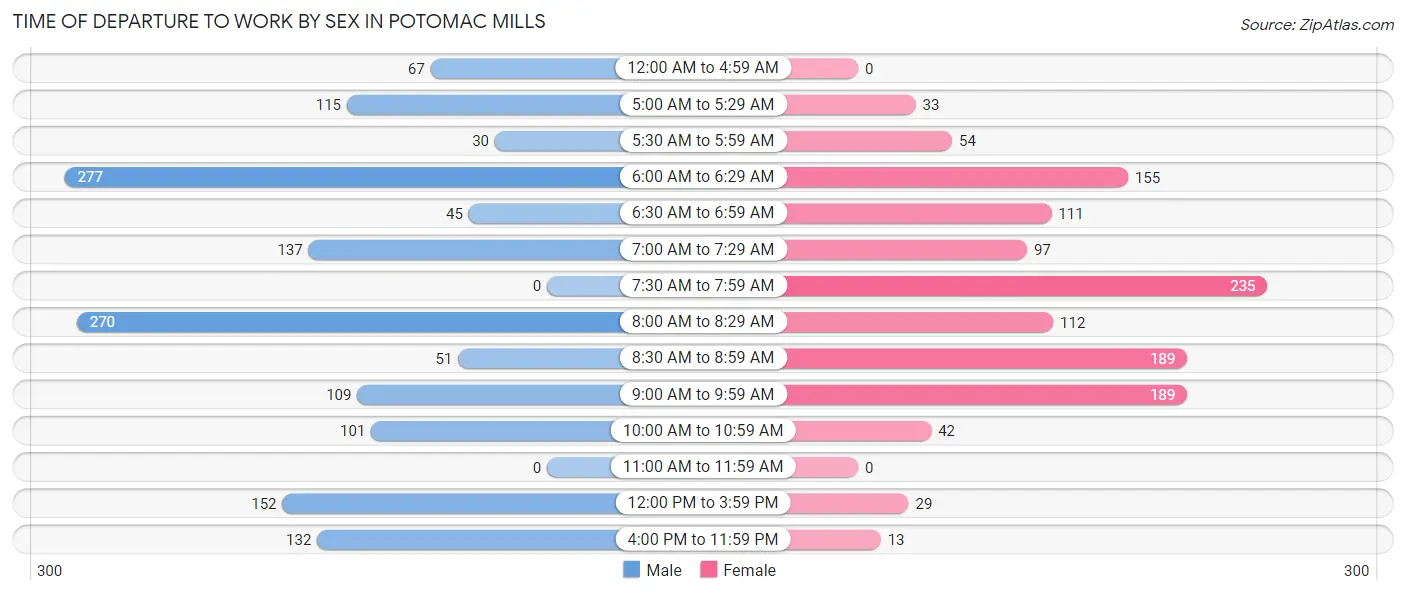
| Time of Departure | Male | Female |
| 12:00 AM to 4:59 AM | 67 (4.5%) | 0 (0.0%) |
| 5:00 AM to 5:29 AM | 115 (7.7%) | 33 (2.6%) |
| 5:30 AM to 5:59 AM | 30 (2.0%) | 54 (4.3%) |
| 6:00 AM to 6:29 AM | 277 (18.6%) | 155 (12.3%) |
| 6:30 AM to 6:59 AM | 45 (3.0%) | 111 (8.8%) |
| 7:00 AM to 7:29 AM | 137 (9.2%) | 97 (7.7%) |
| 7:30 AM to 7:59 AM | 0 (0.0%) | 235 (18.7%) |
| 8:00 AM to 8:29 AM | 270 (18.2%) | 112 (8.9%) |
| 8:30 AM to 8:59 AM | 51 (3.4%) | 189 (15.0%) |
| 9:00 AM to 9:59 AM | 109 (7.3%) | 189 (15.0%) |
| 10:00 AM to 10:59 AM | 101 (6.8%) | 42 (3.3%) |
| 11:00 AM to 11:59 AM | 0 (0.0%) | 0 (0.0%) |
| 12:00 PM to 3:59 PM | 152 (10.2%) | 29 (2.3%) |
| 4:00 PM to 11:59 PM | 132 (8.9%) | 13 (1.0%) |
| Total | 1,486 (100.0%) | 1,259 (100.0%) |
Housing Occupancy in Potomac Mills
Occupancy by Ownership in Potomac Mills
Of the total 1,954 dwellings in Potomac Mills, owner-occupied units account for 1,415 (72.4%), while renter-occupied units make up 539 (27.6%).
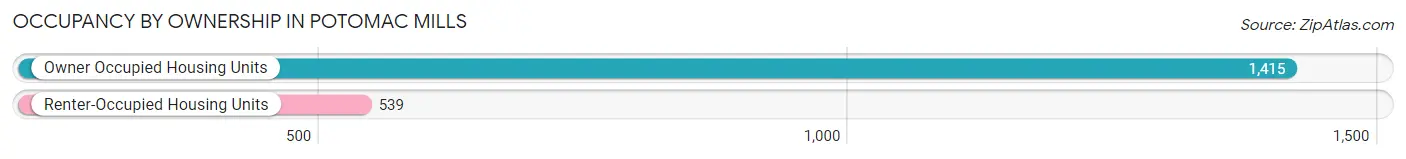
| Occupancy | # Housing Units | % Housing Units |
| Owner Occupied Housing Units | 1,415 | 72.4% |
| Renter-Occupied Housing Units | 539 | 27.6% |
| Total Occupied Housing Units | 1,954 | 100.0% |
Occupancy by Household Size in Potomac Mills
| Household Size | # Housing Units | % Housing Units |
| 1-Person Household | 337 | 17.2% |
| 2-Person Household | 485 | 24.8% |
| 3-Person Household | 314 | 16.1% |
| 4+ Person Household | 818 | 41.9% |
| Total Housing Units | 1,954 | 100.0% |
Occupancy by Ownership by Household Size in Potomac Mills
| Household Size | Owner-occupied | Renter-occupied |
| 1-Person Household | 217 (64.4%) | 120 (35.6%) |
| 2-Person Household | 328 (67.6%) | 157 (32.4%) |
| 3-Person Household | 268 (85.4%) | 46 (14.6%) |
| 4+ Person Household | 602 (73.6%) | 216 (26.4%) |
| Total Housing Units | 1,415 (72.4%) | 539 (27.6%) |
Occupancy by Educational Attainment in Potomac Mills
| Household Size | Owner-occupied | Renter-occupied |
| Less than High School | 98 (62.0%) | 60 (38.0%) |
| High School Diploma | 153 (38.6%) | 243 (61.4%) |
| College/Associate Degree | 455 (87.8%) | 63 (12.2%) |
| Bachelor's Degree or higher | 709 (80.4%) | 173 (19.6%) |
Occupancy by Age of Householder in Potomac Mills
| Age Bracket | # Households | % Households |
| Under 35 Years | 188 | 9.6% |
| 35 to 44 Years | 635 | 32.5% |
| 45 to 54 Years | 435 | 22.3% |
| 55 to 64 Years | 327 | 16.7% |
| 65 to 74 Years | 244 | 12.5% |
| 75 to 84 Years | 107 | 5.5% |
| 85 Years and Over | 18 | 0.9% |
| Total | 1,954 | 100.0% |
Housing Finances in Potomac Mills
Median Income by Occupancy in Potomac Mills
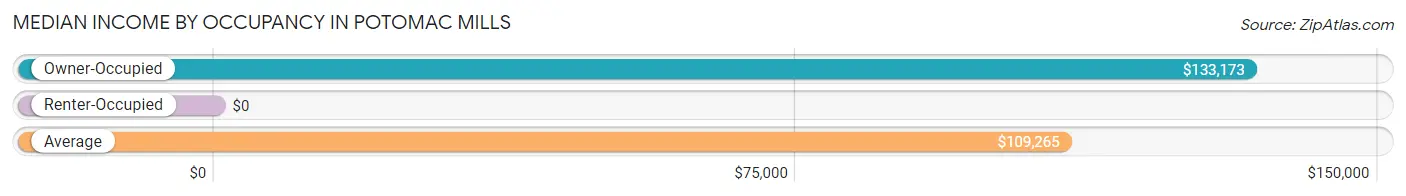
| Occupancy Type | # Households | Median Income |
| Owner-Occupied | 1,415 (72.4%) | $133,173 |
| Renter-Occupied | 539 (27.6%) | $0 |
| Average | 1,954 (100.0%) | $109,265 |
Occupancy by Householder Income Bracket in Potomac Mills
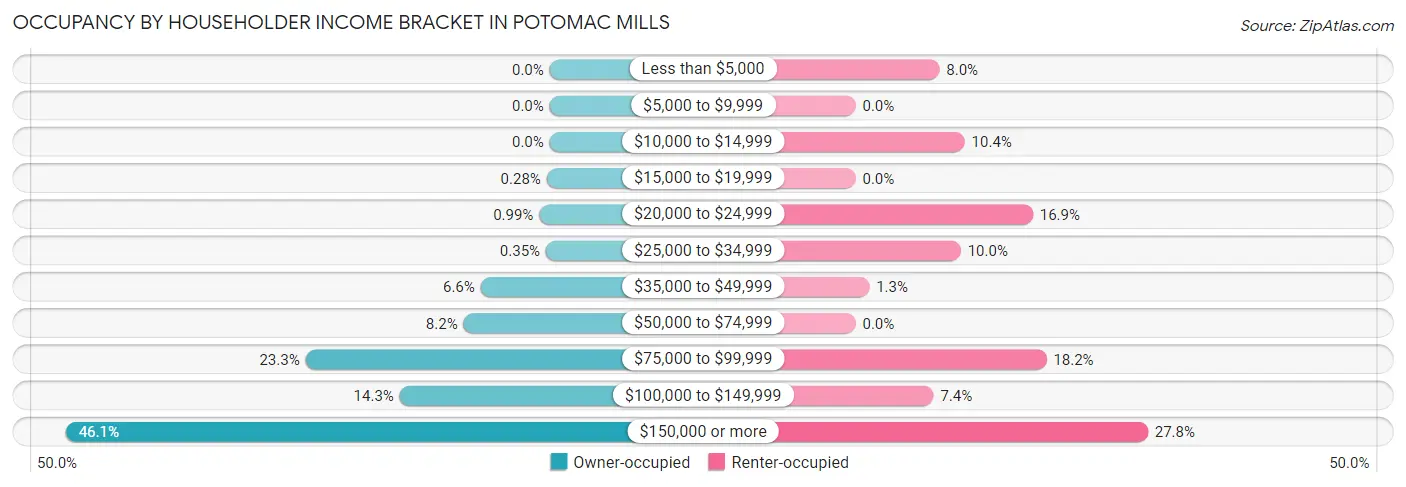
| Income Bracket | Owner-occupied | Renter-occupied |
| Less than $5,000 | 0 (0.0%) | 43 (8.0%) |
| $5,000 to $9,999 | 0 (0.0%) | 0 (0.0%) |
| $10,000 to $14,999 | 0 (0.0%) | 56 (10.4%) |
| $15,000 to $19,999 | 4 (0.3%) | 0 (0.0%) |
| $20,000 to $24,999 | 14 (1.0%) | 91 (16.9%) |
| $25,000 to $34,999 | 5 (0.4%) | 54 (10.0%) |
| $35,000 to $49,999 | 93 (6.6%) | 7 (1.3%) |
| $50,000 to $74,999 | 116 (8.2%) | 0 (0.0%) |
| $75,000 to $99,999 | 329 (23.3%) | 98 (18.2%) |
| $100,000 to $149,999 | 202 (14.3%) | 40 (7.4%) |
| $150,000 or more | 652 (46.1%) | 150 (27.8%) |
| Total | 1,415 (100.0%) | 539 (100.0%) |
Monthly Housing Cost Tiers in Potomac Mills
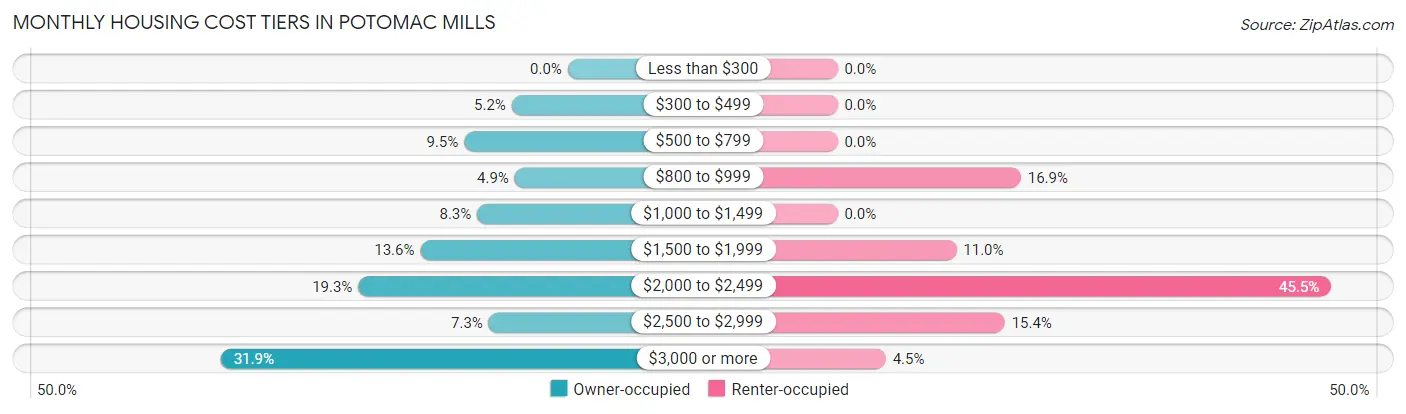
| Monthly Cost | Owner-occupied | Renter-occupied |
| Less than $300 | 0 (0.0%) | 0 (0.0%) |
| $300 to $499 | 73 (5.2%) | 0 (0.0%) |
| $500 to $799 | 135 (9.5%) | 0 (0.0%) |
| $800 to $999 | 69 (4.9%) | 91 (16.9%) |
| $1,000 to $1,499 | 118 (8.3%) | 0 (0.0%) |
| $1,500 to $1,999 | 192 (13.6%) | 59 (11.0%) |
| $2,000 to $2,499 | 273 (19.3%) | 245 (45.5%) |
| $2,500 to $2,999 | 103 (7.3%) | 83 (15.4%) |
| $3,000 or more | 452 (31.9%) | 24 (4.4%) |
| Total | 1,415 (100.0%) | 539 (100.0%) |
Physical Housing Characteristics in Potomac Mills
Housing Structures in Potomac Mills
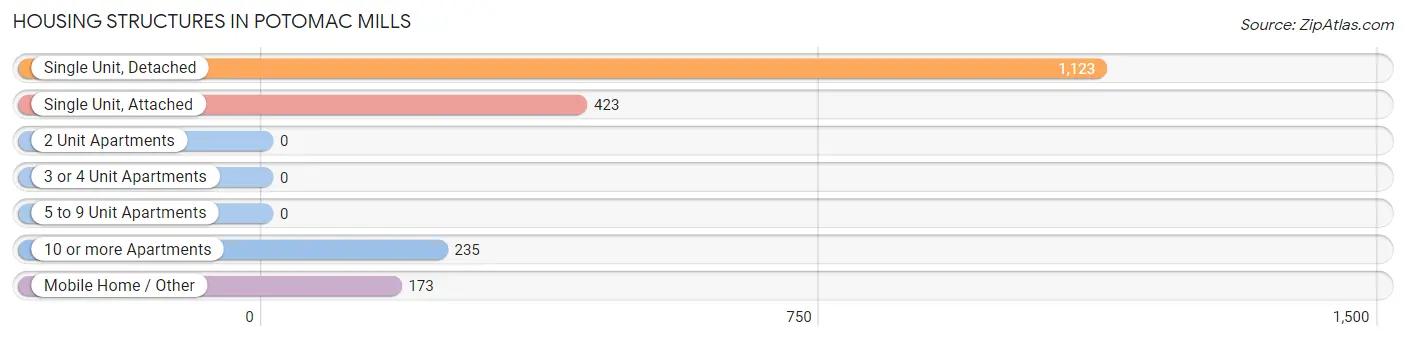
| Structure Type | # Housing Units | % Housing Units |
| Single Unit, Detached | 1,123 | 57.5% |
| Single Unit, Attached | 423 | 21.6% |
| 2 Unit Apartments | 0 | 0.0% |
| 3 or 4 Unit Apartments | 0 | 0.0% |
| 5 to 9 Unit Apartments | 0 | 0.0% |
| 10 or more Apartments | 235 | 12.0% |
| Mobile Home / Other | 173 | 8.8% |
| Total | 1,954 | 100.0% |
Housing Structures by Occupancy in Potomac Mills
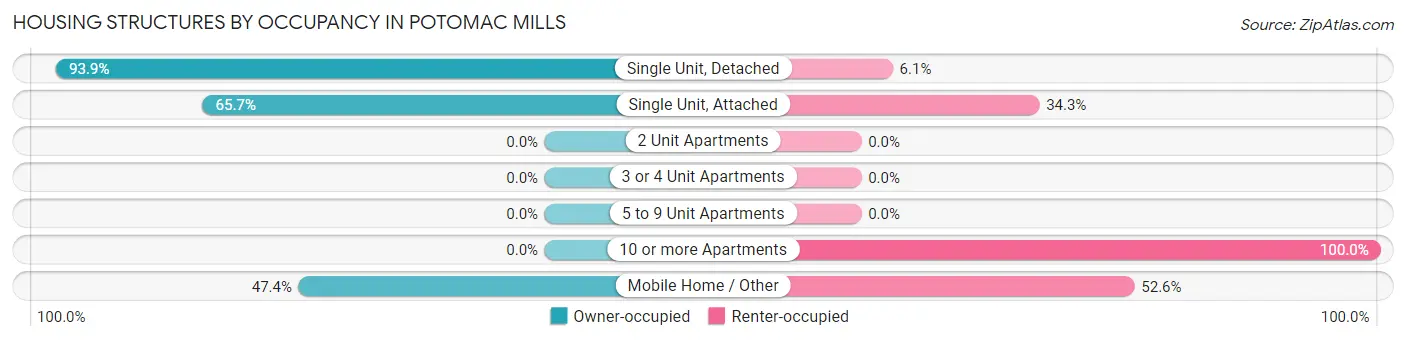
| Structure Type | Owner-occupied | Renter-occupied |
| Single Unit, Detached | 1,055 (93.9%) | 68 (6.1%) |
| Single Unit, Attached | 278 (65.7%) | 145 (34.3%) |
| 2 Unit Apartments | 0 (0.0%) | 0 (0.0%) |
| 3 or 4 Unit Apartments | 0 (0.0%) | 0 (0.0%) |
| 5 to 9 Unit Apartments | 0 (0.0%) | 0 (0.0%) |
| 10 or more Apartments | 0 (0.0%) | 235 (100.0%) |
| Mobile Home / Other | 82 (47.4%) | 91 (52.6%) |
| Total | 1,415 (72.4%) | 539 (27.6%) |
Housing Structures by Number of Rooms in Potomac Mills
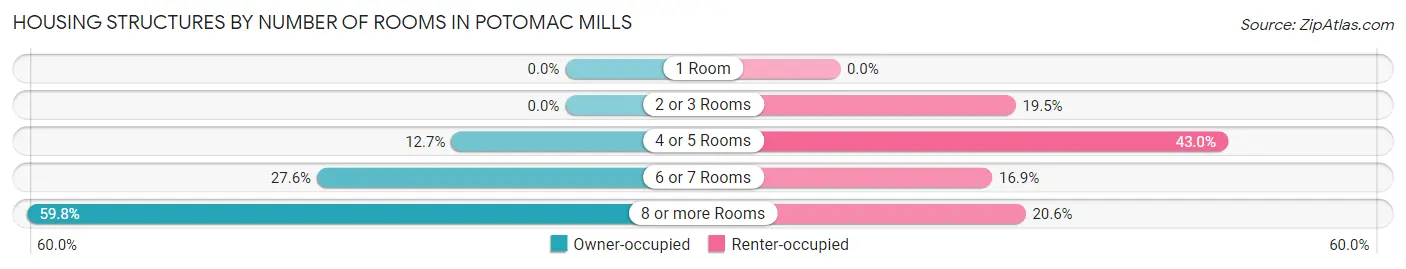
| Number of Rooms | Owner-occupied | Renter-occupied |
| 1 Room | 0 (0.0%) | 0 (0.0%) |
| 2 or 3 Rooms | 0 (0.0%) | 105 (19.5%) |
| 4 or 5 Rooms | 179 (12.7%) | 232 (43.0%) |
| 6 or 7 Rooms | 390 (27.6%) | 91 (16.9%) |
| 8 or more Rooms | 846 (59.8%) | 111 (20.6%) |
| Total | 1,415 (100.0%) | 539 (100.0%) |
Housing Structure by Heating Type in Potomac Mills
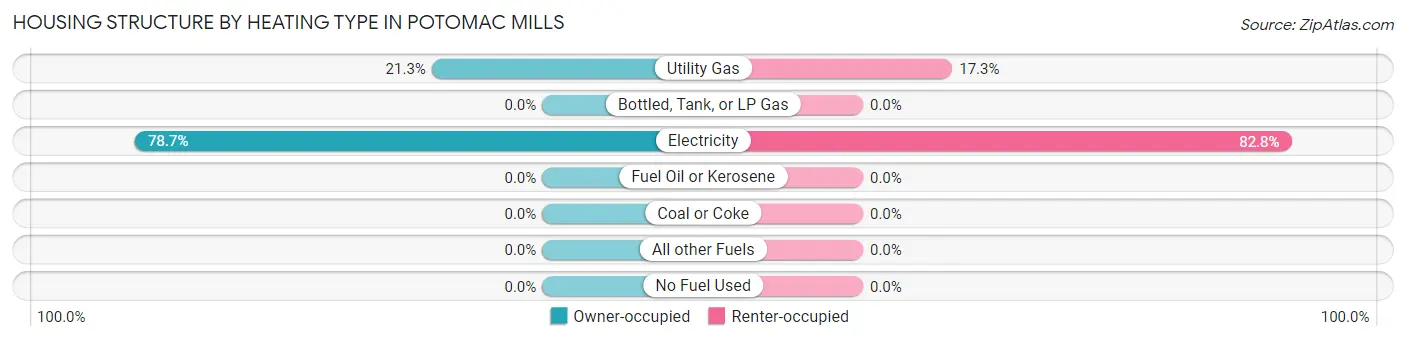
| Heating Type | Owner-occupied | Renter-occupied |
| Utility Gas | 302 (21.3%) | 93 (17.2%) |
| Bottled, Tank, or LP Gas | 0 (0.0%) | 0 (0.0%) |
| Electricity | 1,113 (78.7%) | 446 (82.8%) |
| Fuel Oil or Kerosene | 0 (0.0%) | 0 (0.0%) |
| Coal or Coke | 0 (0.0%) | 0 (0.0%) |
| All other Fuels | 0 (0.0%) | 0 (0.0%) |
| No Fuel Used | 0 (0.0%) | 0 (0.0%) |
| Total | 1,415 (100.0%) | 539 (100.0%) |
Household Vehicle Usage in Potomac Mills
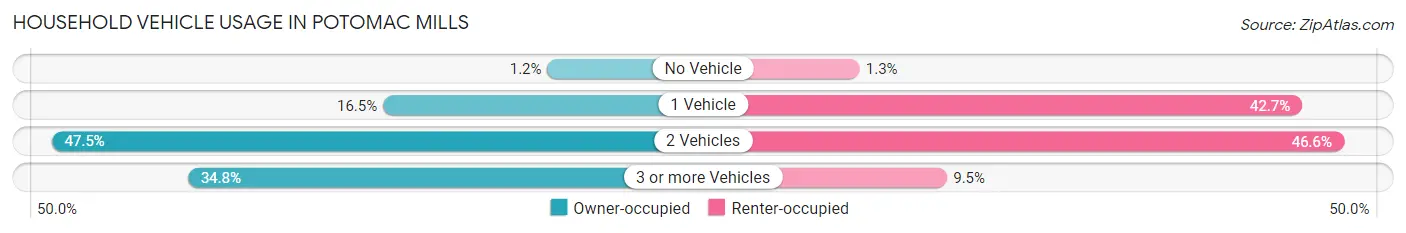
| Vehicles per Household | Owner-occupied | Renter-occupied |
| No Vehicle | 17 (1.2%) | 7 (1.3%) |
| 1 Vehicle | 234 (16.5%) | 230 (42.7%) |
| 2 Vehicles | 672 (47.5%) | 251 (46.6%) |
| 3 or more Vehicles | 492 (34.8%) | 51 (9.5%) |
| Total | 1,415 (100.0%) | 539 (100.0%) |
Real Estate & Mortgages in Potomac Mills
Real Estate and Mortgage Overview in Potomac Mills
| Characteristic | Without Mortgage | With Mortgage |
| Housing Units | 362 | 1,053 |
| Median Property Value | $357,700 | $527,300 |
| Median Household Income | - | - |
| Monthly Housing Costs | $700 | $452 |
| Real Estate Taxes | $3,788 | $124 |
Property Value by Mortgage Status in Potomac Mills
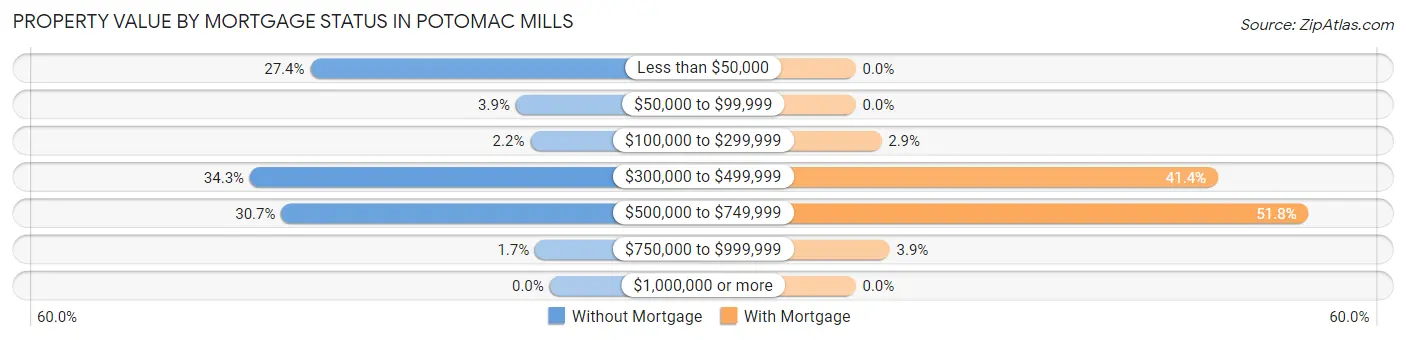
| Property Value | Without Mortgage | With Mortgage |
| Less than $50,000 | 99 (27.4%) | 0 (0.0%) |
| $50,000 to $99,999 | 14 (3.9%) | 0 (0.0%) |
| $100,000 to $299,999 | 8 (2.2%) | 31 (2.9%) |
| $300,000 to $499,999 | 124 (34.3%) | 436 (41.4%) |
| $500,000 to $749,999 | 111 (30.7%) | 545 (51.8%) |
| $750,000 to $999,999 | 6 (1.7%) | 41 (3.9%) |
| $1,000,000 or more | 0 (0.0%) | 0 (0.0%) |
| Total | 362 (100.0%) | 1,053 (100.0%) |
Household Income by Mortgage Status in Potomac Mills
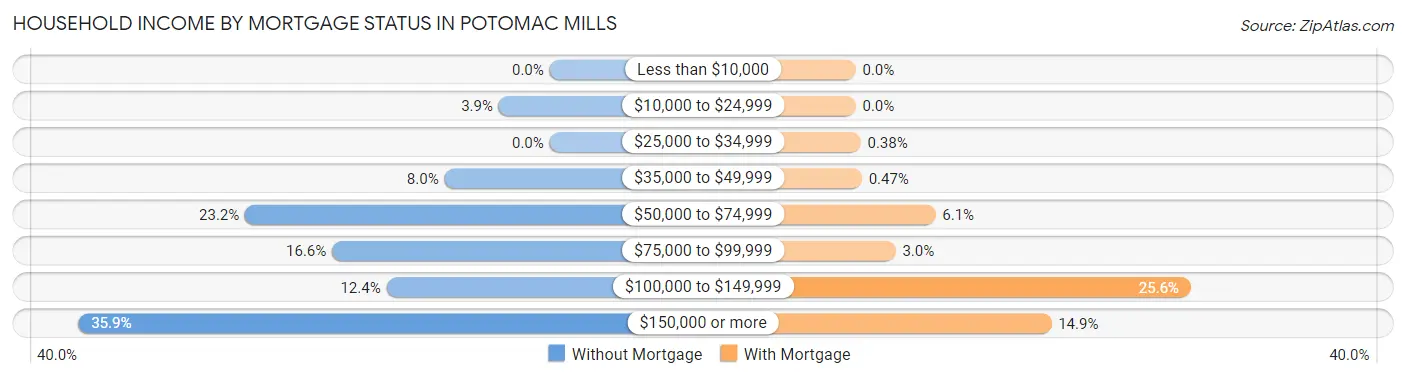
| Household Income | Without Mortgage | With Mortgage |
| Less than $10,000 | 0 (0.0%) | 0 (0.0%) |
| $10,000 to $24,999 | 14 (3.9%) | 0 (0.0%) |
| $25,000 to $34,999 | 0 (0.0%) | 4 (0.4%) |
| $35,000 to $49,999 | 29 (8.0%) | 5 (0.5%) |
| $50,000 to $74,999 | 84 (23.2%) | 64 (6.1%) |
| $75,000 to $99,999 | 60 (16.6%) | 32 (3.0%) |
| $100,000 to $149,999 | 45 (12.4%) | 269 (25.6%) |
| $150,000 or more | 130 (35.9%) | 157 (14.9%) |
| Total | 362 (100.0%) | 1,053 (100.0%) |
Property Value to Household Income Ratio in Potomac Mills
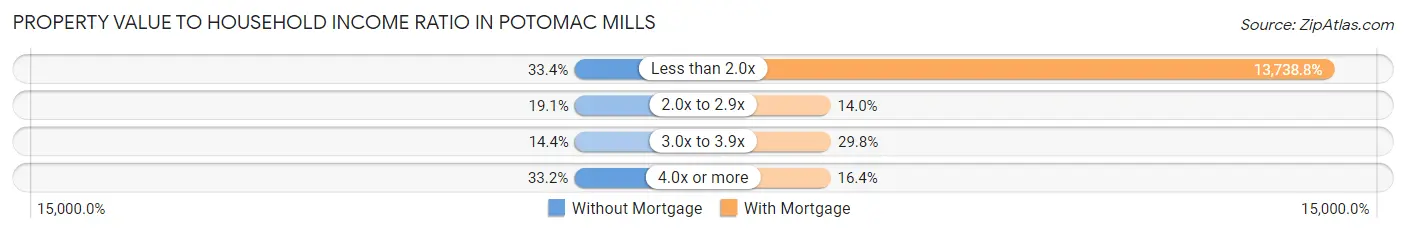
| Value-to-Income Ratio | Without Mortgage | With Mortgage |
| Less than 2.0x | 121 (33.4%) | 144,669 (13,738.7%) |
| 2.0x to 2.9x | 69 (19.1%) | 147 (14.0%) |
| 3.0x to 3.9x | 52 (14.4%) | 314 (29.8%) |
| 4.0x or more | 120 (33.2%) | 173 (16.4%) |
| Total | 362 (100.0%) | 1,053 (100.0%) |
Real Estate Taxes by Mortgage Status in Potomac Mills
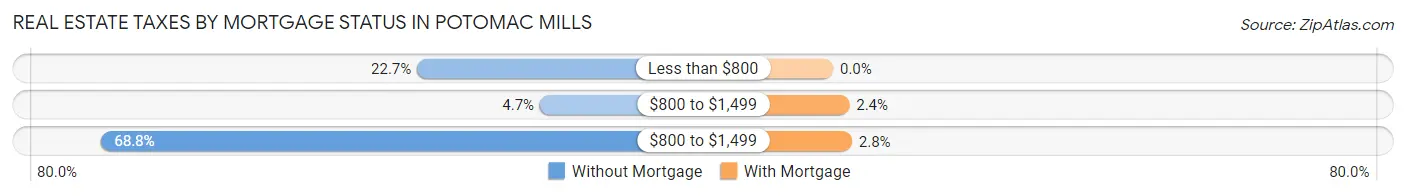
| Property Taxes | Without Mortgage | With Mortgage |
| Less than $800 | 82 (22.7%) | 0 (0.0%) |
| $800 to $1,499 | 17 (4.7%) | 25 (2.4%) |
| $800 to $1,499 | 249 (68.8%) | 29 (2.8%) |
| Total | 362 (100.0%) | 1,053 (100.0%) |
Health & Disability in Potomac Mills
Health Insurance Coverage by Age in Potomac Mills
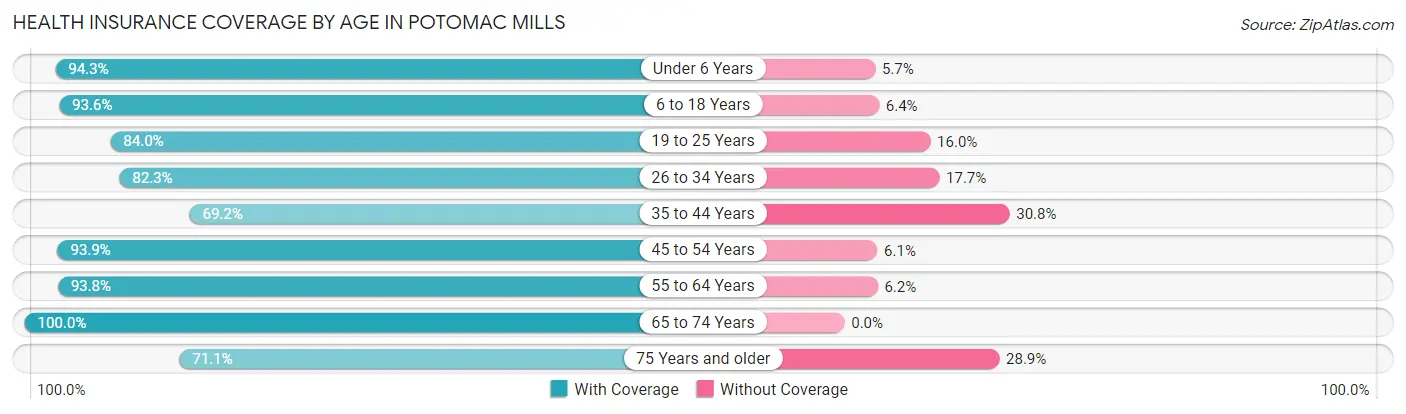
| Age Bracket | With Coverage | Without Coverage |
| Under 6 Years | 444 (94.3%) | 27 (5.7%) |
| 6 to 18 Years | 1,510 (93.6%) | 104 (6.4%) |
| 19 to 25 Years | 341 (84.0%) | 65 (16.0%) |
| 26 to 34 Years | 512 (82.3%) | 110 (17.7%) |
| 35 to 44 Years | 828 (69.2%) | 368 (30.8%) |
| 45 to 54 Years | 781 (93.9%) | 51 (6.1%) |
| 55 to 64 Years | 577 (93.8%) | 38 (6.2%) |
| 65 to 74 Years | 500 (100.0%) | 0 (0.0%) |
| 75 Years and older | 138 (71.1%) | 56 (28.9%) |
| Total | 5,631 (87.3%) | 819 (12.7%) |
Health Insurance Coverage by Citizenship Status in Potomac Mills
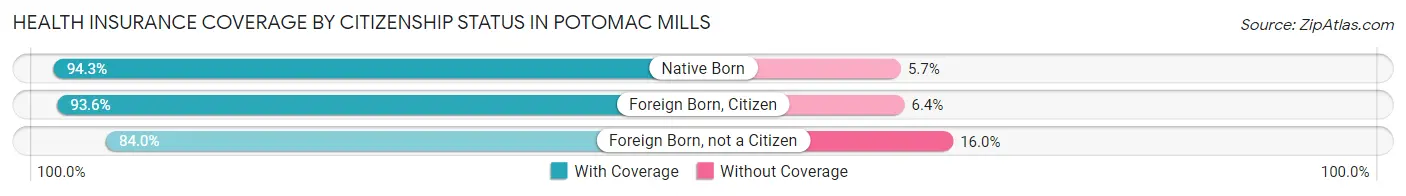
| Citizenship Status | With Coverage | Without Coverage |
| Native Born | 444 (94.3%) | 27 (5.7%) |
| Foreign Born, Citizen | 1,510 (93.6%) | 104 (6.4%) |
| Foreign Born, not a Citizen | 341 (84.0%) | 65 (16.0%) |
Health Insurance Coverage by Household Income in Potomac Mills
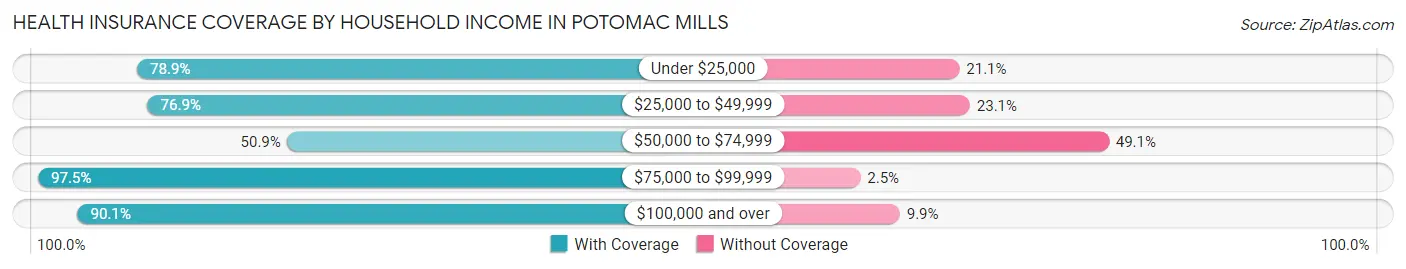
| Household Income | With Coverage | Without Coverage |
| Under $25,000 | 378 (78.9%) | 101 (21.1%) |
| $25,000 to $49,999 | 417 (76.9%) | 125 (23.1%) |
| $50,000 to $74,999 | 168 (50.9%) | 162 (49.1%) |
| $75,000 to $99,999 | 1,228 (97.5%) | 32 (2.5%) |
| $100,000 and over | 3,430 (90.1%) | 378 (9.9%) |
Public vs Private Health Insurance Coverage by Age in Potomac Mills
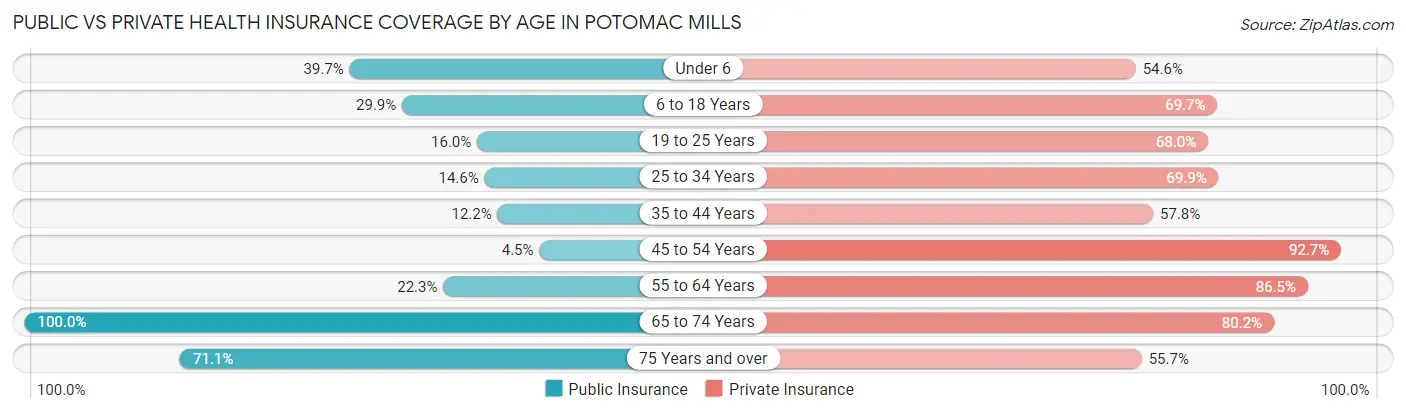
| Age Bracket | Public Insurance | Private Insurance |
| Under 6 | 187 (39.7%) | 257 (54.6%) |
| 6 to 18 Years | 483 (29.9%) | 1,125 (69.7%) |
| 19 to 25 Years | 65 (16.0%) | 276 (68.0%) |
| 25 to 34 Years | 91 (14.6%) | 435 (69.9%) |
| 35 to 44 Years | 146 (12.2%) | 691 (57.8%) |
| 45 to 54 Years | 37 (4.4%) | 771 (92.7%) |
| 55 to 64 Years | 137 (22.3%) | 532 (86.5%) |
| 65 to 74 Years | 500 (100.0%) | 401 (80.2%) |
| 75 Years and over | 138 (71.1%) | 108 (55.7%) |
| Total | 1,784 (27.7%) | 4,596 (71.3%) |
Disability Status by Sex by Age in Potomac Mills
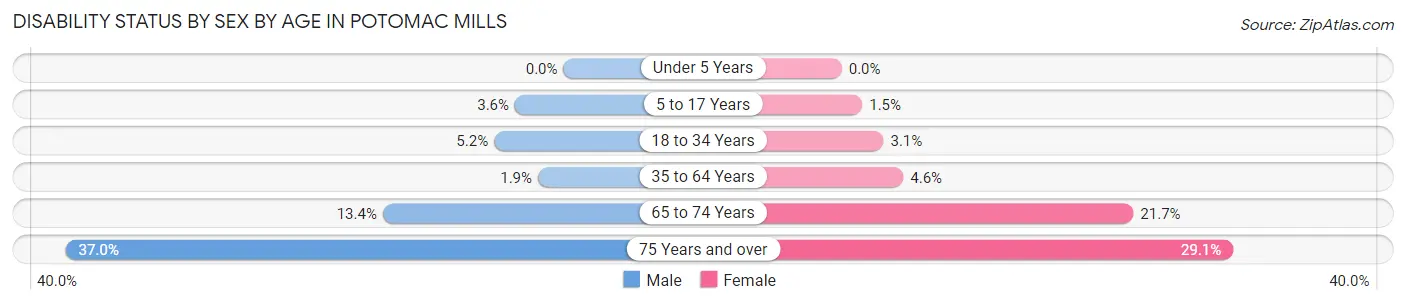
| Age Bracket | Male | Female |
| Under 5 Years | 0 (0.0%) | 0 (0.0%) |
| 5 to 17 Years | 31 (3.6%) | 12 (1.5%) |
| 18 to 34 Years | 32 (5.1%) | 15 (3.1%) |
| 35 to 64 Years | 26 (1.9%) | 58 (4.6%) |
| 65 to 74 Years | 33 (13.4%) | 55 (21.6%) |
| 75 Years and over | 17 (37.0%) | 43 (29.0%) |
Disability Class by Sex by Age in Potomac Mills
Disability Class: Hearing Difficulty
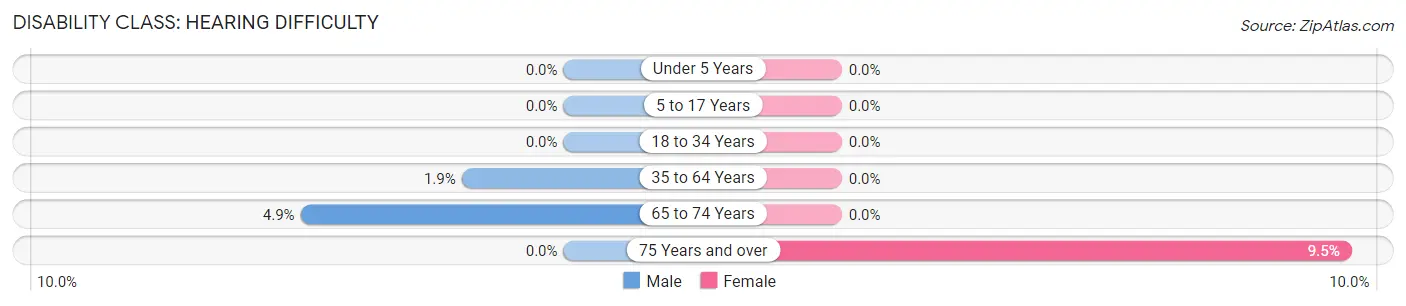
| Age Bracket | Male | Female |
| Under 5 Years | 0 (0.0%) | 0 (0.0%) |
| 5 to 17 Years | 0 (0.0%) | 0 (0.0%) |
| 18 to 34 Years | 0 (0.0%) | 0 (0.0%) |
| 35 to 64 Years | 26 (1.9%) | 0 (0.0%) |
| 65 to 74 Years | 12 (4.9%) | 0 (0.0%) |
| 75 Years and over | 0 (0.0%) | 14 (9.5%) |
Disability Class: Vision Difficulty
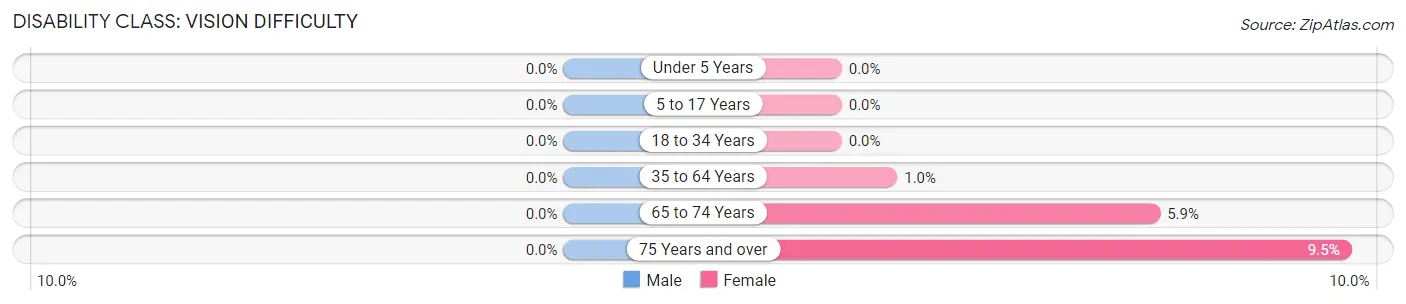
| Age Bracket | Male | Female |
| Under 5 Years | 0 (0.0%) | 0 (0.0%) |
| 5 to 17 Years | 0 (0.0%) | 0 (0.0%) |
| 18 to 34 Years | 0 (0.0%) | 0 (0.0%) |
| 35 to 64 Years | 0 (0.0%) | 13 (1.0%) |
| 65 to 74 Years | 0 (0.0%) | 15 (5.9%) |
| 75 Years and over | 0 (0.0%) | 14 (9.5%) |
Disability Class: Cognitive Difficulty
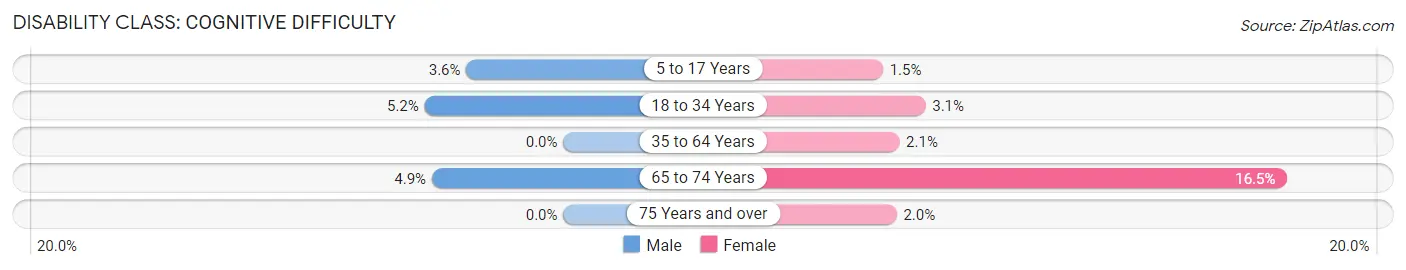
| Age Bracket | Male | Female |
| 5 to 17 Years | 31 (3.6%) | 12 (1.5%) |
| 18 to 34 Years | 32 (5.1%) | 15 (3.1%) |
| 35 to 64 Years | 0 (0.0%) | 27 (2.1%) |
| 65 to 74 Years | 12 (4.9%) | 42 (16.5%) |
| 75 Years and over | 0 (0.0%) | 3 (2.0%) |
Disability Class: Ambulatory Difficulty
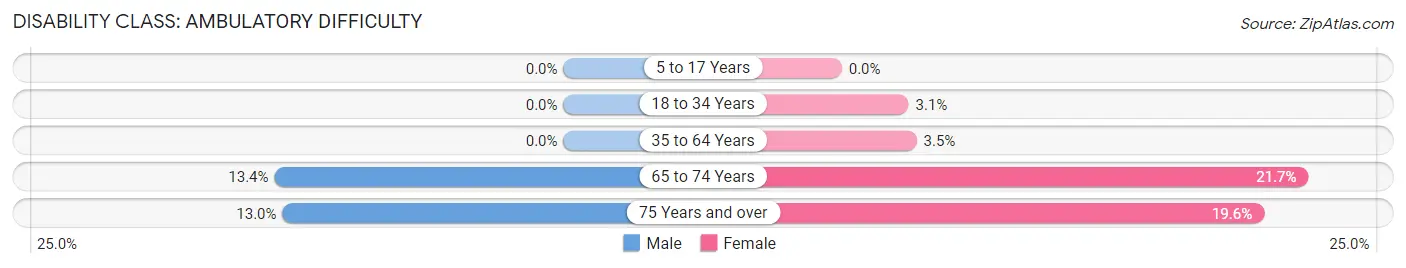
| Age Bracket | Male | Female |
| 5 to 17 Years | 0 (0.0%) | 0 (0.0%) |
| 18 to 34 Years | 0 (0.0%) | 15 (3.1%) |
| 35 to 64 Years | 0 (0.0%) | 44 (3.5%) |
| 65 to 74 Years | 33 (13.4%) | 55 (21.6%) |
| 75 Years and over | 6 (13.0%) | 29 (19.6%) |
Disability Class: Self-Care Difficulty
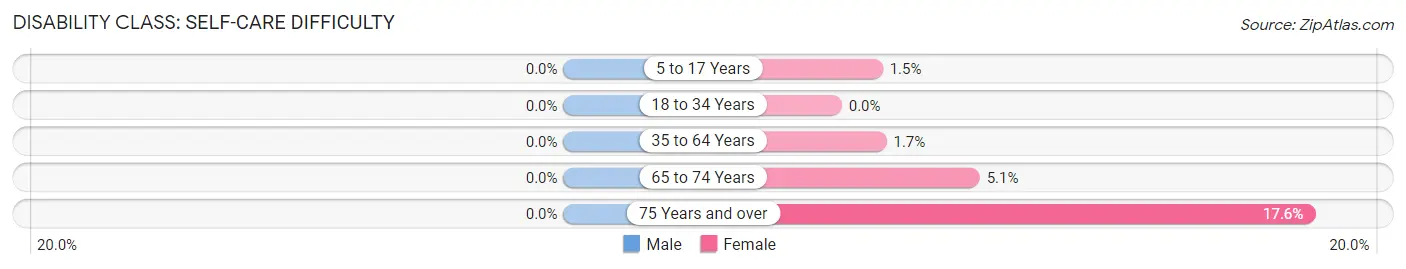
| Age Bracket | Male | Female |
| 5 to 17 Years | 0 (0.0%) | 12 (1.5%) |
| 18 to 34 Years | 0 (0.0%) | 0 (0.0%) |
| 35 to 64 Years | 0 (0.0%) | 21 (1.7%) |
| 65 to 74 Years | 0 (0.0%) | 13 (5.1%) |
| 75 Years and over | 0 (0.0%) | 26 (17.6%) |
Technology Access in Potomac Mills
Computing Device Access in Potomac Mills
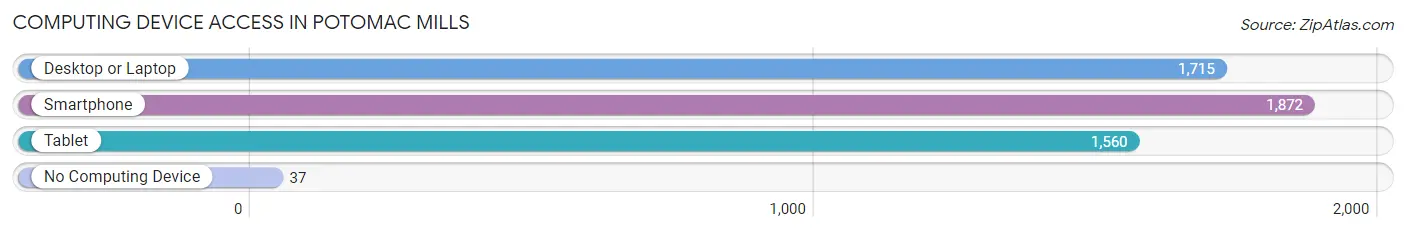
| Device Type | # Households | % Households |
| Desktop or Laptop | 1,715 | 87.8% |
| Smartphone | 1,872 | 95.8% |
| Tablet | 1,560 | 79.8% |
| No Computing Device | 37 | 1.9% |
| Total | 1,954 | 100.0% |
Internet Access in Potomac Mills
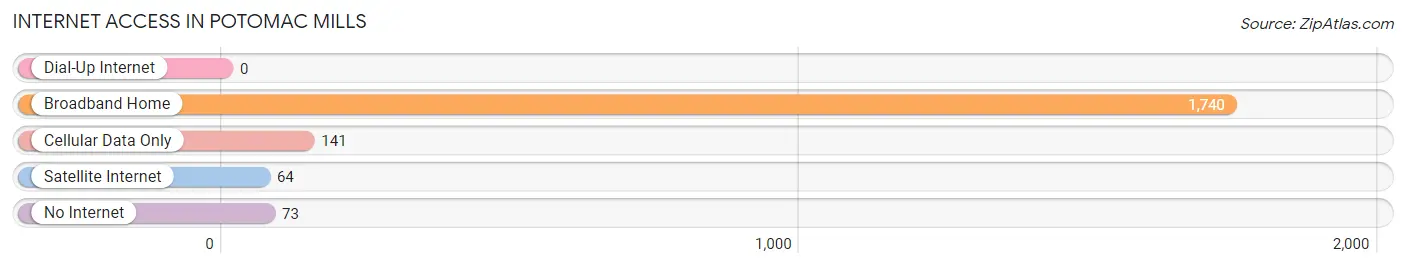
| Internet Type | # Households | % Households |
| Dial-Up Internet | 0 | 0.0% |
| Broadband Home | 1,740 | 89.0% |
| Cellular Data Only | 141 | 7.2% |
| Satellite Internet | 64 | 3.3% |
| No Internet | 73 | 3.7% |
| Total | 1,954 | 100.0% |
Potomac Mills Summary
Potomac Mills is a large outlet mall located in Prince William County, Virginia, United States. It is located off of Interstate 95, about 25 miles south of Washington, D.C. The mall opened in 1985 and is the largest outlet mall in the state of Virginia. It is owned and operated by the Simon Property Group.
History
Potomac Mills was built in 1985 by the Miller & Smith Companies, a real estate development firm based in Fairfax, Virginia. The mall was designed to be a destination shopping center, with a variety of stores and restaurants. The mall was originally anchored by JCPenney, Sears, and Miller & Smith's own department store, Miller & Smith's.
The mall was an immediate success, and quickly became one of the most popular shopping destinations in the region. In the late 1980s, the mall was expanded to include a food court and a movie theater. In the 1990s, the mall was further expanded to include a variety of new stores and restaurants.
In 1998, the mall was purchased by the Simon Property Group, one of the largest mall operators in the United States. The mall was renovated and rebranded as an outlet mall, with a variety of outlet stores. The mall was further expanded in 2000, with the addition of a new wing featuring a variety of stores and restaurants.
Geography
Potomac Mills is located in Prince William County, Virginia, about 25 miles south of Washington, D.C. The mall is located off of Interstate 95, and is easily accessible from the surrounding areas. The mall is located near a variety of other shopping centers, including the Potomac Town Center, the Potomac Festival Shopping Center, and the Potomac Shops at Potomac Mills.
Economy
Potomac Mills is one of the largest employers in Prince William County, providing jobs for over 4,000 people. The mall is home to a variety of stores and restaurants, including outlet stores, department stores, specialty stores, and restaurants. The mall also features a variety of entertainment venues, including a movie theater, a bowling alley, and an arcade.
The mall is a major tourist destination, attracting visitors from all over the region. The mall is also a popular destination for locals, who come to shop, dine, and enjoy the entertainment offerings.
Demographics
The population of Prince William County is estimated to be 472,000, with a median age of 36. The population is diverse, with a variety of racial and ethnic backgrounds. The median household income is estimated to be $90,000, and the median home value is estimated to be $400,000.
The population of Potomac Mills is estimated to be around 10,000. The mall attracts a variety of visitors, including locals, tourists, and business travelers. The mall is also a popular destination for families, with a variety of activities and entertainment offerings.
Conclusion
Potomac Mills is a large outlet mall located in Prince William County, Virginia. The mall opened in 1985 and is owned and operated by the Simon Property Group. The mall is a major employer in the county, providing jobs for over 4,000 people. The mall is a popular destination for locals, tourists, and business travelers, and is home to a variety of stores and restaurants. The mall is also a popular destination for families, with a variety of activities and entertainment offerings.
Common Questions
What is Per Capita Income in Potomac Mills?
Per Capita income in Potomac Mills is $42,506.
What is the Median Family Income in Potomac Mills?
Median Family Income in Potomac Mills is $111,724.
What is the Median Household income in Potomac Mills?
Median Household Income in Potomac Mills is $109,265.
What is Income or Wage Gap in Potomac Mills?
Income or Wage Gap in Potomac Mills is 45.5%.
Women in Potomac Mills earn 54.5 cents for every dollar earned by a man.
What is Inequality or Gini Index in Potomac Mills?
Inequality or Gini Index in Potomac Mills is 0.39.
What is the Total Population of Potomac Mills?
Total Population of Potomac Mills is 6,510.
What is the Total Male Population of Potomac Mills?
Total Male Population of Potomac Mills is 3,443.
What is the Total Female Population of Potomac Mills?
Total Female Population of Potomac Mills is 3,067.
What is the Ratio of Males per 100 Females in Potomac Mills?
There are 112.26 Males per 100 Females in Potomac Mills.
What is the Ratio of Females per 100 Males in Potomac Mills?
There are 89.08 Females per 100 Males in Potomac Mills.
What is the Median Population Age in Potomac Mills?
Median Population Age in Potomac Mills is 37.1 Years.
What is the Average Family Size in Potomac Mills
Average Family Size in Potomac Mills is 3.7 People.
What is the Average Household Size in Potomac Mills
Average Household Size in Potomac Mills is 3.3 People.
How Large is the Labor Force in Potomac Mills?
There are 3,248 People in the Labor Forcein in Potomac Mills.
What is the Percentage of People in the Labor Force in Potomac Mills?
66.2% of People are in the Labor Force in Potomac Mills.
What is the Unemployment Rate in Potomac Mills?
Unemployment Rate in Potomac Mills is 3.8%.