Groveton, VA Map & Demographics
Groveton Map
Groveton Overview
$48,413
PER CAPITA INCOME
$105,719
AVG FAMILY INCOME
$104,848
AVG HOUSEHOLD INCOME
22.2%
WAGE / INCOME GAP [ % ]
77.8¢/ $1
WAGE / INCOME GAP [ $ ]
$9,118
FAMILY INCOME DEFICIT
0.38
INEQUALITY / GINI INDEX
14,619
TOTAL POPULATION
6,993
MALE POPULATION
7,626
FEMALE POPULATION
91.70
MALES / 100 FEMALES
109.05
FEMALES / 100 MALES
37.4
MEDIAN AGE
3.4
AVG FAMILY SIZE
2.7
AVG HOUSEHOLD SIZE
8,403
LABOR FORCE [ PEOPLE ]
71.2%
PERCENT IN LABOR FORCE
7.4%
UNEMPLOYMENT RATE
Income in Groveton
Income Overview in Groveton
Per Capita Income in Groveton is $48,413, while median incomes of families and households are $105,719 and $104,848 respectively.
| Characteristic | Number | Measure |
| Per Capita Income | 14,619 | $48,413 |
| Median Family Income | 3,595 | $105,719 |
| Mean Family Income | 3,595 | $135,861 |
| Median Household Income | 5,437 | $104,848 |
| Mean Household Income | 5,437 | $126,352 |
| Income Deficit | 3,595 | $9,118 |
| Wage / Income Gap (%) | 14,619 | 22.19% |
| Wage / Income Gap ($) | 14,619 | 77.81¢ per $1 |
| Gini / Inequality Index | 14,619 | 0.38 |
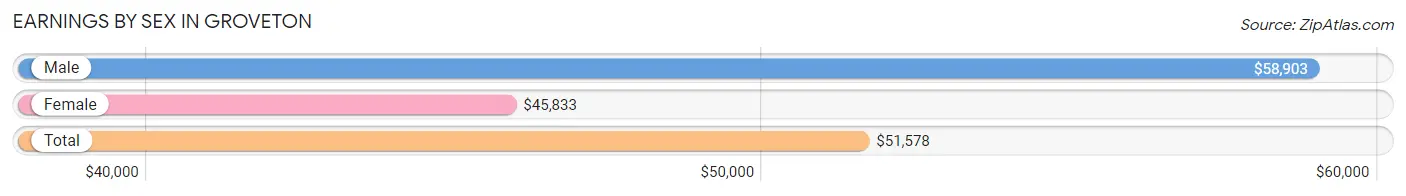
Earnings by Sex in Groveton
Average Earnings in Groveton are $51,578, $58,903 for men and $45,833 for women, a difference of 22.2%.
| Sex | Number | Average Earnings |
| Male | 4,239 (49.5%) | $58,903 |
| Female | 4,330 (50.5%) | $45,833 |
| Total | 8,569 (100.0%) | $51,578 |
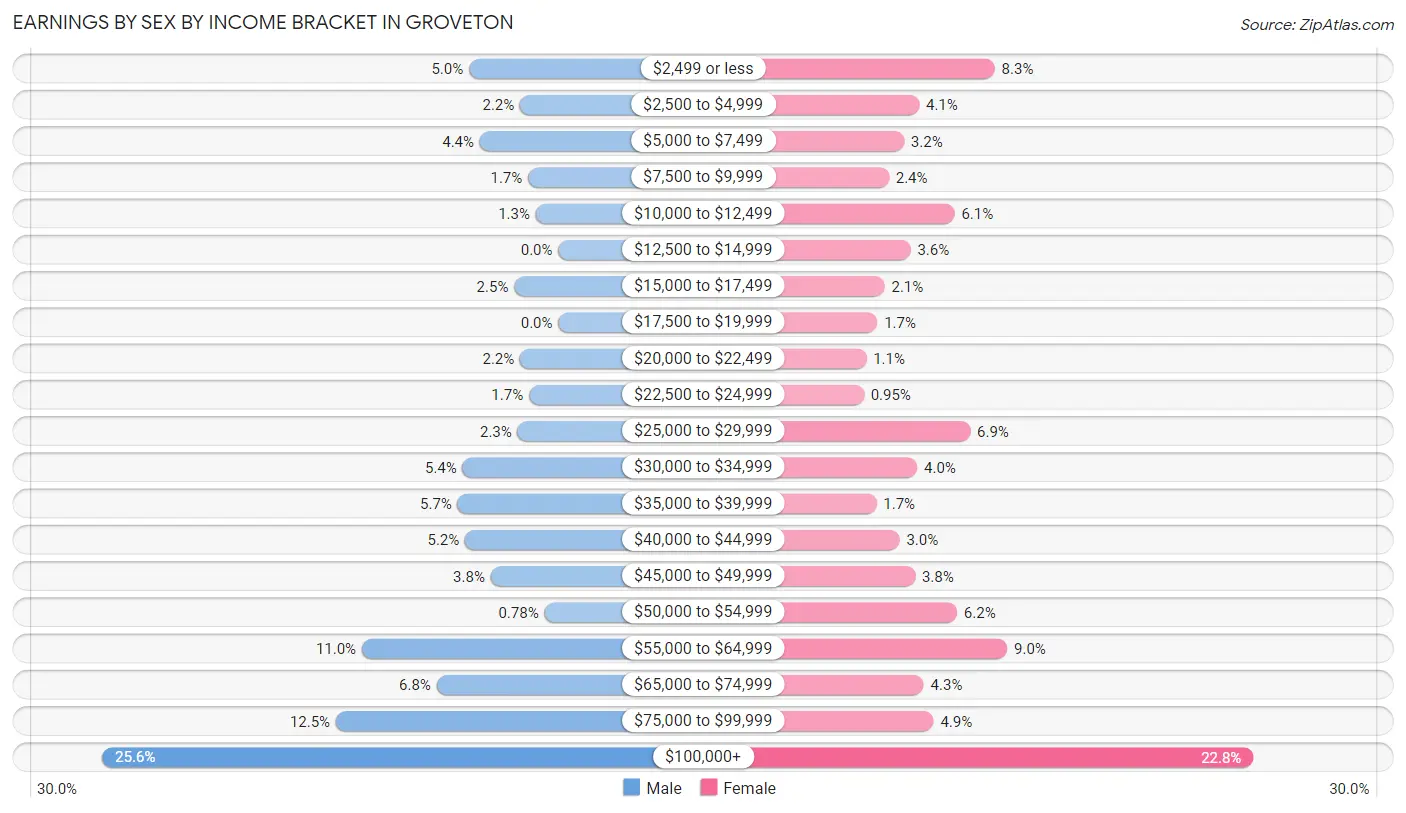
Earnings by Sex by Income Bracket in Groveton
The most common earnings brackets in Groveton are $100,000+ for men (1,087 | 25.6%) and $100,000+ for women (989 | 22.8%).
| Income | Male | Female |
| $2,499 or less | 213 (5.0%) | 360 (8.3%) |
| $2,500 to $4,999 | 91 (2.1%) | 176 (4.1%) |
| $5,000 to $7,499 | 187 (4.4%) | 139 (3.2%) |
| $7,500 to $9,999 | 72 (1.7%) | 102 (2.4%) |
| $10,000 to $12,499 | 54 (1.3%) | 262 (6.0%) |
| $12,500 to $14,999 | 0 (0.0%) | 155 (3.6%) |
| $15,000 to $17,499 | 105 (2.5%) | 92 (2.1%) |
| $17,500 to $19,999 | 0 (0.0%) | 74 (1.7%) |
| $20,000 to $22,499 | 91 (2.1%) | 47 (1.1%) |
| $22,500 to $24,999 | 70 (1.7%) | 41 (0.9%) |
| $25,000 to $29,999 | 97 (2.3%) | 300 (6.9%) |
| $30,000 to $34,999 | 228 (5.4%) | 171 (4.0%) |
| $35,000 to $39,999 | 240 (5.7%) | 72 (1.7%) |
| $40,000 to $44,999 | 222 (5.2%) | 128 (3.0%) |
| $45,000 to $49,999 | 161 (3.8%) | 166 (3.8%) |
| $50,000 to $54,999 | 33 (0.8%) | 268 (6.2%) |
| $55,000 to $64,999 | 468 (11.0%) | 390 (9.0%) |
| $65,000 to $74,999 | 290 (6.8%) | 187 (4.3%) |
| $75,000 to $99,999 | 530 (12.5%) | 211 (4.9%) |
| $100,000+ | 1,087 (25.6%) | 989 (22.8%) |
| Total | 4,239 (100.0%) | 4,330 (100.0%) |
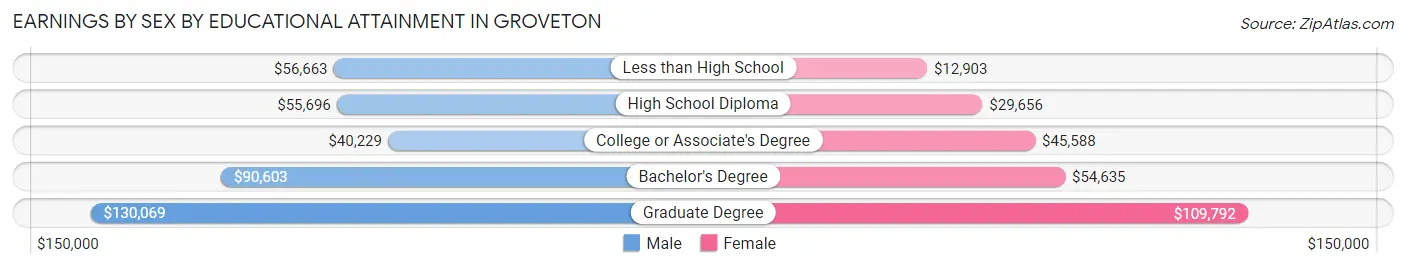
Earnings by Sex by Educational Attainment in Groveton
Average earnings in Groveton are $68,033 for men and $50,476 for women, a difference of 25.8%. Men with an educational attainment of graduate degree enjoy the highest average annual earnings of $130,069, while those with college or associate's degree education earn the least with $40,229. Women with an educational attainment of graduate degree earn the most with the average annual earnings of $109,792, while those with less than high school education have the smallest earnings of $12,903.
| Educational Attainment | Male Income | Female Income |
| Less than High School | $56,663 | $12,903 |
| High School Diploma | $55,696 | $29,656 |
| College or Associate's Degree | $40,229 | $45,588 |
| Bachelor's Degree | $90,603 | $54,635 |
| Graduate Degree | $130,069 | $109,792 |
| Total | $68,033 | $50,476 |
Family Income in Groveton
Family Income Brackets in Groveton
According to the Groveton family income data, there are 809 families falling into the $200,000+ income range, which is the most common income bracket and makes up 22.5% of all families. Conversely, the $10,000 to $14,999 income bracket is the least frequent group with only 22 families (0.6%) belonging to this category.
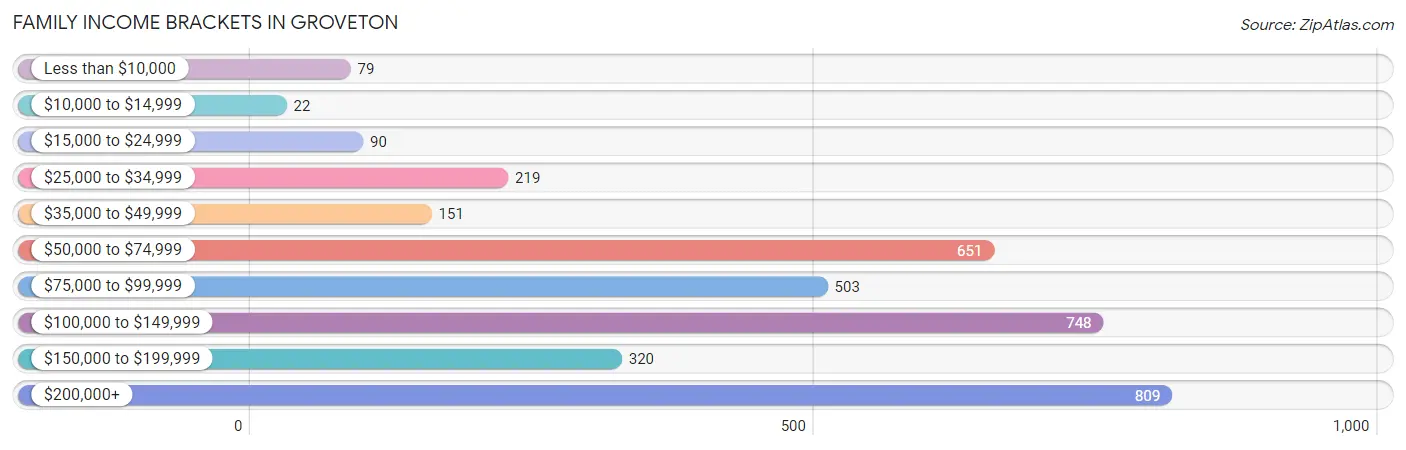
| Income Bracket | # Families | % Families |
| Less than $10,000 | 79 | 2.2% |
| $10,000 to $14,999 | 22 | 0.6% |
| $15,000 to $24,999 | 90 | 2.5% |
| $25,000 to $34,999 | 219 | 6.1% |
| $35,000 to $49,999 | 151 | 4.2% |
| $50,000 to $74,999 | 651 | 18.1% |
| $75,000 to $99,999 | 503 | 14.0% |
| $100,000 to $149,999 | 748 | 20.8% |
| $150,000 to $199,999 | 320 | 8.9% |
| $200,000+ | 809 | 22.5% |
Family Income by Famaliy Size in Groveton
5-person families (366 | 10.2%) account for the highest median family income in Groveton with $135,568 per family, while 2-person families (1,576 | 43.8%) have the highest median income of $43,214 per family member.
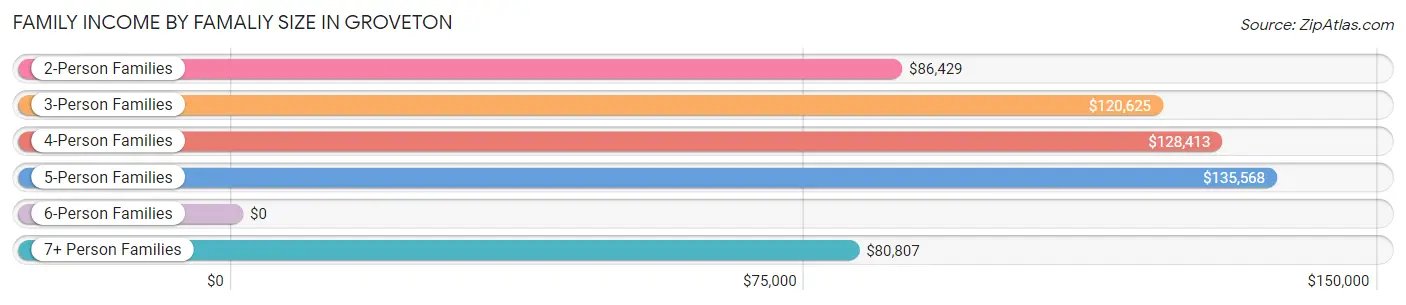
| Income Bracket | # Families | Median Income |
| 2-Person Families | 1,576 (43.8%) | $86,429 |
| 3-Person Families | 678 (18.9%) | $120,625 |
| 4-Person Families | 737 (20.5%) | $128,413 |
| 5-Person Families | 366 (10.2%) | $135,568 |
| 6-Person Families | 159 (4.4%) | $0 |
| 7+ Person Families | 79 (2.2%) | $80,807 |
| Total | 3,595 (100.0%) | $105,719 |
Family Income by Number of Earners in Groveton
The median family income in Groveton is $105,719, with families comprising 3+ earners (655) having the highest median family income of $127,644, while families with 1 earner (1,219) have the lowest median family income of $60,919, accounting for 18.2% and 33.9% of families, respectively.
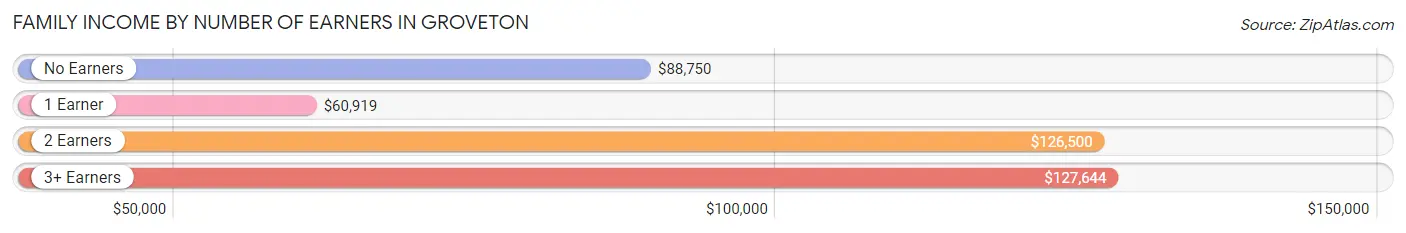
| Number of Earners | # Families | Median Income |
| No Earners | 255 (7.1%) | $88,750 |
| 1 Earner | 1,219 (33.9%) | $60,919 |
| 2 Earners | 1,466 (40.8%) | $126,500 |
| 3+ Earners | 655 (18.2%) | $127,644 |
| Total | 3,595 (100.0%) | $105,719 |
Household Income in Groveton
Household Income Brackets in Groveton
With 1,338 households falling in the category, the $100,000 to $149,999 income range is the most frequent in Groveton, accounting for 24.6% of all households. In contrast, only 54 households (1.0%) fall into the $10,000 to $14,999 income bracket, making it the least populous group.
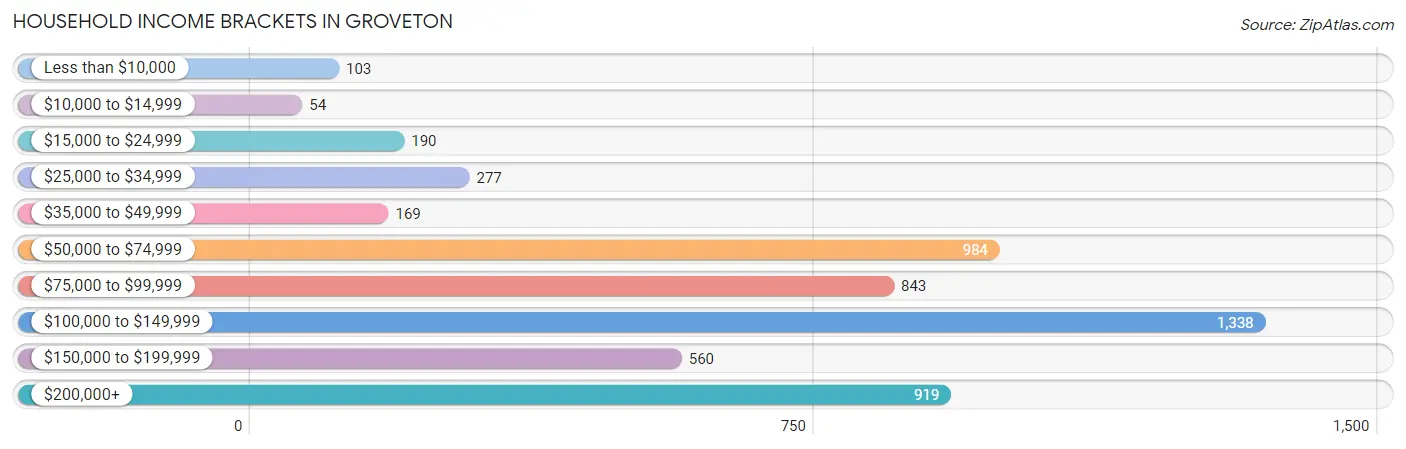
| Income Bracket | # Households | % Households |
| Less than $10,000 | 103 | 1.9% |
| $10,000 to $14,999 | 54 | 1.0% |
| $15,000 to $24,999 | 190 | 3.5% |
| $25,000 to $34,999 | 277 | 5.1% |
| $35,000 to $49,999 | 169 | 3.1% |
| $50,000 to $74,999 | 984 | 18.1% |
| $75,000 to $99,999 | 843 | 15.5% |
| $100,000 to $149,999 | 1,338 | 24.6% |
| $150,000 to $199,999 | 560 | 10.3% |
| $200,000+ | 919 | 16.9% |
Household Income by Householder Age in Groveton
The median household income in Groveton is $104,848, with the highest median household income of $114,583 found in the 25 to 44 years age bracket for the primary householder. A total of 1,844 households (33.9%) fall into this category. Meanwhile, the 15 to 24 years age bracket for the primary householder has the lowest median household income of $73,136, with 260 households (4.8%) in this group.
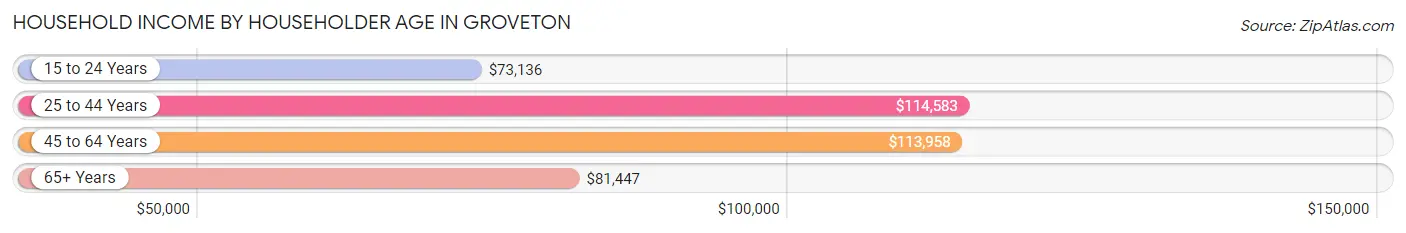
| Income Bracket | # Households | Median Income |
| 15 to 24 Years | 260 (4.8%) | $73,136 |
| 25 to 44 Years | 1,844 (33.9%) | $114,583 |
| 45 to 64 Years | 2,036 (37.4%) | $113,958 |
| 65+ Years | 1,297 (23.9%) | $81,447 |
| Total | 5,437 (100.0%) | $104,848 |
Poverty in Groveton
Income Below Poverty by Sex and Age in Groveton
With 5.1% poverty level for males and 12.0% for females among the residents of Groveton, 5 year old males and 15 year old females are the most vulnerable to poverty, with 9 males (25.7%) and 52 females (50.5%) in their respective age groups living below the poverty level.
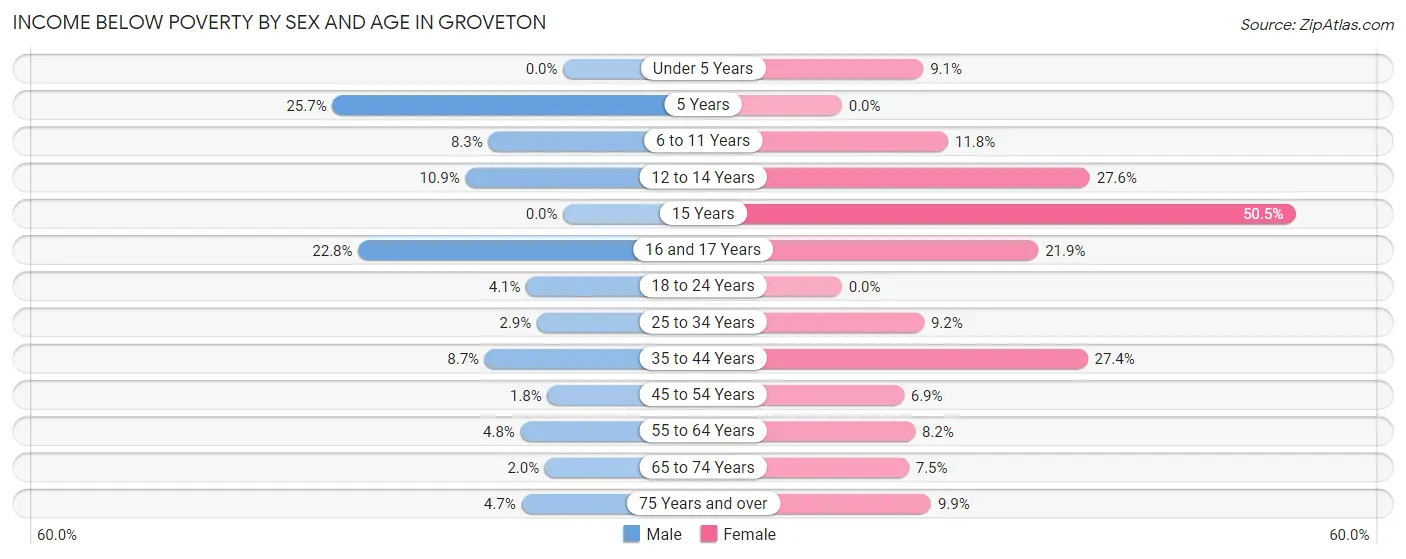
| Age Bracket | Male | Female |
| Under 5 Years | 0 (0.0%) | 42 (9.1%) |
| 5 Years | 9 (25.7%) | 0 (0.0%) |
| 6 to 11 Years | 51 (8.3%) | 46 (11.8%) |
| 12 to 14 Years | 28 (10.9%) | 58 (27.6%) |
| 15 Years | 0 (0.0%) | 52 (50.5%) |
| 16 and 17 Years | 29 (22.8%) | 72 (21.9%) |
| 18 to 24 Years | 31 (4.1%) | 0 (0.0%) |
| 25 to 34 Years | 26 (2.9%) | 106 (9.1%) |
| 35 to 44 Years | 103 (8.7%) | 283 (27.4%) |
| 45 to 54 Years | 15 (1.8%) | 74 (6.9%) |
| 55 to 64 Years | 41 (4.8%) | 82 (8.2%) |
| 65 to 74 Years | 11 (2.0%) | 37 (7.5%) |
| 75 Years and over | 11 (4.7%) | 59 (9.9%) |
| Total | 355 (5.1%) | 911 (12.0%) |
Income Above Poverty by Sex and Age in Groveton
According to the poverty statistics in Groveton, males aged under 5 years and females aged 5 years are the age groups that are most secure financially, with 100.0% of males and 100.0% of females in these age groups living above the poverty line.
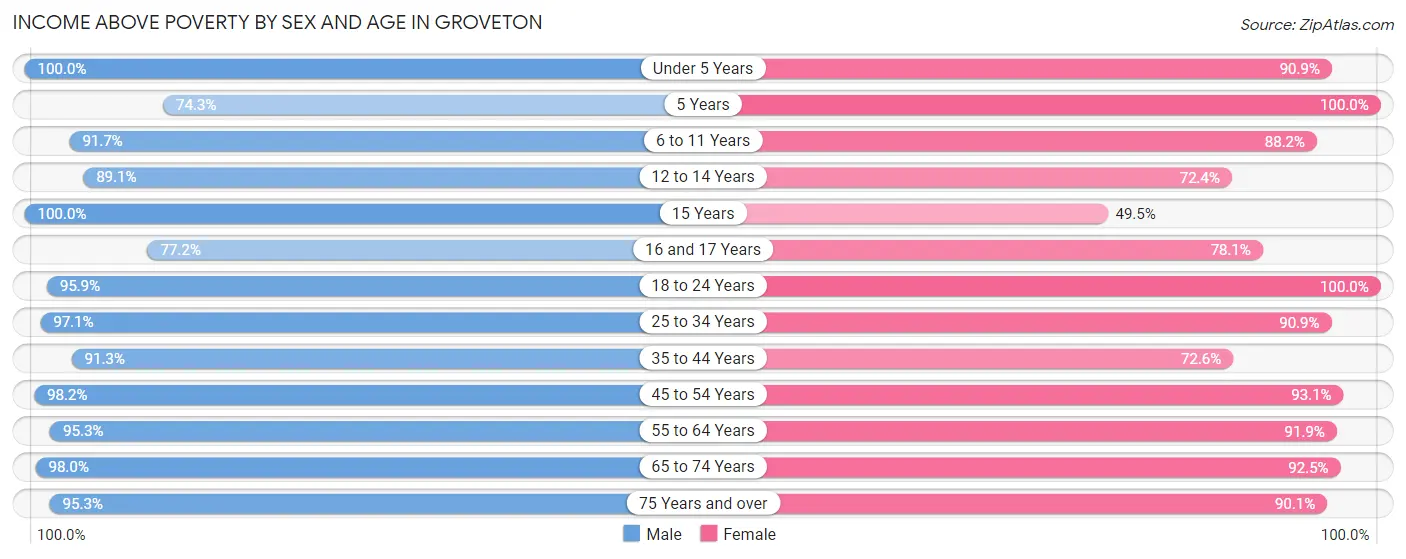
| Age Bracket | Male | Female |
| Under 5 Years | 518 (100.0%) | 421 (90.9%) |
| 5 Years | 26 (74.3%) | 113 (100.0%) |
| 6 to 11 Years | 561 (91.7%) | 343 (88.2%) |
| 12 to 14 Years | 229 (89.1%) | 152 (72.4%) |
| 15 Years | 84 (100.0%) | 51 (49.5%) |
| 16 and 17 Years | 98 (77.2%) | 257 (78.1%) |
| 18 to 24 Years | 721 (95.9%) | 646 (100.0%) |
| 25 to 34 Years | 863 (97.1%) | 1,052 (90.8%) |
| 35 to 44 Years | 1,077 (91.3%) | 751 (72.6%) |
| 45 to 54 Years | 839 (98.2%) | 998 (93.1%) |
| 55 to 64 Years | 823 (95.3%) | 924 (91.8%) |
| 65 to 74 Years | 527 (98.0%) | 459 (92.5%) |
| 75 Years and over | 225 (95.3%) | 535 (90.1%) |
| Total | 6,591 (94.9%) | 6,702 (88.0%) |
Income Below Poverty Among Married-Couple Families in Groveton
The poverty statistics for married-couple families in Groveton show that 4.5% or 116 of the total 2,572 families live below the poverty line. Families with 3 or 4 children have the highest poverty rate of 13.6%, comprising of 36 families. On the other hand, families with 1 or 2 children have the lowest poverty rate of 1.2%, which includes 11 families.
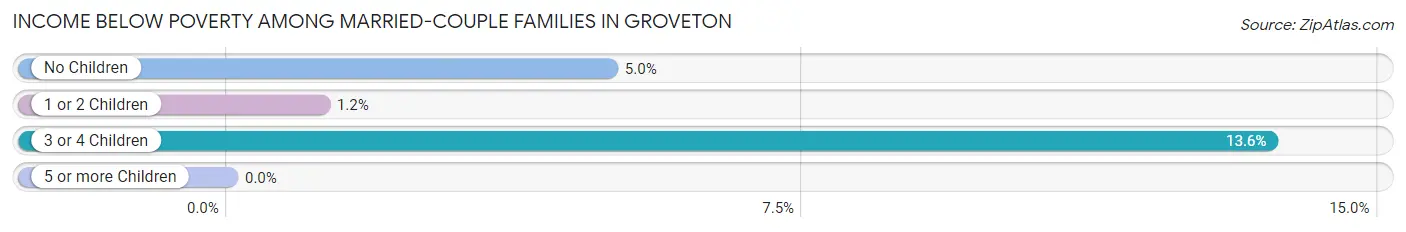
| Children | Above Poverty | Below Poverty |
| No Children | 1,322 (95.0%) | 69 (5.0%) |
| 1 or 2 Children | 905 (98.8%) | 11 (1.2%) |
| 3 or 4 Children | 229 (86.4%) | 36 (13.6%) |
| 5 or more Children | 0 (0.0%) | 0 (0.0%) |
| Total | 2,456 (95.5%) | 116 (4.5%) |
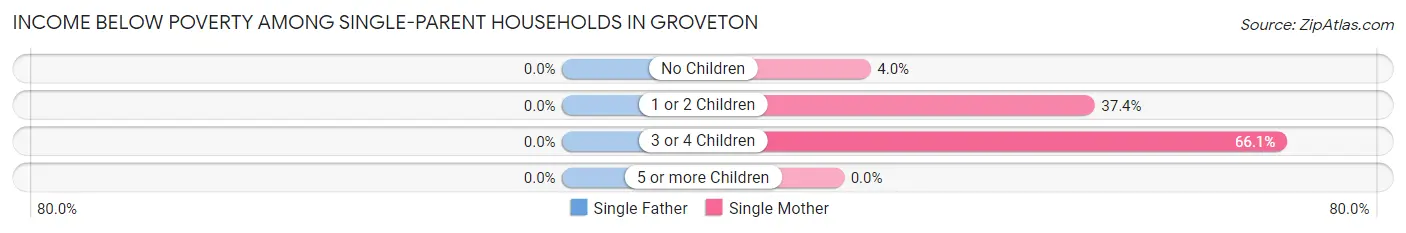
Income Below Poverty Among Single-Parent Households in Groveton
| Children | Single Father | Single Mother |
| No Children | 0 (0.0%) | 15 (4.0%) |
| 1 or 2 Children | 0 (0.0%) | 99 (37.4%) |
| 3 or 4 Children | 0 (0.0%) | 37 (66.1%) |
| 5 or more Children | 0 (0.0%) | 0 (0.0%) |
| Total | 0 (0.0%) | 151 (21.6%) |
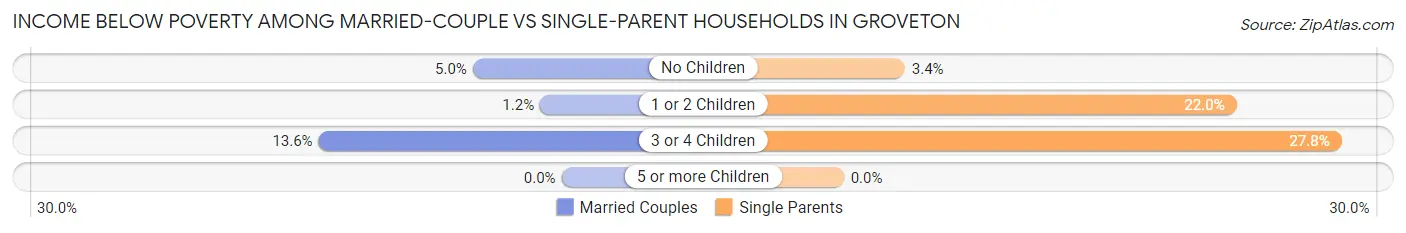
Income Below Poverty Among Married-Couple vs Single-Parent Households in Groveton
The poverty data for Groveton shows that 116 of the married-couple family households (4.5%) and 151 of the single-parent households (14.8%) are living below the poverty level. Within the married-couple family households, those with 3 or 4 children have the highest poverty rate, with 36 households (13.6%) falling below the poverty line. Among the single-parent households, those with 3 or 4 children have the highest poverty rate, with 37 household (27.8%) living below poverty.
| Children | Married-Couple Families | Single-Parent Households |
| No Children | 69 (5.0%) | 15 (3.4%) |
| 1 or 2 Children | 11 (1.2%) | 99 (22.0%) |
| 3 or 4 Children | 36 (13.6%) | 37 (27.8%) |
| 5 or more Children | 0 (0.0%) | 0 (0.0%) |
| Total | 116 (4.5%) | 151 (14.8%) |
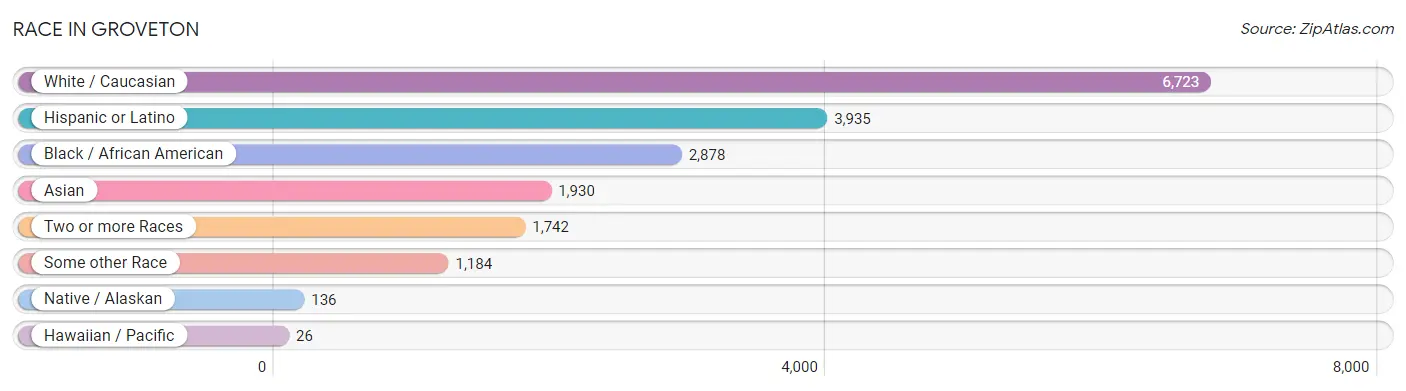
Race in Groveton
The most populous races in Groveton are White / Caucasian (6,723 | 46.0%), Hispanic or Latino (3,935 | 26.9%), and Black / African American (2,878 | 19.7%).
| Race | # Population | % Population |
| Asian | 1,930 | 13.2% |
| Black / African American | 2,878 | 19.7% |
| Hawaiian / Pacific | 26 | 0.2% |
| Hispanic or Latino | 3,935 | 26.9% |
| Native / Alaskan | 136 | 0.9% |
| White / Caucasian | 6,723 | 46.0% |
| Two or more Races | 1,742 | 11.9% |
| Some other Race | 1,184 | 8.1% |
| Total | 14,619 | 100.0% |
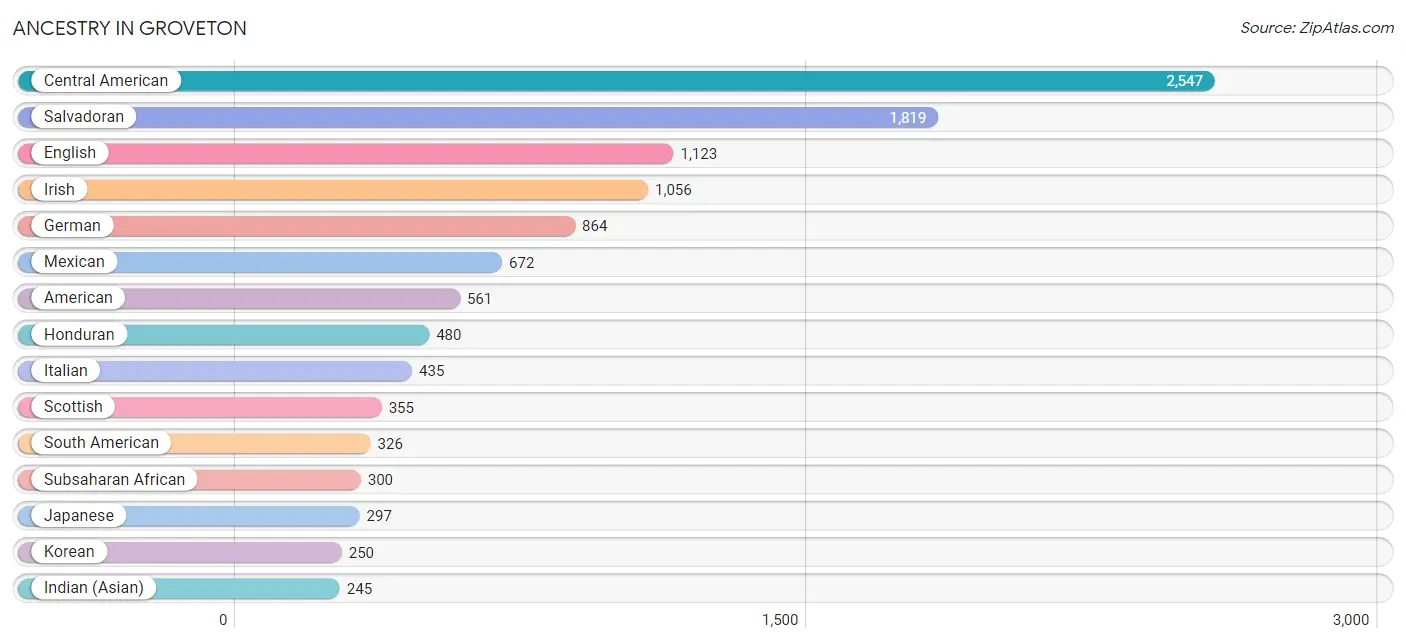
Ancestry in Groveton
The most populous ancestries reported in Groveton are Central American (2,547 | 17.4%), Salvadoran (1,819 | 12.4%), English (1,123 | 7.7%), Irish (1,056 | 7.2%), and German (864 | 5.9%), together accounting for 50.7% of all Groveton residents.
| Ancestry | # Population | % Population |
| African | 24 | 0.2% |
| American | 561 | 3.8% |
| Arab | 55 | 0.4% |
| Australian | 13 | 0.1% |
| Austrian | 35 | 0.2% |
| Barbadian | 19 | 0.1% |
| Belgian | 10 | 0.1% |
| Bhutanese | 106 | 0.7% |
| Bolivian | 44 | 0.3% |
| Brazilian | 29 | 0.2% |
| British | 142 | 1.0% |
| Burmese | 93 | 0.6% |
| Central American | 2,547 | 17.4% |
| Cherokee | 28 | 0.2% |
| Chilean | 26 | 0.2% |
| Choctaw | 12 | 0.1% |
| Colombian | 29 | 0.2% |
| Cuban | 19 | 0.1% |
| Cypriot | 44 | 0.3% |
| Czech | 31 | 0.2% |
| Czechoslovakian | 9 | 0.1% |
| Danish | 3 | 0.0% |
| Dominican | 89 | 0.6% |
| Dutch | 58 | 0.4% |
| Eastern European | 43 | 0.3% |
| Ecuadorian | 69 | 0.5% |
| Egyptian | 17 | 0.1% |
| English | 1,123 | 7.7% |
| Ethiopian | 130 | 0.9% |
| European | 171 | 1.2% |
| Filipino | 16 | 0.1% |
| French | 179 | 1.2% |
| French Canadian | 97 | 0.7% |
| German | 864 | 5.9% |
| Ghanaian | 38 | 0.3% |
| Greek | 8 | 0.1% |
| Guamanian / Chamorro | 26 | 0.2% |
| Guatemalan | 167 | 1.1% |
| Guyanese | 13 | 0.1% |
| Honduran | 480 | 3.3% |
| Hungarian | 50 | 0.3% |
| Indian (Asian) | 245 | 1.7% |
| Iranian | 15 | 0.1% |
| Irish | 1,056 | 7.2% |
| Italian | 435 | 3.0% |
| Jamaican | 17 | 0.1% |
| Japanese | 297 | 2.0% |
| Korean | 250 | 1.7% |
| Lithuanian | 19 | 0.1% |
| Luxembourger | 4 | 0.0% |
| Mexican | 672 | 4.6% |
| Moroccan | 3 | 0.0% |
| Nicaraguan | 81 | 0.5% |
| Northern European | 28 | 0.2% |
| Norwegian | 65 | 0.4% |
| Pakistani | 160 | 1.1% |
| Paraguayan | 17 | 0.1% |
| Peruvian | 53 | 0.4% |
| Polish | 208 | 1.4% |
| Puerto Rican | 98 | 0.7% |
| Romanian | 36 | 0.3% |
| Salvadoran | 1,819 | 12.4% |
| Scandinavian | 26 | 0.2% |
| Scotch-Irish | 225 | 1.5% |
| Scottish | 355 | 2.4% |
| Slavic | 6 | 0.0% |
| South American | 326 | 2.2% |
| South American Indian | 18 | 0.1% |
| Spanish | 56 | 0.4% |
| Sri Lankan | 148 | 1.0% |
| Subsaharan African | 300 | 2.1% |
| Swedish | 20 | 0.1% |
| Swiss | 10 | 0.1% |
| Syrian | 13 | 0.1% |
| Thai | 211 | 1.4% |
| Uruguayan | 2 | 0.0% |
| Venezuelan | 86 | 0.6% |
| Vietnamese | 73 | 0.5% |
| Welsh | 95 | 0.6% |
| Yugoslavian | 52 | 0.4% | View All 80 Rows |
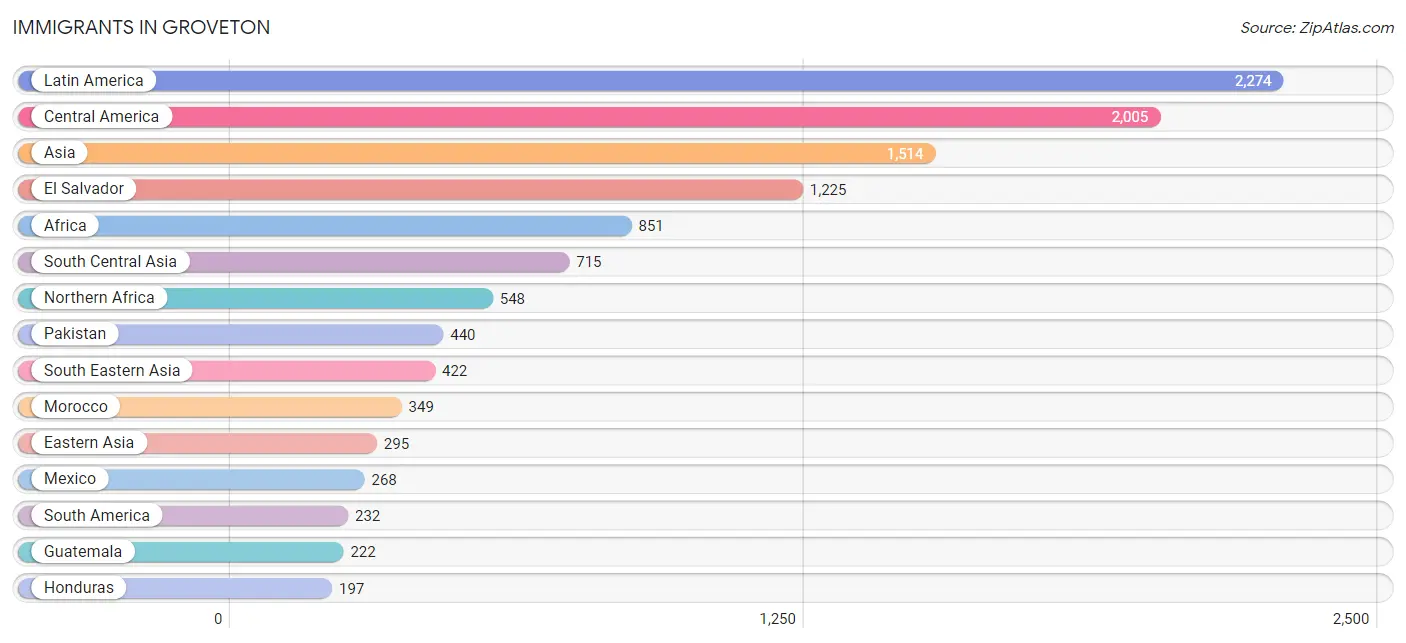
Immigrants in Groveton
The most numerous immigrant groups reported in Groveton came from Latin America (2,274 | 15.6%), Central America (2,005 | 13.7%), Asia (1,514 | 10.4%), El Salvador (1,225 | 8.4%), and Africa (851 | 5.8%), together accounting for 53.8% of all Groveton residents.
| Immigration Origin | # Population | % Population |
| Afghanistan | 130 | 0.9% |
| Africa | 851 | 5.8% |
| Asia | 1,514 | 10.4% |
| Bangladesh | 37 | 0.3% |
| Bolivia | 55 | 0.4% |
| Bosnia and Herzegovina | 52 | 0.4% |
| Brazil | 29 | 0.2% |
| Cambodia | 122 | 0.8% |
| Canada | 5 | 0.0% |
| Caribbean | 37 | 0.3% |
| Central America | 2,005 | 13.7% |
| Chile | 15 | 0.1% |
| China | 174 | 1.2% |
| Colombia | 5 | 0.0% |
| Cuba | 19 | 0.1% |
| Denmark | 3 | 0.0% |
| Dominican Republic | 18 | 0.1% |
| Eastern Africa | 181 | 1.2% |
| Eastern Asia | 295 | 2.0% |
| Eastern Europe | 90 | 0.6% |
| Ecuador | 48 | 0.3% |
| Egypt | 14 | 0.1% |
| El Salvador | 1,225 | 8.4% |
| Ethiopia | 181 | 1.2% |
| Europe | 147 | 1.0% |
| Germany | 35 | 0.2% |
| Ghana | 59 | 0.4% |
| Guatemala | 222 | 1.5% |
| Guyana | 13 | 0.1% |
| Honduras | 197 | 1.3% |
| Hong Kong | 115 | 0.8% |
| Hungary | 12 | 0.1% |
| India | 93 | 0.6% |
| Iran | 15 | 0.1% |
| Ireland | 8 | 0.1% |
| Italy | 11 | 0.1% |
| Japan | 89 | 0.6% |
| Jordan | 15 | 0.1% |
| Korea | 32 | 0.2% |
| Latin America | 2,274 | 15.6% |
| Mexico | 268 | 1.8% |
| Morocco | 349 | 2.4% |
| Nicaragua | 93 | 0.6% |
| Northern Africa | 548 | 3.7% |
| Northern Europe | 11 | 0.1% |
| Pakistan | 440 | 3.0% |
| Peru | 67 | 0.5% |
| Philippines | 106 | 0.7% |
| Poland | 13 | 0.1% |
| Romania | 13 | 0.1% |
| Sierra Leone | 41 | 0.3% |
| South America | 232 | 1.6% |
| South Central Asia | 715 | 4.9% |
| South Eastern Asia | 422 | 2.9% |
| Southern Europe | 11 | 0.1% |
| Sudan | 185 | 1.3% |
| Taiwan | 9 | 0.1% |
| Thailand | 92 | 0.6% |
| Vietnam | 102 | 0.7% |
| Western Africa | 122 | 0.8% |
| Western Asia | 82 | 0.6% |
| Western Europe | 35 | 0.2% | View All 62 Rows |
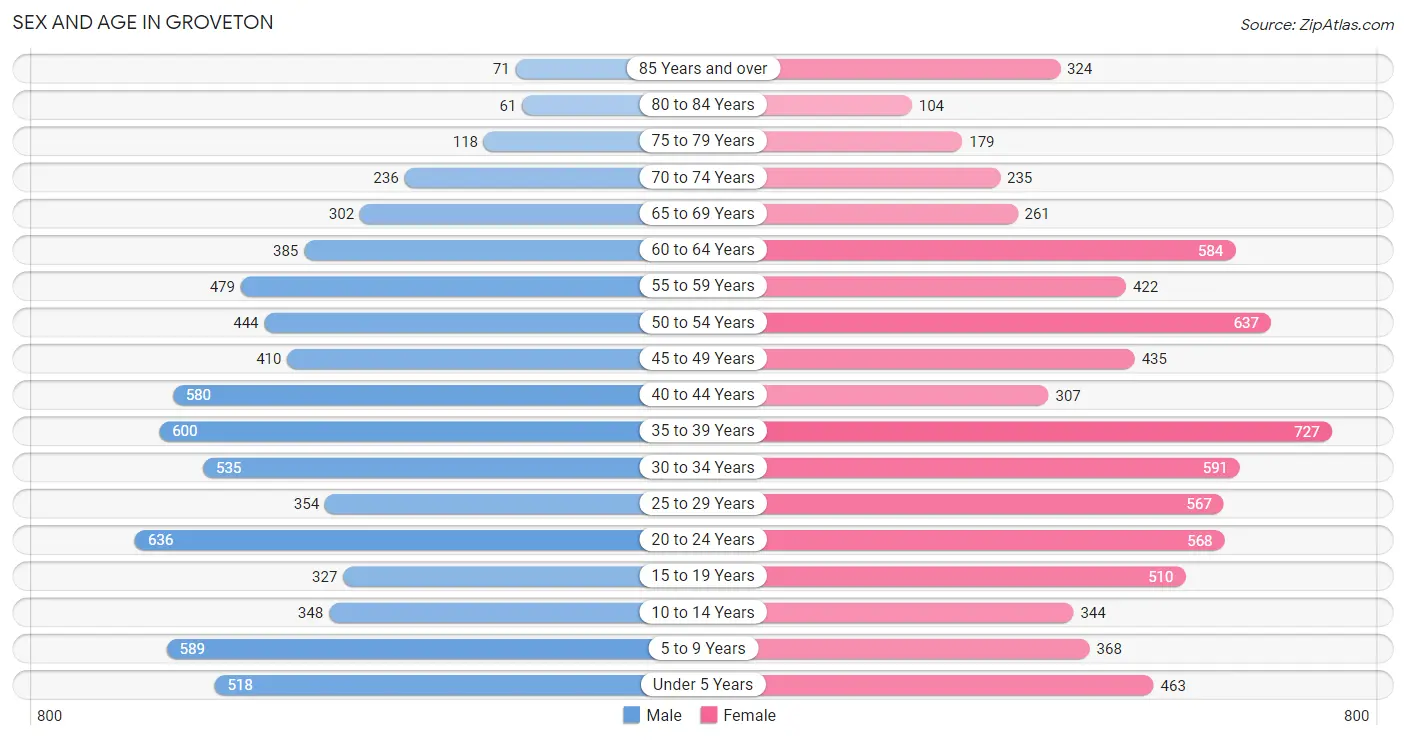
Sex and Age in Groveton
Sex and Age in Groveton
The most populous age groups in Groveton are 20 to 24 Years (636 | 9.1%) for men and 35 to 39 Years (727 | 9.5%) for women.
| Age Bracket | Male | Female |
| Under 5 Years | 518 (7.4%) | 463 (6.1%) |
| 5 to 9 Years | 589 (8.4%) | 368 (4.8%) |
| 10 to 14 Years | 348 (5.0%) | 344 (4.5%) |
| 15 to 19 Years | 327 (4.7%) | 510 (6.7%) |
| 20 to 24 Years | 636 (9.1%) | 568 (7.4%) |
| 25 to 29 Years | 354 (5.1%) | 567 (7.4%) |
| 30 to 34 Years | 535 (7.6%) | 591 (7.7%) |
| 35 to 39 Years | 600 (8.6%) | 727 (9.5%) |
| 40 to 44 Years | 580 (8.3%) | 307 (4.0%) |
| 45 to 49 Years | 410 (5.9%) | 435 (5.7%) |
| 50 to 54 Years | 444 (6.4%) | 637 (8.4%) |
| 55 to 59 Years | 479 (6.9%) | 422 (5.5%) |
| 60 to 64 Years | 385 (5.5%) | 584 (7.7%) |
| 65 to 69 Years | 302 (4.3%) | 261 (3.4%) |
| 70 to 74 Years | 236 (3.4%) | 235 (3.1%) |
| 75 to 79 Years | 118 (1.7%) | 179 (2.4%) |
| 80 to 84 Years | 61 (0.9%) | 104 (1.4%) |
| 85 Years and over | 71 (1.0%) | 324 (4.3%) |
| Total | 6,993 (100.0%) | 7,626 (100.0%) |
Families and Households in Groveton
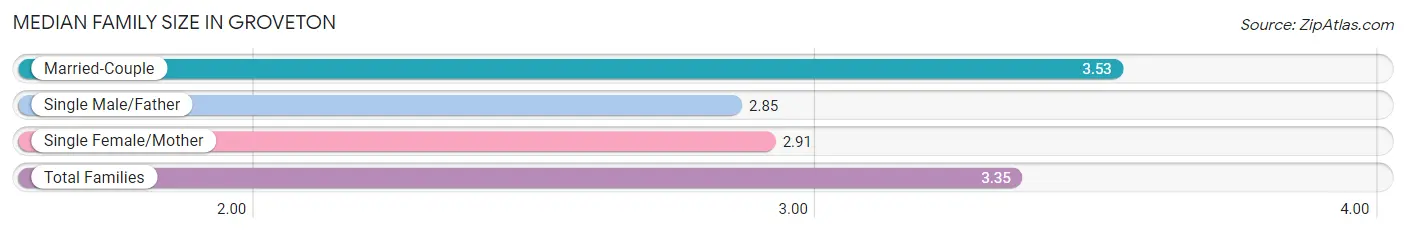
Median Family Size in Groveton
The median family size in Groveton is 3.35 persons per family, with married-couple families (2,572 | 71.5%) accounting for the largest median family size of 3.53 persons per family. On the other hand, single male/father families (324 | 9.0%) represent the smallest median family size with 2.85 persons per family.
| Family Type | # Families | Family Size |
| Married-Couple | 2,572 (71.5%) | 3.53 |
| Single Male/Father | 324 (9.0%) | 2.85 |
| Single Female/Mother | 699 (19.4%) | 2.91 |
| Total Families | 3,595 (100.0%) | 3.35 |
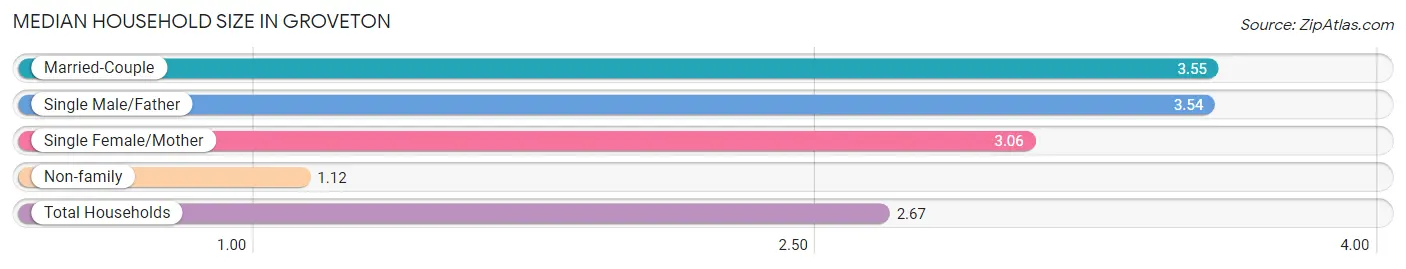
Median Household Size in Groveton
The median household size in Groveton is 2.67 persons per household, with married-couple households (2,572 | 47.3%) accounting for the largest median household size of 3.55 persons per household. non-family households (1,842 | 33.9%) represent the smallest median household size with 1.12 persons per household.
| Household Type | # Households | Household Size |
| Married-Couple | 2,572 (47.3%) | 3.55 |
| Single Male/Father | 324 (6.0%) | 3.54 |
| Single Female/Mother | 699 (12.9%) | 3.06 |
| Non-family | 1,842 (33.9%) | 1.12 |
| Total Households | 5,437 (100.0%) | 2.67 |
Household Size by Marriage Status in Groveton
Out of a total of 5,437 households in Groveton, 3,595 (66.1%) are family households, while 1,842 (33.9%) are nonfamily households. The most numerous type of family households are 2-person households, comprising 1,499, and the most common type of nonfamily households are 1-person households, comprising 1,652.
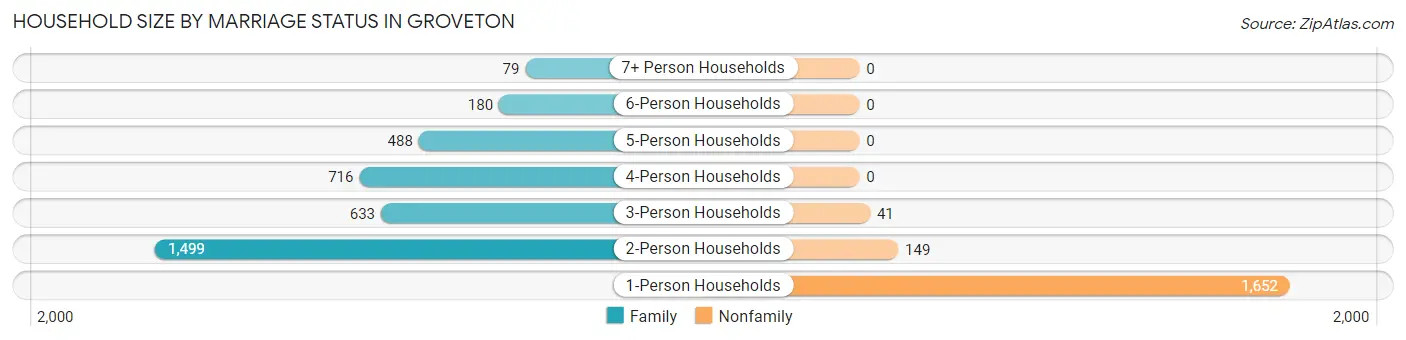
| Household Size | Family Households | Nonfamily Households |
| 1-Person Households | - | 1,652 (30.4%) |
| 2-Person Households | 1,499 (27.6%) | 149 (2.7%) |
| 3-Person Households | 633 (11.6%) | 41 (0.7%) |
| 4-Person Households | 716 (13.2%) | 0 (0.0%) |
| 5-Person Households | 488 (9.0%) | 0 (0.0%) |
| 6-Person Households | 180 (3.3%) | 0 (0.0%) |
| 7+ Person Households | 79 (1.5%) | 0 (0.0%) |
| Total | 3,595 (66.1%) | 1,842 (33.9%) |
Female Fertility in Groveton
Fertility by Age in Groveton
Average fertility rate in Groveton is 75.0 births per 1,000 women. Women in the age bracket of 20 to 34 years have the highest fertility rate with 90.0 births per 1,000 women. Women in the age bracket of 20 to 34 years acount for 54.6% of all women with births.
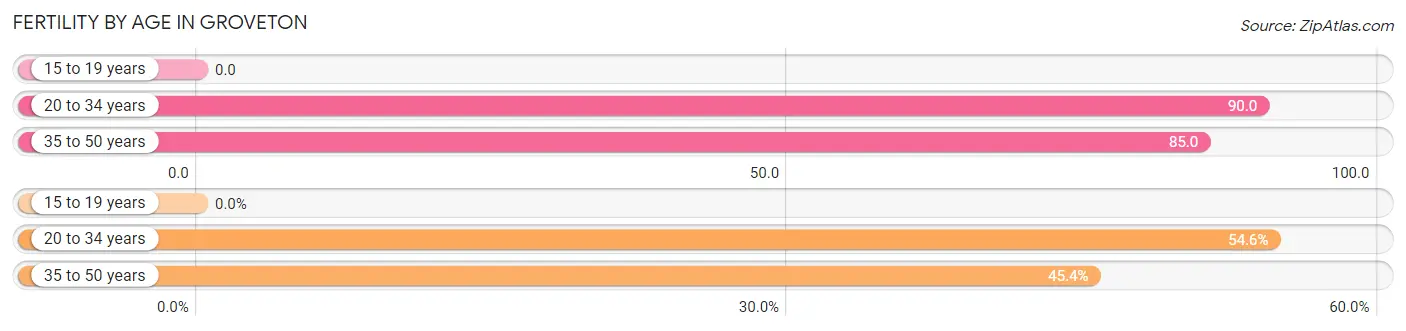
| Age Bracket | Women with Births | Births / 1,000 Women |
| 15 to 19 years | 0 (0.0%) | 0.0 |
| 20 to 34 years | 155 (54.6%) | 90.0 |
| 35 to 50 years | 129 (45.4%) | 85.0 |
| Total | 284 (100.0%) | 75.0 |
Fertility by Age by Marriage Status in Groveton
74.3% of women with births (284) in Groveton are married. The highest percentage of unmarried women with births falls into 20 to 34 years age bracket with 47.1% of them unmarried at the time of birth, while the lowest percentage of unmarried women with births belong to 35 to 50 years age bracket with 0.0% of them unmarried.
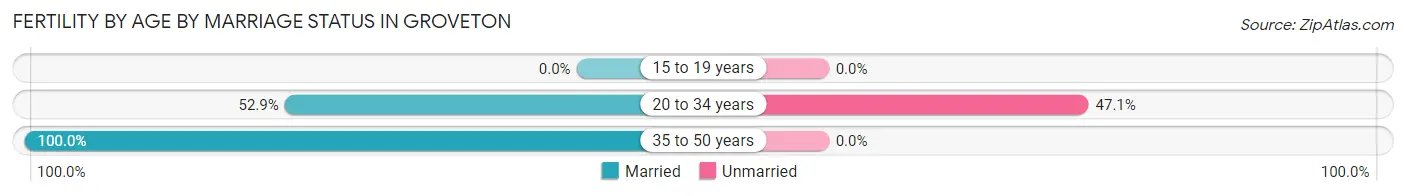
| Age Bracket | Married | Unmarried |
| 15 to 19 years | 0 (0.0%) | 0 (0.0%) |
| 20 to 34 years | 82 (52.9%) | 73 (47.1%) |
| 35 to 50 years | 129 (100.0%) | 0 (0.0%) |
| Total | 211 (74.3%) | 73 (25.7%) |
Fertility by Education in Groveton
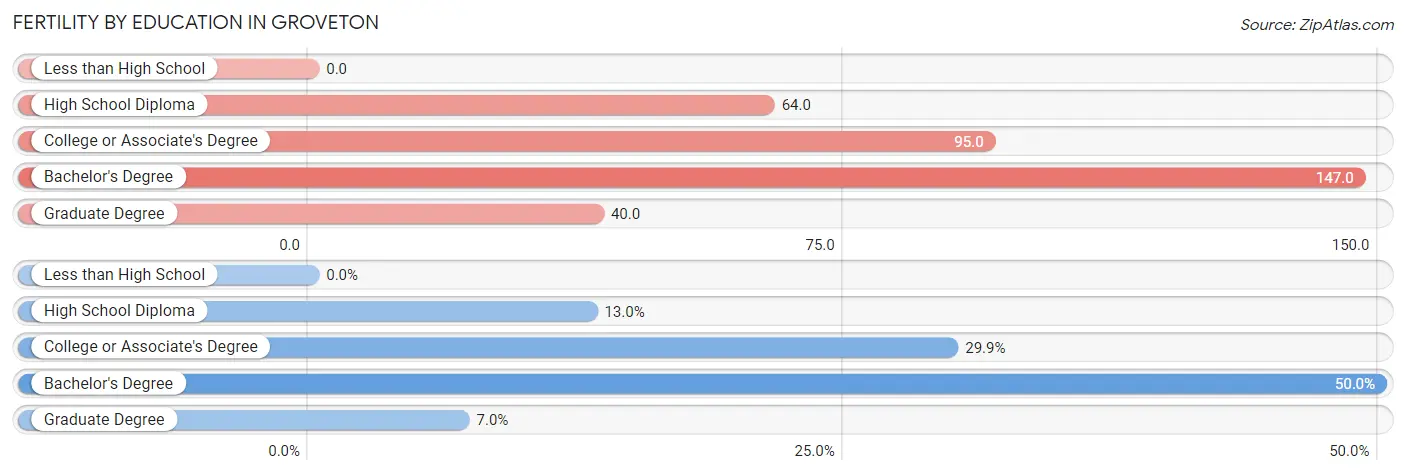
| Educational Attainment | Women with Births | Births / 1,000 Women |
| Less than High School | 0 (0.0%) | 0.0 |
| High School Diploma | 37 (13.0%) | 64.0 |
| College or Associate's Degree | 85 (29.9%) | 95.0 |
| Bachelor's Degree | 142 (50.0%) | 147.0 |
| Graduate Degree | 20 (7.0%) | 40.0 |
| Total | 284 (100.0%) | 75.0 |
Fertility by Education by Marriage Status in Groveton
25.7% of women with births in Groveton are unmarried. Women with the educational attainment of high school diploma are most likely to be married with 100.0% of them married at childbirth, while women with the educational attainment of college or associate's degree are least likely to be married with 67.1% of them unmarried at childbirth.
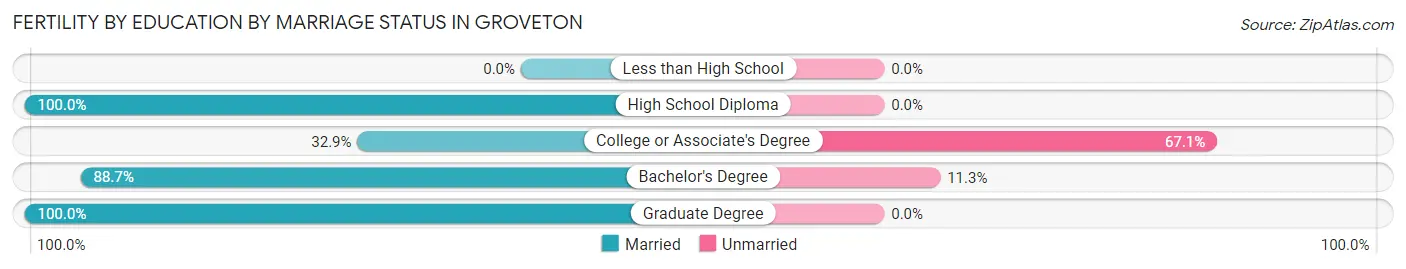
| Educational Attainment | Married | Unmarried |
| Less than High School | 0 (0.0%) | 0 (0.0%) |
| High School Diploma | 37 (100.0%) | 0 (0.0%) |
| College or Associate's Degree | 28 (32.9%) | 57 (67.1%) |
| Bachelor's Degree | 126 (88.7%) | 16 (11.3%) |
| Graduate Degree | 20 (100.0%) | 0 (0.0%) |
| Total | 211 (74.3%) | 73 (25.7%) |
Employment Characteristics in Groveton
Employment by Class of Employer in Groveton
Among the 7,688 employed individuals in Groveton, private company employees (4,220 | 54.9%), federal government employees (1,233 | 16.0%), and not-for-profit organizations (784 | 10.2%) make up the most common classes of employment.
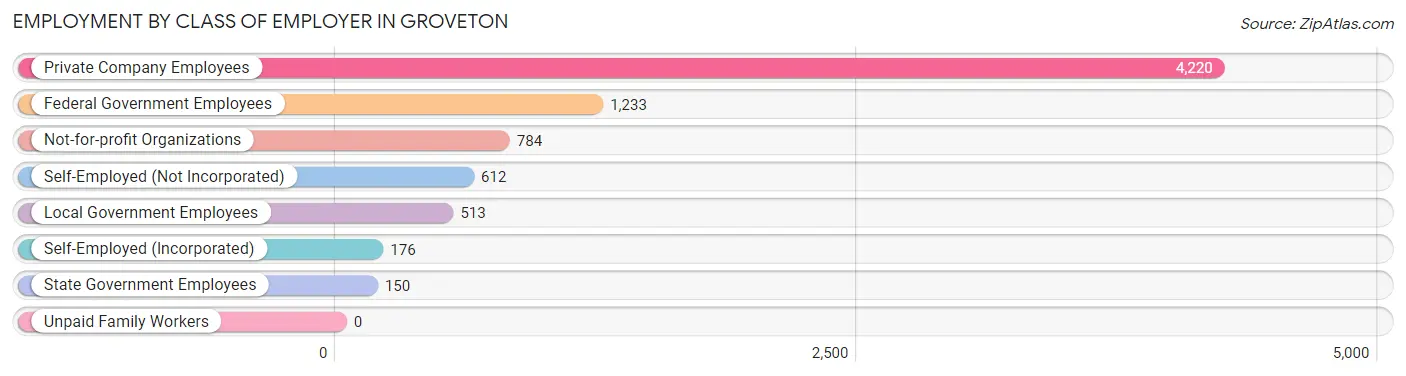
| Employer Class | # Employees | % Employees |
| Private Company Employees | 4,220 | 54.9% |
| Self-Employed (Incorporated) | 176 | 2.3% |
| Self-Employed (Not Incorporated) | 612 | 8.0% |
| Not-for-profit Organizations | 784 | 10.2% |
| Local Government Employees | 513 | 6.7% |
| State Government Employees | 150 | 1.9% |
| Federal Government Employees | 1,233 | 16.0% |
| Unpaid Family Workers | 0 | 0.0% |
| Total | 7,688 | 100.0% |
Employment Status by Age in Groveton
According to the labor force statistics for Groveton, out of the total population over 16 years of age (11,802), 71.2% or 8,403 individuals are in the labor force, with 7.4% or 622 of them unemployed. The age group with the highest labor force participation rate is 25 to 29 years, with 96.4% or 888 individuals in the labor force. Within the labor force, the 16 to 19 years age range has the highest percentage of unemployed individuals, with 15.2% or 29 of them being unemployed.
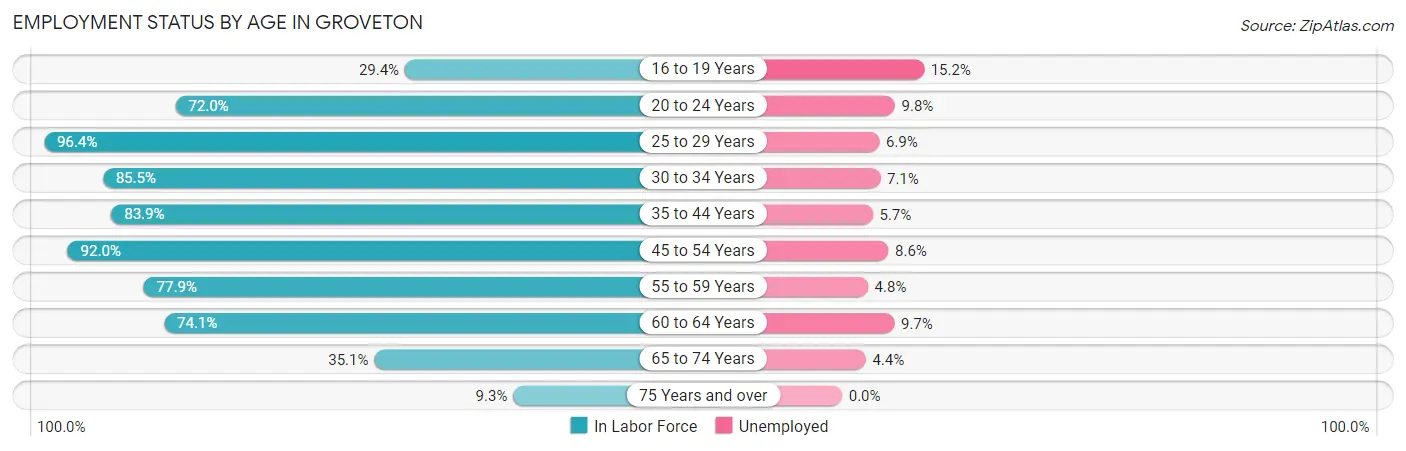
| Age Bracket | In Labor Force | Unemployed |
| 16 to 19 Years | 191 (29.4%) | 29 (15.2%) |
| 20 to 24 Years | 867 (72.0%) | 85 (9.8%) |
| 25 to 29 Years | 888 (96.4%) | 61 (6.9%) |
| 30 to 34 Years | 963 (85.5%) | 68 (7.1%) |
| 35 to 44 Years | 1,858 (83.9%) | 106 (5.7%) |
| 45 to 54 Years | 1,772 (92.0%) | 152 (8.6%) |
| 55 to 59 Years | 702 (77.9%) | 34 (4.8%) |
| 60 to 64 Years | 718 (74.1%) | 70 (9.7%) |
| 65 to 74 Years | 363 (35.1%) | 16 (4.4%) |
| 75 Years and over | 80 (9.3%) | 0 (0.0%) |
| Total | 8,403 (71.2%) | 622 (7.4%) |
Employment Status by Educational Attainment in Groveton
According to labor force statistics for Groveton, 85.6% of individuals (6,897) out of the total population between 25 and 64 years of age (8,057) are in the labor force, with 7.2% or 497 of them being unemployed. The group with the highest labor force participation rate are those with the educational attainment of bachelor's degree or higher, with 92.5% or 3,629 individuals in the labor force. Within the labor force, individuals with high school diploma education have the highest percentage of unemployment, with 12.8% or 146 of them being unemployed.
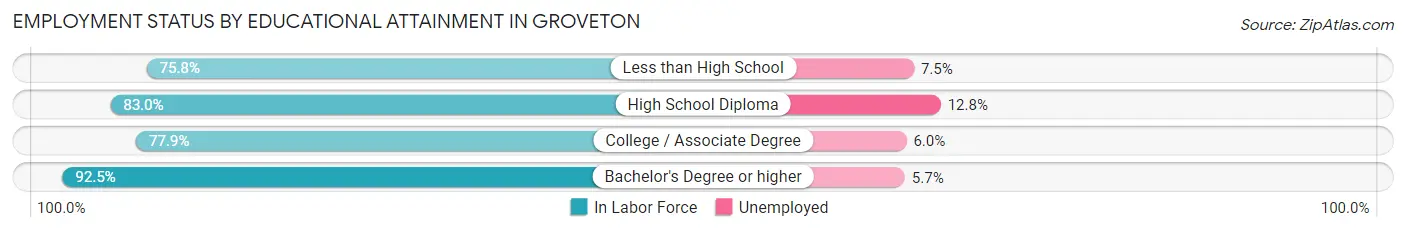
| Educational Attainment | In Labor Force | Unemployed |
| Less than High School | 724 (75.8%) | 72 (7.5%) |
| High School Diploma | 1,138 (83.0%) | 175 (12.8%) |
| College / Associate Degree | 1,408 (77.9%) | 108 (6.0%) |
| Bachelor's Degree or higher | 3,629 (92.5%) | 224 (5.7%) |
| Total | 6,897 (85.6%) | 580 (7.2%) |
Employment Occupations by Sex in Groveton
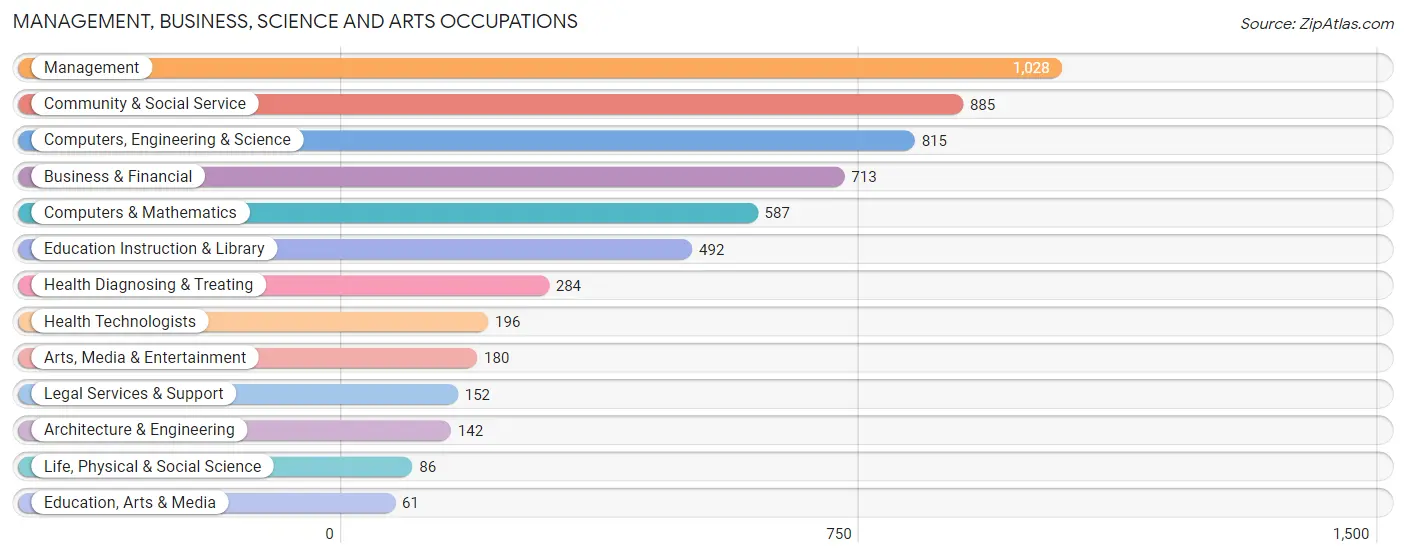
Management, Business, Science and Arts Occupations
The most common Management, Business, Science and Arts occupations in Groveton are Management (1,028 | 13.8%), Community & Social Service (885 | 11.9%), Computers, Engineering & Science (815 | 10.9%), Business & Financial (713 | 9.6%), and Computers & Mathematics (587 | 7.9%).
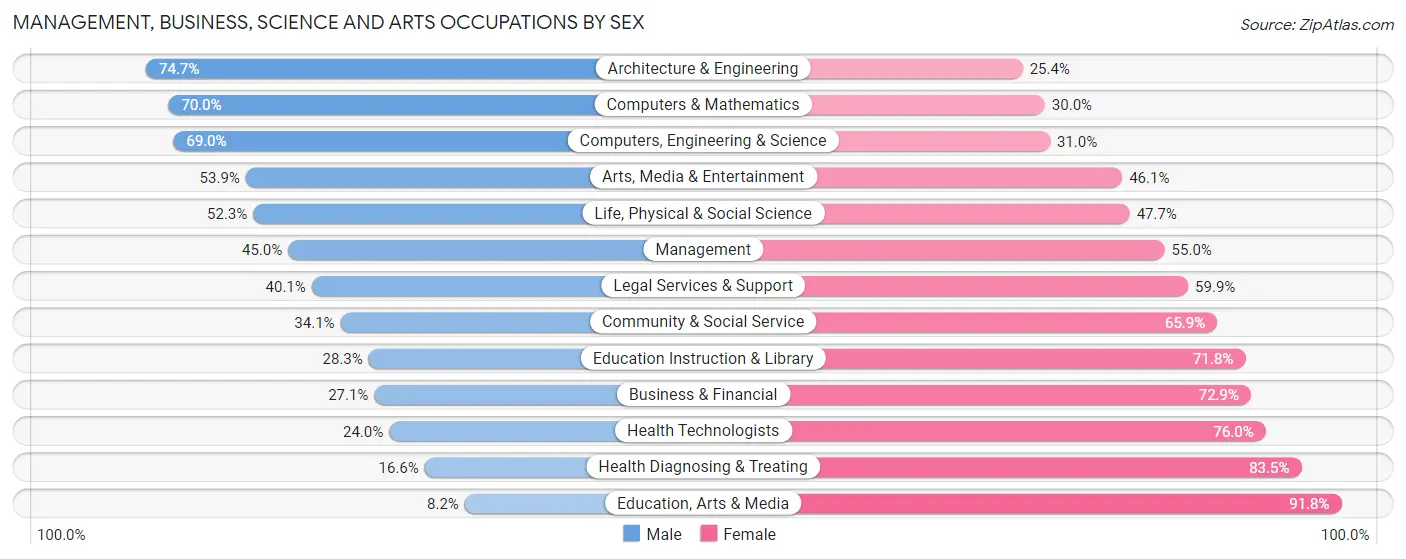
Management, Business, Science and Arts Occupations by Sex
Within the Management, Business, Science and Arts occupations in Groveton, the most male-oriented occupations are Architecture & Engineering (74.7%), Computers & Mathematics (70.0%), and Computers, Engineering & Science (69.0%), while the most female-oriented occupations are Education, Arts & Media (91.8%), Health Diagnosing & Treating (83.5%), and Health Technologists (76.0%).
| Occupation | Male | Female |
| Management | 463 (45.0%) | 565 (55.0%) |
| Business & Financial | 193 (27.1%) | 520 (72.9%) |
| Computers, Engineering & Science | 562 (69.0%) | 253 (31.0%) |
| Computers & Mathematics | 411 (70.0%) | 176 (30.0%) |
| Architecture & Engineering | 106 (74.7%) | 36 (25.4%) |
| Life, Physical & Social Science | 45 (52.3%) | 41 (47.7%) |
| Community & Social Service | 302 (34.1%) | 583 (65.9%) |
| Education, Arts & Media | 5 (8.2%) | 56 (91.8%) |
| Legal Services & Support | 61 (40.1%) | 91 (59.9%) |
| Education Instruction & Library | 139 (28.2%) | 353 (71.8%) |
| Arts, Media & Entertainment | 97 (53.9%) | 83 (46.1%) |
| Health Diagnosing & Treating | 47 (16.6%) | 237 (83.5%) |
| Health Technologists | 47 (24.0%) | 149 (76.0%) |
| Total (Category) | 1,567 (42.1%) | 2,158 (57.9%) |
| Total (Overall) | 3,585 (48.1%) | 3,862 (51.9%) |
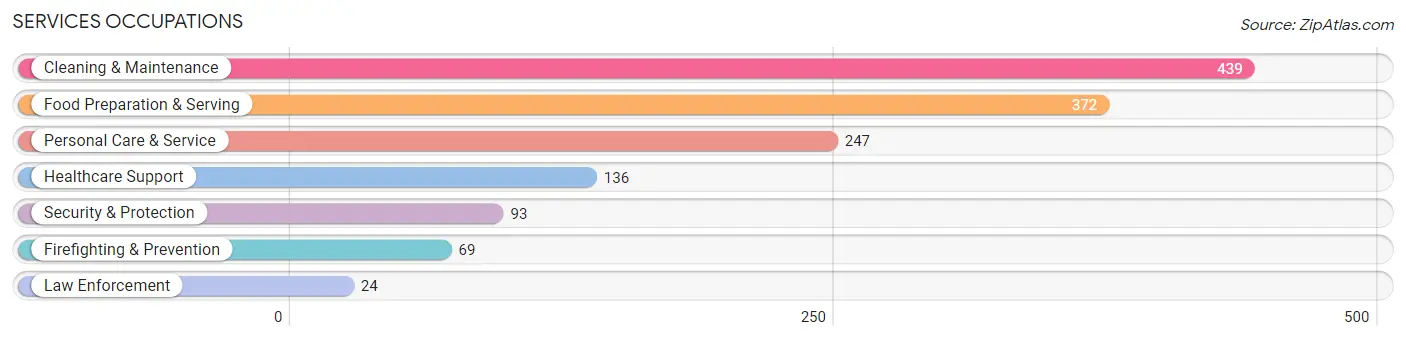
Services Occupations
The most common Services occupations in Groveton are Cleaning & Maintenance (439 | 5.9%), Food Preparation & Serving (372 | 5.0%), Personal Care & Service (247 | 3.3%), Healthcare Support (136 | 1.8%), and Security & Protection (93 | 1.3%).
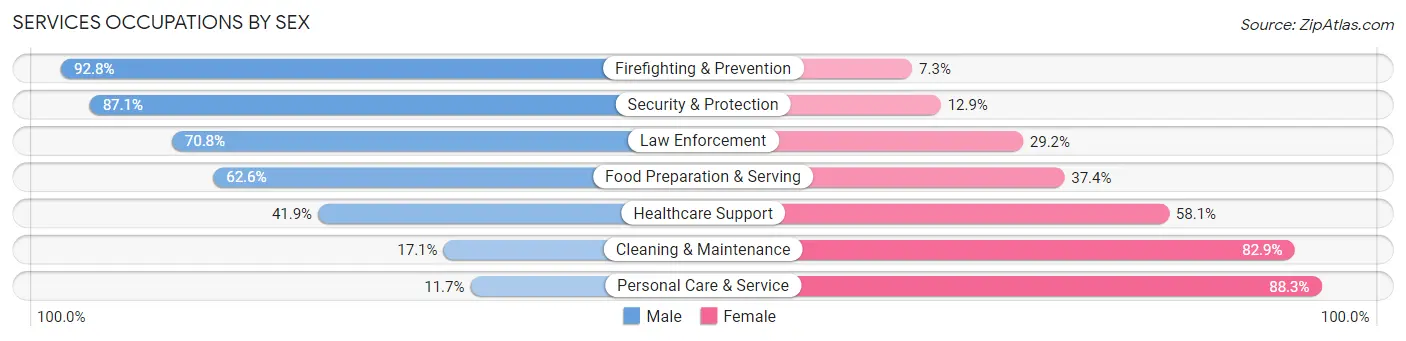
Services Occupations by Sex
Within the Services occupations in Groveton, the most male-oriented occupations are Firefighting & Prevention (92.7%), Security & Protection (87.1%), and Law Enforcement (70.8%), while the most female-oriented occupations are Personal Care & Service (88.3%), Cleaning & Maintenance (82.9%), and Healthcare Support (58.1%).
| Occupation | Male | Female |
| Healthcare Support | 57 (41.9%) | 79 (58.1%) |
| Security & Protection | 81 (87.1%) | 12 (12.9%) |
| Firefighting & Prevention | 64 (92.7%) | 5 (7.2%) |
| Law Enforcement | 17 (70.8%) | 7 (29.2%) |
| Food Preparation & Serving | 233 (62.6%) | 139 (37.4%) |
| Cleaning & Maintenance | 75 (17.1%) | 364 (82.9%) |
| Personal Care & Service | 29 (11.7%) | 218 (88.3%) |
| Total (Category) | 475 (36.9%) | 812 (63.1%) |
| Total (Overall) | 3,585 (48.1%) | 3,862 (51.9%) |
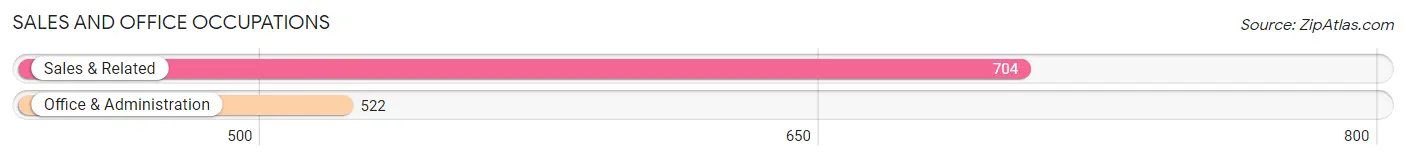
Sales and Office Occupations
The most common Sales and Office occupations in Groveton are Sales & Related (704 | 9.5%), and Office & Administration (522 | 7.0%).
Sales and Office Occupations by Sex
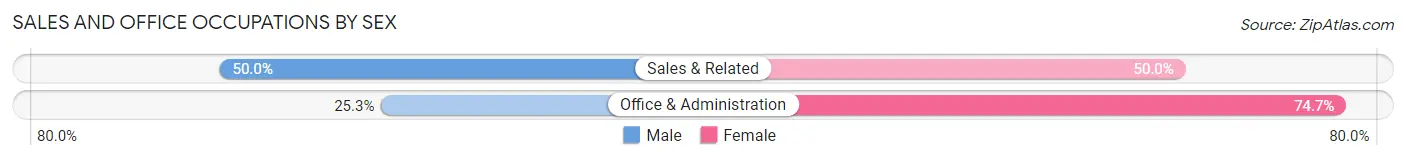
| Occupation | Male | Female |
| Sales & Related | 352 (50.0%) | 352 (50.0%) |
| Office & Administration | 132 (25.3%) | 390 (74.7%) |
| Total (Category) | 484 (39.5%) | 742 (60.5%) |
| Total (Overall) | 3,585 (48.1%) | 3,862 (51.9%) |
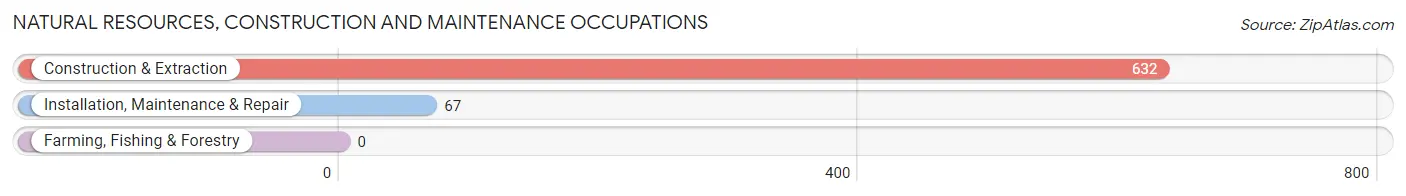
Natural Resources, Construction and Maintenance Occupations
The most common Natural Resources, Construction and Maintenance occupations in Groveton are Construction & Extraction (632 | 8.5%), and Installation, Maintenance & Repair (67 | 0.9%).
Natural Resources, Construction and Maintenance Occupations by Sex
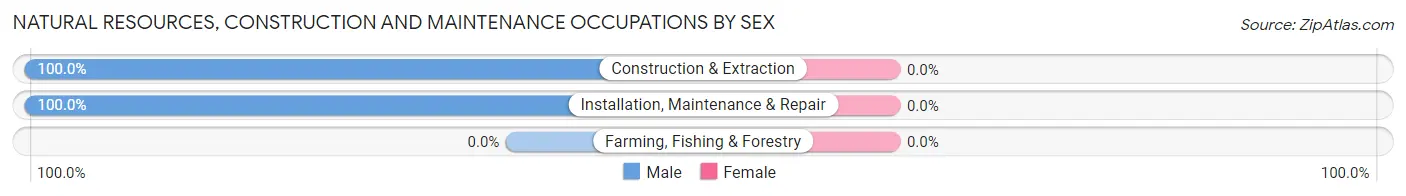
| Occupation | Male | Female |
| Farming, Fishing & Forestry | 0 (0.0%) | 0 (0.0%) |
| Construction & Extraction | 632 (100.0%) | 0 (0.0%) |
| Installation, Maintenance & Repair | 67 (100.0%) | 0 (0.0%) |
| Total (Category) | 699 (100.0%) | 0 (0.0%) |
| Total (Overall) | 3,585 (48.1%) | 3,862 (51.9%) |
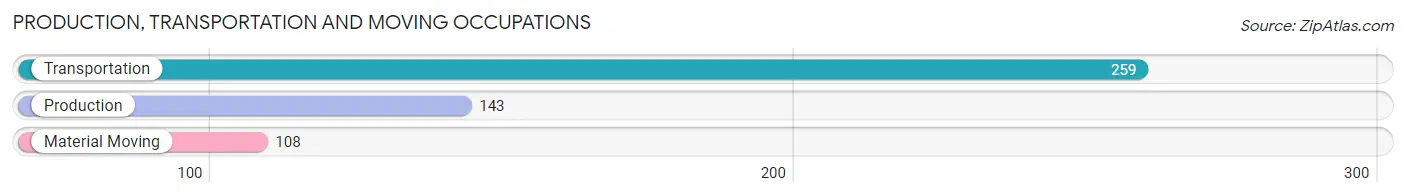
Production, Transportation and Moving Occupations
The most common Production, Transportation and Moving occupations in Groveton are Transportation (259 | 3.5%), Production (143 | 1.9%), and Material Moving (108 | 1.5%).
Production, Transportation and Moving Occupations by Sex
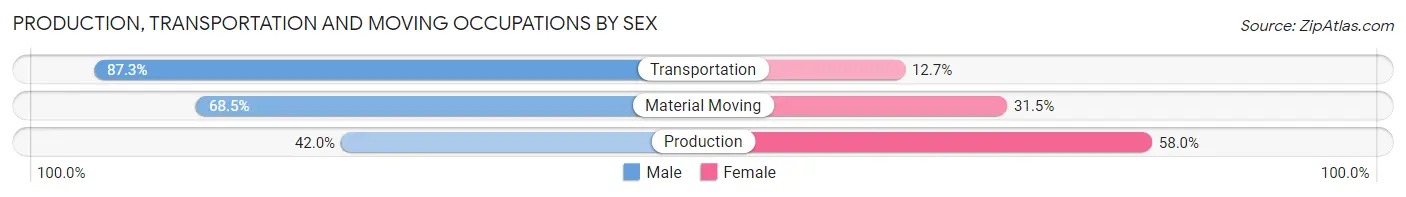
| Occupation | Male | Female |
| Production | 60 (42.0%) | 83 (58.0%) |
| Transportation | 226 (87.3%) | 33 (12.7%) |
| Material Moving | 74 (68.5%) | 34 (31.5%) |
| Total (Category) | 360 (70.6%) | 150 (29.4%) |
| Total (Overall) | 3,585 (48.1%) | 3,862 (51.9%) |
Employment Industries by Sex in Groveton
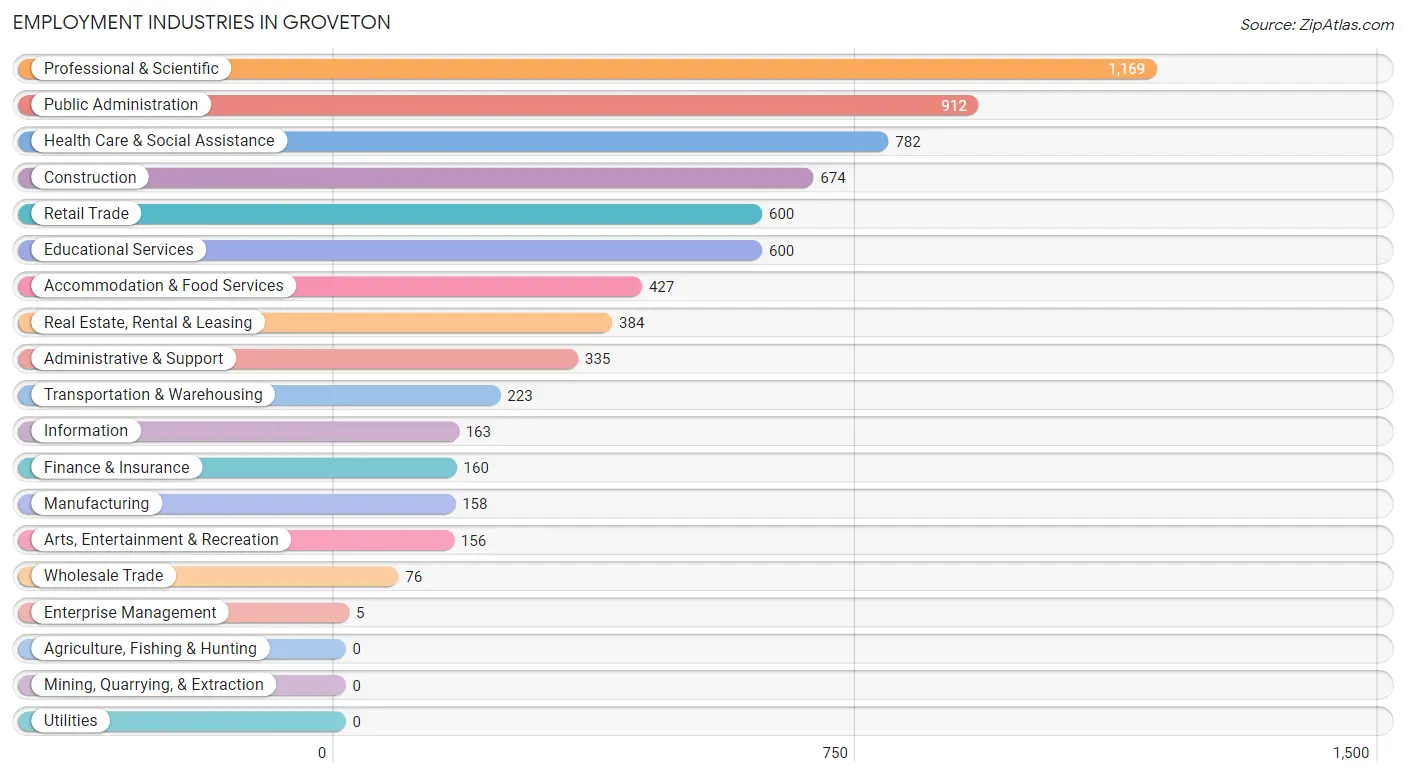
Employment Industries in Groveton
The major employment industries in Groveton include Professional & Scientific (1,169 | 15.7%), Public Administration (912 | 12.2%), Health Care & Social Assistance (782 | 10.5%), Construction (674 | 9.0%), and Retail Trade (600 | 8.1%).
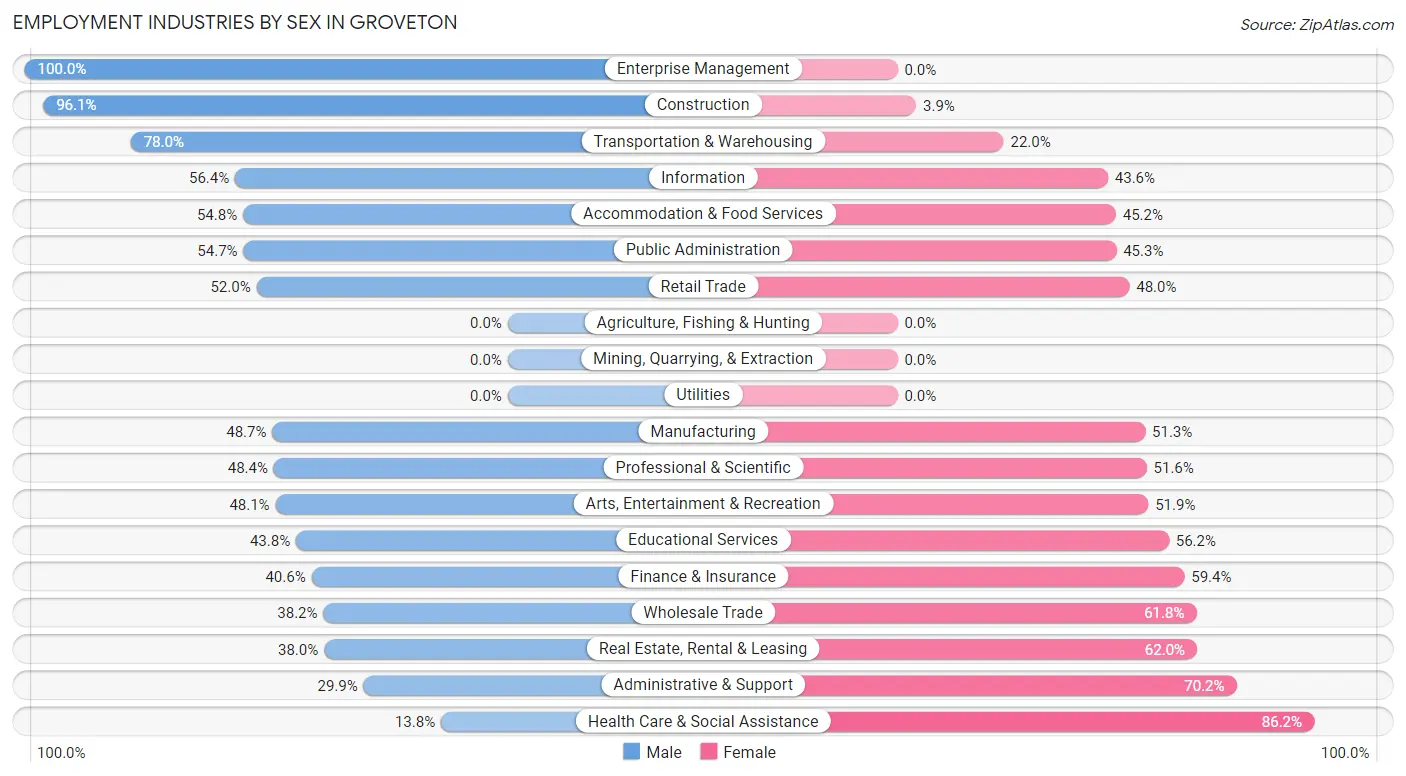
Employment Industries by Sex in Groveton
The Groveton industries that see more men than women are Enterprise Management (100.0%), Construction (96.1%), and Transportation & Warehousing (78.0%), whereas the industries that tend to have a higher number of women are Health Care & Social Assistance (86.2%), Administrative & Support (70.2%), and Real Estate, Rental & Leasing (62.0%).
| Industry | Male | Female |
| Agriculture, Fishing & Hunting | 0 (0.0%) | 0 (0.0%) |
| Mining, Quarrying, & Extraction | 0 (0.0%) | 0 (0.0%) |
| Construction | 648 (96.1%) | 26 (3.9%) |
| Manufacturing | 77 (48.7%) | 81 (51.3%) |
| Wholesale Trade | 29 (38.2%) | 47 (61.8%) |
| Retail Trade | 312 (52.0%) | 288 (48.0%) |
| Transportation & Warehousing | 174 (78.0%) | 49 (22.0%) |
| Utilities | 0 (0.0%) | 0 (0.0%) |
| Information | 92 (56.4%) | 71 (43.6%) |
| Finance & Insurance | 65 (40.6%) | 95 (59.4%) |
| Real Estate, Rental & Leasing | 146 (38.0%) | 238 (62.0%) |
| Professional & Scientific | 566 (48.4%) | 603 (51.6%) |
| Enterprise Management | 5 (100.0%) | 0 (0.0%) |
| Administrative & Support | 100 (29.8%) | 235 (70.2%) |
| Educational Services | 263 (43.8%) | 337 (56.2%) |
| Health Care & Social Assistance | 108 (13.8%) | 674 (86.2%) |
| Arts, Entertainment & Recreation | 75 (48.1%) | 81 (51.9%) |
| Accommodation & Food Services | 234 (54.8%) | 193 (45.2%) |
| Public Administration | 499 (54.7%) | 413 (45.3%) |
| Total | 3,585 (48.1%) | 3,862 (51.9%) |
Education in Groveton
School Enrollment in Groveton
The most common levels of schooling among the 3,236 students in Groveton are high school (827 | 25.6%), elementary school (765 | 23.6%), and college / undergraduate (703 | 21.7%).
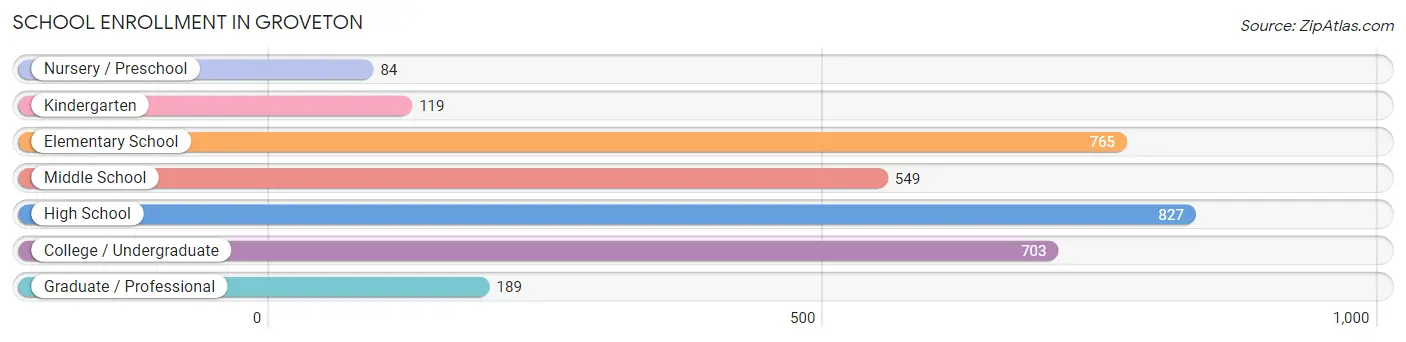
| School Level | # Students | % Students |
| Nursery / Preschool | 84 | 2.6% |
| Kindergarten | 119 | 3.7% |
| Elementary School | 765 | 23.6% |
| Middle School | 549 | 17.0% |
| High School | 827 | 25.6% |
| College / Undergraduate | 703 | 21.7% |
| Graduate / Professional | 189 | 5.8% |
| Total | 3,236 | 100.0% |
School Enrollment by Age by Funding Source in Groveton
Out of a total of 3,236 students who are enrolled in schools in Groveton, 466 (14.4%) attend a private institution, while the remaining 2,770 (85.6%) are enrolled in public schools. The age group of 3 to 4 year olds has the highest likelihood of being enrolled in private schools, with 75 (100.0% in the age bracket) enrolled. Conversely, the age group of 18 to 19 year olds has the lowest likelihood of being enrolled in a private school, with 127 (100.0% in the age bracket) attending a public institution.
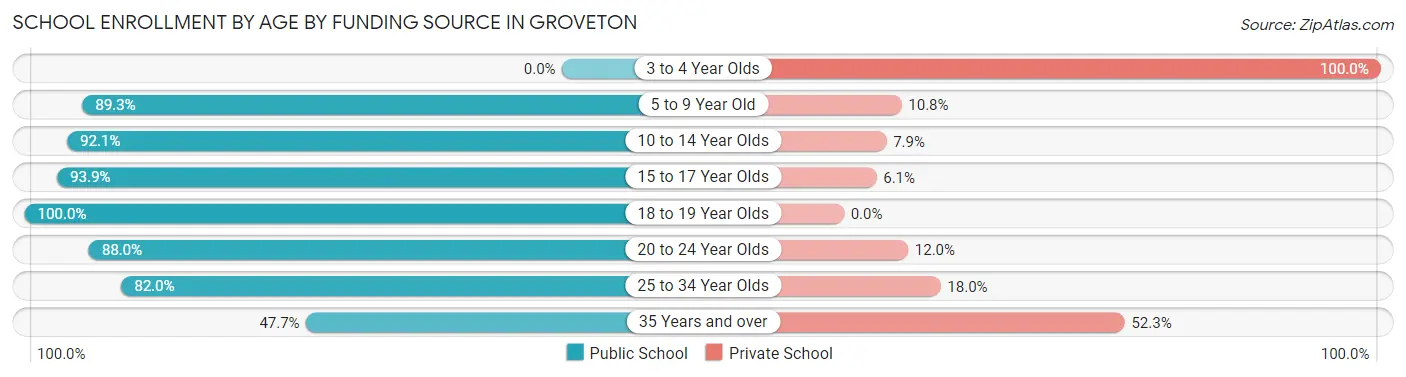
| Age Bracket | Public School | Private School |
| 3 to 4 Year Olds | 0 (0.0%) | 75 (100.0%) |
| 5 to 9 Year Old | 789 (89.2%) | 95 (10.7%) |
| 10 to 14 Year Olds | 628 (92.1%) | 54 (7.9%) |
| 15 to 17 Year Olds | 604 (93.9%) | 39 (6.1%) |
| 18 to 19 Year Olds | 127 (100.0%) | 0 (0.0%) |
| 20 to 24 Year Olds | 287 (88.0%) | 39 (12.0%) |
| 25 to 34 Year Olds | 232 (82.0%) | 51 (18.0%) |
| 35 Years and over | 103 (47.7%) | 113 (52.3%) |
| Total | 2,770 (85.6%) | 466 (14.4%) |
Educational Attainment by Field of Study in Groveton
Business (971 | 19.3%), social sciences (761 | 15.1%), computers & mathematics (359 | 7.1%), engineering (345 | 6.8%), and science & technology (341 | 6.8%) are the most common fields of study among 5,041 individuals in Groveton who have obtained a bachelor's degree or higher.
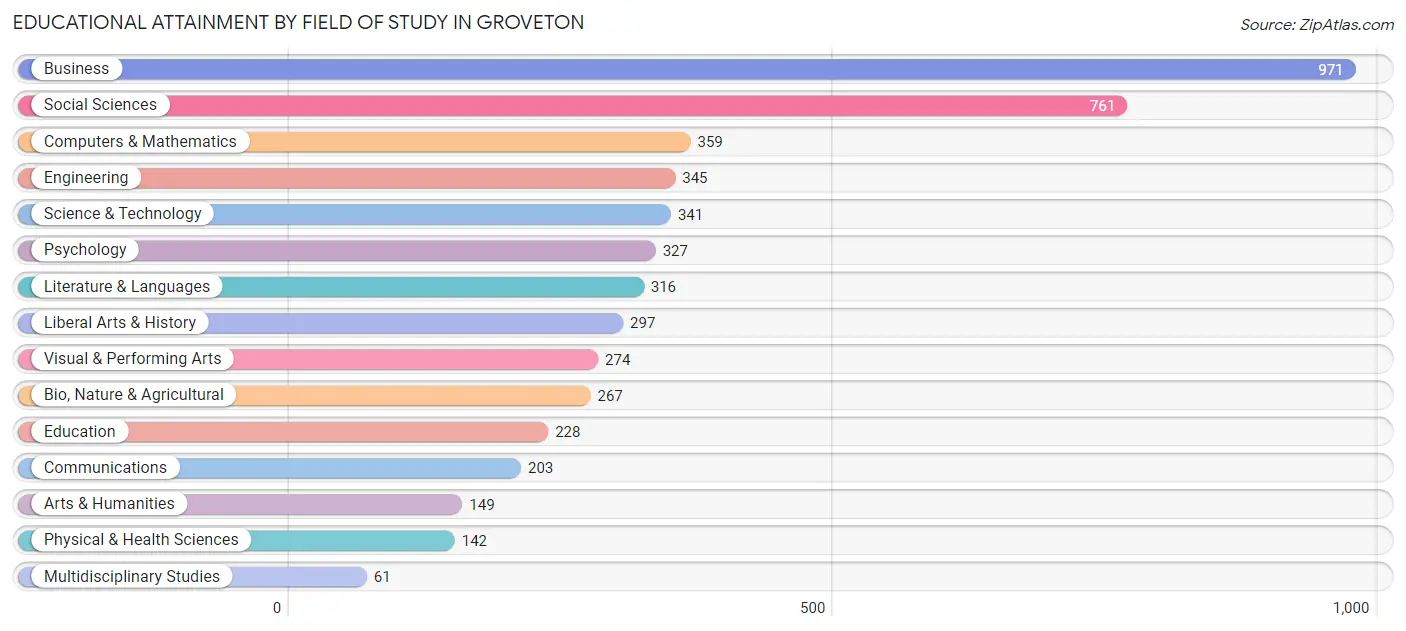
| Field of Study | # Graduates | % Graduates |
| Computers & Mathematics | 359 | 7.1% |
| Bio, Nature & Agricultural | 267 | 5.3% |
| Physical & Health Sciences | 142 | 2.8% |
| Psychology | 327 | 6.5% |
| Social Sciences | 761 | 15.1% |
| Engineering | 345 | 6.8% |
| Multidisciplinary Studies | 61 | 1.2% |
| Science & Technology | 341 | 6.8% |
| Business | 971 | 19.3% |
| Education | 228 | 4.5% |
| Literature & Languages | 316 | 6.3% |
| Liberal Arts & History | 297 | 5.9% |
| Visual & Performing Arts | 274 | 5.4% |
| Communications | 203 | 4.0% |
| Arts & Humanities | 149 | 3.0% |
| Total | 5,041 | 100.0% |
Transportation & Commute in Groveton
Vehicle Availability by Sex in Groveton
The most prevalent vehicle ownership categories in Groveton are males with 2 vehicles (1,808, accounting for 47.0%) and females with 2 vehicles (1,657, making up 47.2%).
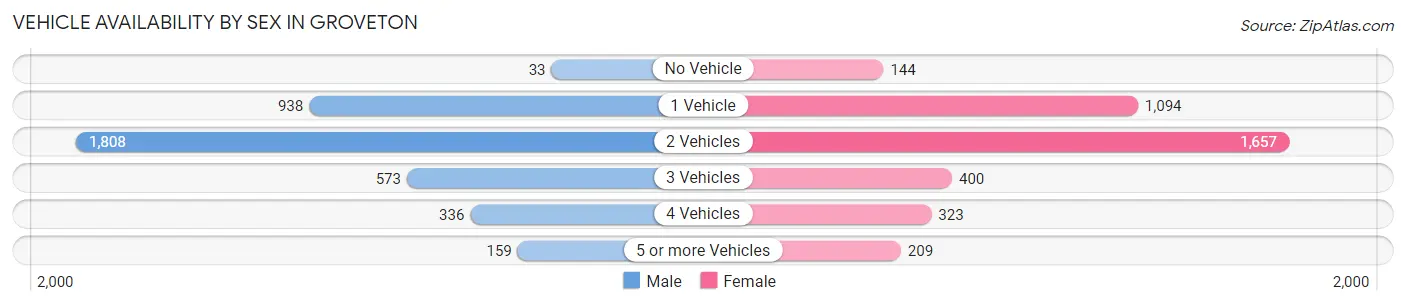
| Vehicles Available | Male | Female |
| No Vehicle | 33 (0.9%) | 144 (3.8%) |
| 1 Vehicle | 938 (24.4%) | 1,094 (28.6%) |
| 2 Vehicles | 1,808 (47.0%) | 1,657 (43.3%) |
| 3 Vehicles | 573 (14.9%) | 400 (10.4%) |
| 4 Vehicles | 336 (8.7%) | 323 (8.4%) |
| 5 or more Vehicles | 159 (4.1%) | 209 (5.5%) |
| Total | 3,847 (100.0%) | 3,827 (100.0%) |
Commute Time in Groveton
The most frequently occuring commute durations in Groveton are 30 to 34 minutes (1,032 commuters, 16.5%), 45 to 59 minutes (910 commuters, 14.6%), and 60 to 89 minutes (736 commuters, 11.8%).
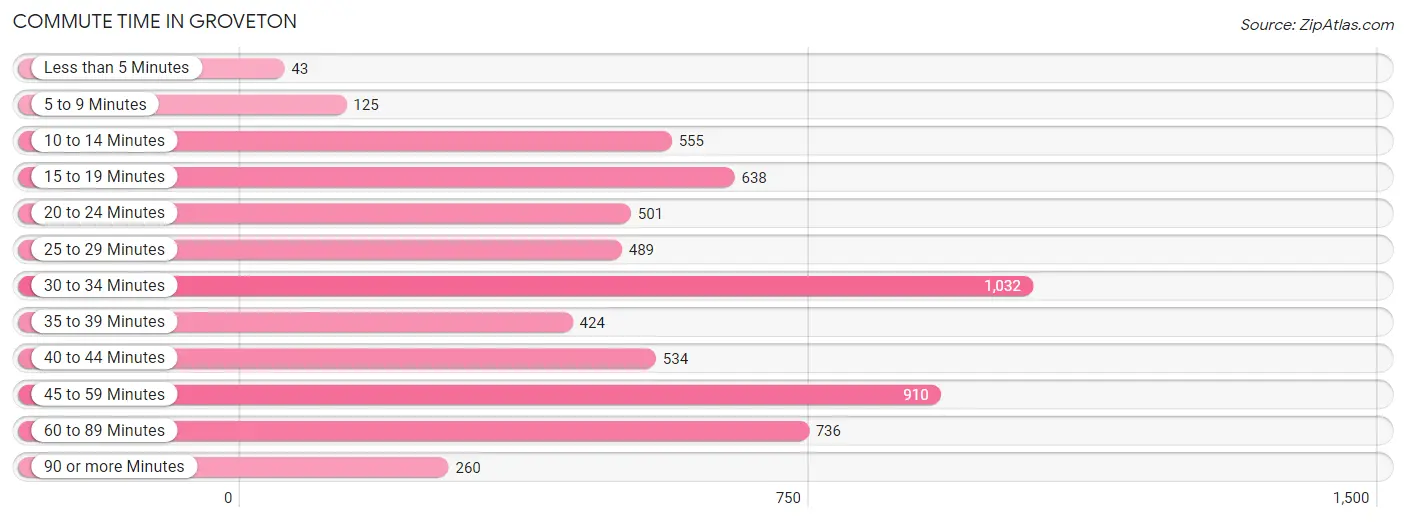
| Commute Time | # Commuters | % Commuters |
| Less than 5 Minutes | 43 | 0.7% |
| 5 to 9 Minutes | 125 | 2.0% |
| 10 to 14 Minutes | 555 | 8.9% |
| 15 to 19 Minutes | 638 | 10.2% |
| 20 to 24 Minutes | 501 | 8.0% |
| 25 to 29 Minutes | 489 | 7.8% |
| 30 to 34 Minutes | 1,032 | 16.5% |
| 35 to 39 Minutes | 424 | 6.8% |
| 40 to 44 Minutes | 534 | 8.6% |
| 45 to 59 Minutes | 910 | 14.6% |
| 60 to 89 Minutes | 736 | 11.8% |
| 90 or more Minutes | 260 | 4.2% |
Commute Time by Sex in Groveton
The most common commute times in Groveton are 30 to 34 minutes (644 commuters, 19.0%) for males and 45 to 59 minutes (435 commuters, 15.2%) for females.
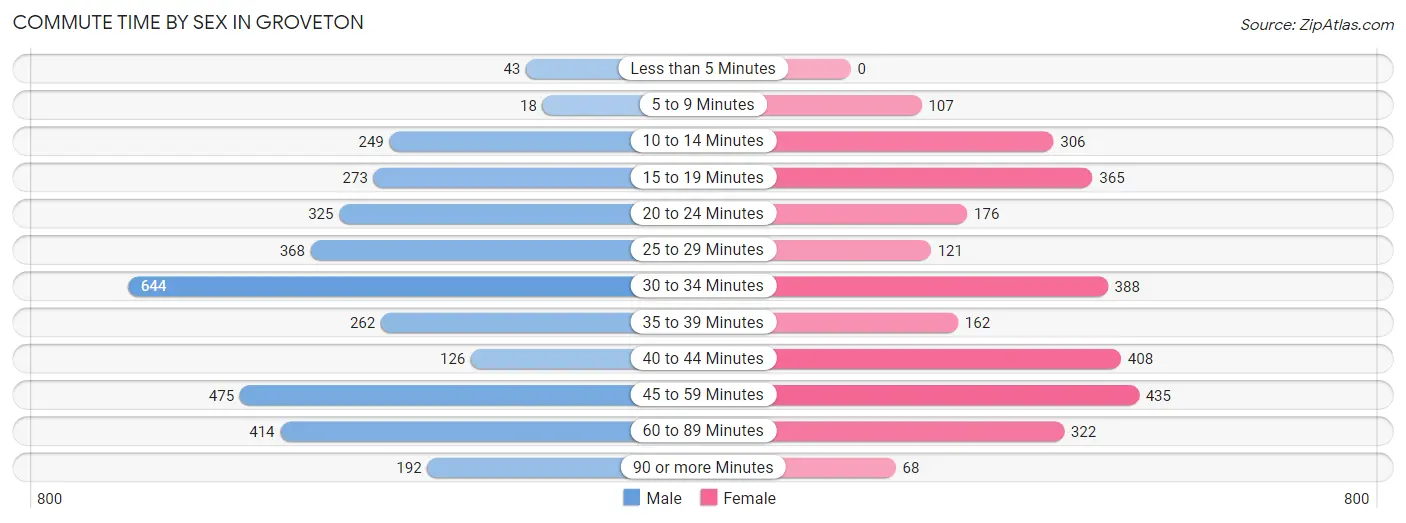
| Commute Time | Male | Female |
| Less than 5 Minutes | 43 (1.3%) | 0 (0.0%) |
| 5 to 9 Minutes | 18 (0.5%) | 107 (3.7%) |
| 10 to 14 Minutes | 249 (7.3%) | 306 (10.7%) |
| 15 to 19 Minutes | 273 (8.1%) | 365 (12.8%) |
| 20 to 24 Minutes | 325 (9.6%) | 176 (6.2%) |
| 25 to 29 Minutes | 368 (10.9%) | 121 (4.2%) |
| 30 to 34 Minutes | 644 (19.0%) | 388 (13.6%) |
| 35 to 39 Minutes | 262 (7.7%) | 162 (5.7%) |
| 40 to 44 Minutes | 126 (3.7%) | 408 (14.3%) |
| 45 to 59 Minutes | 475 (14.0%) | 435 (15.2%) |
| 60 to 89 Minutes | 414 (12.2%) | 322 (11.3%) |
| 90 or more Minutes | 192 (5.7%) | 68 (2.4%) |
Time of Departure to Work by Sex in Groveton
The most frequent times of departure to work in Groveton are 7:00 AM to 7:29 AM (480, 14.2%) for males and 7:00 AM to 7:29 AM (666, 23.3%) for females.
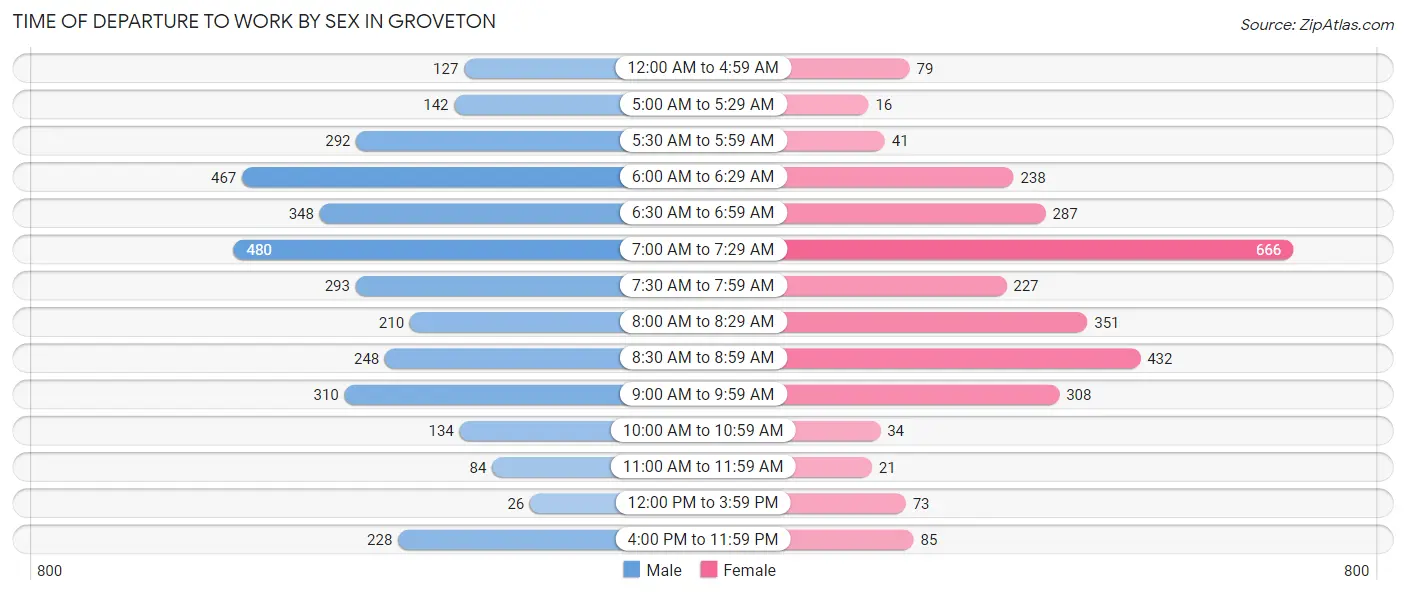
| Time of Departure | Male | Female |
| 12:00 AM to 4:59 AM | 127 (3.7%) | 79 (2.8%) |
| 5:00 AM to 5:29 AM | 142 (4.2%) | 16 (0.6%) |
| 5:30 AM to 5:59 AM | 292 (8.6%) | 41 (1.4%) |
| 6:00 AM to 6:29 AM | 467 (13.8%) | 238 (8.3%) |
| 6:30 AM to 6:59 AM | 348 (10.3%) | 287 (10.0%) |
| 7:00 AM to 7:29 AM | 480 (14.2%) | 666 (23.3%) |
| 7:30 AM to 7:59 AM | 293 (8.6%) | 227 (7.9%) |
| 8:00 AM to 8:29 AM | 210 (6.2%) | 351 (12.3%) |
| 8:30 AM to 8:59 AM | 248 (7.3%) | 432 (15.1%) |
| 9:00 AM to 9:59 AM | 310 (9.1%) | 308 (10.8%) |
| 10:00 AM to 10:59 AM | 134 (4.0%) | 34 (1.2%) |
| 11:00 AM to 11:59 AM | 84 (2.5%) | 21 (0.7%) |
| 12:00 PM to 3:59 PM | 26 (0.8%) | 73 (2.5%) |
| 4:00 PM to 11:59 PM | 228 (6.7%) | 85 (3.0%) |
| Total | 3,389 (100.0%) | 2,858 (100.0%) |
Housing Occupancy in Groveton
Occupancy by Ownership in Groveton
Of the total 5,437 dwellings in Groveton, owner-occupied units account for 3,098 (57.0%), while renter-occupied units make up 2,339 (43.0%).
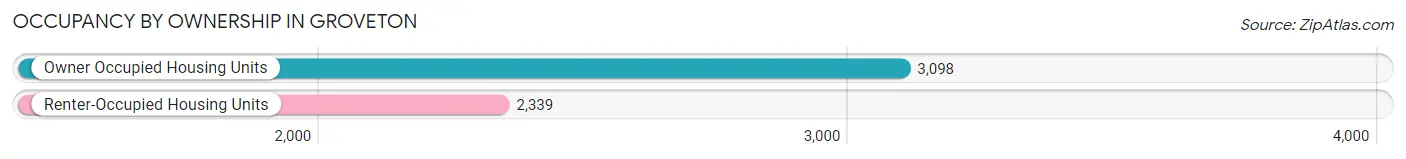
| Occupancy | # Housing Units | % Housing Units |
| Owner Occupied Housing Units | 3,098 | 57.0% |
| Renter-Occupied Housing Units | 2,339 | 43.0% |
| Total Occupied Housing Units | 5,437 | 100.0% |
Occupancy by Household Size in Groveton
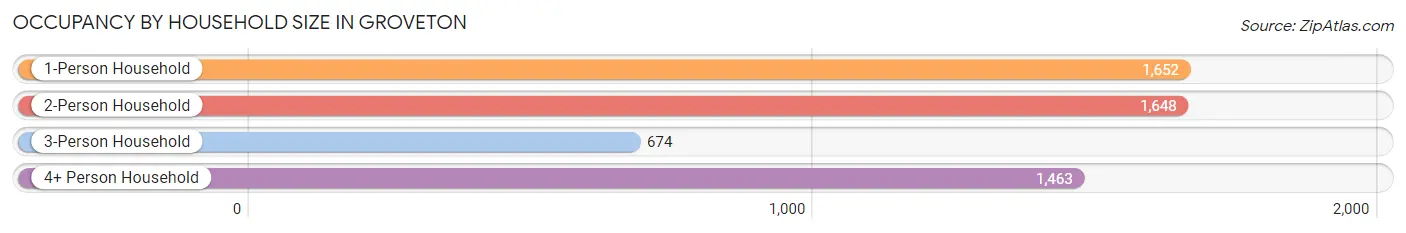
| Household Size | # Housing Units | % Housing Units |
| 1-Person Household | 1,652 | 30.4% |
| 2-Person Household | 1,648 | 30.3% |
| 3-Person Household | 674 | 12.4% |
| 4+ Person Household | 1,463 | 26.9% |
| Total Housing Units | 5,437 | 100.0% |
Occupancy by Ownership by Household Size in Groveton
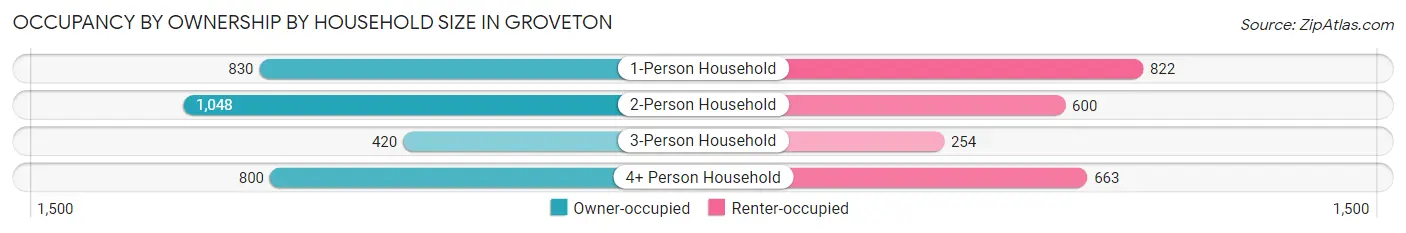
| Household Size | Owner-occupied | Renter-occupied |
| 1-Person Household | 830 (50.2%) | 822 (49.8%) |
| 2-Person Household | 1,048 (63.6%) | 600 (36.4%) |
| 3-Person Household | 420 (62.3%) | 254 (37.7%) |
| 4+ Person Household | 800 (54.7%) | 663 (45.3%) |
| Total Housing Units | 3,098 (57.0%) | 2,339 (43.0%) |
Occupancy by Educational Attainment in Groveton
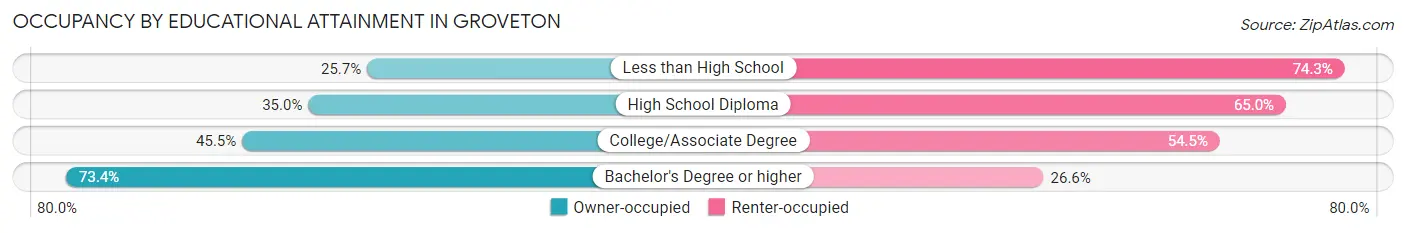
| Household Size | Owner-occupied | Renter-occupied |
| Less than High School | 121 (25.7%) | 350 (74.3%) |
| High School Diploma | 271 (35.0%) | 503 (65.0%) |
| College/Associate Degree | 607 (45.5%) | 727 (54.5%) |
| Bachelor's Degree or higher | 2,099 (73.4%) | 759 (26.6%) |
Occupancy by Age of Householder in Groveton
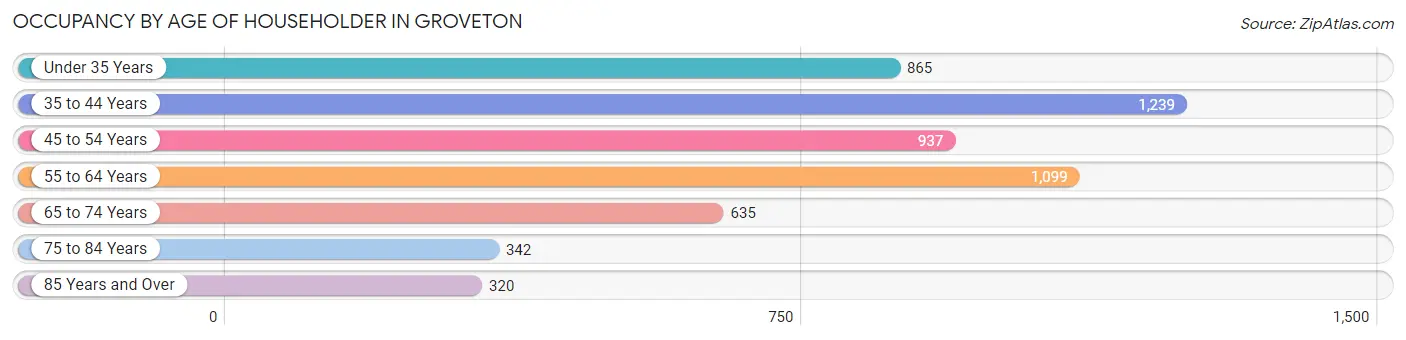
| Age Bracket | # Households | % Households |
| Under 35 Years | 865 | 15.9% |
| 35 to 44 Years | 1,239 | 22.8% |
| 45 to 54 Years | 937 | 17.2% |
| 55 to 64 Years | 1,099 | 20.2% |
| 65 to 74 Years | 635 | 11.7% |
| 75 to 84 Years | 342 | 6.3% |
| 85 Years and Over | 320 | 5.9% |
| Total | 5,437 | 100.0% |
Housing Finances in Groveton
Median Income by Occupancy in Groveton
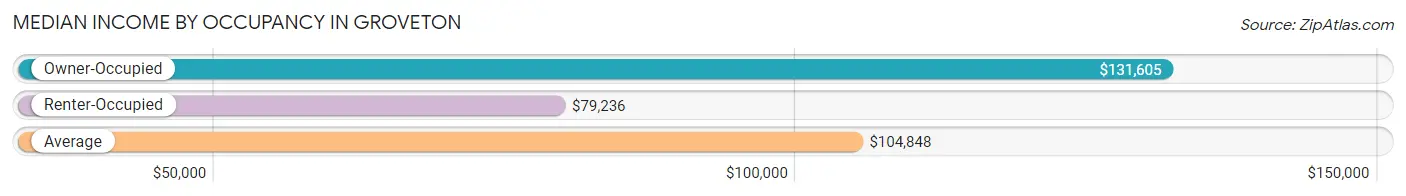
| Occupancy Type | # Households | Median Income |
| Owner-Occupied | 3,098 (57.0%) | $131,605 |
| Renter-Occupied | 2,339 (43.0%) | $79,236 |
| Average | 5,437 (100.0%) | $104,848 |
Occupancy by Householder Income Bracket in Groveton
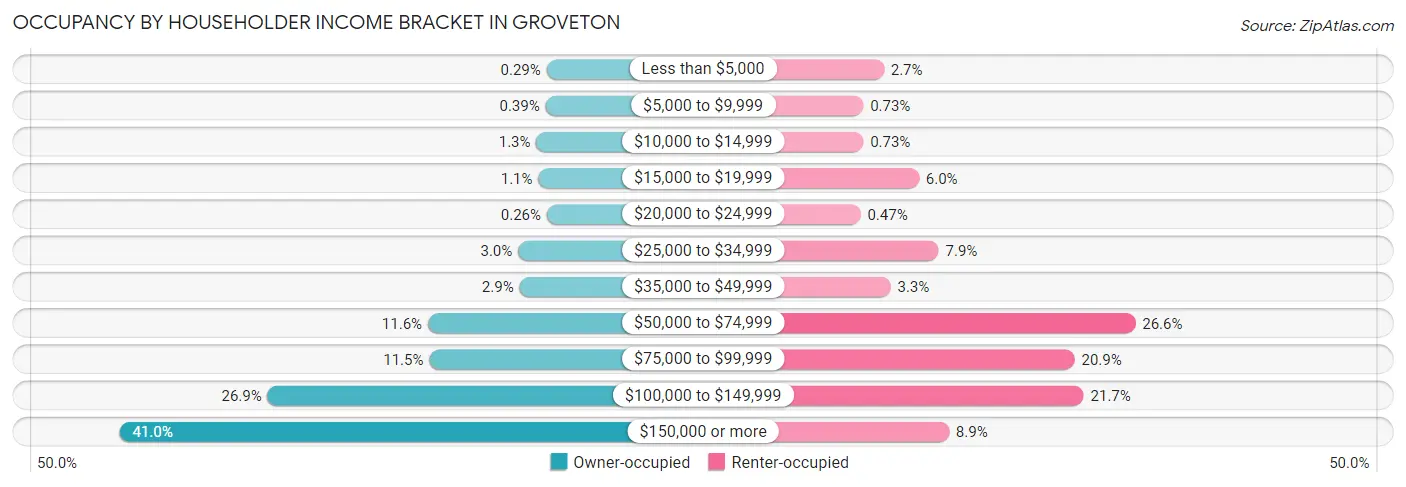
| Income Bracket | Owner-occupied | Renter-occupied |
| Less than $5,000 | 9 (0.3%) | 63 (2.7%) |
| $5,000 to $9,999 | 12 (0.4%) | 17 (0.7%) |
| $10,000 to $14,999 | 39 (1.3%) | 17 (0.7%) |
| $15,000 to $19,999 | 33 (1.1%) | 141 (6.0%) |
| $20,000 to $24,999 | 8 (0.3%) | 11 (0.5%) |
| $25,000 to $34,999 | 93 (3.0%) | 185 (7.9%) |
| $35,000 to $49,999 | 89 (2.9%) | 78 (3.3%) |
| $50,000 to $74,999 | 359 (11.6%) | 623 (26.6%) |
| $75,000 to $99,999 | 355 (11.5%) | 488 (20.9%) |
| $100,000 to $149,999 | 832 (26.9%) | 508 (21.7%) |
| $150,000 or more | 1,269 (41.0%) | 208 (8.9%) |
| Total | 3,098 (100.0%) | 2,339 (100.0%) |
Monthly Housing Cost Tiers in Groveton
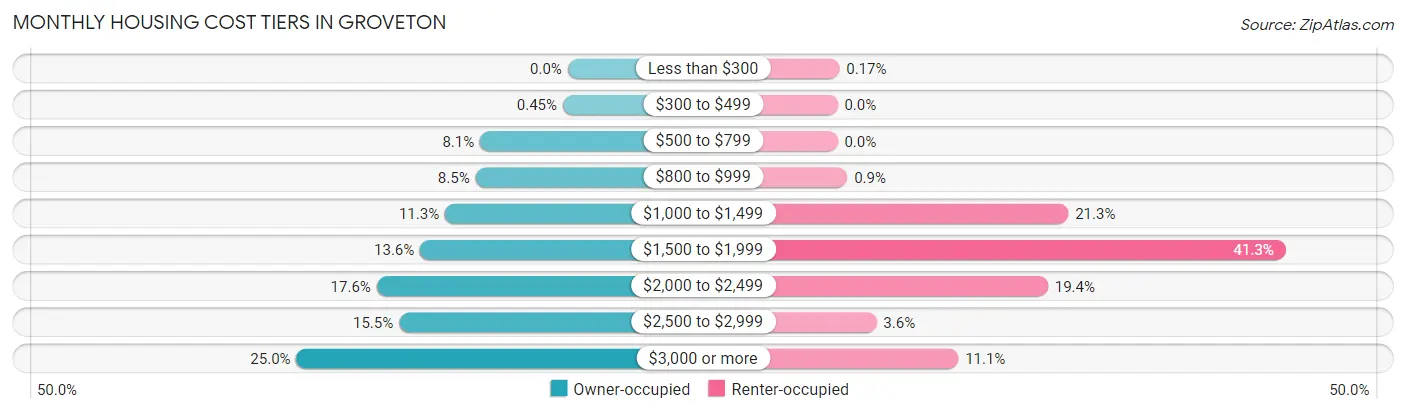
| Monthly Cost | Owner-occupied | Renter-occupied |
| Less than $300 | 0 (0.0%) | 4 (0.2%) |
| $300 to $499 | 14 (0.4%) | 0 (0.0%) |
| $500 to $799 | 250 (8.1%) | 0 (0.0%) |
| $800 to $999 | 263 (8.5%) | 21 (0.9%) |
| $1,000 to $1,499 | 350 (11.3%) | 497 (21.2%) |
| $1,500 to $1,999 | 421 (13.6%) | 965 (41.3%) |
| $2,000 to $2,499 | 545 (17.6%) | 453 (19.4%) |
| $2,500 to $2,999 | 481 (15.5%) | 84 (3.6%) |
| $3,000 or more | 774 (25.0%) | 260 (11.1%) |
| Total | 3,098 (100.0%) | 2,339 (100.0%) |
Physical Housing Characteristics in Groveton
Housing Structures in Groveton
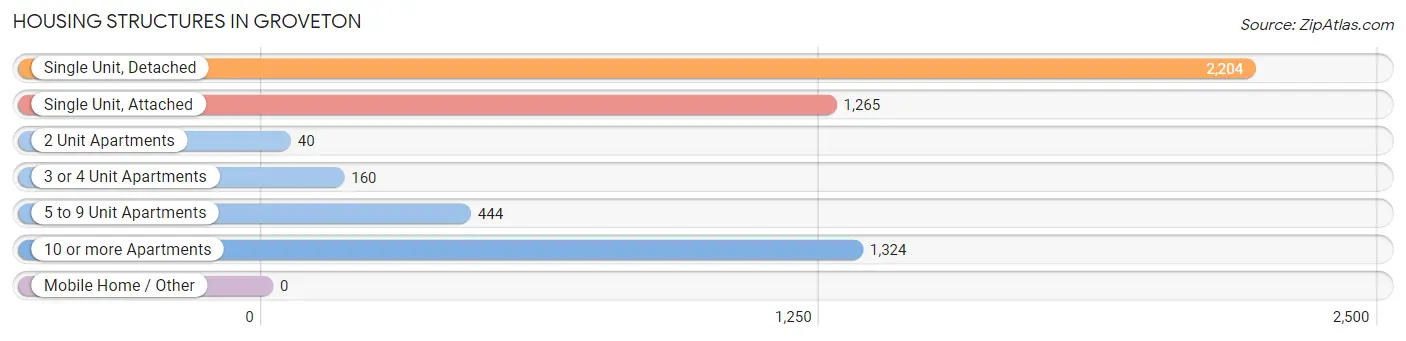
| Structure Type | # Housing Units | % Housing Units |
| Single Unit, Detached | 2,204 | 40.5% |
| Single Unit, Attached | 1,265 | 23.3% |
| 2 Unit Apartments | 40 | 0.7% |
| 3 or 4 Unit Apartments | 160 | 2.9% |
| 5 to 9 Unit Apartments | 444 | 8.2% |
| 10 or more Apartments | 1,324 | 24.3% |
| Mobile Home / Other | 0 | 0.0% |
| Total | 5,437 | 100.0% |
Housing Structures by Occupancy in Groveton
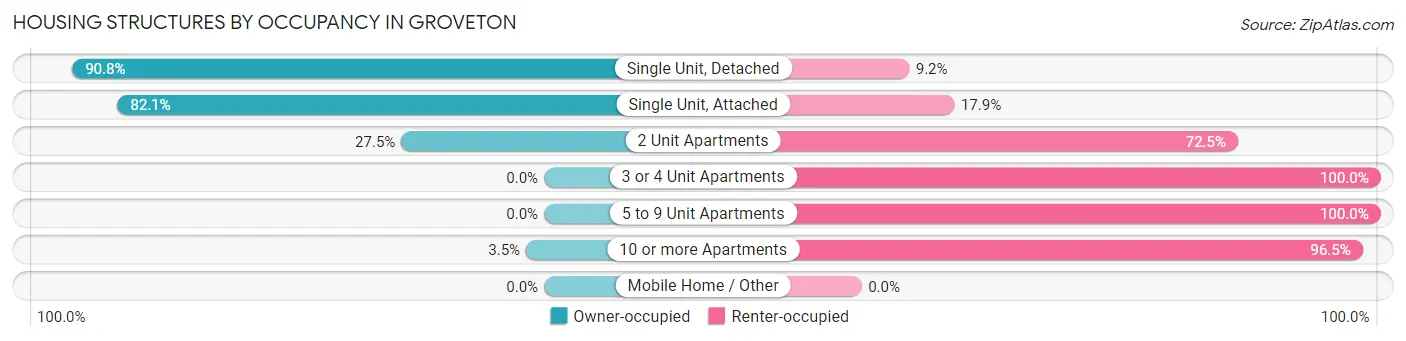
| Structure Type | Owner-occupied | Renter-occupied |
| Single Unit, Detached | 2,002 (90.8%) | 202 (9.2%) |
| Single Unit, Attached | 1,039 (82.1%) | 226 (17.9%) |
| 2 Unit Apartments | 11 (27.5%) | 29 (72.5%) |
| 3 or 4 Unit Apartments | 0 (0.0%) | 160 (100.0%) |
| 5 to 9 Unit Apartments | 0 (0.0%) | 444 (100.0%) |
| 10 or more Apartments | 46 (3.5%) | 1,278 (96.5%) |
| Mobile Home / Other | 0 (0.0%) | 0 (0.0%) |
| Total | 3,098 (57.0%) | 2,339 (43.0%) |
Housing Structures by Number of Rooms in Groveton
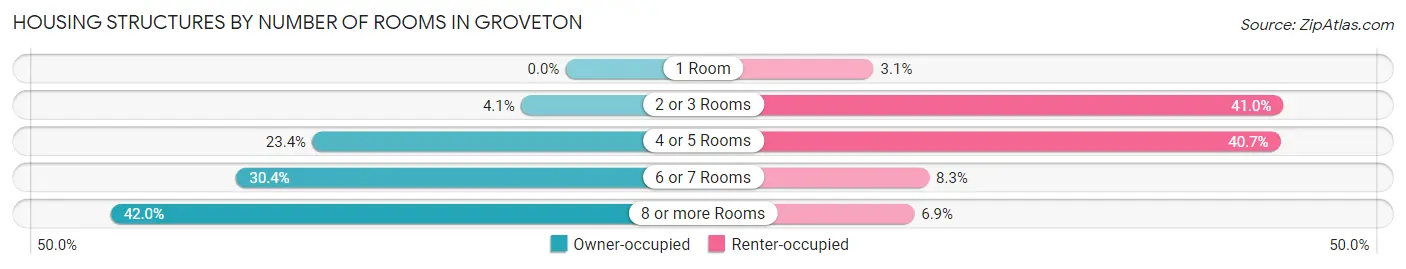
| Number of Rooms | Owner-occupied | Renter-occupied |
| 1 Room | 0 (0.0%) | 73 (3.1%) |
| 2 or 3 Rooms | 128 (4.1%) | 959 (41.0%) |
| 4 or 5 Rooms | 726 (23.4%) | 953 (40.7%) |
| 6 or 7 Rooms | 942 (30.4%) | 193 (8.3%) |
| 8 or more Rooms | 1,302 (42.0%) | 161 (6.9%) |
| Total | 3,098 (100.0%) | 2,339 (100.0%) |
Housing Structure by Heating Type in Groveton
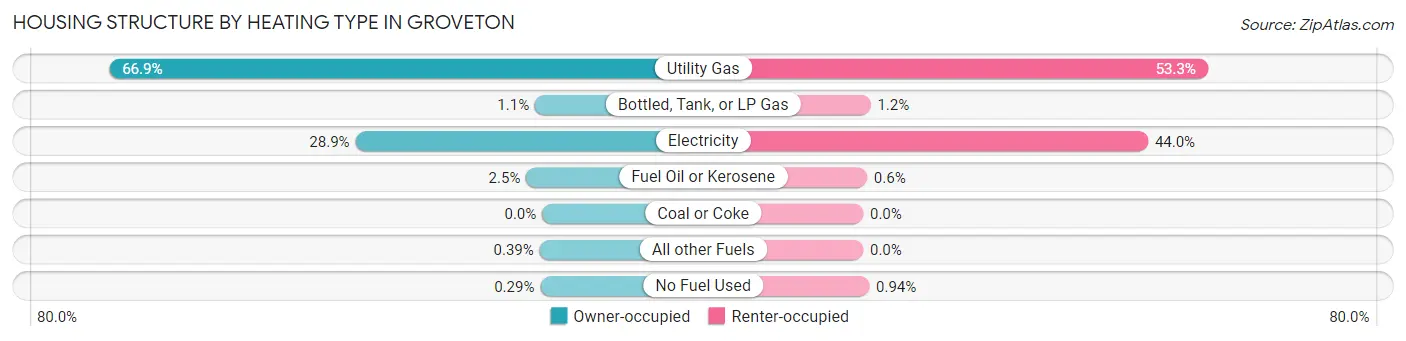
| Heating Type | Owner-occupied | Renter-occupied |
| Utility Gas | 2,073 (66.9%) | 1,246 (53.3%) |
| Bottled, Tank, or LP Gas | 34 (1.1%) | 27 (1.1%) |
| Electricity | 894 (28.9%) | 1,030 (44.0%) |
| Fuel Oil or Kerosene | 76 (2.5%) | 14 (0.6%) |
| Coal or Coke | 0 (0.0%) | 0 (0.0%) |
| All other Fuels | 12 (0.4%) | 0 (0.0%) |
| No Fuel Used | 9 (0.3%) | 22 (0.9%) |
| Total | 3,098 (100.0%) | 2,339 (100.0%) |
Household Vehicle Usage in Groveton
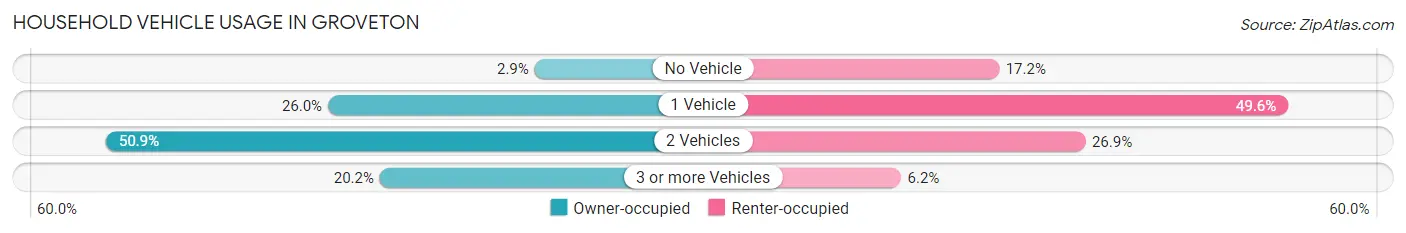
| Vehicles per Household | Owner-occupied | Renter-occupied |
| No Vehicle | 89 (2.9%) | 403 (17.2%) |
| 1 Vehicle | 806 (26.0%) | 1,161 (49.6%) |
| 2 Vehicles | 1,577 (50.9%) | 629 (26.9%) |
| 3 or more Vehicles | 626 (20.2%) | 146 (6.2%) |
| Total | 3,098 (100.0%) | 2,339 (100.0%) |
Real Estate & Mortgages in Groveton
Real Estate and Mortgage Overview in Groveton
| Characteristic | Without Mortgage | With Mortgage |
| Housing Units | 671 | 2,427 |
| Median Property Value | $586,400 | $512,700 |
| Median Household Income | $121,473 | $1,054 |
| Monthly Housing Costs | $888 | $774 |
| Real Estate Taxes | $5,996 | $42 |
Property Value by Mortgage Status in Groveton
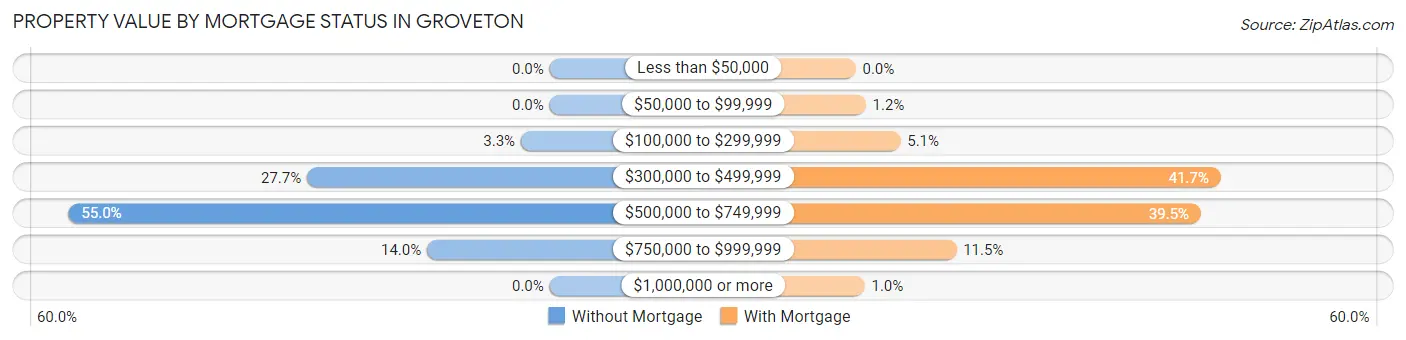
| Property Value | Without Mortgage | With Mortgage |
| Less than $50,000 | 0 (0.0%) | 0 (0.0%) |
| $50,000 to $99,999 | 0 (0.0%) | 28 (1.1%) |
| $100,000 to $299,999 | 22 (3.3%) | 124 (5.1%) |
| $300,000 to $499,999 | 186 (27.7%) | 1,013 (41.7%) |
| $500,000 to $749,999 | 369 (55.0%) | 958 (39.5%) |
| $750,000 to $999,999 | 94 (14.0%) | 279 (11.5%) |
| $1,000,000 or more | 0 (0.0%) | 25 (1.0%) |
| Total | 671 (100.0%) | 2,427 (100.0%) |
Household Income by Mortgage Status in Groveton
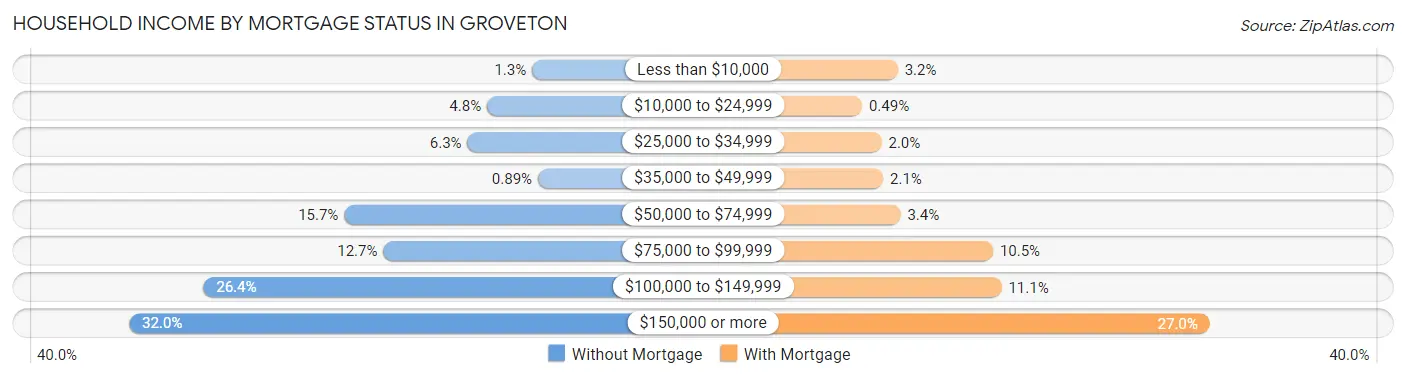
| Household Income | Without Mortgage | With Mortgage |
| Less than $10,000 | 9 (1.3%) | 78 (3.2%) |
| $10,000 to $24,999 | 32 (4.8%) | 12 (0.5%) |
| $25,000 to $34,999 | 42 (6.3%) | 48 (2.0%) |
| $35,000 to $49,999 | 6 (0.9%) | 51 (2.1%) |
| $50,000 to $74,999 | 105 (15.7%) | 83 (3.4%) |
| $75,000 to $99,999 | 85 (12.7%) | 254 (10.5%) |
| $100,000 to $149,999 | 177 (26.4%) | 270 (11.1%) |
| $150,000 or more | 215 (32.0%) | 655 (27.0%) |
| Total | 671 (100.0%) | 2,427 (100.0%) |
Property Value to Household Income Ratio in Groveton
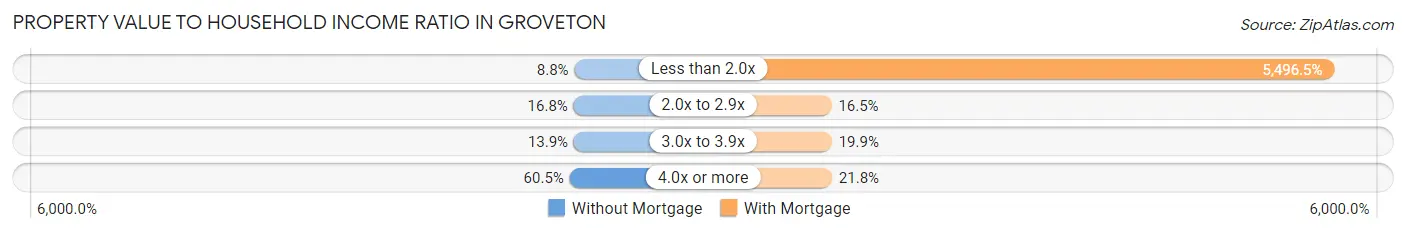
| Value-to-Income Ratio | Without Mortgage | With Mortgage |
| Less than 2.0x | 59 (8.8%) | 133,401 (5,496.5%) |
| 2.0x to 2.9x | 113 (16.8%) | 400 (16.5%) |
| 3.0x to 3.9x | 93 (13.9%) | 483 (19.9%) |
| 4.0x or more | 406 (60.5%) | 530 (21.8%) |
| Total | 671 (100.0%) | 2,427 (100.0%) |
Real Estate Taxes by Mortgage Status in Groveton
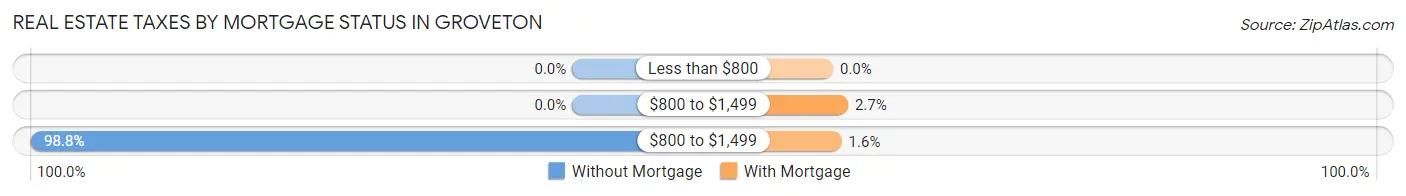
| Property Taxes | Without Mortgage | With Mortgage |
| Less than $800 | 0 (0.0%) | 0 (0.0%) |
| $800 to $1,499 | 0 (0.0%) | 66 (2.7%) |
| $800 to $1,499 | 663 (98.8%) | 38 (1.6%) |
| Total | 671 (100.0%) | 2,427 (100.0%) |
Health & Disability in Groveton
Health Insurance Coverage by Age in Groveton
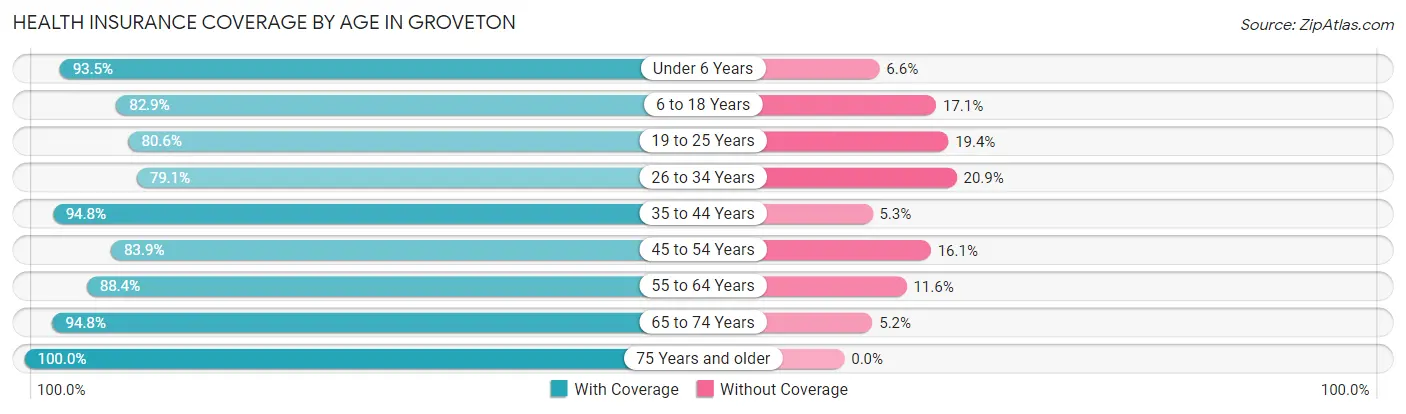
| Age Bracket | With Coverage | Without Coverage |
| Under 6 Years | 1,055 (93.4%) | 74 (6.6%) |
| 6 to 18 Years | 1,831 (82.9%) | 378 (17.1%) |
| 19 to 25 Years | 1,169 (80.6%) | 281 (19.4%) |
| 26 to 34 Years | 1,485 (79.1%) | 393 (20.9%) |
| 35 to 44 Years | 1,896 (94.8%) | 105 (5.2%) |
| 45 to 54 Years | 1,540 (83.9%) | 296 (16.1%) |
| 55 to 64 Years | 1,653 (88.4%) | 217 (11.6%) |
| 65 to 74 Years | 980 (94.8%) | 54 (5.2%) |
| 75 Years and older | 830 (100.0%) | 0 (0.0%) |
| Total | 12,439 (87.4%) | 1,798 (12.6%) |
Health Insurance Coverage by Citizenship Status in Groveton
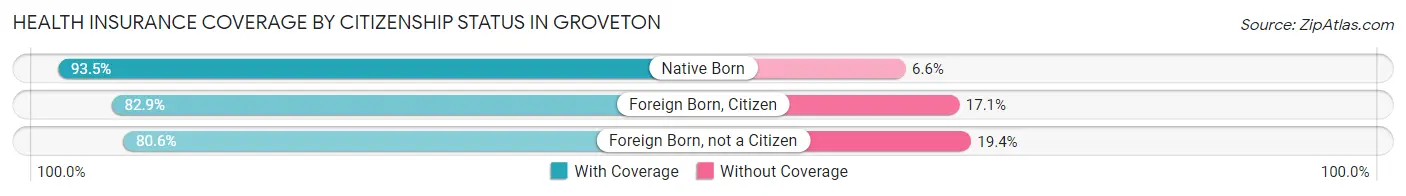
| Citizenship Status | With Coverage | Without Coverage |
| Native Born | 1,055 (93.4%) | 74 (6.6%) |
| Foreign Born, Citizen | 1,831 (82.9%) | 378 (17.1%) |
| Foreign Born, not a Citizen | 1,169 (80.6%) | 281 (19.4%) |
Health Insurance Coverage by Household Income in Groveton
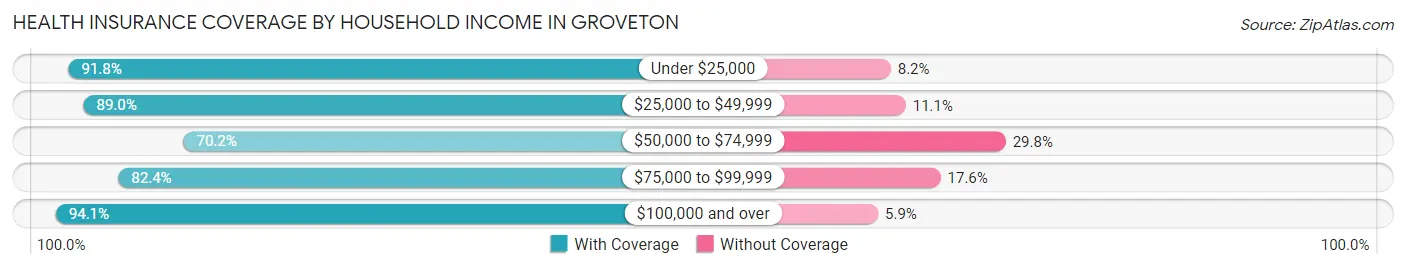
| Household Income | With Coverage | Without Coverage |
| Under $25,000 | 590 (91.8%) | 53 (8.2%) |
| $25,000 to $49,999 | 902 (88.9%) | 112 (11.1%) |
| $50,000 to $74,999 | 1,853 (70.2%) | 786 (29.8%) |
| $75,000 to $99,999 | 1,767 (82.4%) | 377 (17.6%) |
| $100,000 and over | 7,245 (94.1%) | 451 (5.9%) |
Public vs Private Health Insurance Coverage by Age in Groveton
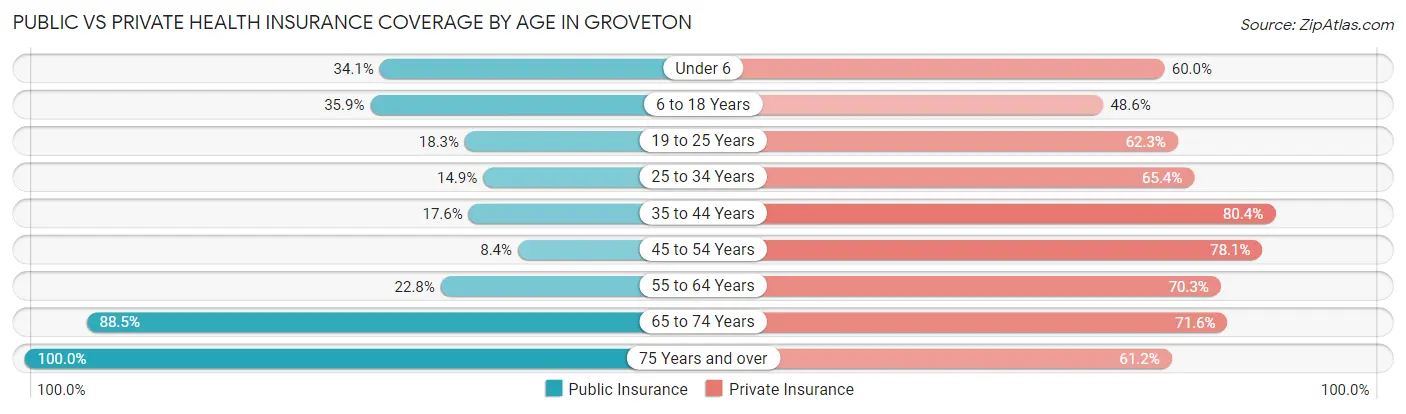
| Age Bracket | Public Insurance | Private Insurance |
| Under 6 | 385 (34.1%) | 677 (60.0%) |
| 6 to 18 Years | 792 (35.8%) | 1,073 (48.6%) |
| 19 to 25 Years | 265 (18.3%) | 904 (62.3%) |
| 25 to 34 Years | 280 (14.9%) | 1,228 (65.4%) |
| 35 to 44 Years | 352 (17.6%) | 1,609 (80.4%) |
| 45 to 54 Years | 155 (8.4%) | 1,433 (78.0%) |
| 55 to 64 Years | 426 (22.8%) | 1,315 (70.3%) |
| 65 to 74 Years | 915 (88.5%) | 740 (71.6%) |
| 75 Years and over | 830 (100.0%) | 508 (61.2%) |
| Total | 4,400 (30.9%) | 9,487 (66.6%) |
Disability Status by Sex by Age in Groveton
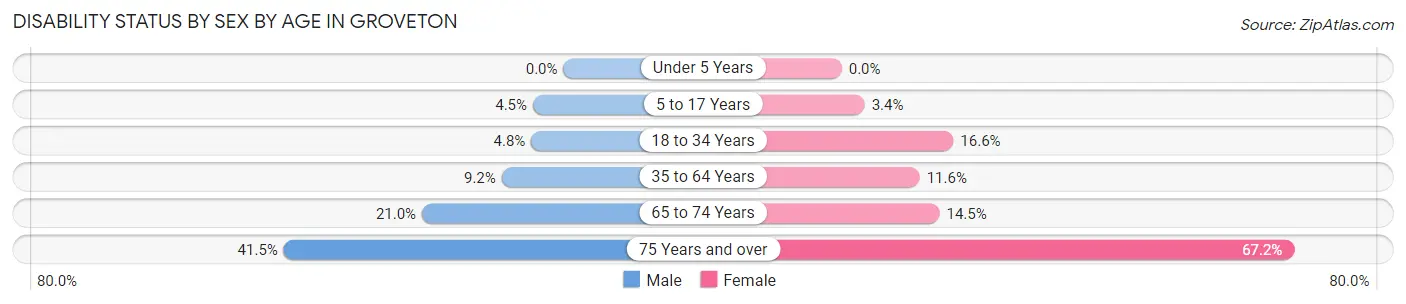
| Age Bracket | Male | Female |
| Under 5 Years | 0 (0.0%) | 0 (0.0%) |
| 5 to 17 Years | 52 (4.5%) | 39 (3.4%) |
| 18 to 34 Years | 76 (4.8%) | 299 (16.6%) |
| 35 to 64 Years | 239 (9.2%) | 359 (11.6%) |
| 65 to 74 Years | 113 (21.0%) | 72 (14.5%) |
| 75 Years and over | 98 (41.5%) | 399 (67.2%) |
Disability Class by Sex by Age in Groveton
Disability Class: Hearing Difficulty
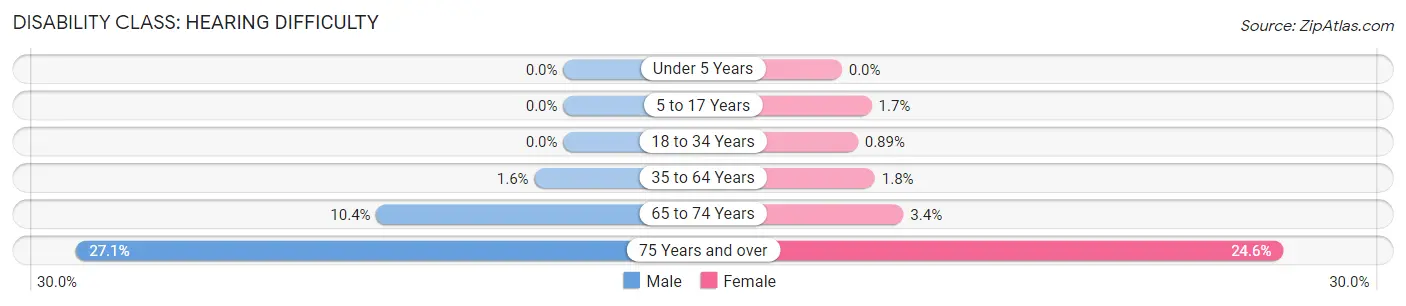
| Age Bracket | Male | Female |
| Under 5 Years | 0 (0.0%) | 0 (0.0%) |
| 5 to 17 Years | 0 (0.0%) | 19 (1.7%) |
| 18 to 34 Years | 0 (0.0%) | 16 (0.9%) |
| 35 to 64 Years | 42 (1.6%) | 57 (1.8%) |
| 65 to 74 Years | 56 (10.4%) | 17 (3.4%) |
| 75 Years and over | 64 (27.1%) | 146 (24.6%) |
Disability Class: Vision Difficulty
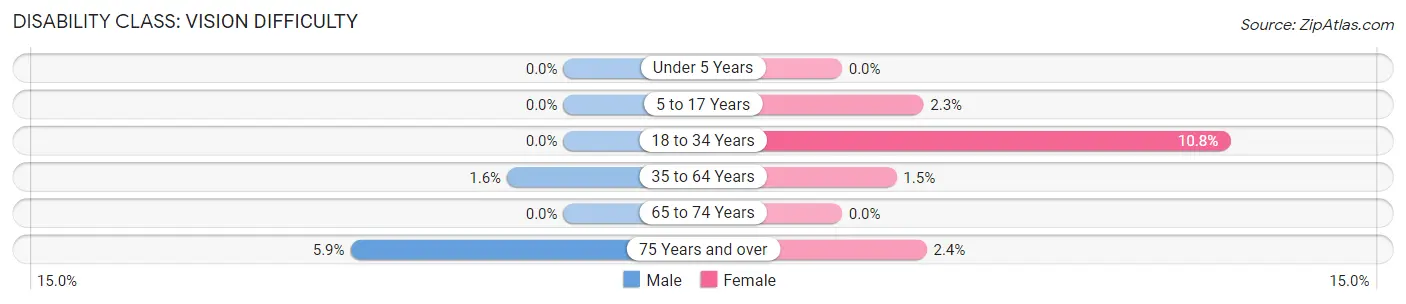
| Age Bracket | Male | Female |
| Under 5 Years | 0 (0.0%) | 0 (0.0%) |
| 5 to 17 Years | 0 (0.0%) | 26 (2.3%) |
| 18 to 34 Years | 0 (0.0%) | 195 (10.8%) |
| 35 to 64 Years | 41 (1.6%) | 47 (1.5%) |
| 65 to 74 Years | 0 (0.0%) | 0 (0.0%) |
| 75 Years and over | 14 (5.9%) | 14 (2.4%) |
Disability Class: Cognitive Difficulty
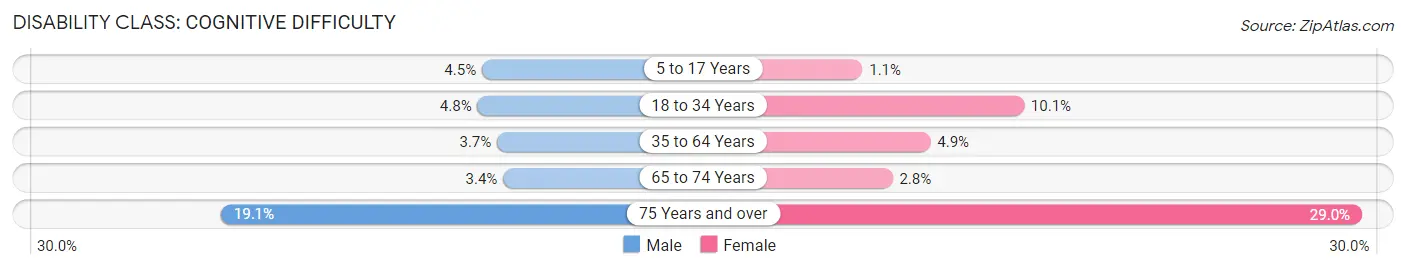
| Age Bracket | Male | Female |
| 5 to 17 Years | 52 (4.5%) | 13 (1.1%) |
| 18 to 34 Years | 76 (4.8%) | 183 (10.1%) |
| 35 to 64 Years | 96 (3.7%) | 153 (4.9%) |
| 65 to 74 Years | 18 (3.4%) | 14 (2.8%) |
| 75 Years and over | 45 (19.1%) | 172 (29.0%) |
Disability Class: Ambulatory Difficulty
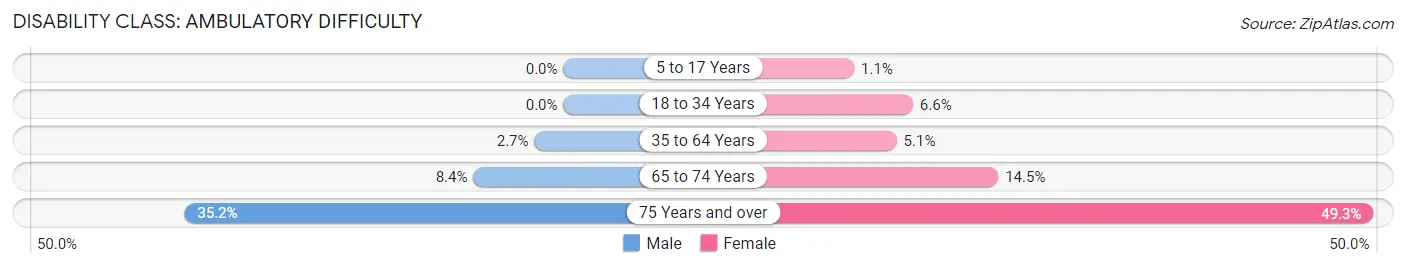
| Age Bracket | Male | Female |
| 5 to 17 Years | 0 (0.0%) | 13 (1.1%) |
| 18 to 34 Years | 0 (0.0%) | 119 (6.6%) |
| 35 to 64 Years | 70 (2.7%) | 158 (5.1%) |
| 65 to 74 Years | 45 (8.4%) | 72 (14.5%) |
| 75 Years and over | 83 (35.2%) | 293 (49.3%) |
Disability Class: Self-Care Difficulty
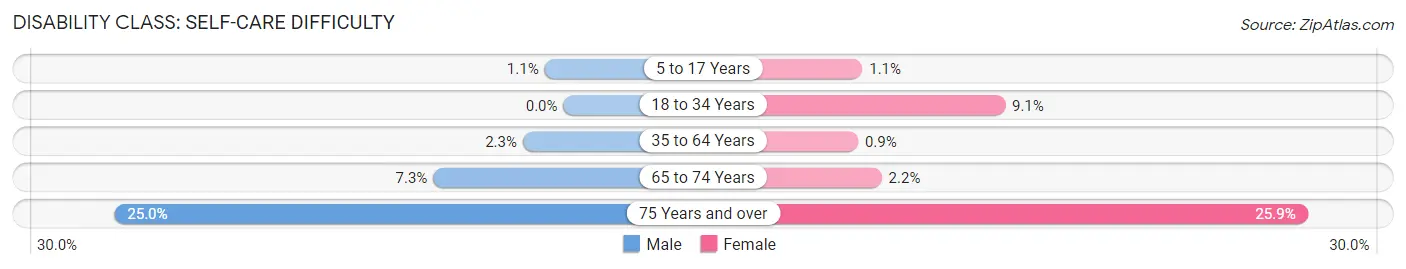
| Age Bracket | Male | Female |
| 5 to 17 Years | 12 (1.1%) | 13 (1.1%) |
| 18 to 34 Years | 0 (0.0%) | 164 (9.1%) |
| 35 to 64 Years | 59 (2.3%) | 28 (0.9%) |
| 65 to 74 Years | 39 (7.2%) | 11 (2.2%) |
| 75 Years and over | 59 (25.0%) | 154 (25.9%) |
Technology Access in Groveton
Computing Device Access in Groveton
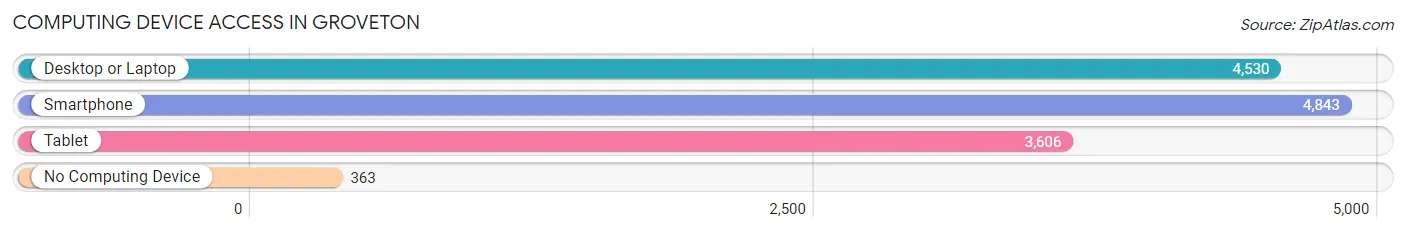
| Device Type | # Households | % Households |
| Desktop or Laptop | 4,530 | 83.3% |
| Smartphone | 4,843 | 89.1% |
| Tablet | 3,606 | 66.3% |
| No Computing Device | 363 | 6.7% |
| Total | 5,437 | 100.0% |
Internet Access in Groveton
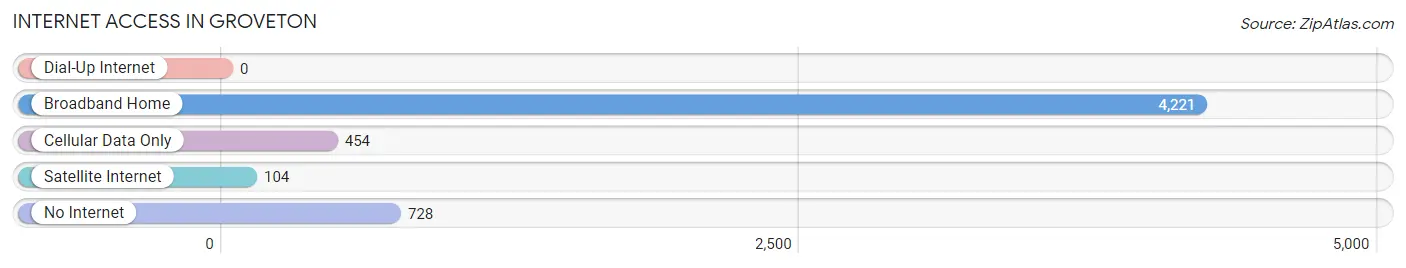
| Internet Type | # Households | % Households |
| Dial-Up Internet | 0 | 0.0% |
| Broadband Home | 4,221 | 77.6% |
| Cellular Data Only | 454 | 8.4% |
| Satellite Internet | 104 | 1.9% |
| No Internet | 728 | 13.4% |
| Total | 5,437 | 100.0% |
Groveton Summary
Groveton is a small unincorporated community located in Fairfax County, Virginia. It is situated on the banks of the Potomac River, just south of the city of Alexandria. The community is part of the Washington Metropolitan Area and is located approximately 15 miles south of Washington, D.C.
History
The area that is now known as Groveton was first settled in the early 1700s by English colonists. The area was originally known as “Grove Town” and was part of the Fairfax County plantation system. The area was home to a number of prominent families, including the Fairfaxes, the Lees, and the Washingtons.
In the late 1800s, the area began to develop as a residential community. The first post office was established in 1891 and the community was officially incorporated in 1895. The town was named after the grove of trees that surrounded the area.
In the early 1900s, the area began to experience rapid growth. The population increased from just over 500 in 1900 to over 1,000 by 1910. The town was home to a number of businesses, including a general store, a blacksmith shop, and a gristmill.
In the 1920s, the town experienced a period of decline. The population decreased to just over 500 by 1930. The decline was due in part to the Great Depression and the increasing popularity of automobiles, which allowed people to move away from the area.
In the 1950s, the area began to experience a period of revitalization. The population increased to over 1,000 by 1960. The town was home to a number of businesses, including a grocery store, a hardware store, and a gas station.
Geography
Groveton is located in Fairfax County, Virginia. It is situated on the banks of the Potomac River, just south of the city of Alexandria. The community is part of the Washington Metropolitan Area and is located approximately 15 miles south of Washington, D.C.
The area is characterized by rolling hills and wooded areas. The climate is temperate, with hot summers and cold winters. The average annual temperature is around 55 degrees Fahrenheit.
Economy
The economy of Groveton is largely based on the service industry. The town is home to a number of businesses, including restaurants, retail stores, and professional services. The town is also home to a number of government offices, including the Fairfax County Police Department and the Fairfax County Fire and Rescue Department.
The town is also home to a number of educational institutions, including Groveton Elementary School, Groveton High School, and the Groveton Technical Institute.
Demographics
As of the 2010 census, the population of Groveton was 1,845. The racial makeup of the town was 79.3% White, 11.2% African American, 0.3% Native American, 4.2% Asian, 0.1% Pacific Islander, and 4.9% from other races. The median household income was $76,944.
Conclusion
Groveton is a small unincorporated community located in Fairfax County, Virginia. It is situated on the banks of the Potomac River, just south of the city of Alexandria. The community is part of the Washington Metropolitan Area and is located approximately 15 miles south of Washington, D.C. The area was first settled in the early 1700s and has since experienced periods of growth and decline. The economy of Groveton is largely based on the service industry and the town is home to a number of businesses, government offices, and educational institutions. As of the 2010 census, the population of Groveton was 1,845. The racial makeup of the town was 79.3% White, 11.2% African American, 0.3% Native American, 4.2% Asian, 0.1% Pacific Islander, and 4.9% from other races. The median household income was $76,944.
Common Questions
What is Per Capita Income in Groveton?
Per Capita income in Groveton is $48,413.
What is the Median Family Income in Groveton?
Median Family Income in Groveton is $105,719.
What is the Median Household income in Groveton?
Median Household Income in Groveton is $104,848.
What is Income or Wage Gap in Groveton?
Income or Wage Gap in Groveton is 22.2%.
Women in Groveton earn 77.8 cents for every dollar earned by a man.
What is Family Income Deficit in Groveton?
Family Income Deficit in Groveton is $9,118.
Families that are below poverty line in Groveton earn $9,118 less on average than the poverty threshold level.
What is Inequality or Gini Index in Groveton?
Inequality or Gini Index in Groveton is 0.38.
What is the Total Population of Groveton?
Total Population of Groveton is 14,619.
What is the Total Male Population of Groveton?
Total Male Population of Groveton is 6,993.
What is the Total Female Population of Groveton?
Total Female Population of Groveton is 7,626.
What is the Ratio of Males per 100 Females in Groveton?
There are 91.70 Males per 100 Females in Groveton.
What is the Ratio of Females per 100 Males in Groveton?
There are 109.05 Females per 100 Males in Groveton.
What is the Median Population Age in Groveton?
Median Population Age in Groveton is 37.4 Years.
What is the Average Family Size in Groveton
Average Family Size in Groveton is 3.4 People.
What is the Average Household Size in Groveton
Average Household Size in Groveton is 2.7 People.
How Large is the Labor Force in Groveton?
There are 8,403 People in the Labor Forcein in Groveton.
What is the Percentage of People in the Labor Force in Groveton?
71.2% of People are in the Labor Force in Groveton.
What is the Unemployment Rate in Groveton?
Unemployment Rate in Groveton is 7.4%.