Glen Allen, VA Map & Demographics
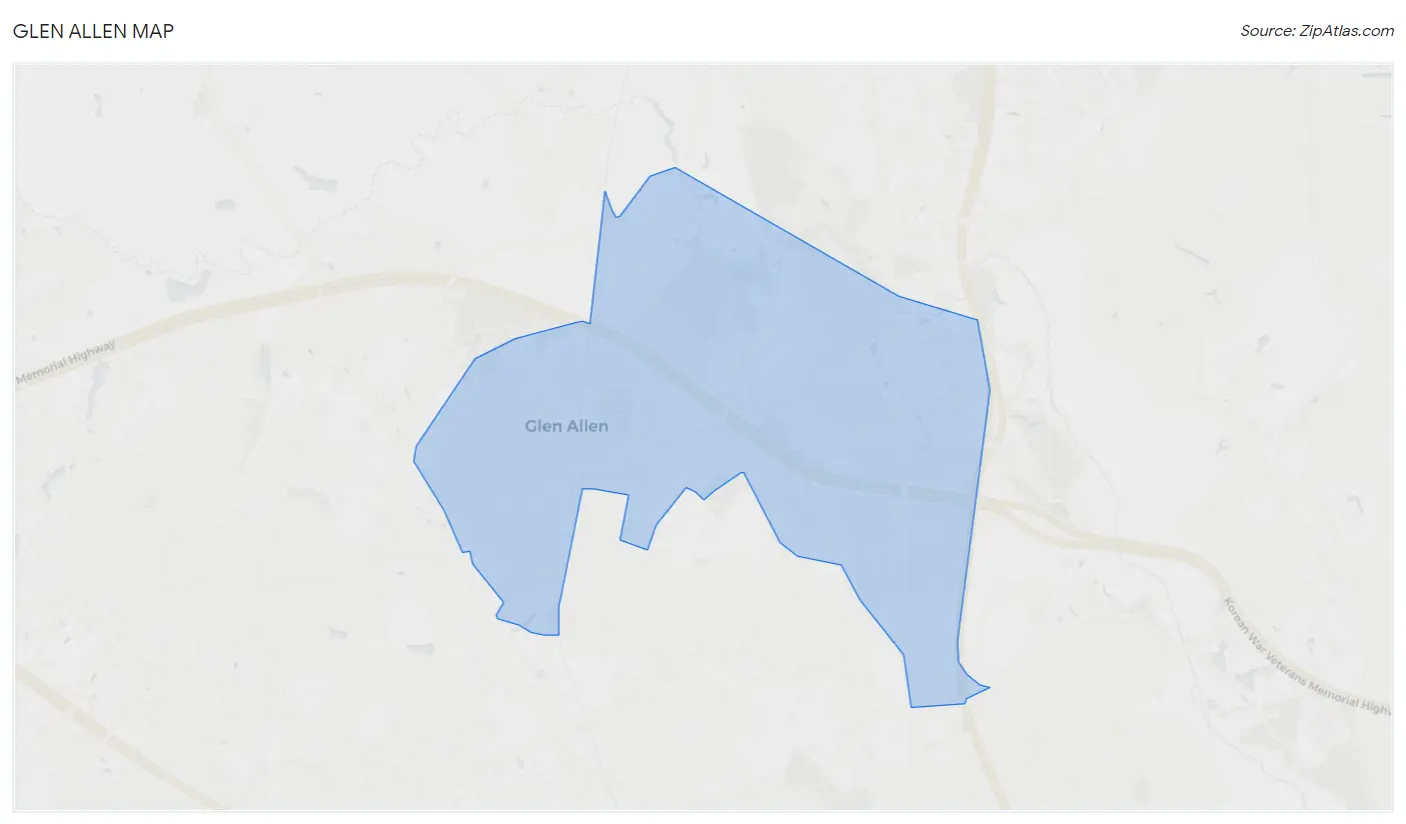
Glen Allen Map
Glen Allen Overview
$41,304
PER CAPITA INCOME
$106,196
AVG FAMILY INCOME
$88,206
AVG HOUSEHOLD INCOME
9.7%
WAGE / INCOME GAP [ % ]
90.3¢/ $1
WAGE / INCOME GAP [ $ ]
0.36
INEQUALITY / GINI INDEX
16,246
TOTAL POPULATION
7,608
MALE POPULATION
8,638
FEMALE POPULATION
88.08
MALES / 100 FEMALES
113.54
FEMALES / 100 MALES
39.8
MEDIAN AGE
3.2
AVG FAMILY SIZE
2.6
AVG HOUSEHOLD SIZE
8,781
LABOR FORCE [ PEOPLE ]
69.2%
PERCENT IN LABOR FORCE
5.0%
UNEMPLOYMENT RATE
Glen Allen Area Codes
Income in Glen Allen
Income Overview in Glen Allen
Per Capita Income in Glen Allen is $41,304, while median incomes of families and households are $106,196 and $88,206 respectively.
| Characteristic | Number | Measure |
| Per Capita Income | 16,246 | $41,304 |
| Median Family Income | 4,404 | $106,196 |
| Mean Family Income | 4,404 | $119,868 |
| Median Household Income | 6,339 | $88,206 |
| Mean Household Income | 6,339 | $104,515 |
| Income Deficit | 4,404 | $0 |
| Wage / Income Gap (%) | 16,246 | 9.70% |
| Wage / Income Gap ($) | 16,246 | 90.30¢ per $1 |
| Gini / Inequality Index | 16,246 | 0.36 |
Earnings by Sex in Glen Allen
Average Earnings in Glen Allen are $50,410, $53,034 for men and $47,890 for women, a difference of 9.7%.
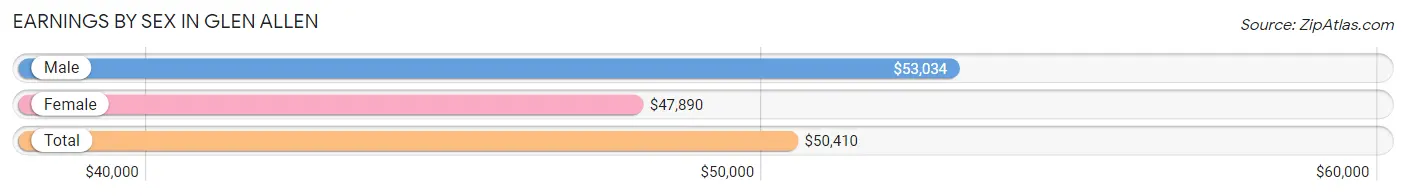
| Sex | Number | Average Earnings |
| Male | 4,575 (49.0%) | $53,034 |
| Female | 4,765 (51.0%) | $47,890 |
| Total | 9,340 (100.0%) | $50,410 |
Earnings by Sex by Income Bracket in Glen Allen
The most common earnings brackets in Glen Allen are $100,000+ for men (858 | 18.8%) and $100,000+ for women (784 | 16.5%).
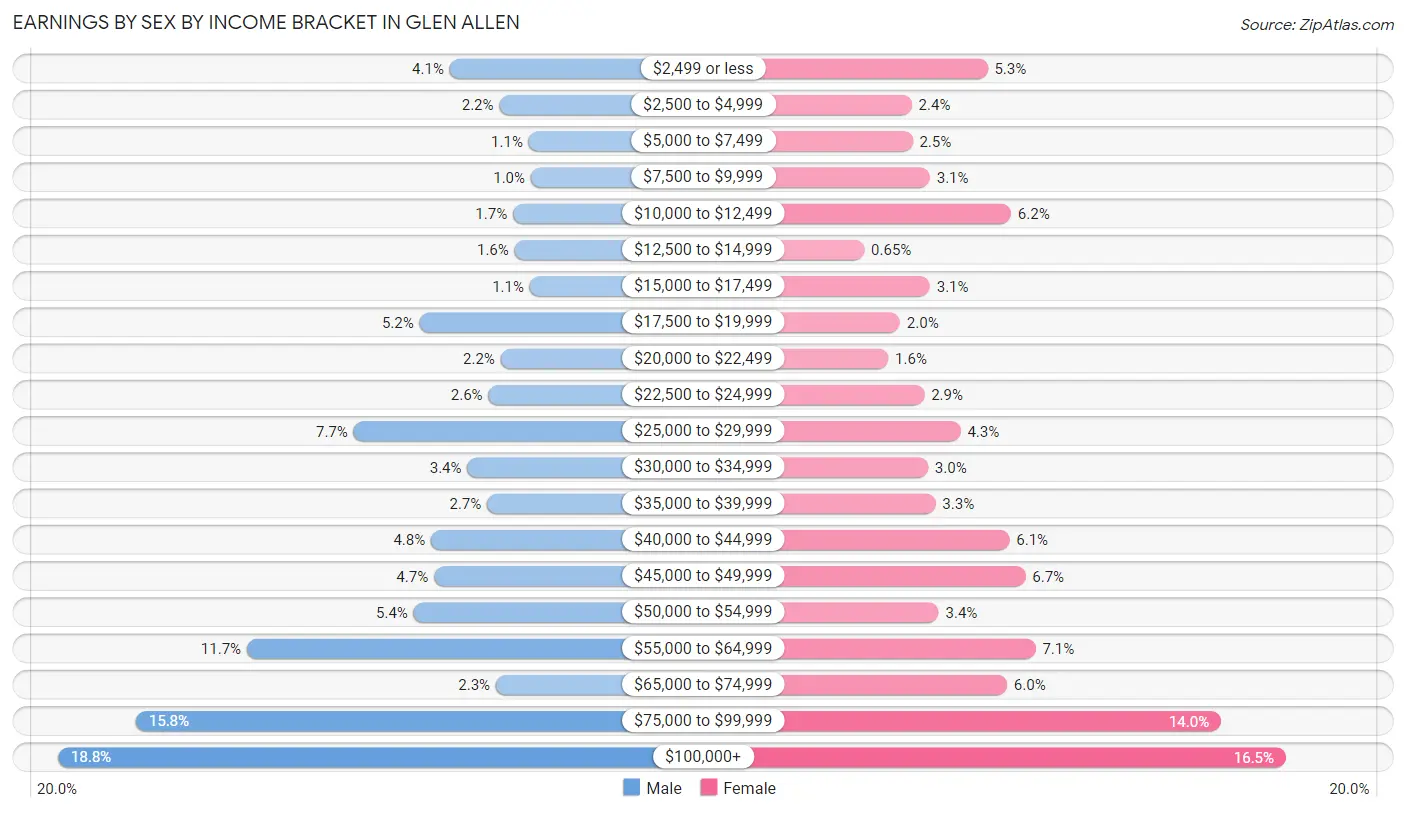
| Income | Male | Female |
| $2,499 or less | 186 (4.1%) | 251 (5.3%) |
| $2,500 to $4,999 | 101 (2.2%) | 116 (2.4%) |
| $5,000 to $7,499 | 51 (1.1%) | 117 (2.5%) |
| $7,500 to $9,999 | 47 (1.0%) | 148 (3.1%) |
| $10,000 to $12,499 | 78 (1.7%) | 293 (6.1%) |
| $12,500 to $14,999 | 75 (1.6%) | 31 (0.6%) |
| $15,000 to $17,499 | 49 (1.1%) | 148 (3.1%) |
| $17,500 to $19,999 | 238 (5.2%) | 95 (2.0%) |
| $20,000 to $22,499 | 99 (2.2%) | 74 (1.5%) |
| $22,500 to $24,999 | 120 (2.6%) | 138 (2.9%) |
| $25,000 to $29,999 | 351 (7.7%) | 203 (4.3%) |
| $30,000 to $34,999 | 156 (3.4%) | 145 (3.0%) |
| $35,000 to $39,999 | 122 (2.7%) | 158 (3.3%) |
| $40,000 to $44,999 | 218 (4.8%) | 290 (6.1%) |
| $45,000 to $49,999 | 213 (4.7%) | 319 (6.7%) |
| $50,000 to $54,999 | 248 (5.4%) | 164 (3.4%) |
| $55,000 to $64,999 | 534 (11.7%) | 337 (7.1%) |
| $65,000 to $74,999 | 107 (2.3%) | 286 (6.0%) |
| $75,000 to $99,999 | 724 (15.8%) | 668 (14.0%) |
| $100,000+ | 858 (18.8%) | 784 (16.5%) |
| Total | 4,575 (100.0%) | 4,765 (100.0%) |
Earnings by Sex by Educational Attainment in Glen Allen
Average earnings in Glen Allen are $59,696 for men and $53,547 for women, a difference of 10.3%. Men with an educational attainment of graduate degree enjoy the highest average annual earnings of $93,899, while those with high school diploma education earn the least with $49,107. Women with an educational attainment of graduate degree earn the most with the average annual earnings of $79,209, while those with less than high school education have the smallest earnings of $23,036.
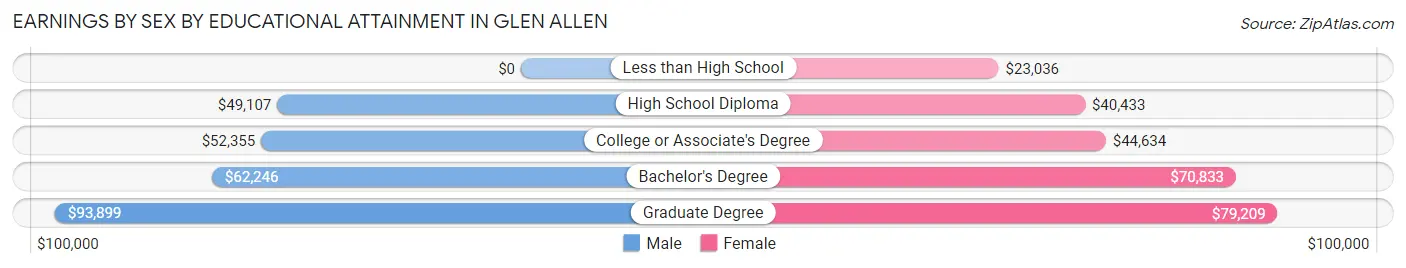
| Educational Attainment | Male Income | Female Income |
| Less than High School | - | - |
| High School Diploma | $49,107 | $40,433 |
| College or Associate's Degree | $52,355 | $44,634 |
| Bachelor's Degree | $62,246 | $70,833 |
| Graduate Degree | $93,899 | $79,209 |
| Total | $59,696 | $53,547 |
Family Income in Glen Allen
Family Income Brackets in Glen Allen
According to the Glen Allen family income data, there are 1,132 families falling into the $100,000 to $149,999 income range, which is the most common income bracket and makes up 25.7% of all families. Conversely, the $10,000 to $14,999 income bracket is the least frequent group with only 53 families (1.2%) belonging to this category.
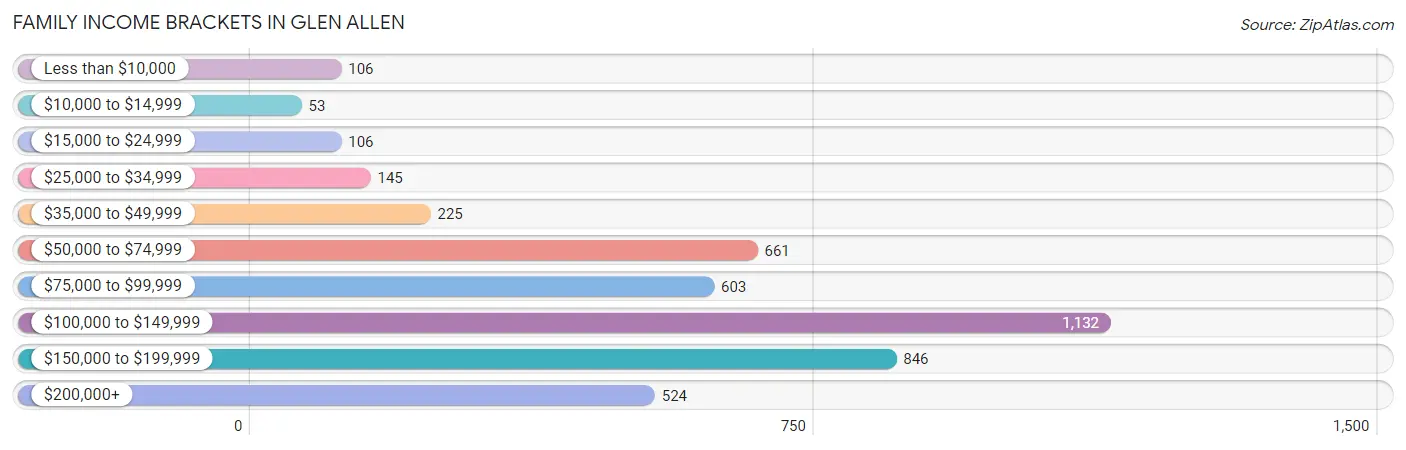
| Income Bracket | # Families | % Families |
| Less than $10,000 | 106 | 2.4% |
| $10,000 to $14,999 | 53 | 1.2% |
| $15,000 to $24,999 | 106 | 2.4% |
| $25,000 to $34,999 | 145 | 3.3% |
| $35,000 to $49,999 | 225 | 5.1% |
| $50,000 to $74,999 | 661 | 15.0% |
| $75,000 to $99,999 | 603 | 13.7% |
| $100,000 to $149,999 | 1,132 | 25.7% |
| $150,000 to $199,999 | 846 | 19.2% |
| $200,000+ | 524 | 11.9% |
Family Income by Famaliy Size in Glen Allen
4-person families (569 | 12.9%) account for the highest median family income in Glen Allen with $144,481 per family, while 2-person families (2,183 | 49.6%) have the highest median income of $46,056 per family member.
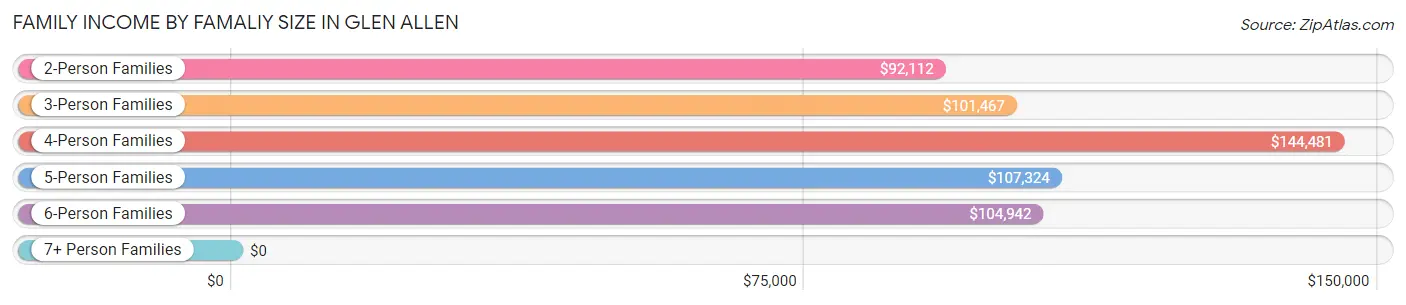
| Income Bracket | # Families | Median Income |
| 2-Person Families | 2,183 (49.6%) | $92,112 |
| 3-Person Families | 897 (20.4%) | $101,467 |
| 4-Person Families | 569 (12.9%) | $144,481 |
| 5-Person Families | 572 (13.0%) | $107,324 |
| 6-Person Families | 163 (3.7%) | $104,942 |
| 7+ Person Families | 20 (0.4%) | $0 |
| Total | 4,404 (100.0%) | $106,196 |
Family Income by Number of Earners in Glen Allen
The median family income in Glen Allen is $106,196, with families comprising 3+ earners (423) having the highest median family income of $166,811, while families with no earners (446) have the lowest median family income of $45,536, accounting for 9.6% and 10.1% of families, respectively.
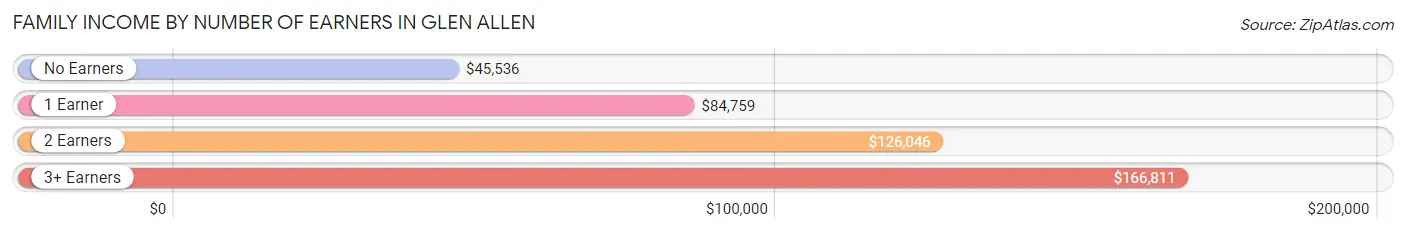
| Number of Earners | # Families | Median Income |
| No Earners | 446 (10.1%) | $45,536 |
| 1 Earner | 1,262 (28.7%) | $84,759 |
| 2 Earners | 2,273 (51.6%) | $126,046 |
| 3+ Earners | 423 (9.6%) | $166,811 |
| Total | 4,404 (100.0%) | $106,196 |
Household Income in Glen Allen
Household Income Brackets in Glen Allen
With 1,401 households falling in the category, the $100,000 to $149,999 income range is the most frequent in Glen Allen, accounting for 22.1% of all households. In contrast, only 114 households (1.8%) fall into the $10,000 to $14,999 income bracket, making it the least populous group.
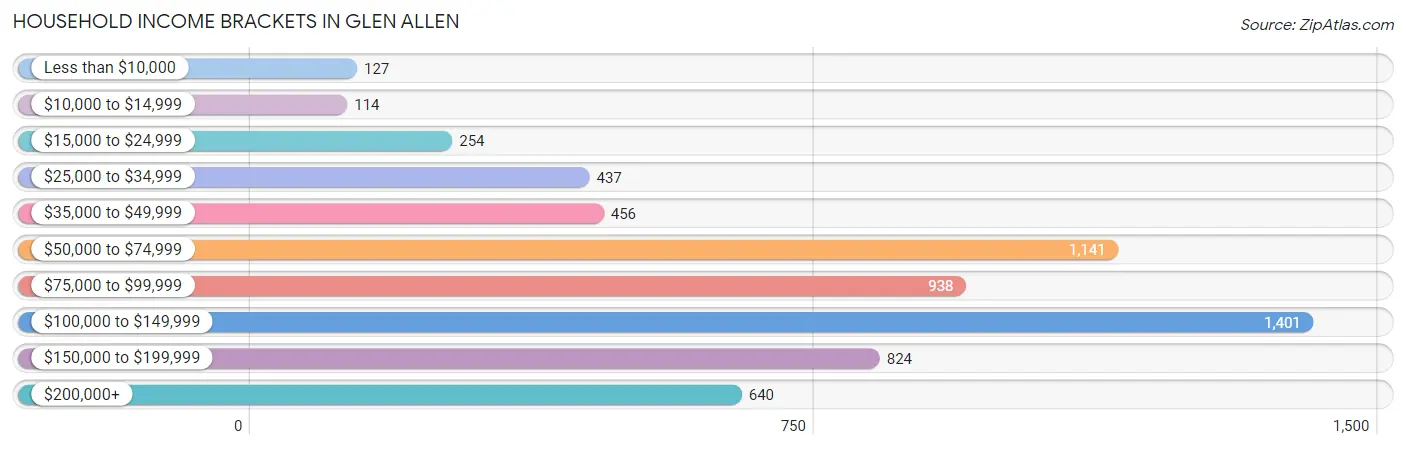
| Income Bracket | # Households | % Households |
| Less than $10,000 | 127 | 2.0% |
| $10,000 to $14,999 | 114 | 1.8% |
| $15,000 to $24,999 | 254 | 4.0% |
| $25,000 to $34,999 | 437 | 6.9% |
| $35,000 to $49,999 | 456 | 7.2% |
| $50,000 to $74,999 | 1,141 | 18.0% |
| $75,000 to $99,999 | 938 | 14.8% |
| $100,000 to $149,999 | 1,401 | 22.1% |
| $150,000 to $199,999 | 824 | 13.0% |
| $200,000+ | 640 | 10.1% |
Household Income by Householder Age in Glen Allen
The median household income in Glen Allen is $88,206, with the highest median household income of $104,475 found in the 45 to 64 years age bracket for the primary householder. A total of 2,444 households (38.6%) fall into this category. Meanwhile, the 65+ years age bracket for the primary householder has the lowest median household income of $69,038, with 1,612 households (25.4%) in this group.
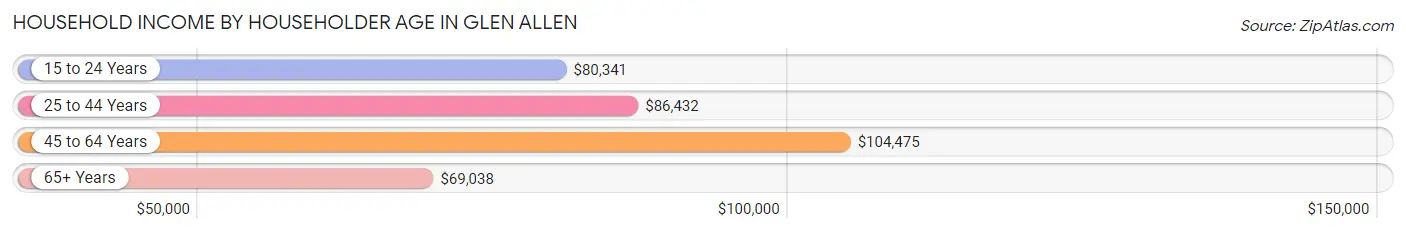
| Income Bracket | # Households | Median Income |
| 15 to 24 Years | 43 (0.7%) | $80,341 |
| 25 to 44 Years | 2,240 (35.3%) | $86,432 |
| 45 to 64 Years | 2,444 (38.6%) | $104,475 |
| 65+ Years | 1,612 (25.4%) | $69,038 |
| Total | 6,339 (100.0%) | $88,206 |
Poverty in Glen Allen
Income Below Poverty by Sex and Age in Glen Allen
With 4.6% poverty level for males and 4.8% for females among the residents of Glen Allen, 16 and 17 year old males and 15 year old females are the most vulnerable to poverty, with 33 males (18.1%) and 47 females (32.2%) in their respective age groups living below the poverty level.
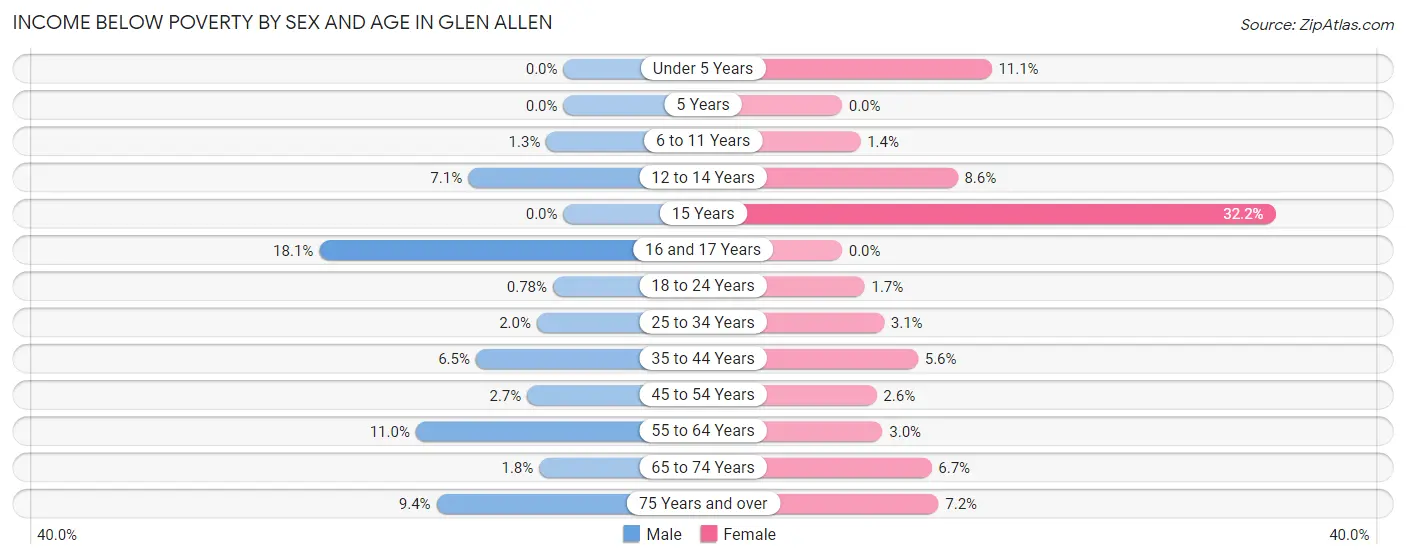
| Age Bracket | Male | Female |
| Under 5 Years | 0 (0.0%) | 62 (11.1%) |
| 5 Years | 0 (0.0%) | 0 (0.0%) |
| 6 to 11 Years | 11 (1.3%) | 9 (1.4%) |
| 12 to 14 Years | 31 (7.1%) | 25 (8.6%) |
| 15 Years | 0 (0.0%) | 47 (32.2%) |
| 16 and 17 Years | 33 (18.1%) | 0 (0.0%) |
| 18 to 24 Years | 5 (0.8%) | 13 (1.7%) |
| 25 to 34 Years | 16 (2.0%) | 27 (3.1%) |
| 35 to 44 Years | 85 (6.5%) | 69 (5.6%) |
| 45 to 54 Years | 23 (2.7%) | 34 (2.6%) |
| 55 to 64 Years | 103 (11.0%) | 35 (3.0%) |
| 65 to 74 Years | 14 (1.8%) | 63 (6.7%) |
| 75 Years and over | 26 (9.4%) | 34 (7.2%) |
| Total | 347 (4.6%) | 418 (4.8%) |
Income Above Poverty by Sex and Age in Glen Allen
According to the poverty statistics in Glen Allen, males aged under 5 years and females aged 5 years are the age groups that are most secure financially, with 100.0% of males and 100.0% of females in these age groups living above the poverty line.
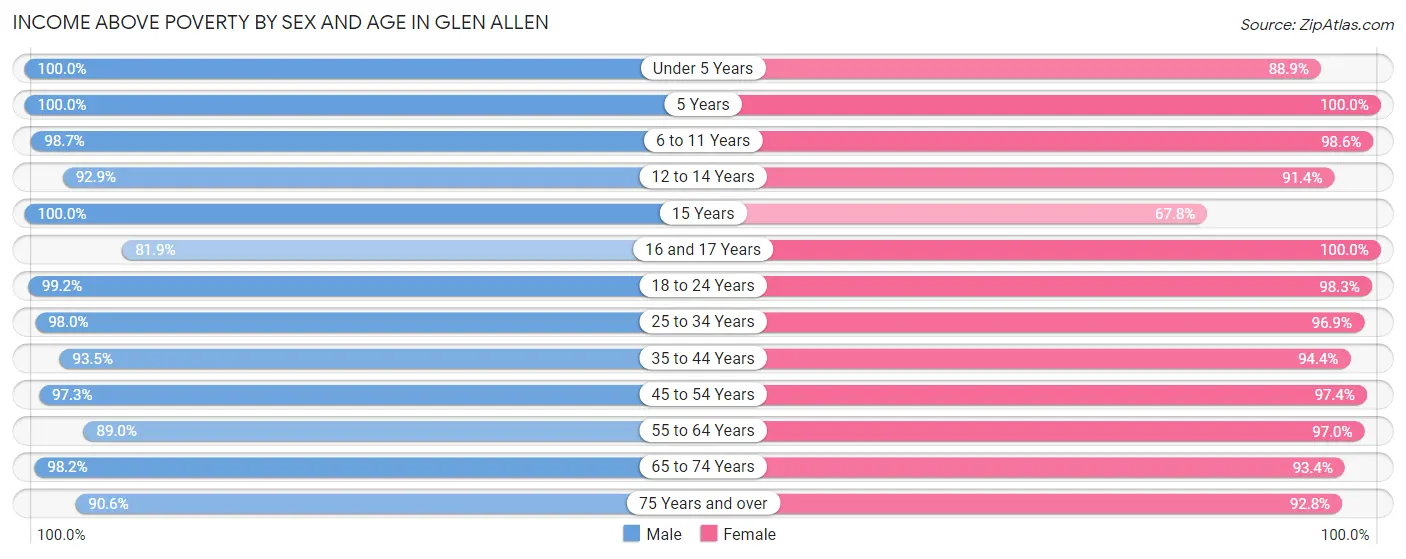
| Age Bracket | Male | Female |
| Under 5 Years | 291 (100.0%) | 496 (88.9%) |
| 5 Years | 155 (100.0%) | 87 (100.0%) |
| 6 to 11 Years | 853 (98.7%) | 646 (98.6%) |
| 12 to 14 Years | 407 (92.9%) | 266 (91.4%) |
| 15 Years | 66 (100.0%) | 99 (67.8%) |
| 16 and 17 Years | 149 (81.9%) | 130 (100.0%) |
| 18 to 24 Years | 639 (99.2%) | 757 (98.3%) |
| 25 to 34 Years | 797 (98.0%) | 837 (96.9%) |
| 35 to 44 Years | 1,222 (93.5%) | 1,154 (94.4%) |
| 45 to 54 Years | 831 (97.3%) | 1,288 (97.4%) |
| 55 to 64 Years | 837 (89.0%) | 1,128 (97.0%) |
| 65 to 74 Years | 764 (98.2%) | 884 (93.3%) |
| 75 Years and over | 250 (90.6%) | 440 (92.8%) |
| Total | 7,261 (95.4%) | 8,212 (95.2%) |
Income Below Poverty Among Married-Couple Families in Glen Allen
The poverty statistics for married-couple families in Glen Allen show that 4.1% or 133 of the total 3,287 families live below the poverty line. Families with 3 or 4 children have the highest poverty rate of 10.0%, comprising of 41 families. On the other hand, families with 1 or 2 children have the lowest poverty rate of 0.0%, which includes 0 families.
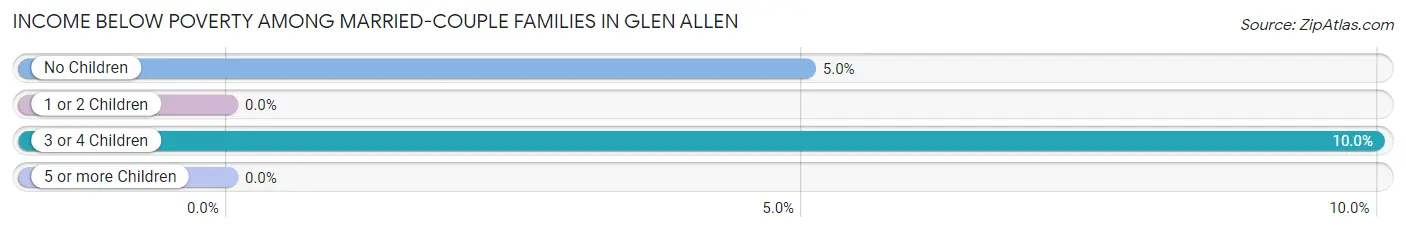
| Children | Above Poverty | Below Poverty |
| No Children | 1,738 (95.0%) | 92 (5.0%) |
| 1 or 2 Children | 1,046 (100.0%) | 0 (0.0%) |
| 3 or 4 Children | 370 (90.0%) | 41 (10.0%) |
| 5 or more Children | 0 (0.0%) | 0 (0.0%) |
| Total | 3,154 (96.0%) | 133 (4.1%) |
Income Below Poverty Among Single-Parent Households in Glen Allen
According to the poverty data in Glen Allen, 0.5% or 1 single-father households and 9.1% or 85 single-mother households are living below the poverty line. Among single-father households, those with no children have the highest poverty rate, with 1 households (2.4%) experiencing poverty. Likewise, among single-mother households, those with 3 or 4 children have the highest poverty rate, with 14 households (100.0%) falling below the poverty line.
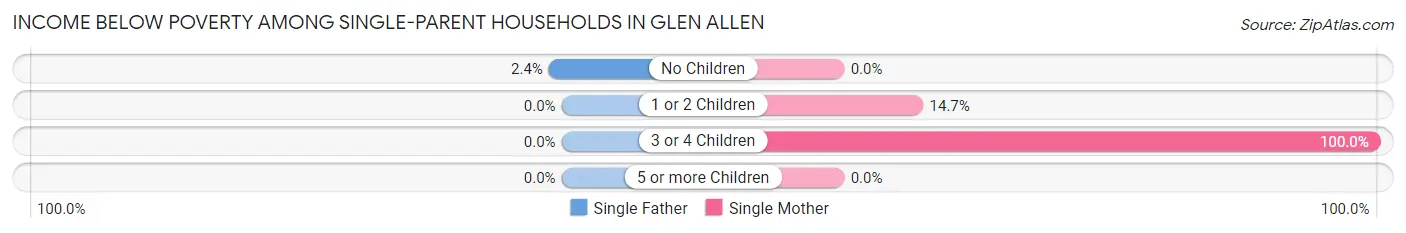
| Children | Single Father | Single Mother |
| No Children | 1 (2.4%) | 0 (0.0%) |
| 1 or 2 Children | 0 (0.0%) | 71 (14.7%) |
| 3 or 4 Children | 0 (0.0%) | 14 (100.0%) |
| 5 or more Children | 0 (0.0%) | 0 (0.0%) |
| Total | 1 (0.5%) | 85 (9.1%) |
Income Below Poverty Among Married-Couple vs Single-Parent Households in Glen Allen
The poverty data for Glen Allen shows that 133 of the married-couple family households (4.1%) and 86 of the single-parent households (7.7%) are living below the poverty level. Within the married-couple family households, those with 3 or 4 children have the highest poverty rate, with 41 households (10.0%) falling below the poverty line. Among the single-parent households, those with 3 or 4 children have the highest poverty rate, with 14 household (100.0%) living below poverty.
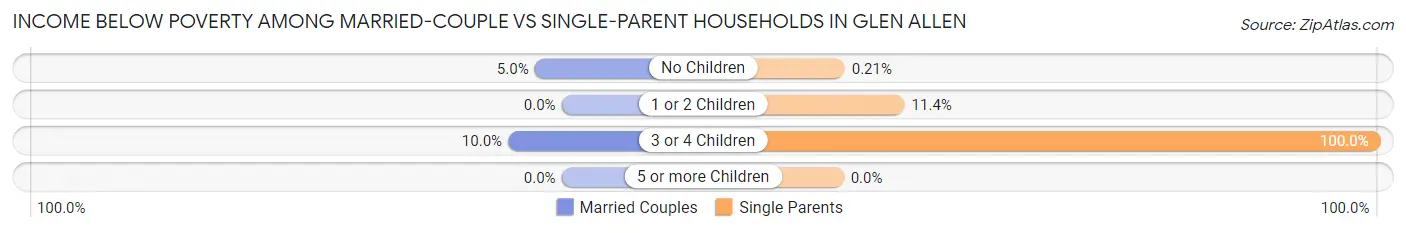
| Children | Married-Couple Families | Single-Parent Households |
| No Children | 92 (5.0%) | 1 (0.2%) |
| 1 or 2 Children | 0 (0.0%) | 71 (11.4%) |
| 3 or 4 Children | 41 (10.0%) | 14 (100.0%) |
| 5 or more Children | 0 (0.0%) | 0 (0.0%) |
| Total | 133 (4.1%) | 86 (7.7%) |
Race in Glen Allen
The most populous races in Glen Allen are White / Caucasian (9,551 | 58.8%), Black / African American (4,308 | 26.5%), and Asian (1,343 | 8.3%).
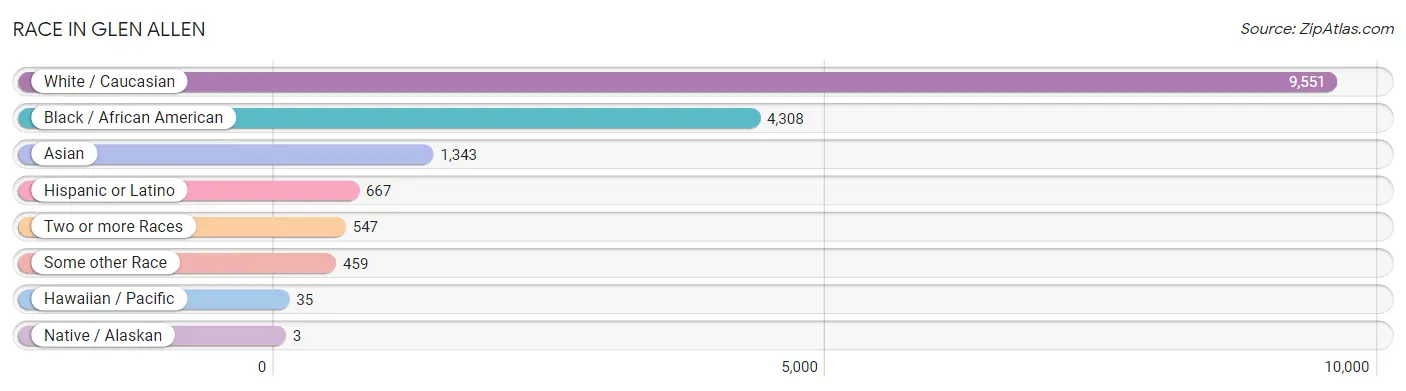
| Race | # Population | % Population |
| Asian | 1,343 | 8.3% |
| Black / African American | 4,308 | 26.5% |
| Hawaiian / Pacific | 35 | 0.2% |
| Hispanic or Latino | 667 | 4.1% |
| Native / Alaskan | 3 | 0.0% |
| White / Caucasian | 9,551 | 58.8% |
| Two or more Races | 547 | 3.4% |
| Some other Race | 459 | 2.8% |
| Total | 16,246 | 100.0% |
Ancestry in Glen Allen
The most populous ancestries reported in Glen Allen are English (2,618 | 16.1%), Irish (1,648 | 10.1%), German (1,438 | 8.8%), Italian (723 | 4.4%), and Thai (566 | 3.5%), together accounting for 43.0% of all Glen Allen residents.
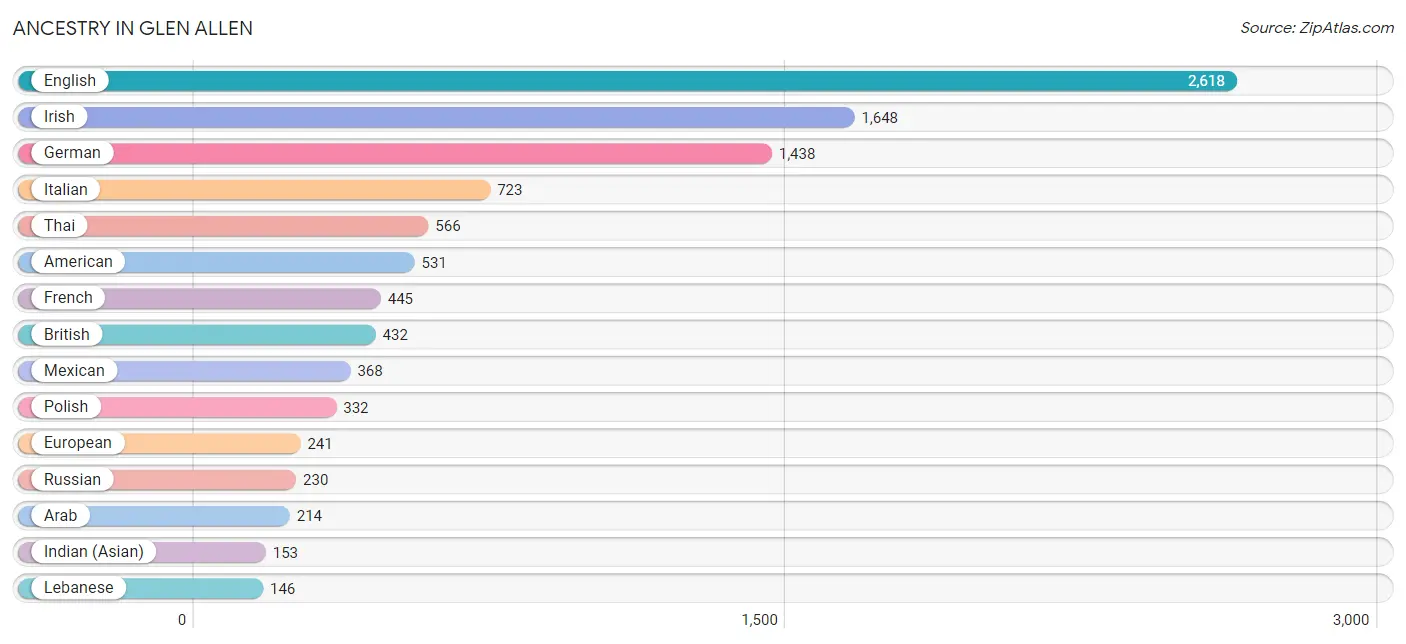
| Ancestry | # Population | % Population |
| Afghan | 104 | 0.6% |
| African | 50 | 0.3% |
| American | 531 | 3.3% |
| Arab | 214 | 1.3% |
| Argentinean | 45 | 0.3% |
| Armenian | 58 | 0.4% |
| Austrian | 39 | 0.2% |
| Bhutanese | 117 | 0.7% |
| British | 432 | 2.7% |
| Burmese | 106 | 0.6% |
| Central American | 54 | 0.3% |
| Cherokee | 8 | 0.1% |
| Colombian | 39 | 0.2% |
| Cuban | 24 | 0.2% |
| Dutch | 63 | 0.4% |
| Eastern European | 21 | 0.1% |
| Egyptian | 15 | 0.1% |
| English | 2,618 | 16.1% |
| Ethiopian | 2 | 0.0% |
| European | 241 | 1.5% |
| Finnish | 17 | 0.1% |
| French | 445 | 2.7% |
| French Canadian | 112 | 0.7% |
| German | 1,438 | 8.8% |
| Indian (Asian) | 153 | 0.9% |
| Irish | 1,648 | 10.1% |
| Italian | 723 | 4.4% |
| Jamaican | 21 | 0.1% |
| Japanese | 24 | 0.2% |
| Lebanese | 146 | 0.9% |
| Lithuanian | 17 | 0.1% |
| Mexican | 368 | 2.3% |
| Nigerian | 12 | 0.1% |
| Northern European | 34 | 0.2% |
| Norwegian | 75 | 0.5% |
| Paraguayan | 22 | 0.1% |
| Polish | 332 | 2.0% |
| Portuguese | 37 | 0.2% |
| Puerto Rican | 115 | 0.7% |
| Russian | 230 | 1.4% |
| Salvadoran | 54 | 0.3% |
| Scotch-Irish | 55 | 0.3% |
| Scottish | 101 | 0.6% |
| Serbian | 22 | 0.1% |
| Sierra Leonean | 9 | 0.1% |
| South American | 106 | 0.6% |
| Sri Lankan | 71 | 0.4% |
| Subsaharan African | 74 | 0.5% |
| Swedish | 17 | 0.1% |
| Swiss | 11 | 0.1% |
| Thai | 566 | 3.5% |
| Tongan | 35 | 0.2% |
| Ukrainian | 15 | 0.1% |
| Vietnamese | 143 | 0.9% |
| Welsh | 74 | 0.5% | View All 55 Rows |
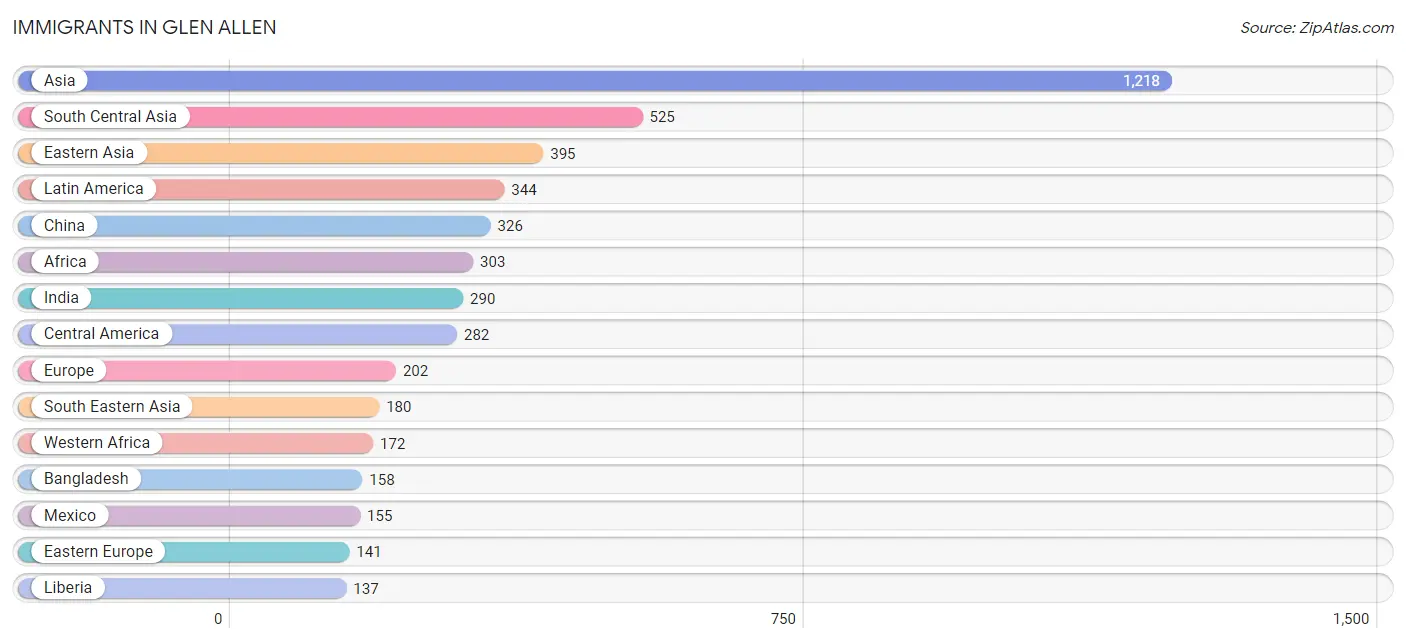
Immigrants in Glen Allen
The most numerous immigrant groups reported in Glen Allen came from Asia (1,218 | 7.5%), South Central Asia (525 | 3.2%), Eastern Asia (395 | 2.4%), Latin America (344 | 2.1%), and China (326 | 2.0%), together accounting for 17.3% of all Glen Allen residents.
| Immigration Origin | # Population | % Population |
| Afghanistan | 60 | 0.4% |
| Africa | 303 | 1.9% |
| Argentina | 9 | 0.1% |
| Asia | 1,218 | 7.5% |
| Australia | 11 | 0.1% |
| Bangladesh | 158 | 1.0% |
| Bosnia and Herzegovina | 11 | 0.1% |
| Cambodia | 24 | 0.2% |
| Canada | 108 | 0.7% |
| Caribbean | 9 | 0.1% |
| Central America | 282 | 1.7% |
| China | 326 | 2.0% |
| Congo | 1 | 0.0% |
| Cuba | 9 | 0.1% |
| Eastern Africa | 33 | 0.2% |
| Eastern Asia | 395 | 2.4% |
| Eastern Europe | 141 | 0.9% |
| Egypt | 15 | 0.1% |
| El Salvador | 127 | 0.8% |
| Ethiopia | 1 | 0.0% |
| Europe | 202 | 1.2% |
| Germany | 15 | 0.1% |
| India | 290 | 1.8% |
| Iraq | 53 | 0.3% |
| Ireland | 20 | 0.1% |
| Korea | 69 | 0.4% |
| Latin America | 344 | 2.1% |
| Lebanon | 65 | 0.4% |
| Liberia | 137 | 0.8% |
| Mexico | 155 | 0.9% |
| Middle Africa | 1 | 0.0% |
| Nepal | 17 | 0.1% |
| Nigeria | 26 | 0.2% |
| Northern Africa | 97 | 0.6% |
| Northern Europe | 20 | 0.1% |
| Oceania | 28 | 0.2% |
| Peru | 27 | 0.2% |
| Portugal | 26 | 0.2% |
| Russia | 115 | 0.7% |
| Sierra Leone | 9 | 0.1% |
| Singapore | 48 | 0.3% |
| South America | 53 | 0.3% |
| South Central Asia | 525 | 3.2% |
| South Eastern Asia | 180 | 1.1% |
| Southern Europe | 26 | 0.2% |
| Sudan | 82 | 0.5% |
| Ukraine | 15 | 0.1% |
| Vietnam | 108 | 0.7% |
| Western Africa | 172 | 1.1% |
| Western Asia | 118 | 0.7% |
| Western Europe | 15 | 0.1% | View All 51 Rows |
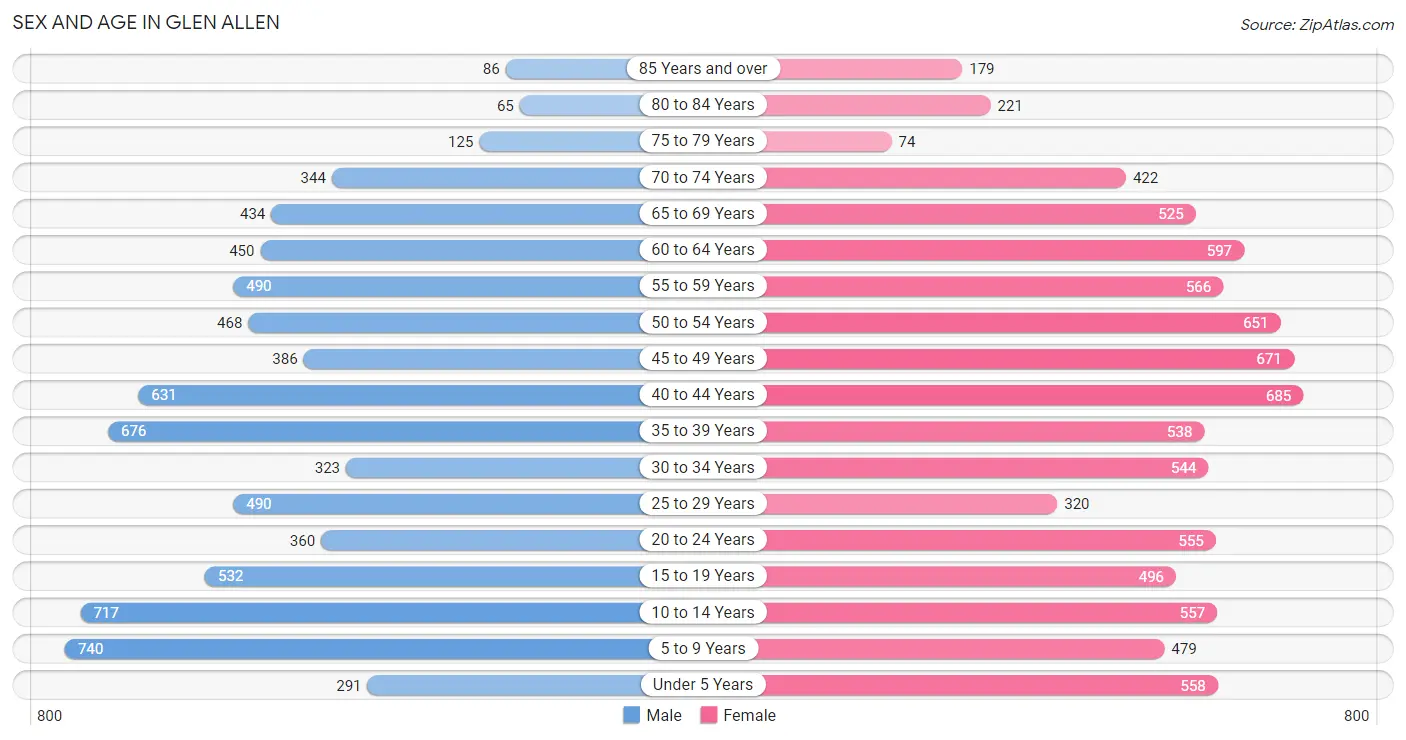
Sex and Age in Glen Allen
Sex and Age in Glen Allen
The most populous age groups in Glen Allen are 5 to 9 Years (740 | 9.7%) for men and 40 to 44 Years (685 | 7.9%) for women.
| Age Bracket | Male | Female |
| Under 5 Years | 291 (3.8%) | 558 (6.5%) |
| 5 to 9 Years | 740 (9.7%) | 479 (5.6%) |
| 10 to 14 Years | 717 (9.4%) | 557 (6.5%) |
| 15 to 19 Years | 532 (7.0%) | 496 (5.7%) |
| 20 to 24 Years | 360 (4.7%) | 555 (6.4%) |
| 25 to 29 Years | 490 (6.4%) | 320 (3.7%) |
| 30 to 34 Years | 323 (4.3%) | 544 (6.3%) |
| 35 to 39 Years | 676 (8.9%) | 538 (6.2%) |
| 40 to 44 Years | 631 (8.3%) | 685 (7.9%) |
| 45 to 49 Years | 386 (5.1%) | 671 (7.8%) |
| 50 to 54 Years | 468 (6.1%) | 651 (7.5%) |
| 55 to 59 Years | 490 (6.4%) | 566 (6.6%) |
| 60 to 64 Years | 450 (5.9%) | 597 (6.9%) |
| 65 to 69 Years | 434 (5.7%) | 525 (6.1%) |
| 70 to 74 Years | 344 (4.5%) | 422 (4.9%) |
| 75 to 79 Years | 125 (1.6%) | 74 (0.9%) |
| 80 to 84 Years | 65 (0.9%) | 221 (2.6%) |
| 85 Years and over | 86 (1.1%) | 179 (2.1%) |
| Total | 7,608 (100.0%) | 8,638 (100.0%) |
Families and Households in Glen Allen
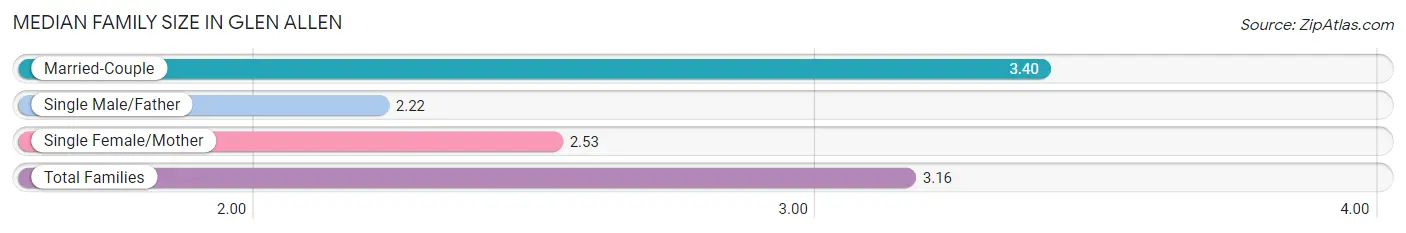
Median Family Size in Glen Allen
The median family size in Glen Allen is 3.16 persons per family, with married-couple families (3,287 | 74.6%) accounting for the largest median family size of 3.4 persons per family. On the other hand, single male/father families (184 | 4.2%) represent the smallest median family size with 2.22 persons per family.
| Family Type | # Families | Family Size |
| Married-Couple | 3,287 (74.6%) | 3.40 |
| Single Male/Father | 184 (4.2%) | 2.22 |
| Single Female/Mother | 933 (21.2%) | 2.53 |
| Total Families | 4,404 (100.0%) | 3.16 |
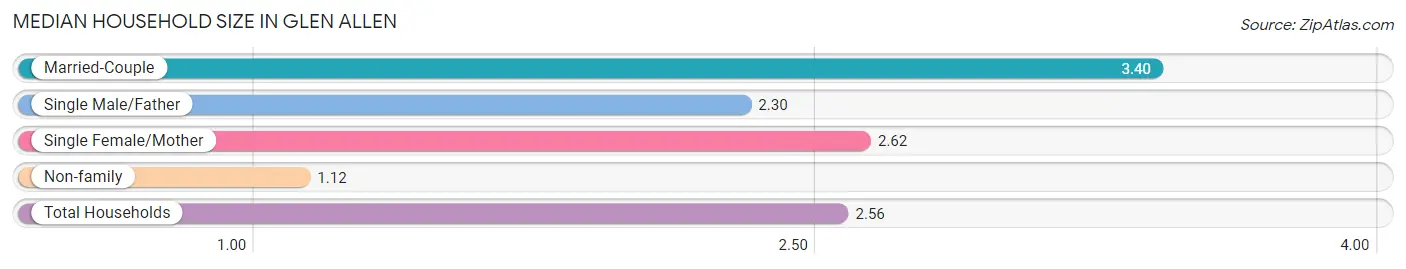
Median Household Size in Glen Allen
The median household size in Glen Allen is 2.56 persons per household, with married-couple households (3,287 | 51.8%) accounting for the largest median household size of 3.4 persons per household. non-family households (1,935 | 30.5%) represent the smallest median household size with 1.12 persons per household.
| Household Type | # Households | Household Size |
| Married-Couple | 3,287 (51.8%) | 3.40 |
| Single Male/Father | 184 (2.9%) | 2.30 |
| Single Female/Mother | 933 (14.7%) | 2.62 |
| Non-family | 1,935 (30.5%) | 1.12 |
| Total Households | 6,339 (100.0%) | 2.56 |
Household Size by Marriage Status in Glen Allen
Out of a total of 6,339 households in Glen Allen, 4,404 (69.5%) are family households, while 1,935 (30.5%) are nonfamily households. The most numerous type of family households are 2-person households, comprising 2,149, and the most common type of nonfamily households are 1-person households, comprising 1,748.
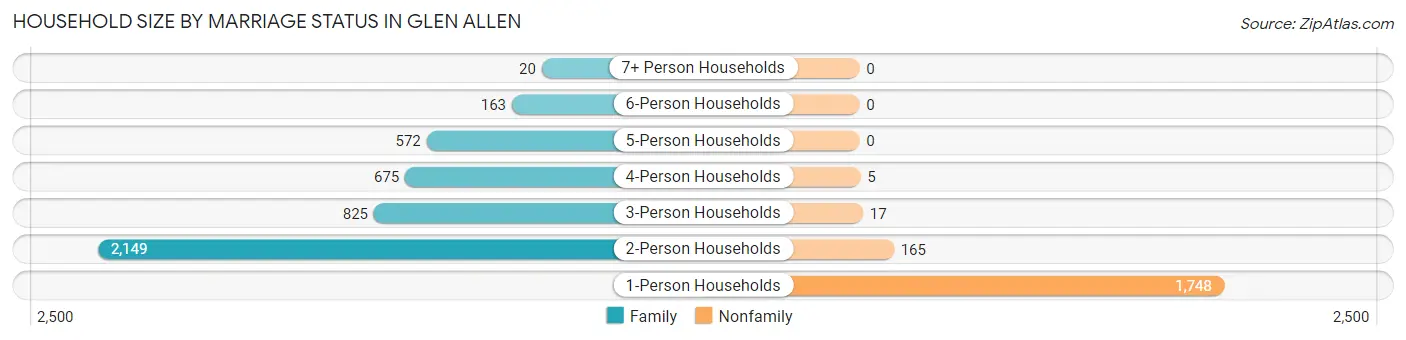
| Household Size | Family Households | Nonfamily Households |
| 1-Person Households | - | 1,748 (27.6%) |
| 2-Person Households | 2,149 (33.9%) | 165 (2.6%) |
| 3-Person Households | 825 (13.0%) | 17 (0.3%) |
| 4-Person Households | 675 (10.6%) | 5 (0.1%) |
| 5-Person Households | 572 (9.0%) | 0 (0.0%) |
| 6-Person Households | 163 (2.6%) | 0 (0.0%) |
| 7+ Person Households | 20 (0.3%) | 0 (0.0%) |
| Total | 4,404 (69.5%) | 1,935 (30.5%) |
Female Fertility in Glen Allen
Fertility by Age in Glen Allen
Average fertility rate in Glen Allen is 63.0 births per 1,000 women. Women in the age bracket of 20 to 34 years have the highest fertility rate with 120.0 births per 1,000 women. Women in the age bracket of 20 to 34 years acount for 69.1% of all women with births.
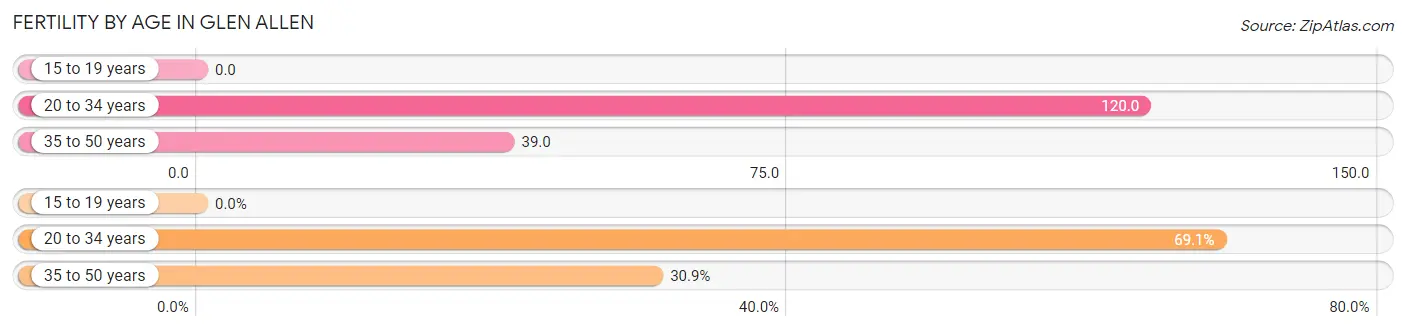
| Age Bracket | Women with Births | Births / 1,000 Women |
| 15 to 19 years | 0 (0.0%) | 0.0 |
| 20 to 34 years | 170 (69.1%) | 120.0 |
| 35 to 50 years | 76 (30.9%) | 39.0 |
| Total | 246 (100.0%) | 63.0 |
Fertility by Age by Marriage Status in Glen Allen
67.5% of women with births (246) in Glen Allen are married. The highest percentage of unmarried women with births falls into 20 to 34 years age bracket with 47.1% of them unmarried at the time of birth, while the lowest percentage of unmarried women with births belong to 35 to 50 years age bracket with 0.0% of them unmarried.
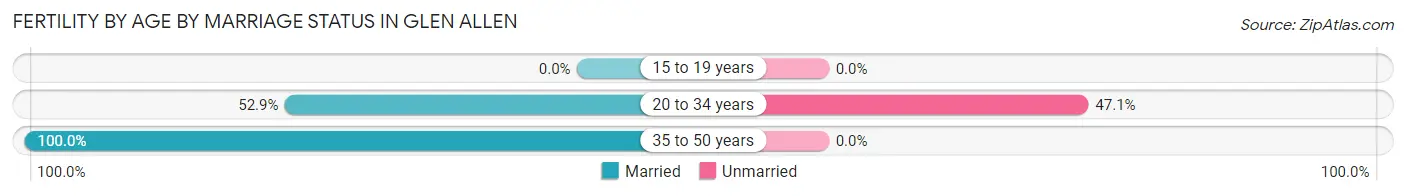
| Age Bracket | Married | Unmarried |
| 15 to 19 years | 0 (0.0%) | 0 (0.0%) |
| 20 to 34 years | 90 (52.9%) | 80 (47.1%) |
| 35 to 50 years | 76 (100.0%) | 0 (0.0%) |
| Total | 166 (67.5%) | 80 (32.5%) |
Fertility by Education in Glen Allen
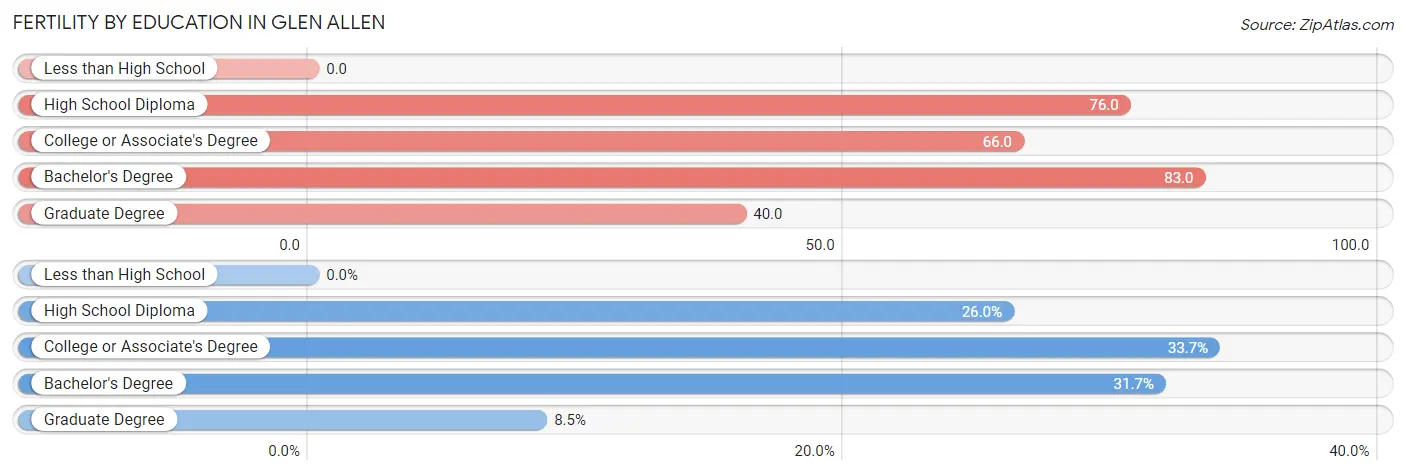
| Educational Attainment | Women with Births | Births / 1,000 Women |
| Less than High School | 0 (0.0%) | 0.0 |
| High School Diploma | 64 (26.0%) | 76.0 |
| College or Associate's Degree | 83 (33.7%) | 66.0 |
| Bachelor's Degree | 78 (31.7%) | 83.0 |
| Graduate Degree | 21 (8.5%) | 40.0 |
| Total | 246 (100.0%) | 63.0 |
Fertility by Education by Marriage Status in Glen Allen
32.5% of women with births in Glen Allen are unmarried. Women with the educational attainment of college or associate's degree are most likely to be married with 100.0% of them married at childbirth, while women with the educational attainment of high school diploma are least likely to be married with 100.0% of them unmarried at childbirth.
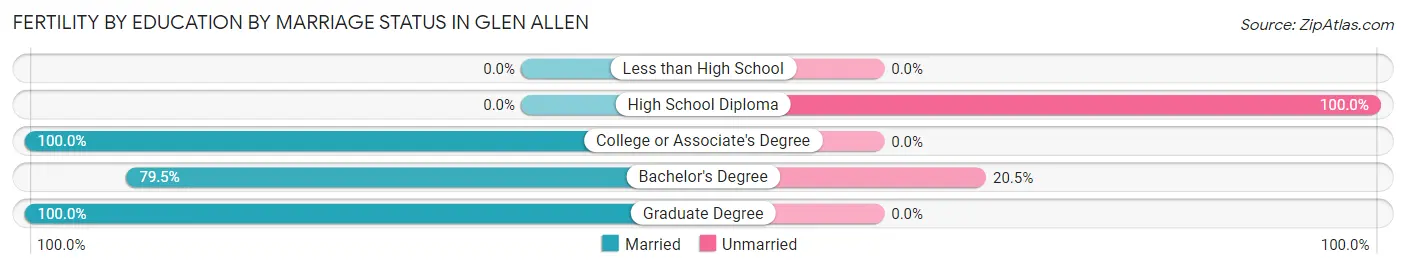
| Educational Attainment | Married | Unmarried |
| Less than High School | 0 (0.0%) | 0 (0.0%) |
| High School Diploma | 0 (0.0%) | 64 (100.0%) |
| College or Associate's Degree | 83 (100.0%) | 0 (0.0%) |
| Bachelor's Degree | 62 (79.5%) | 16 (20.5%) |
| Graduate Degree | 21 (100.0%) | 0 (0.0%) |
| Total | 166 (67.5%) | 80 (32.5%) |
Employment Characteristics in Glen Allen
Employment by Class of Employer in Glen Allen
Among the 8,257 employed individuals in Glen Allen, private company employees (5,129 | 62.1%), not-for-profit organizations (842 | 10.2%), and local government employees (675 | 8.2%) make up the most common classes of employment.
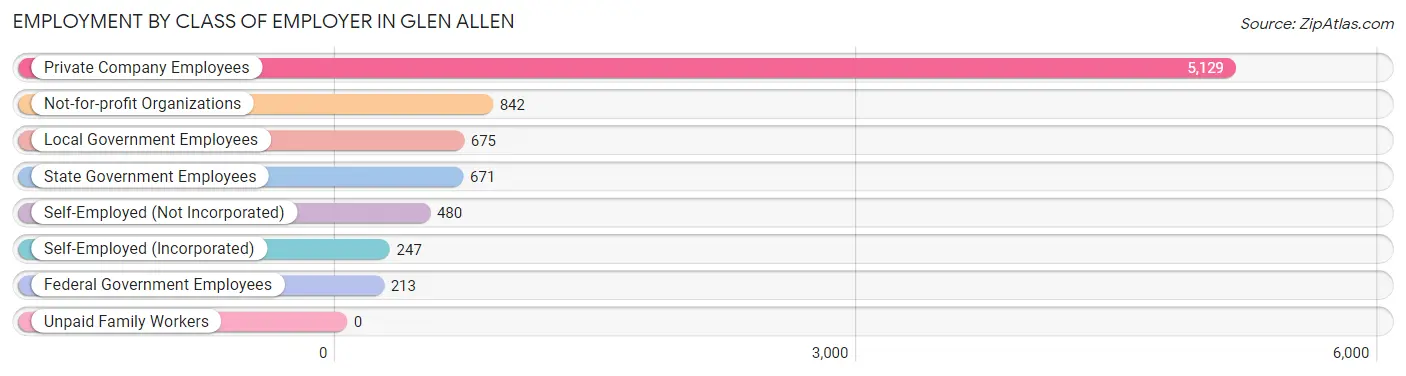
| Employer Class | # Employees | % Employees |
| Private Company Employees | 5,129 | 62.1% |
| Self-Employed (Incorporated) | 247 | 3.0% |
| Self-Employed (Not Incorporated) | 480 | 5.8% |
| Not-for-profit Organizations | 842 | 10.2% |
| Local Government Employees | 675 | 8.2% |
| State Government Employees | 671 | 8.1% |
| Federal Government Employees | 213 | 2.6% |
| Unpaid Family Workers | 0 | 0.0% |
| Total | 8,257 | 100.0% |
Employment Status by Age in Glen Allen
According to the labor force statistics for Glen Allen, out of the total population over 16 years of age (12,690), 69.2% or 8,781 individuals are in the labor force, with 5.0% or 439 of them unemployed. The age group with the highest labor force participation rate is 45 to 54 years, with 91.0% or 1,980 individuals in the labor force. Within the labor force, the 16 to 19 years age range has the highest percentage of unemployed individuals, with 61.8% or 225 of them being unemployed.
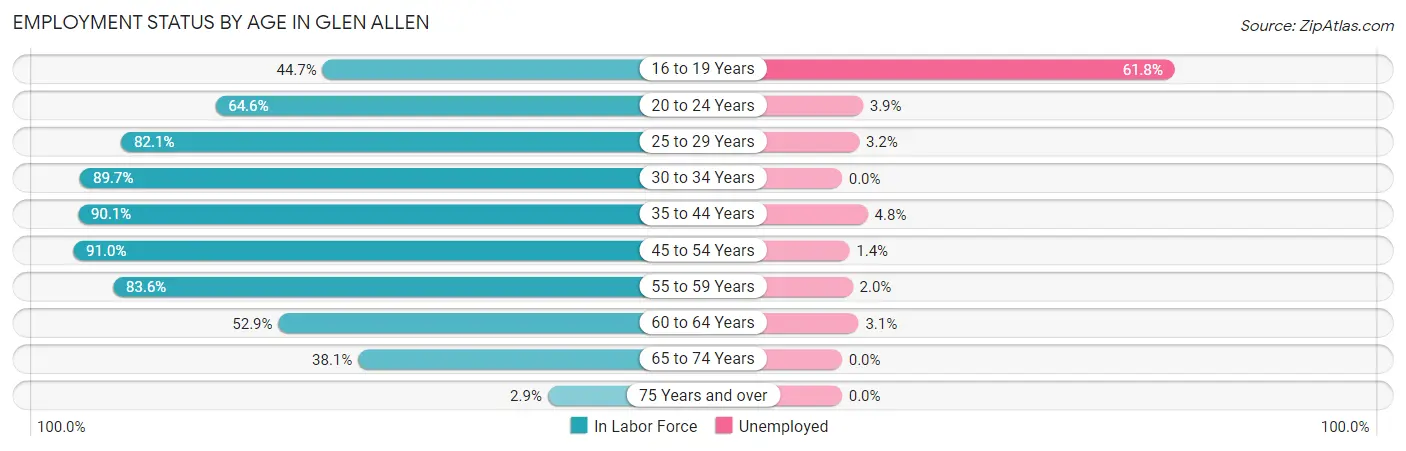
| Age Bracket | In Labor Force | Unemployed |
| 16 to 19 Years | 364 (44.7%) | 225 (61.8%) |
| 20 to 24 Years | 591 (64.6%) | 23 (3.9%) |
| 25 to 29 Years | 665 (82.1%) | 21 (3.2%) |
| 30 to 34 Years | 778 (89.7%) | 0 (0.0%) |
| 35 to 44 Years | 2,280 (90.1%) | 109 (4.8%) |
| 45 to 54 Years | 1,980 (91.0%) | 28 (1.4%) |
| 55 to 59 Years | 883 (83.6%) | 18 (2.0%) |
| 60 to 64 Years | 554 (52.9%) | 17 (3.1%) |
| 65 to 74 Years | 657 (38.1%) | 0 (0.0%) |
| 75 Years and over | 22 (2.9%) | 0 (0.0%) |
| Total | 8,781 (69.2%) | 439 (5.0%) |
Employment Status by Educational Attainment in Glen Allen
According to labor force statistics for Glen Allen, 84.2% of individuals (7,145) out of the total population between 25 and 64 years of age (8,486) are in the labor force, with 2.7% or 193 of them being unemployed. The group with the highest labor force participation rate are those with the educational attainment of bachelor's degree or higher, with 91.8% or 3,483 individuals in the labor force. Within the labor force, individuals with less than high school education have the highest percentage of unemployment, with 6.4% or 18 of them being unemployed.
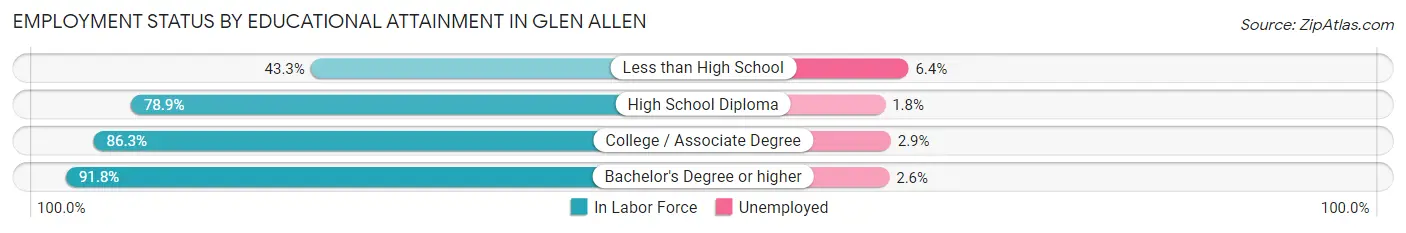
| Educational Attainment | In Labor Force | Unemployed |
| Less than High School | 282 (43.3%) | 42 (6.4%) |
| High School Diploma | 1,183 (78.9%) | 27 (1.8%) |
| College / Associate Degree | 2,194 (86.3%) | 74 (2.9%) |
| Bachelor's Degree or higher | 3,483 (91.8%) | 99 (2.6%) |
| Total | 7,145 (84.2%) | 229 (2.7%) |
Employment Occupations by Sex in Glen Allen
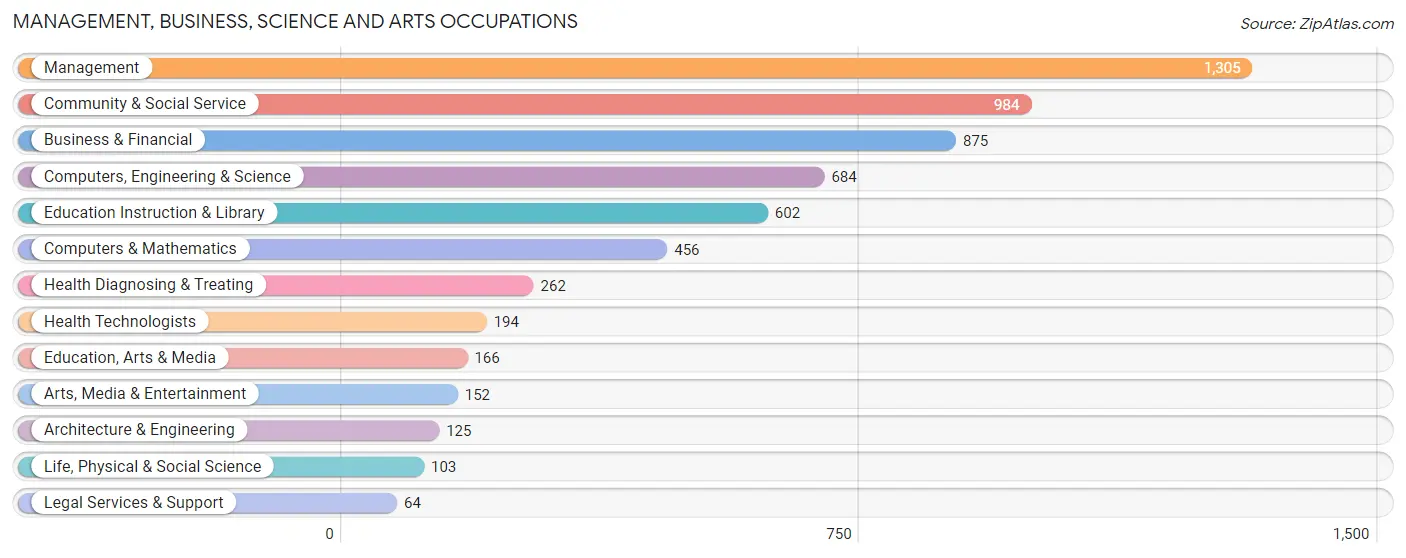
Management, Business, Science and Arts Occupations
The most common Management, Business, Science and Arts occupations in Glen Allen are Management (1,305 | 15.7%), Community & Social Service (984 | 11.8%), Business & Financial (875 | 10.5%), Computers, Engineering & Science (684 | 8.2%), and Education Instruction & Library (602 | 7.2%).
Management, Business, Science and Arts Occupations by Sex
Within the Management, Business, Science and Arts occupations in Glen Allen, the most male-oriented occupations are Architecture & Engineering (100.0%), Arts, Media & Entertainment (100.0%), and Legal Services & Support (71.9%), while the most female-oriented occupations are Education Instruction & Library (83.2%), Education, Arts & Media (77.7%), and Health Diagnosing & Treating (69.9%).
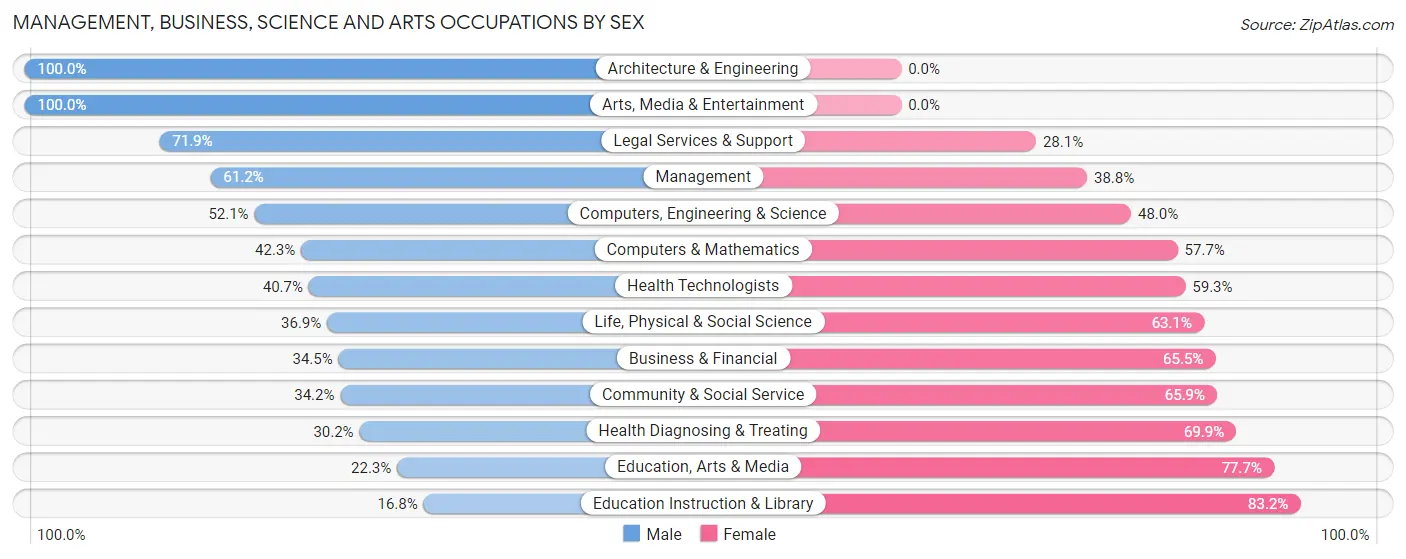
| Occupation | Male | Female |
| Management | 799 (61.2%) | 506 (38.8%) |
| Business & Financial | 302 (34.5%) | 573 (65.5%) |
| Computers, Engineering & Science | 356 (52.0%) | 328 (47.9%) |
| Computers & Mathematics | 193 (42.3%) | 263 (57.7%) |
| Architecture & Engineering | 125 (100.0%) | 0 (0.0%) |
| Life, Physical & Social Science | 38 (36.9%) | 65 (63.1%) |
| Community & Social Service | 336 (34.2%) | 648 (65.8%) |
| Education, Arts & Media | 37 (22.3%) | 129 (77.7%) |
| Legal Services & Support | 46 (71.9%) | 18 (28.1%) |
| Education Instruction & Library | 101 (16.8%) | 501 (83.2%) |
| Arts, Media & Entertainment | 152 (100.0%) | 0 (0.0%) |
| Health Diagnosing & Treating | 79 (30.1%) | 183 (69.9%) |
| Health Technologists | 79 (40.7%) | 115 (59.3%) |
| Total (Category) | 1,872 (45.6%) | 2,238 (54.4%) |
| Total (Overall) | 4,137 (49.7%) | 4,182 (50.3%) |
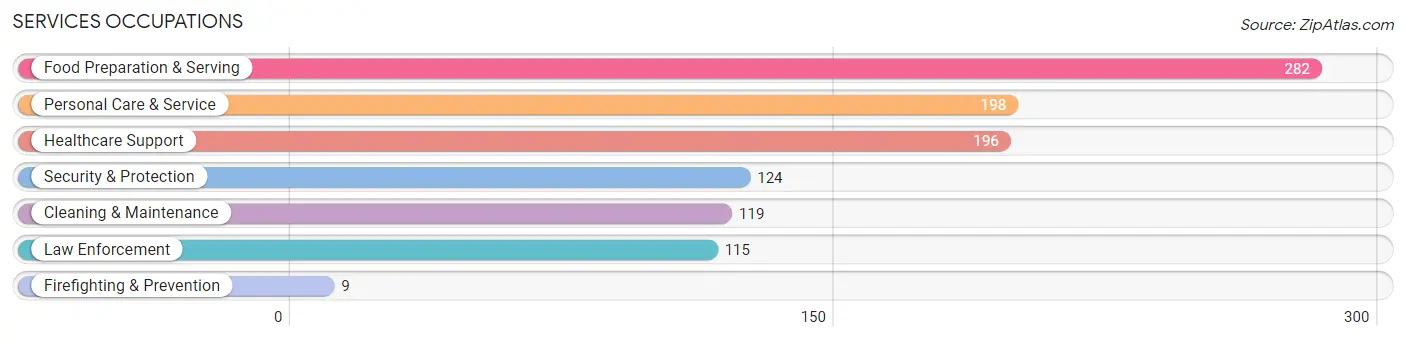
Services Occupations
The most common Services occupations in Glen Allen are Food Preparation & Serving (282 | 3.4%), Personal Care & Service (198 | 2.4%), Healthcare Support (196 | 2.4%), Security & Protection (124 | 1.5%), and Cleaning & Maintenance (119 | 1.4%).
Services Occupations by Sex
Within the Services occupations in Glen Allen, the most male-oriented occupations are Security & Protection (100.0%), Firefighting & Prevention (100.0%), and Law Enforcement (100.0%), while the most female-oriented occupations are Healthcare Support (92.3%), Cleaning & Maintenance (72.3%), and Personal Care & Service (53.5%).
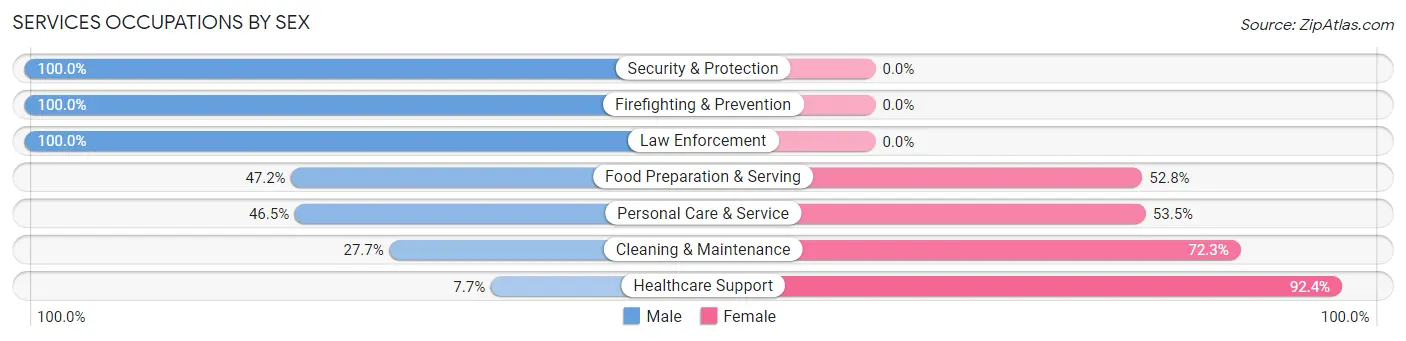
| Occupation | Male | Female |
| Healthcare Support | 15 (7.6%) | 181 (92.3%) |
| Security & Protection | 124 (100.0%) | 0 (0.0%) |
| Firefighting & Prevention | 9 (100.0%) | 0 (0.0%) |
| Law Enforcement | 115 (100.0%) | 0 (0.0%) |
| Food Preparation & Serving | 133 (47.2%) | 149 (52.8%) |
| Cleaning & Maintenance | 33 (27.7%) | 86 (72.3%) |
| Personal Care & Service | 92 (46.5%) | 106 (53.5%) |
| Total (Category) | 397 (43.2%) | 522 (56.8%) |
| Total (Overall) | 4,137 (49.7%) | 4,182 (50.3%) |
Sales and Office Occupations
The most common Sales and Office occupations in Glen Allen are Office & Administration (1,156 | 13.9%), and Sales & Related (896 | 10.8%).
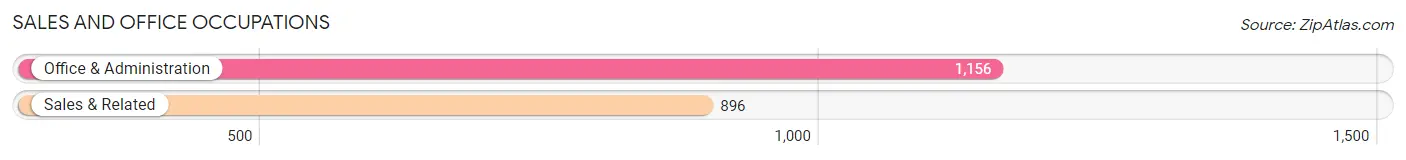
Sales and Office Occupations by Sex
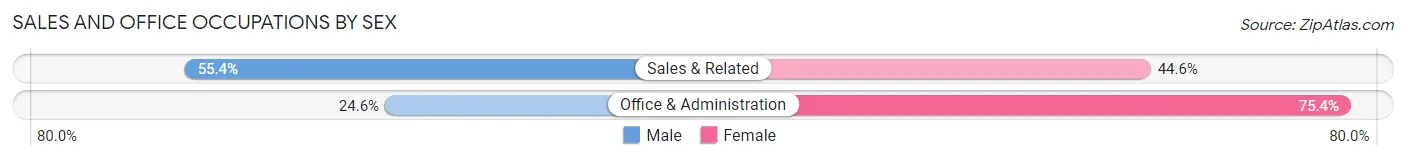
| Occupation | Male | Female |
| Sales & Related | 496 (55.4%) | 400 (44.6%) |
| Office & Administration | 284 (24.6%) | 872 (75.4%) |
| Total (Category) | 780 (38.0%) | 1,272 (62.0%) |
| Total (Overall) | 4,137 (49.7%) | 4,182 (50.3%) |
Natural Resources, Construction and Maintenance Occupations
The most common Natural Resources, Construction and Maintenance occupations in Glen Allen are Installation, Maintenance & Repair (331 | 4.0%), Construction & Extraction (327 | 3.9%), and Farming, Fishing & Forestry (18 | 0.2%).
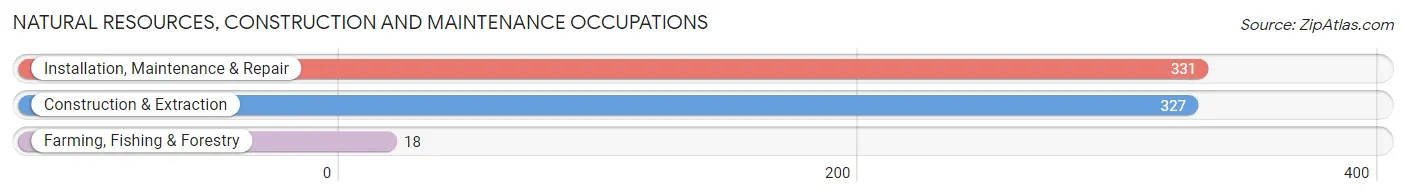
Natural Resources, Construction and Maintenance Occupations by Sex
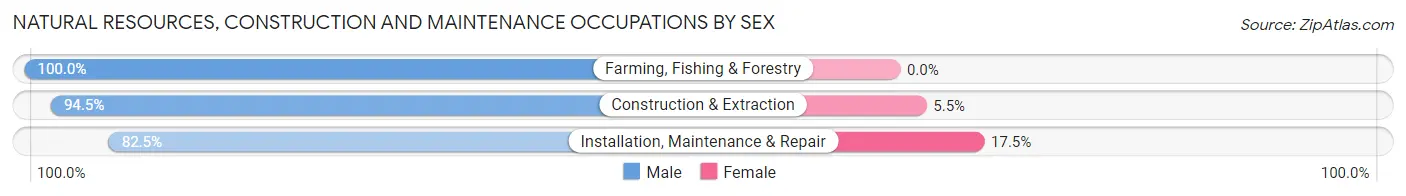
| Occupation | Male | Female |
| Farming, Fishing & Forestry | 18 (100.0%) | 0 (0.0%) |
| Construction & Extraction | 309 (94.5%) | 18 (5.5%) |
| Installation, Maintenance & Repair | 273 (82.5%) | 58 (17.5%) |
| Total (Category) | 600 (88.8%) | 76 (11.2%) |
| Total (Overall) | 4,137 (49.7%) | 4,182 (50.3%) |
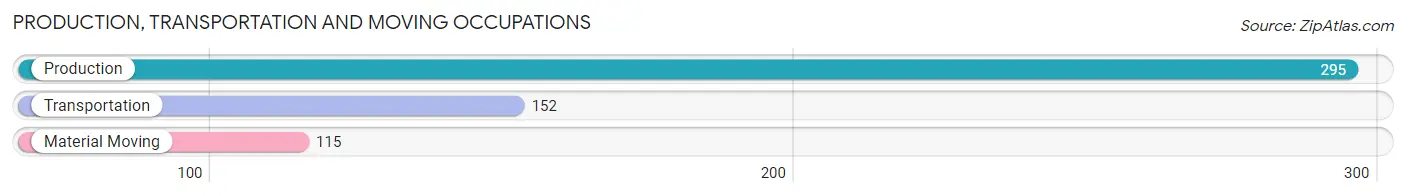
Production, Transportation and Moving Occupations
The most common Production, Transportation and Moving occupations in Glen Allen are Production (295 | 3.5%), Transportation (152 | 1.8%), and Material Moving (115 | 1.4%).
Production, Transportation and Moving Occupations by Sex
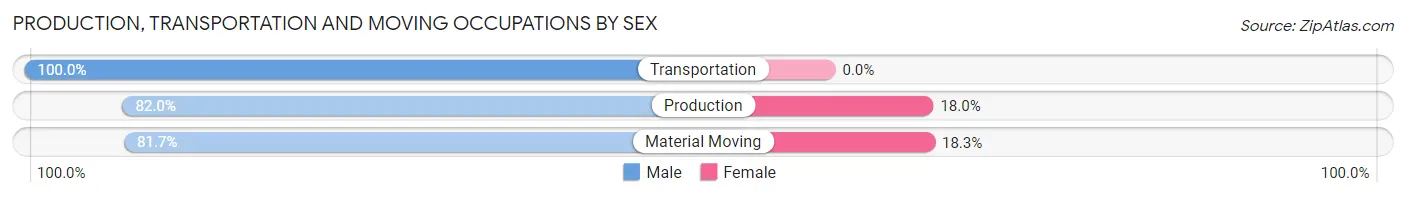
| Occupation | Male | Female |
| Production | 242 (82.0%) | 53 (18.0%) |
| Transportation | 152 (100.0%) | 0 (0.0%) |
| Material Moving | 94 (81.7%) | 21 (18.3%) |
| Total (Category) | 488 (86.8%) | 74 (13.2%) |
| Total (Overall) | 4,137 (49.7%) | 4,182 (50.3%) |
Employment Industries by Sex in Glen Allen
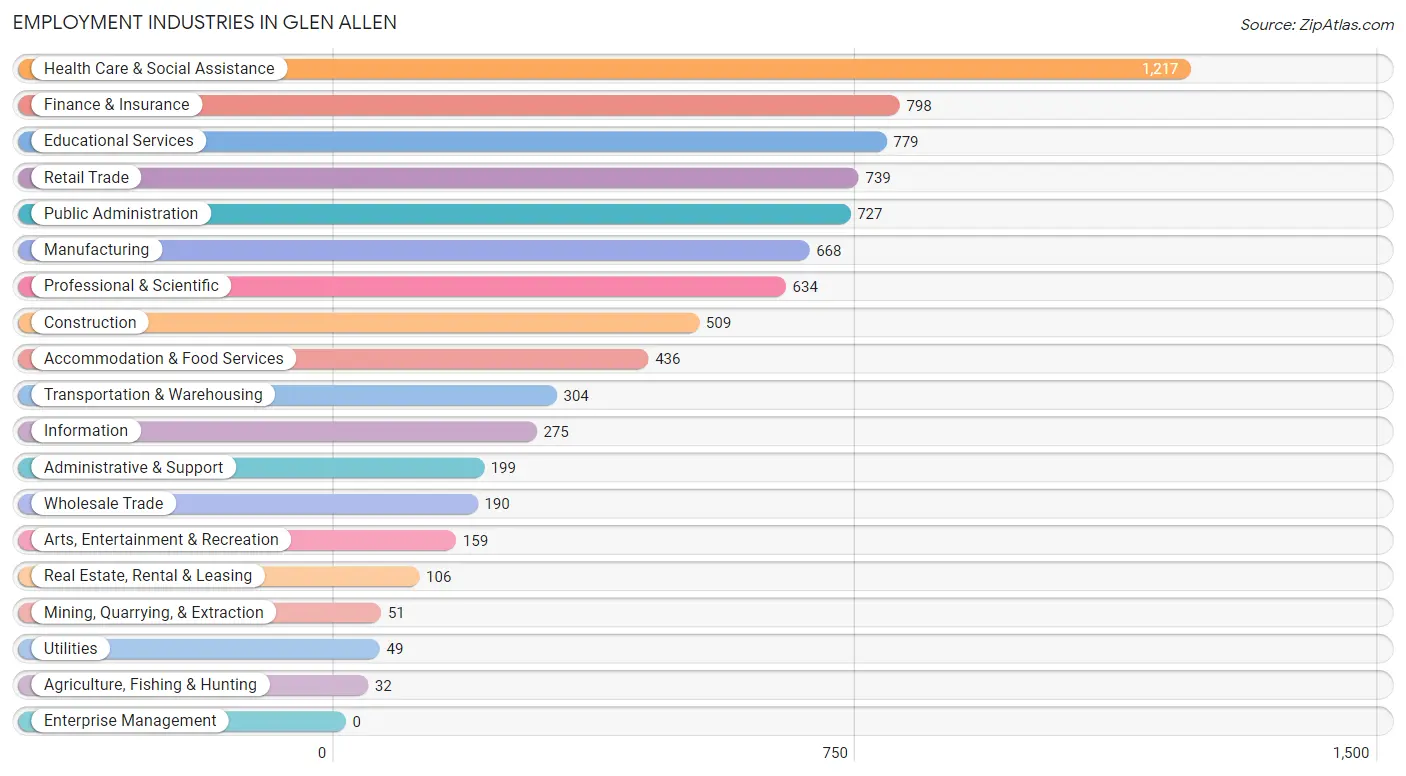
Employment Industries in Glen Allen
The major employment industries in Glen Allen include Health Care & Social Assistance (1,217 | 14.6%), Finance & Insurance (798 | 9.6%), Educational Services (779 | 9.4%), Retail Trade (739 | 8.9%), and Public Administration (727 | 8.7%).
Employment Industries by Sex in Glen Allen
The Glen Allen industries that see more men than women are Construction (96.5%), Manufacturing (85.5%), and Real Estate, Rental & Leasing (72.6%), whereas the industries that tend to have a higher number of women are Mining, Quarrying, & Extraction (100.0%), Health Care & Social Assistance (82.2%), and Educational Services (77.7%).
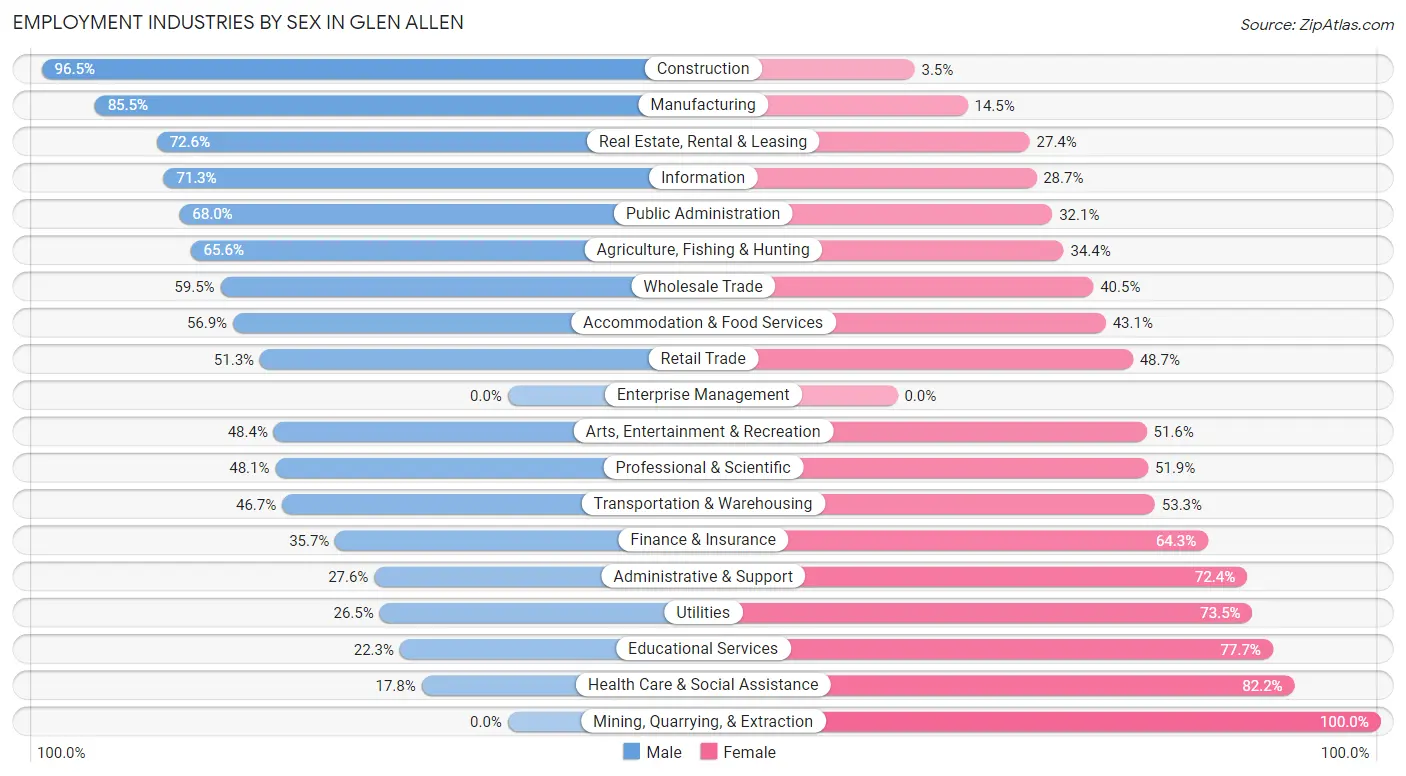
| Industry | Male | Female |
| Agriculture, Fishing & Hunting | 21 (65.6%) | 11 (34.4%) |
| Mining, Quarrying, & Extraction | 0 (0.0%) | 51 (100.0%) |
| Construction | 491 (96.5%) | 18 (3.5%) |
| Manufacturing | 571 (85.5%) | 97 (14.5%) |
| Wholesale Trade | 113 (59.5%) | 77 (40.5%) |
| Retail Trade | 379 (51.3%) | 360 (48.7%) |
| Transportation & Warehousing | 142 (46.7%) | 162 (53.3%) |
| Utilities | 13 (26.5%) | 36 (73.5%) |
| Information | 196 (71.3%) | 79 (28.7%) |
| Finance & Insurance | 285 (35.7%) | 513 (64.3%) |
| Real Estate, Rental & Leasing | 77 (72.6%) | 29 (27.4%) |
| Professional & Scientific | 305 (48.1%) | 329 (51.9%) |
| Enterprise Management | 0 (0.0%) | 0 (0.0%) |
| Administrative & Support | 55 (27.6%) | 144 (72.4%) |
| Educational Services | 174 (22.3%) | 605 (77.7%) |
| Health Care & Social Assistance | 217 (17.8%) | 1,000 (82.2%) |
| Arts, Entertainment & Recreation | 77 (48.4%) | 82 (51.6%) |
| Accommodation & Food Services | 248 (56.9%) | 188 (43.1%) |
| Public Administration | 494 (67.9%) | 233 (32.1%) |
| Total | 4,137 (49.7%) | 4,182 (50.3%) |
Education in Glen Allen
School Enrollment in Glen Allen
The most common levels of schooling among the 3,895 students in Glen Allen are elementary school (1,112 | 28.5%), middle school (919 | 23.6%), and high school (735 | 18.9%).
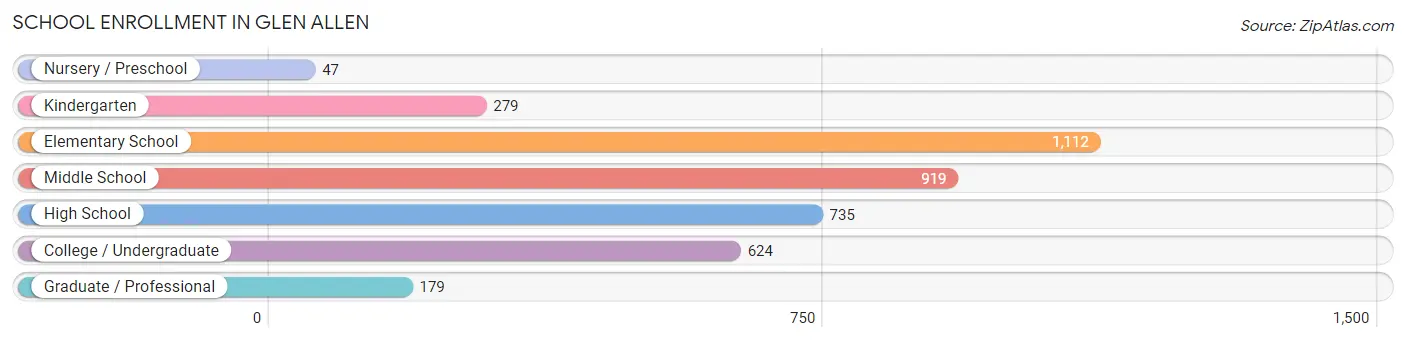
| School Level | # Students | % Students |
| Nursery / Preschool | 47 | 1.2% |
| Kindergarten | 279 | 7.2% |
| Elementary School | 1,112 | 28.5% |
| Middle School | 919 | 23.6% |
| High School | 735 | 18.9% |
| College / Undergraduate | 624 | 16.0% |
| Graduate / Professional | 179 | 4.6% |
| Total | 3,895 | 100.0% |
School Enrollment by Age by Funding Source in Glen Allen
Out of a total of 3,895 students who are enrolled in schools in Glen Allen, 358 (9.2%) attend a private institution, while the remaining 3,537 (90.8%) are enrolled in public schools. The age group of 3 to 4 year olds has the highest likelihood of being enrolled in private schools, with 22 (57.9% in the age bracket) enrolled. Conversely, the age group of 18 to 19 year olds has the lowest likelihood of being enrolled in a private school, with 197 (97.0% in the age bracket) attending a public institution.
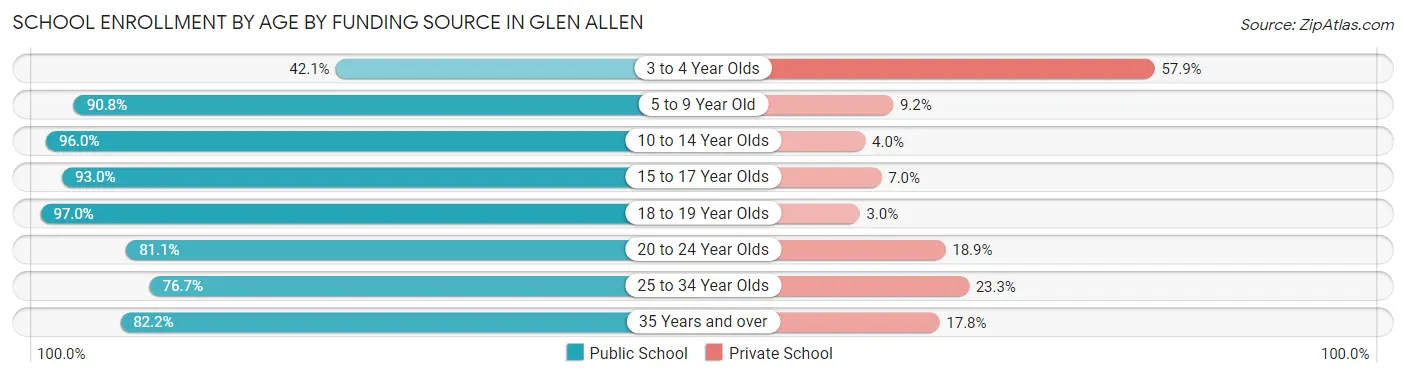
| Age Bracket | Public School | Private School |
| 3 to 4 Year Olds | 16 (42.1%) | 22 (57.9%) |
| 5 to 9 Year Old | 1,049 (90.8%) | 106 (9.2%) |
| 10 to 14 Year Olds | 1,223 (96.0%) | 51 (4.0%) |
| 15 to 17 Year Olds | 478 (93.0%) | 36 (7.0%) |
| 18 to 19 Year Olds | 197 (97.0%) | 6 (3.0%) |
| 20 to 24 Year Olds | 317 (81.1%) | 74 (18.9%) |
| 25 to 34 Year Olds | 112 (76.7%) | 34 (23.3%) |
| 35 Years and over | 143 (82.2%) | 31 (17.8%) |
| Total | 3,537 (90.8%) | 358 (9.2%) |
Educational Attainment by Field of Study in Glen Allen
Business (1,017 | 20.3%), social sciences (566 | 11.3%), arts & humanities (525 | 10.5%), computers & mathematics (482 | 9.6%), and education (382 | 7.6%) are the most common fields of study among 5,015 individuals in Glen Allen who have obtained a bachelor's degree or higher.
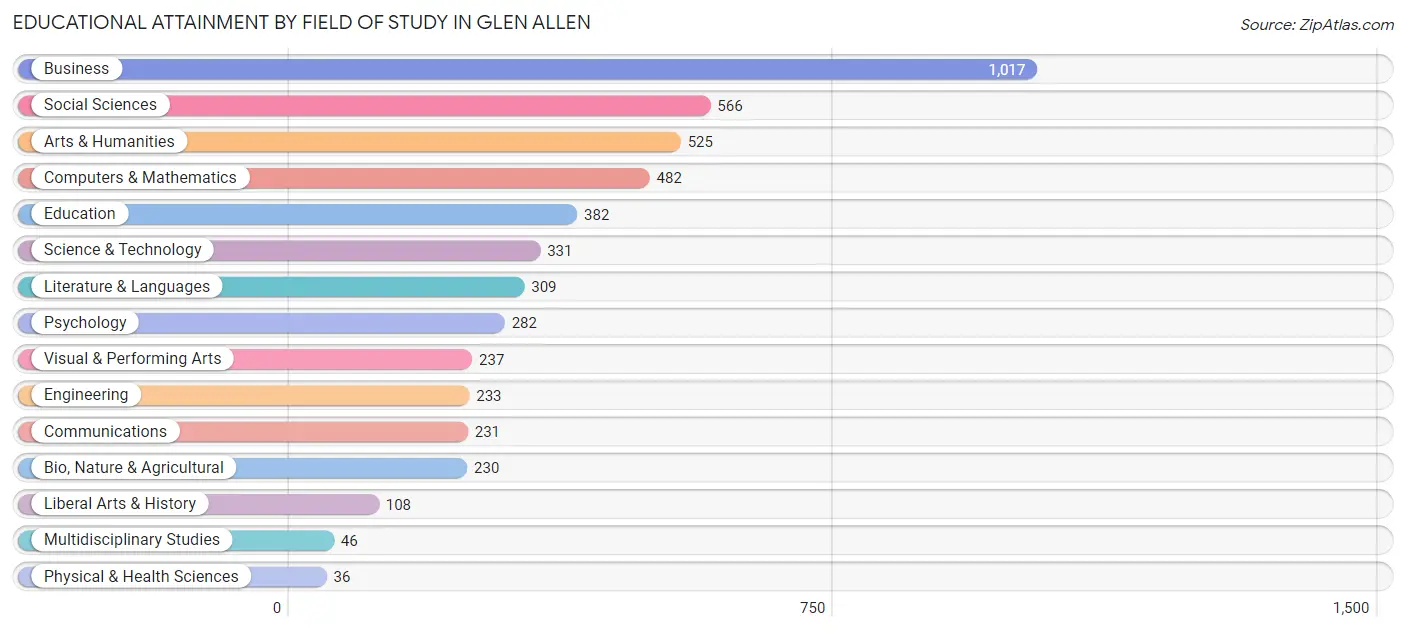
| Field of Study | # Graduates | % Graduates |
| Computers & Mathematics | 482 | 9.6% |
| Bio, Nature & Agricultural | 230 | 4.6% |
| Physical & Health Sciences | 36 | 0.7% |
| Psychology | 282 | 5.6% |
| Social Sciences | 566 | 11.3% |
| Engineering | 233 | 4.6% |
| Multidisciplinary Studies | 46 | 0.9% |
| Science & Technology | 331 | 6.6% |
| Business | 1,017 | 20.3% |
| Education | 382 | 7.6% |
| Literature & Languages | 309 | 6.2% |
| Liberal Arts & History | 108 | 2.1% |
| Visual & Performing Arts | 237 | 4.7% |
| Communications | 231 | 4.6% |
| Arts & Humanities | 525 | 10.5% |
| Total | 5,015 | 100.0% |
Transportation & Commute in Glen Allen
Vehicle Availability by Sex in Glen Allen
The most prevalent vehicle ownership categories in Glen Allen are males with 2 vehicles (1,682, accounting for 40.5%) and females with 2 vehicles (1,169, making up 41.0%).
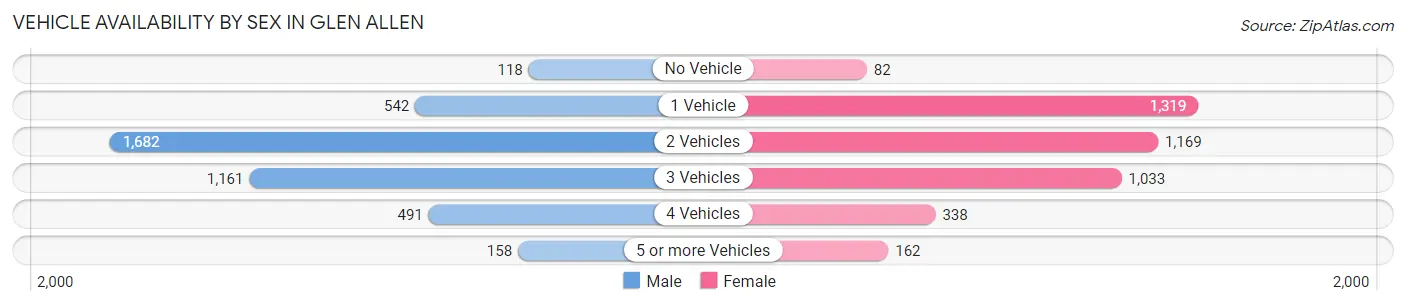
| Vehicles Available | Male | Female |
| No Vehicle | 118 (2.8%) | 82 (2.0%) |
| 1 Vehicle | 542 (13.1%) | 1,319 (32.2%) |
| 2 Vehicles | 1,682 (40.5%) | 1,169 (28.5%) |
| 3 Vehicles | 1,161 (28.0%) | 1,033 (25.2%) |
| 4 Vehicles | 491 (11.8%) | 338 (8.2%) |
| 5 or more Vehicles | 158 (3.8%) | 162 (4.0%) |
| Total | 4,152 (100.0%) | 4,103 (100.0%) |
Commute Time in Glen Allen
The most frequently occuring commute durations in Glen Allen are 15 to 19 minutes (1,598 commuters, 25.1%), 20 to 24 minutes (1,027 commuters, 16.1%), and 10 to 14 minutes (961 commuters, 15.1%).
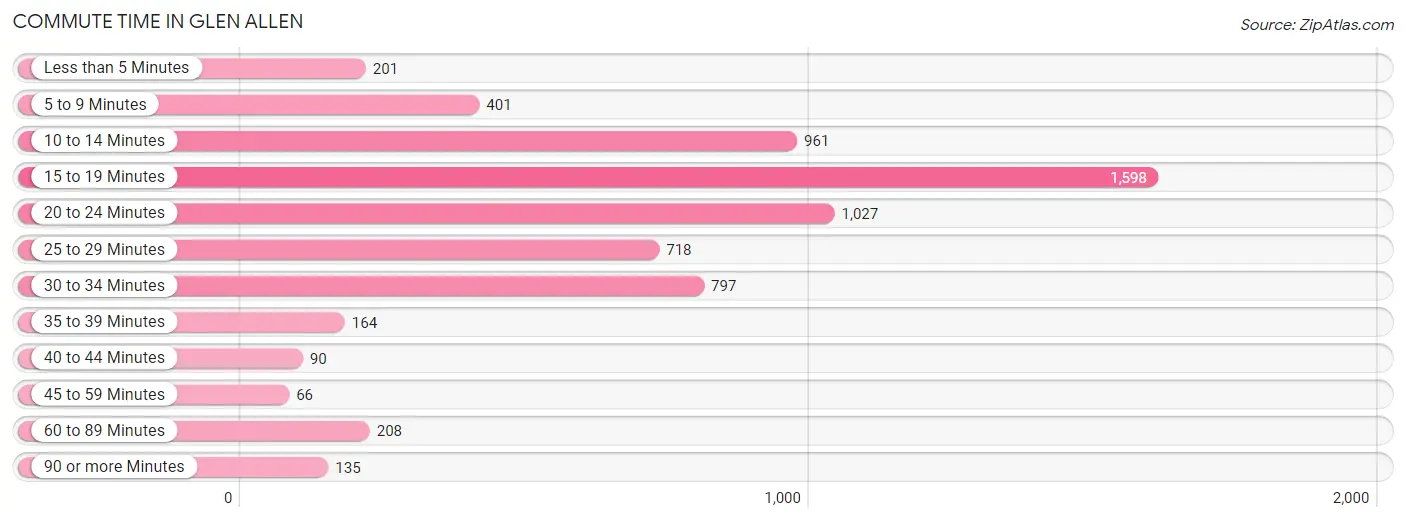
| Commute Time | # Commuters | % Commuters |
| Less than 5 Minutes | 201 | 3.2% |
| 5 to 9 Minutes | 401 | 6.3% |
| 10 to 14 Minutes | 961 | 15.1% |
| 15 to 19 Minutes | 1,598 | 25.1% |
| 20 to 24 Minutes | 1,027 | 16.1% |
| 25 to 29 Minutes | 718 | 11.3% |
| 30 to 34 Minutes | 797 | 12.5% |
| 35 to 39 Minutes | 164 | 2.6% |
| 40 to 44 Minutes | 90 | 1.4% |
| 45 to 59 Minutes | 66 | 1.0% |
| 60 to 89 Minutes | 208 | 3.3% |
| 90 or more Minutes | 135 | 2.1% |
Commute Time by Sex in Glen Allen
The most common commute times in Glen Allen are 15 to 19 minutes (762 commuters, 23.1%) for males and 15 to 19 minutes (836 commuters, 27.3%) for females.
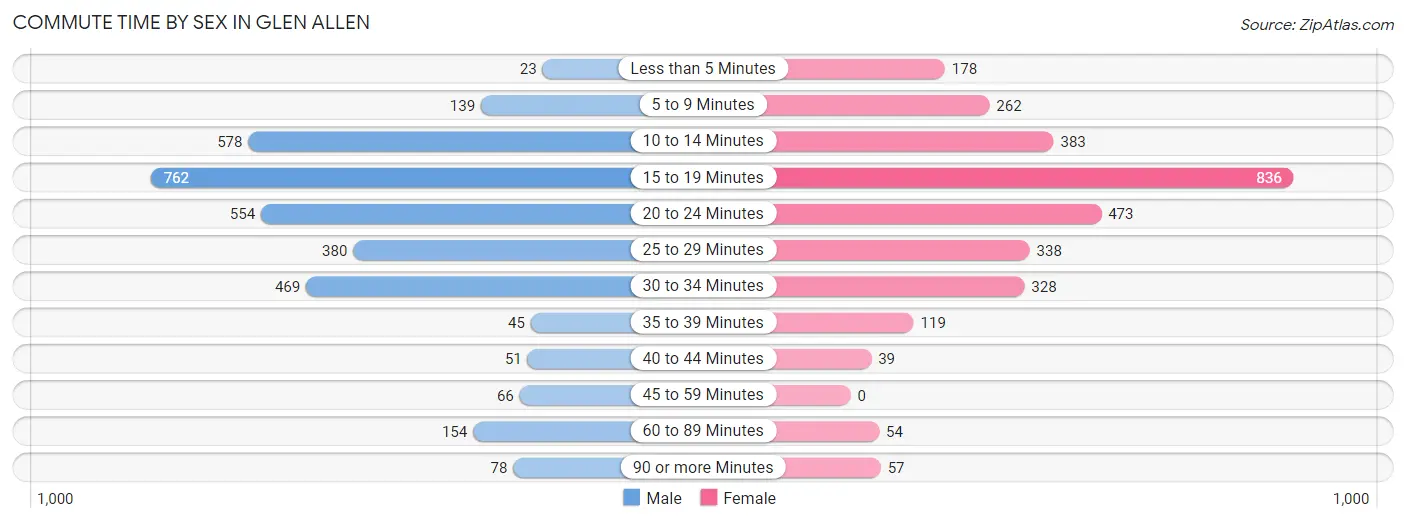
| Commute Time | Male | Female |
| Less than 5 Minutes | 23 (0.7%) | 178 (5.8%) |
| 5 to 9 Minutes | 139 (4.2%) | 262 (8.5%) |
| 10 to 14 Minutes | 578 (17.5%) | 383 (12.5%) |
| 15 to 19 Minutes | 762 (23.1%) | 836 (27.3%) |
| 20 to 24 Minutes | 554 (16.8%) | 473 (15.4%) |
| 25 to 29 Minutes | 380 (11.5%) | 338 (11.0%) |
| 30 to 34 Minutes | 469 (14.2%) | 328 (10.7%) |
| 35 to 39 Minutes | 45 (1.4%) | 119 (3.9%) |
| 40 to 44 Minutes | 51 (1.5%) | 39 (1.3%) |
| 45 to 59 Minutes | 66 (2.0%) | 0 (0.0%) |
| 60 to 89 Minutes | 154 (4.7%) | 54 (1.8%) |
| 90 or more Minutes | 78 (2.4%) | 57 (1.9%) |
Time of Departure to Work by Sex in Glen Allen
The most frequent times of departure to work in Glen Allen are 7:00 AM to 7:29 AM (650, 19.7%) for males and 7:30 AM to 7:59 AM (702, 22.9%) for females.
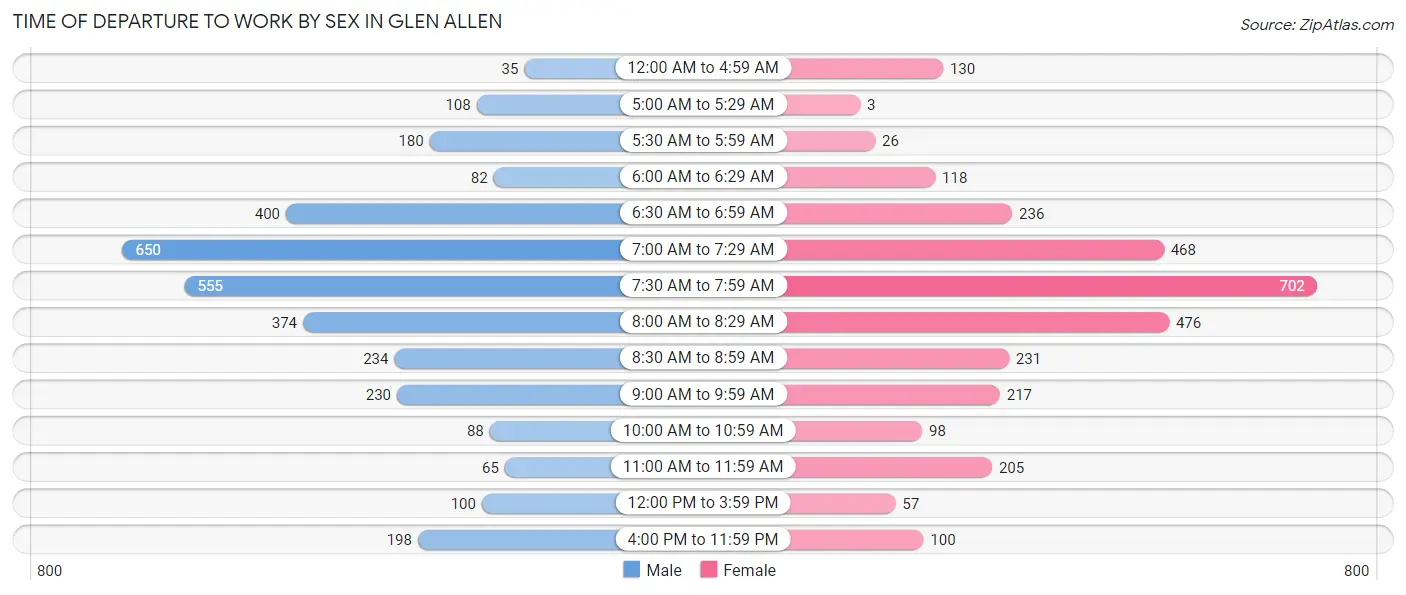
| Time of Departure | Male | Female |
| 12:00 AM to 4:59 AM | 35 (1.1%) | 130 (4.2%) |
| 5:00 AM to 5:29 AM | 108 (3.3%) | 3 (0.1%) |
| 5:30 AM to 5:59 AM | 180 (5.5%) | 26 (0.9%) |
| 6:00 AM to 6:29 AM | 82 (2.5%) | 118 (3.8%) |
| 6:30 AM to 6:59 AM | 400 (12.1%) | 236 (7.7%) |
| 7:00 AM to 7:29 AM | 650 (19.7%) | 468 (15.3%) |
| 7:30 AM to 7:59 AM | 555 (16.8%) | 702 (22.9%) |
| 8:00 AM to 8:29 AM | 374 (11.3%) | 476 (15.5%) |
| 8:30 AM to 8:59 AM | 234 (7.1%) | 231 (7.5%) |
| 9:00 AM to 9:59 AM | 230 (7.0%) | 217 (7.1%) |
| 10:00 AM to 10:59 AM | 88 (2.7%) | 98 (3.2%) |
| 11:00 AM to 11:59 AM | 65 (2.0%) | 205 (6.7%) |
| 12:00 PM to 3:59 PM | 100 (3.0%) | 57 (1.9%) |
| 4:00 PM to 11:59 PM | 198 (6.0%) | 100 (3.3%) |
| Total | 3,299 (100.0%) | 3,067 (100.0%) |
Housing Occupancy in Glen Allen
Occupancy by Ownership in Glen Allen
Of the total 6,339 dwellings in Glen Allen, owner-occupied units account for 4,677 (73.8%), while renter-occupied units make up 1,662 (26.2%).
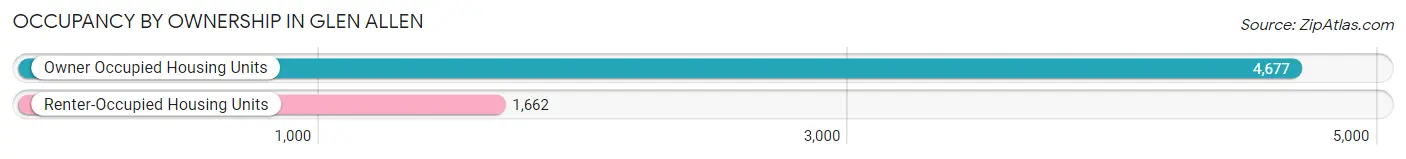
| Occupancy | # Housing Units | % Housing Units |
| Owner Occupied Housing Units | 4,677 | 73.8% |
| Renter-Occupied Housing Units | 1,662 | 26.2% |
| Total Occupied Housing Units | 6,339 | 100.0% |
Occupancy by Household Size in Glen Allen
| Household Size | # Housing Units | % Housing Units |
| 1-Person Household | 1,748 | 27.6% |
| 2-Person Household | 2,314 | 36.5% |
| 3-Person Household | 842 | 13.3% |
| 4+ Person Household | 1,435 | 22.6% |
| Total Housing Units | 6,339 | 100.0% |
Occupancy by Ownership by Household Size in Glen Allen
| Household Size | Owner-occupied | Renter-occupied |
| 1-Person Household | 1,289 (73.7%) | 459 (26.3%) |
| 2-Person Household | 1,685 (72.8%) | 629 (27.2%) |
| 3-Person Household | 643 (76.4%) | 199 (23.6%) |
| 4+ Person Household | 1,060 (73.9%) | 375 (26.1%) |
| Total Housing Units | 4,677 (73.8%) | 1,662 (26.2%) |
Occupancy by Educational Attainment in Glen Allen
| Household Size | Owner-occupied | Renter-occupied |
| Less than High School | 175 (67.8%) | 83 (32.2%) |
| High School Diploma | 915 (77.3%) | 269 (22.7%) |
| College/Associate Degree | 1,262 (62.0%) | 775 (38.1%) |
| Bachelor's Degree or higher | 2,325 (81.3%) | 535 (18.7%) |
Occupancy by Age of Householder in Glen Allen
| Age Bracket | # Households | % Households |
| Under 35 Years | 809 | 12.8% |
| 35 to 44 Years | 1,474 | 23.3% |
| 45 to 54 Years | 1,467 | 23.1% |
| 55 to 64 Years | 977 | 15.4% |
| 65 to 74 Years | 1,134 | 17.9% |
| 75 to 84 Years | 280 | 4.4% |
| 85 Years and Over | 198 | 3.1% |
| Total | 6,339 | 100.0% |
Housing Finances in Glen Allen
Median Income by Occupancy in Glen Allen
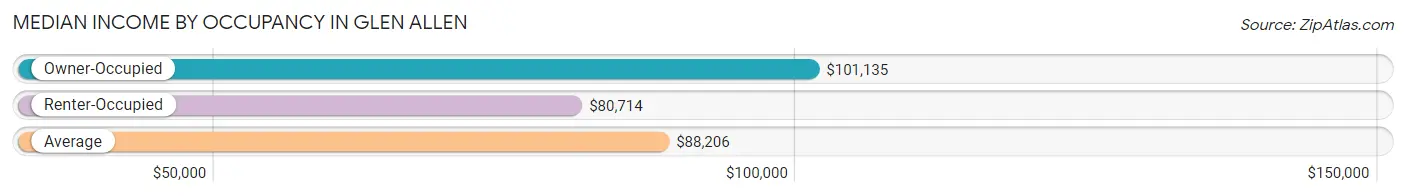
| Occupancy Type | # Households | Median Income |
| Owner-Occupied | 4,677 (73.8%) | $101,135 |
| Renter-Occupied | 1,662 (26.2%) | $80,714 |
| Average | 6,339 (100.0%) | $88,206 |
Occupancy by Householder Income Bracket in Glen Allen
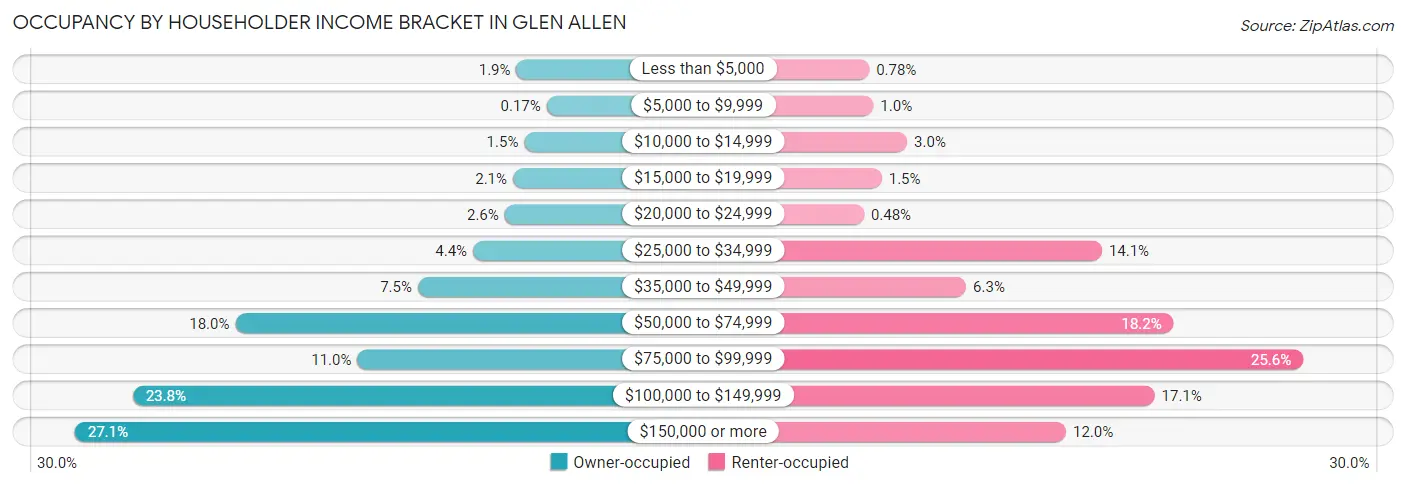
| Income Bracket | Owner-occupied | Renter-occupied |
| Less than $5,000 | 89 (1.9%) | 13 (0.8%) |
| $5,000 to $9,999 | 8 (0.2%) | 17 (1.0%) |
| $10,000 to $14,999 | 68 (1.5%) | 49 (2.9%) |
| $15,000 to $19,999 | 98 (2.1%) | 25 (1.5%) |
| $20,000 to $24,999 | 120 (2.6%) | 8 (0.5%) |
| $25,000 to $34,999 | 205 (4.4%) | 234 (14.1%) |
| $35,000 to $49,999 | 352 (7.5%) | 105 (6.3%) |
| $50,000 to $74,999 | 840 (18.0%) | 302 (18.2%) |
| $75,000 to $99,999 | 514 (11.0%) | 425 (25.6%) |
| $100,000 to $149,999 | 1,114 (23.8%) | 284 (17.1%) |
| $150,000 or more | 1,269 (27.1%) | 200 (12.0%) |
| Total | 4,677 (100.0%) | 1,662 (100.0%) |
Monthly Housing Cost Tiers in Glen Allen
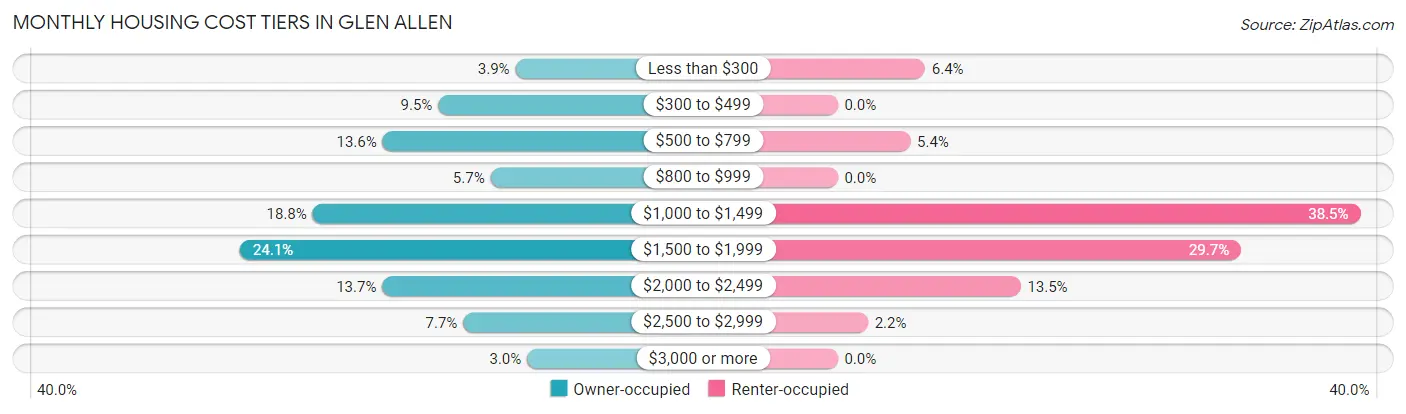
| Monthly Cost | Owner-occupied | Renter-occupied |
| Less than $300 | 180 (3.8%) | 107 (6.4%) |
| $300 to $499 | 446 (9.5%) | 0 (0.0%) |
| $500 to $799 | 638 (13.6%) | 89 (5.3%) |
| $800 to $999 | 266 (5.7%) | 0 (0.0%) |
| $1,000 to $1,499 | 879 (18.8%) | 640 (38.5%) |
| $1,500 to $1,999 | 1,129 (24.1%) | 494 (29.7%) |
| $2,000 to $2,499 | 639 (13.7%) | 224 (13.5%) |
| $2,500 to $2,999 | 360 (7.7%) | 37 (2.2%) |
| $3,000 or more | 140 (3.0%) | 0 (0.0%) |
| Total | 4,677 (100.0%) | 1,662 (100.0%) |
Physical Housing Characteristics in Glen Allen
Housing Structures in Glen Allen
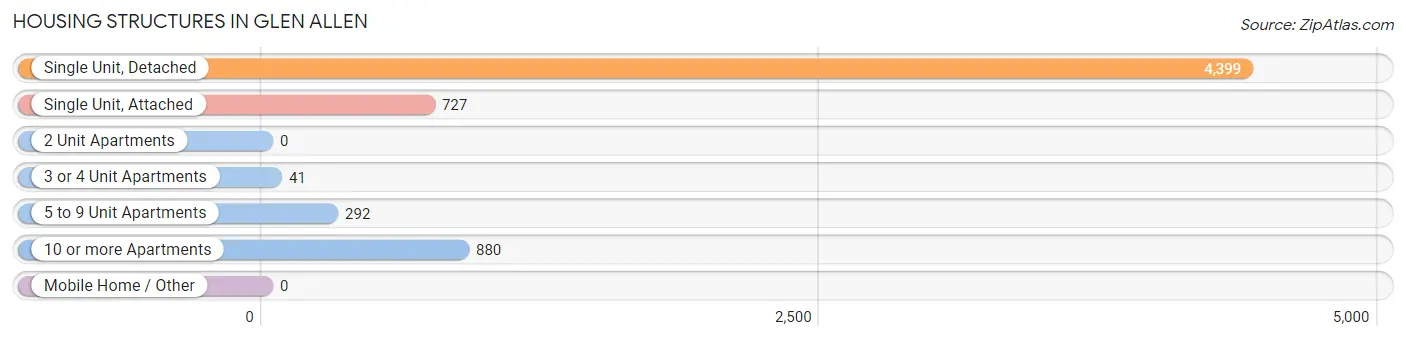
| Structure Type | # Housing Units | % Housing Units |
| Single Unit, Detached | 4,399 | 69.4% |
| Single Unit, Attached | 727 | 11.5% |
| 2 Unit Apartments | 0 | 0.0% |
| 3 or 4 Unit Apartments | 41 | 0.6% |
| 5 to 9 Unit Apartments | 292 | 4.6% |
| 10 or more Apartments | 880 | 13.9% |
| Mobile Home / Other | 0 | 0.0% |
| Total | 6,339 | 100.0% |
Housing Structures by Occupancy in Glen Allen
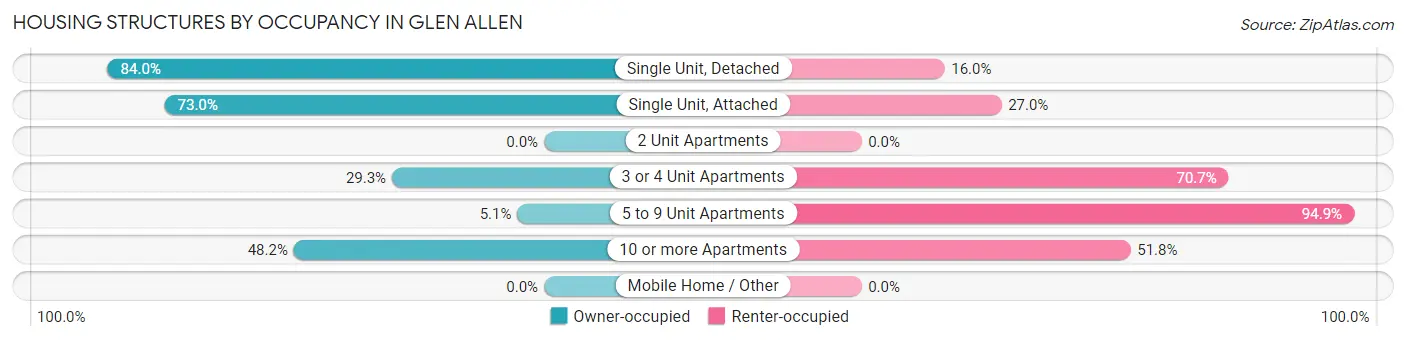
| Structure Type | Owner-occupied | Renter-occupied |
| Single Unit, Detached | 3,695 (84.0%) | 704 (16.0%) |
| Single Unit, Attached | 531 (73.0%) | 196 (27.0%) |
| 2 Unit Apartments | 0 (0.0%) | 0 (0.0%) |
| 3 or 4 Unit Apartments | 12 (29.3%) | 29 (70.7%) |
| 5 to 9 Unit Apartments | 15 (5.1%) | 277 (94.9%) |
| 10 or more Apartments | 424 (48.2%) | 456 (51.8%) |
| Mobile Home / Other | 0 (0.0%) | 0 (0.0%) |
| Total | 4,677 (73.8%) | 1,662 (26.2%) |
Housing Structures by Number of Rooms in Glen Allen
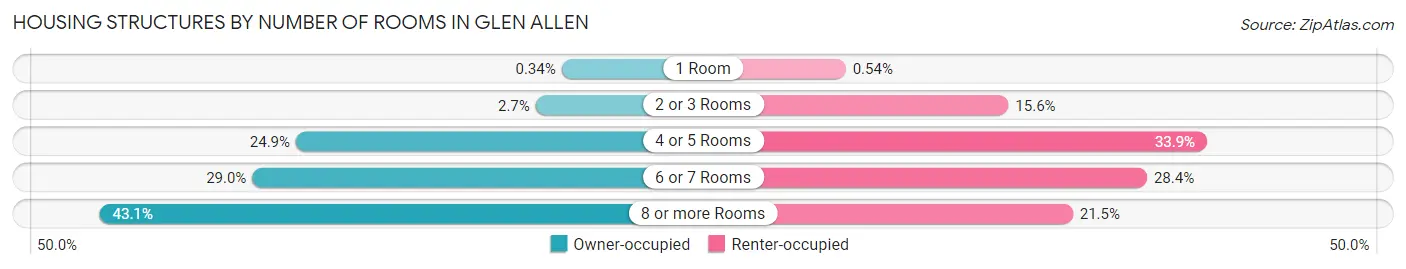
| Number of Rooms | Owner-occupied | Renter-occupied |
| 1 Room | 16 (0.3%) | 9 (0.5%) |
| 2 or 3 Rooms | 128 (2.7%) | 259 (15.6%) |
| 4 or 5 Rooms | 1,165 (24.9%) | 564 (33.9%) |
| 6 or 7 Rooms | 1,354 (28.9%) | 472 (28.4%) |
| 8 or more Rooms | 2,014 (43.1%) | 358 (21.5%) |
| Total | 4,677 (100.0%) | 1,662 (100.0%) |
Housing Structure by Heating Type in Glen Allen
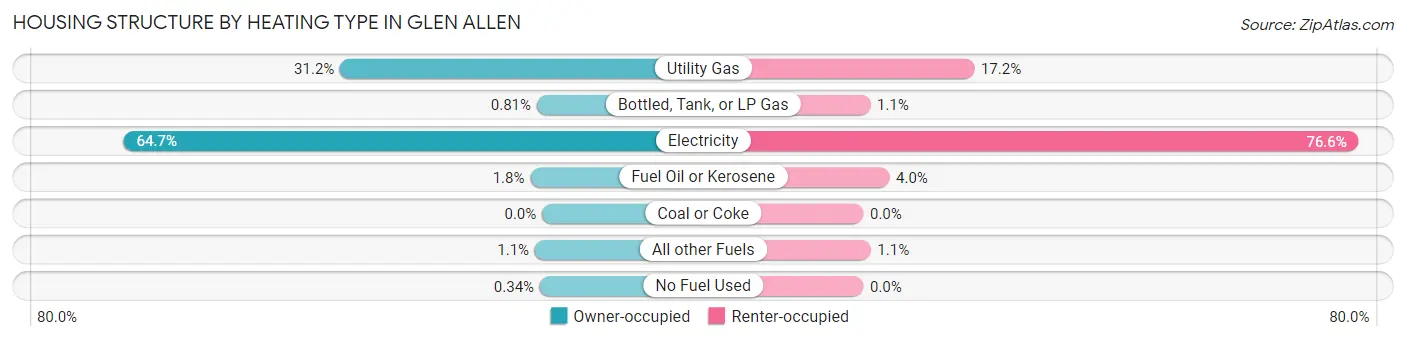
| Heating Type | Owner-occupied | Renter-occupied |
| Utility Gas | 1,460 (31.2%) | 285 (17.2%) |
| Bottled, Tank, or LP Gas | 38 (0.8%) | 18 (1.1%) |
| Electricity | 3,026 (64.7%) | 1,273 (76.6%) |
| Fuel Oil or Kerosene | 85 (1.8%) | 67 (4.0%) |
| Coal or Coke | 0 (0.0%) | 0 (0.0%) |
| All other Fuels | 52 (1.1%) | 19 (1.1%) |
| No Fuel Used | 16 (0.3%) | 0 (0.0%) |
| Total | 4,677 (100.0%) | 1,662 (100.0%) |
Household Vehicle Usage in Glen Allen
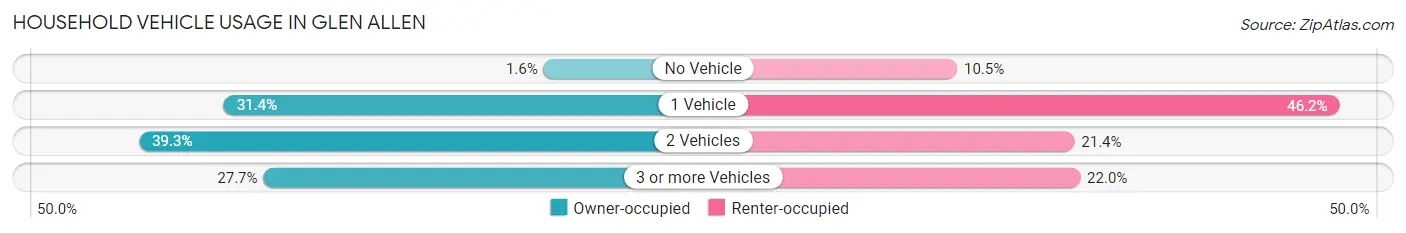
| Vehicles per Household | Owner-occupied | Renter-occupied |
| No Vehicle | 73 (1.6%) | 174 (10.5%) |
| 1 Vehicle | 1,469 (31.4%) | 767 (46.2%) |
| 2 Vehicles | 1,839 (39.3%) | 356 (21.4%) |
| 3 or more Vehicles | 1,296 (27.7%) | 365 (22.0%) |
| Total | 4,677 (100.0%) | 1,662 (100.0%) |
Real Estate & Mortgages in Glen Allen
Real Estate and Mortgage Overview in Glen Allen
| Characteristic | Without Mortgage | With Mortgage |
| Housing Units | 1,122 | 3,555 |
| Median Property Value | $272,600 | $312,700 |
| Median Household Income | $70,000 | $1,106 |
| Monthly Housing Costs | $497 | $140 |
| Real Estate Taxes | $1,929 | $123 |
Property Value by Mortgage Status in Glen Allen
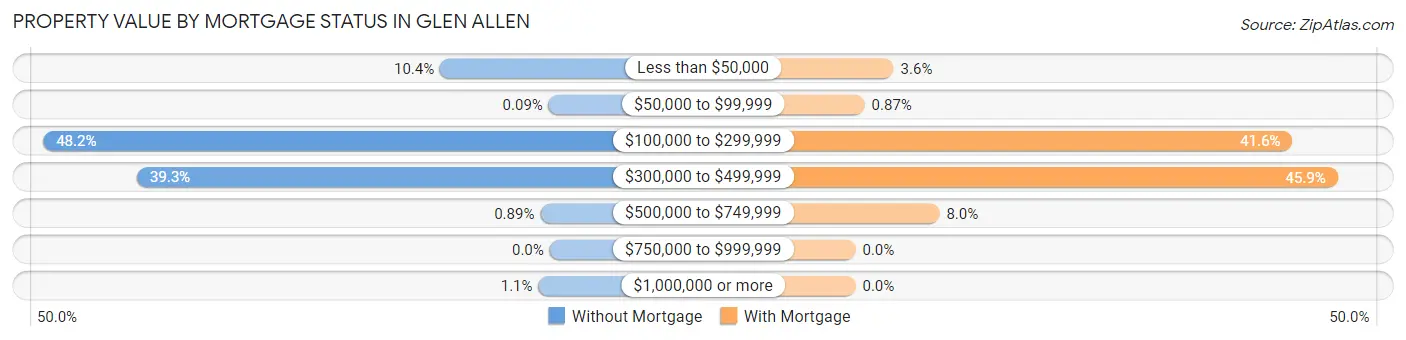
| Property Value | Without Mortgage | With Mortgage |
| Less than $50,000 | 117 (10.4%) | 129 (3.6%) |
| $50,000 to $99,999 | 1 (0.1%) | 31 (0.9%) |
| $100,000 to $299,999 | 541 (48.2%) | 1,479 (41.6%) |
| $300,000 to $499,999 | 441 (39.3%) | 1,632 (45.9%) |
| $500,000 to $749,999 | 10 (0.9%) | 284 (8.0%) |
| $750,000 to $999,999 | 0 (0.0%) | 0 (0.0%) |
| $1,000,000 or more | 12 (1.1%) | 0 (0.0%) |
| Total | 1,122 (100.0%) | 3,555 (100.0%) |
Household Income by Mortgage Status in Glen Allen
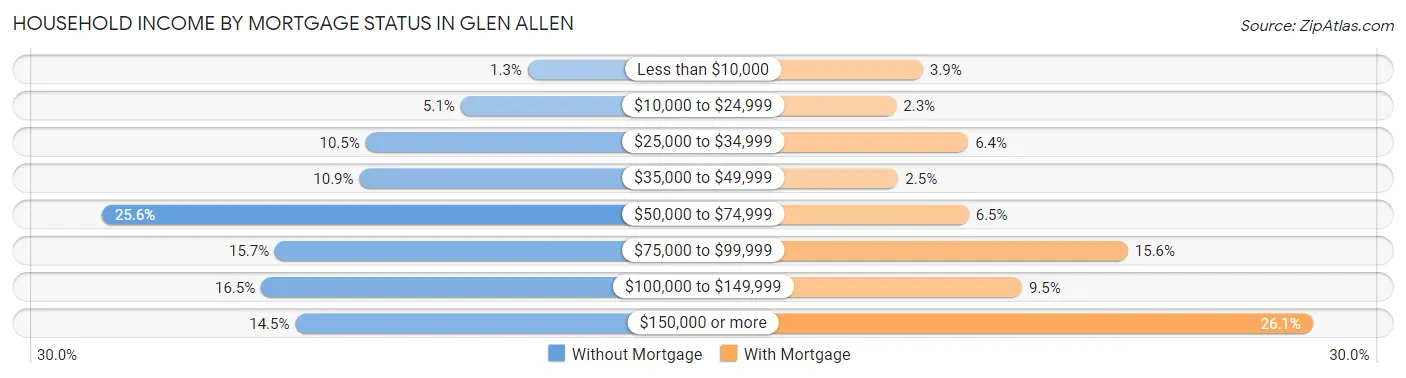
| Household Income | Without Mortgage | With Mortgage |
| Less than $10,000 | 14 (1.3%) | 137 (3.8%) |
| $10,000 to $24,999 | 57 (5.1%) | 83 (2.3%) |
| $25,000 to $34,999 | 118 (10.5%) | 229 (6.4%) |
| $35,000 to $49,999 | 122 (10.9%) | 87 (2.5%) |
| $50,000 to $74,999 | 287 (25.6%) | 230 (6.5%) |
| $75,000 to $99,999 | 176 (15.7%) | 553 (15.6%) |
| $100,000 to $149,999 | 185 (16.5%) | 338 (9.5%) |
| $150,000 or more | 163 (14.5%) | 929 (26.1%) |
| Total | 1,122 (100.0%) | 3,555 (100.0%) |
Property Value to Household Income Ratio in Glen Allen
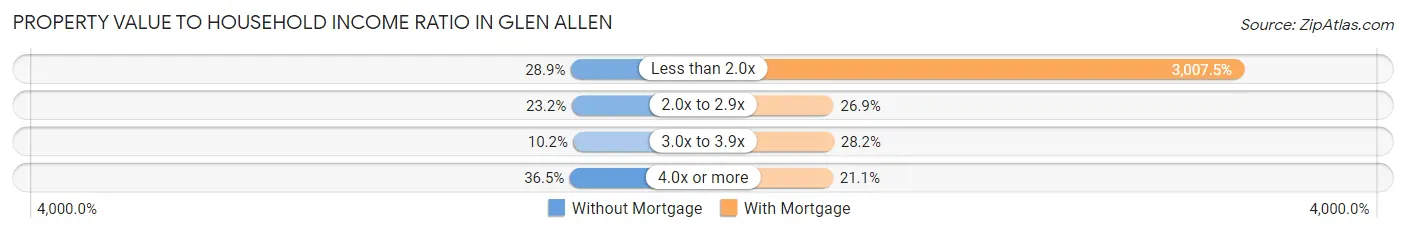
| Value-to-Income Ratio | Without Mortgage | With Mortgage |
| Less than 2.0x | 324 (28.9%) | 106,915 (3,007.5%) |
| 2.0x to 2.9x | 260 (23.2%) | 955 (26.9%) |
| 3.0x to 3.9x | 114 (10.2%) | 1,004 (28.2%) |
| 4.0x or more | 410 (36.5%) | 749 (21.1%) |
| Total | 1,122 (100.0%) | 3,555 (100.0%) |
Real Estate Taxes by Mortgage Status in Glen Allen
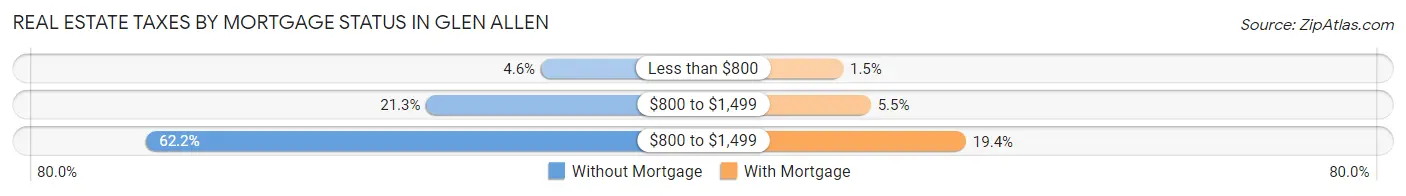
| Property Taxes | Without Mortgage | With Mortgage |
| Less than $800 | 51 (4.5%) | 52 (1.5%) |
| $800 to $1,499 | 239 (21.3%) | 196 (5.5%) |
| $800 to $1,499 | 698 (62.2%) | 690 (19.4%) |
| Total | 1,122 (100.0%) | 3,555 (100.0%) |
Health & Disability in Glen Allen
Health Insurance Coverage by Age in Glen Allen
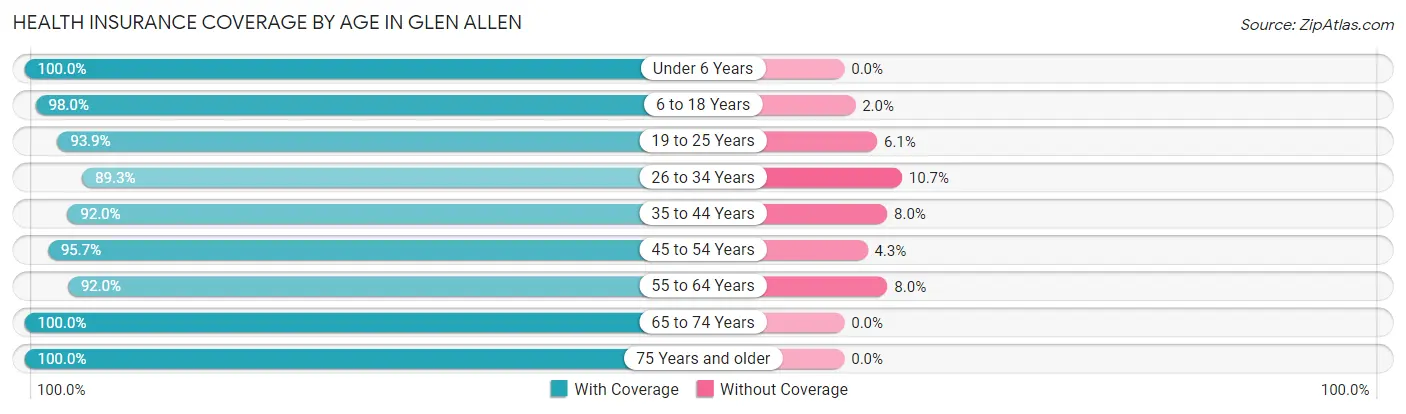
| Age Bracket | With Coverage | Without Coverage |
| Under 6 Years | 1,091 (100.0%) | 0 (0.0%) |
| 6 to 18 Years | 2,888 (98.0%) | 60 (2.0%) |
| 19 to 25 Years | 1,352 (93.9%) | 88 (6.1%) |
| 26 to 34 Years | 1,305 (89.3%) | 157 (10.7%) |
| 35 to 44 Years | 2,328 (92.0%) | 202 (8.0%) |
| 45 to 54 Years | 2,082 (95.7%) | 94 (4.3%) |
| 55 to 64 Years | 1,934 (92.0%) | 169 (8.0%) |
| 65 to 74 Years | 1,725 (100.0%) | 0 (0.0%) |
| 75 Years and older | 750 (100.0%) | 0 (0.0%) |
| Total | 15,455 (95.3%) | 770 (4.8%) |
Health Insurance Coverage by Citizenship Status in Glen Allen
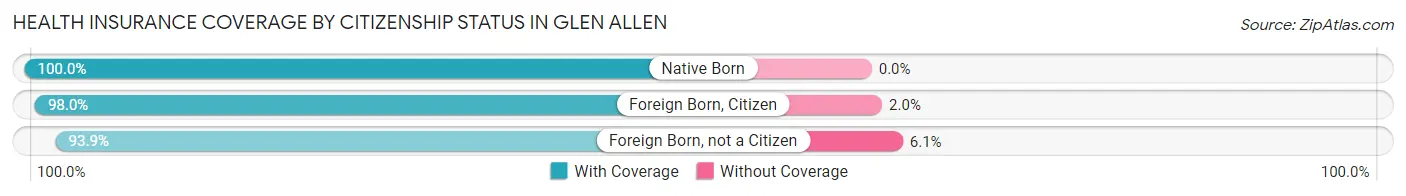
| Citizenship Status | With Coverage | Without Coverage |
| Native Born | 1,091 (100.0%) | 0 (0.0%) |
| Foreign Born, Citizen | 2,888 (98.0%) | 60 (2.0%) |
| Foreign Born, not a Citizen | 1,352 (93.9%) | 88 (6.1%) |
Health Insurance Coverage by Household Income in Glen Allen
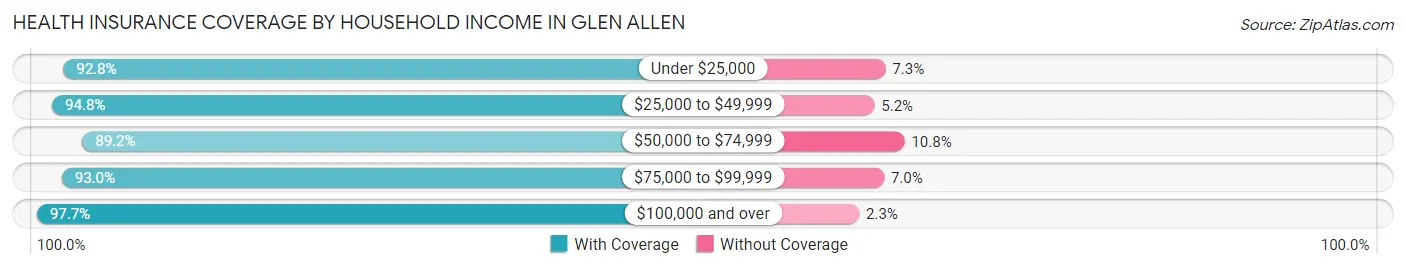
| Household Income | With Coverage | Without Coverage |
| Under $25,000 | 742 (92.7%) | 58 (7.2%) |
| $25,000 to $49,999 | 1,395 (94.8%) | 76 (5.2%) |
| $50,000 to $74,999 | 2,270 (89.2%) | 275 (10.8%) |
| $75,000 to $99,999 | 1,948 (93.0%) | 146 (7.0%) |
| $100,000 and over | 9,077 (97.7%) | 215 (2.3%) |
Public vs Private Health Insurance Coverage by Age in Glen Allen
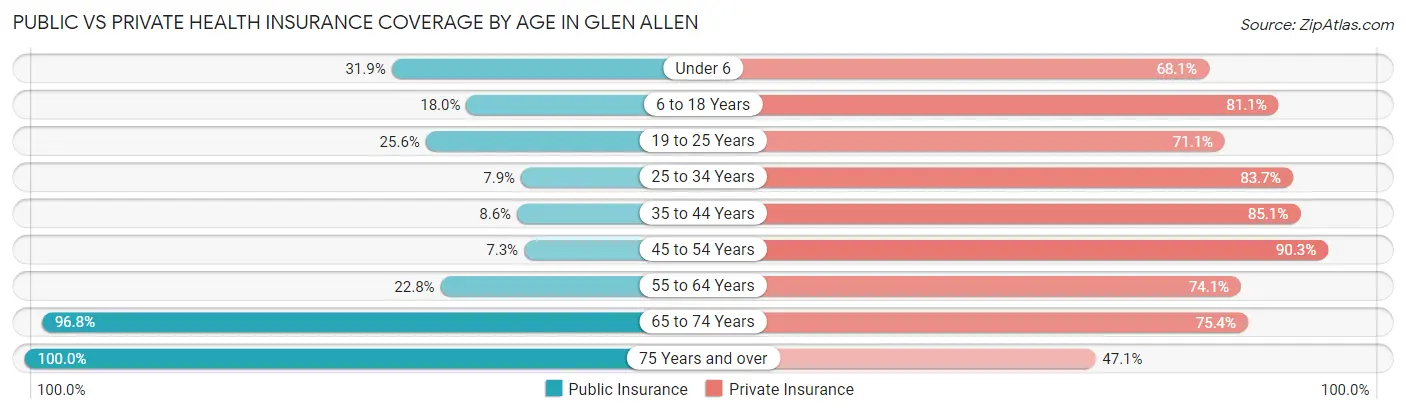
| Age Bracket | Public Insurance | Private Insurance |
| Under 6 | 348 (31.9%) | 743 (68.1%) |
| 6 to 18 Years | 531 (18.0%) | 2,390 (81.1%) |
| 19 to 25 Years | 368 (25.6%) | 1,024 (71.1%) |
| 25 to 34 Years | 115 (7.9%) | 1,223 (83.7%) |
| 35 to 44 Years | 218 (8.6%) | 2,152 (85.1%) |
| 45 to 54 Years | 159 (7.3%) | 1,964 (90.3%) |
| 55 to 64 Years | 480 (22.8%) | 1,558 (74.1%) |
| 65 to 74 Years | 1,670 (96.8%) | 1,300 (75.4%) |
| 75 Years and over | 750 (100.0%) | 353 (47.1%) |
| Total | 4,639 (28.6%) | 12,707 (78.3%) |
Disability Status by Sex by Age in Glen Allen
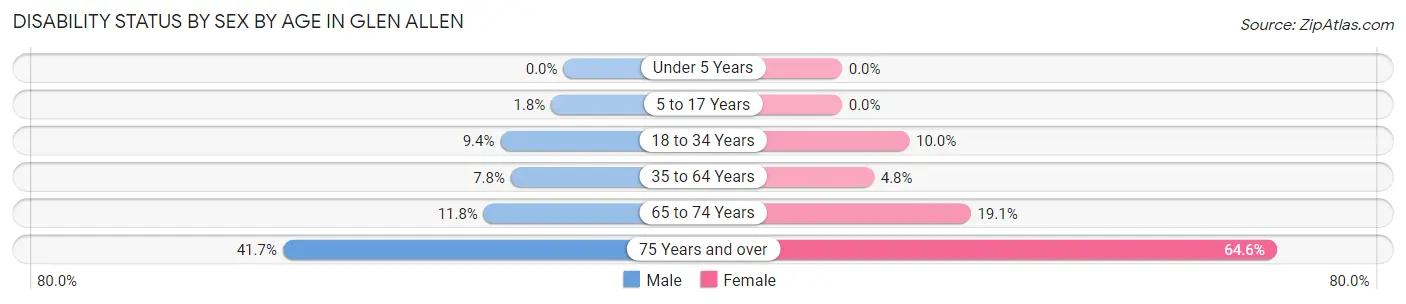
| Age Bracket | Male | Female |
| Under 5 Years | 0 (0.0%) | 0 (0.0%) |
| 5 to 17 Years | 31 (1.8%) | 0 (0.0%) |
| 18 to 34 Years | 135 (9.4%) | 163 (10.0%) |
| 35 to 64 Years | 242 (7.8%) | 176 (4.8%) |
| 65 to 74 Years | 92 (11.8%) | 181 (19.1%) |
| 75 Years and over | 115 (41.7%) | 306 (64.6%) |
Disability Class by Sex by Age in Glen Allen
Disability Class: Hearing Difficulty
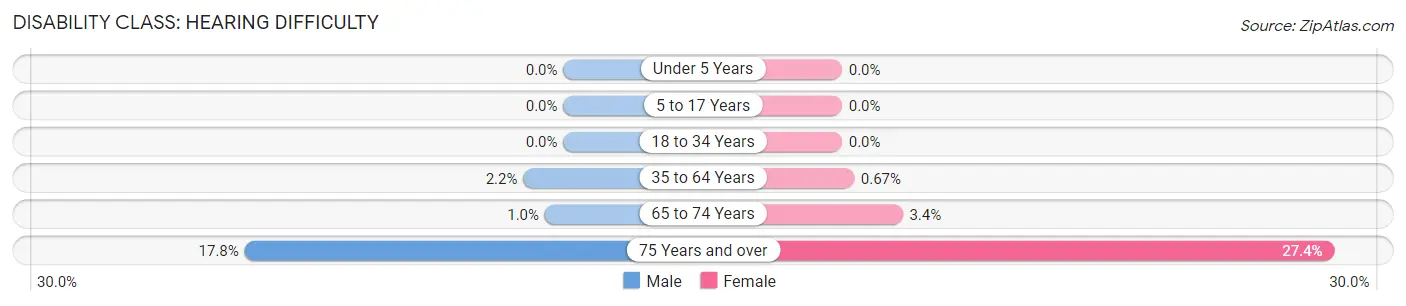
| Age Bracket | Male | Female |
| Under 5 Years | 0 (0.0%) | 0 (0.0%) |
| 5 to 17 Years | 0 (0.0%) | 0 (0.0%) |
| 18 to 34 Years | 0 (0.0%) | 0 (0.0%) |
| 35 to 64 Years | 69 (2.2%) | 25 (0.7%) |
| 65 to 74 Years | 8 (1.0%) | 32 (3.4%) |
| 75 Years and over | 49 (17.7%) | 130 (27.4%) |
Disability Class: Vision Difficulty
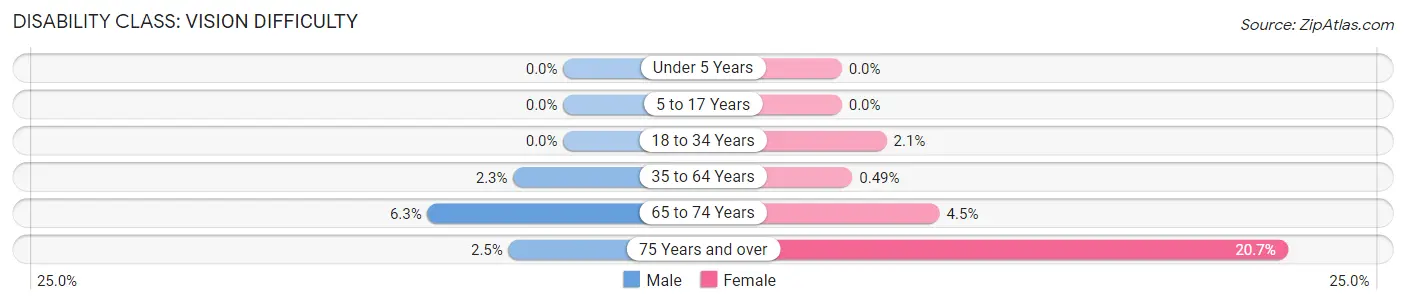
| Age Bracket | Male | Female |
| Under 5 Years | 0 (0.0%) | 0 (0.0%) |
| 5 to 17 Years | 0 (0.0%) | 0 (0.0%) |
| 18 to 34 Years | 0 (0.0%) | 34 (2.1%) |
| 35 to 64 Years | 72 (2.3%) | 18 (0.5%) |
| 65 to 74 Years | 49 (6.3%) | 43 (4.5%) |
| 75 Years and over | 7 (2.5%) | 98 (20.7%) |
Disability Class: Cognitive Difficulty
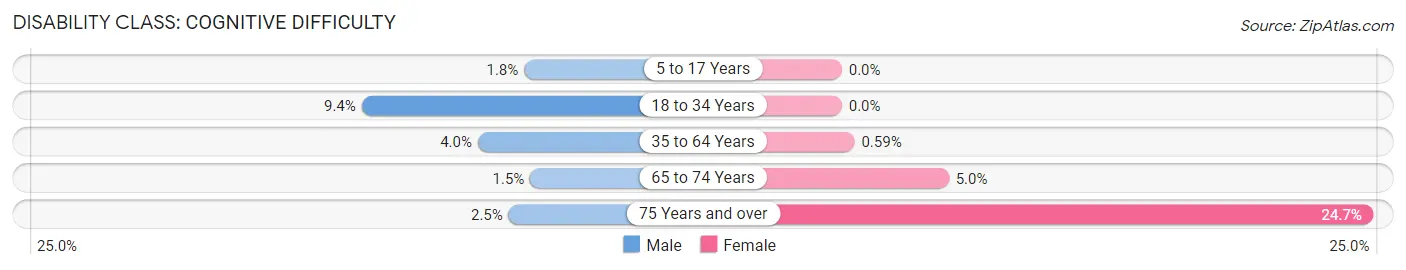
| Age Bracket | Male | Female |
| 5 to 17 Years | 31 (1.8%) | 0 (0.0%) |
| 18 to 34 Years | 135 (9.4%) | 0 (0.0%) |
| 35 to 64 Years | 123 (4.0%) | 22 (0.6%) |
| 65 to 74 Years | 12 (1.5%) | 47 (5.0%) |
| 75 Years and over | 7 (2.5%) | 117 (24.7%) |
Disability Class: Ambulatory Difficulty
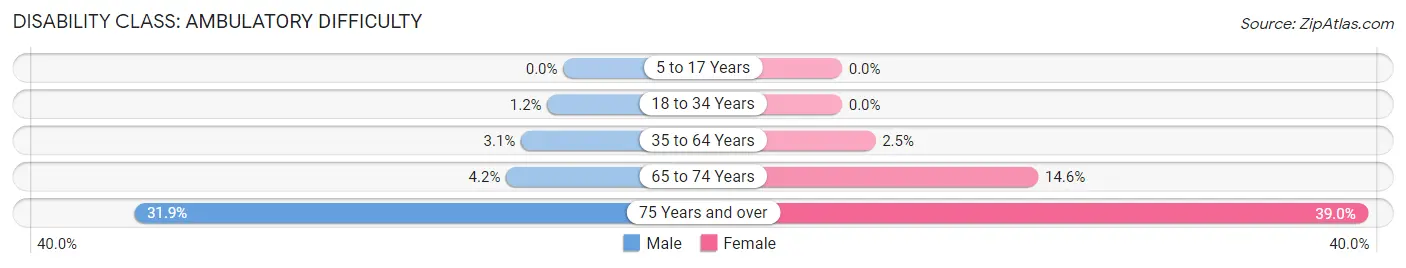
| Age Bracket | Male | Female |
| 5 to 17 Years | 0 (0.0%) | 0 (0.0%) |
| 18 to 34 Years | 17 (1.2%) | 0 (0.0%) |
| 35 to 64 Years | 97 (3.1%) | 92 (2.5%) |
| 65 to 74 Years | 33 (4.2%) | 138 (14.6%) |
| 75 Years and over | 88 (31.9%) | 185 (39.0%) |
Disability Class: Self-Care Difficulty
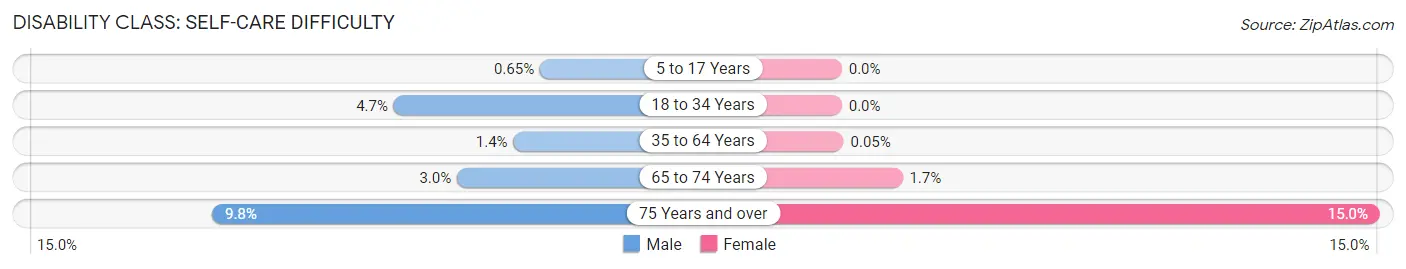
| Age Bracket | Male | Female |
| 5 to 17 Years | 11 (0.6%) | 0 (0.0%) |
| 18 to 34 Years | 68 (4.7%) | 0 (0.0%) |
| 35 to 64 Years | 43 (1.4%) | 2 (0.1%) |
| 65 to 74 Years | 23 (3.0%) | 16 (1.7%) |
| 75 Years and over | 27 (9.8%) | 71 (15.0%) |
Technology Access in Glen Allen
Computing Device Access in Glen Allen
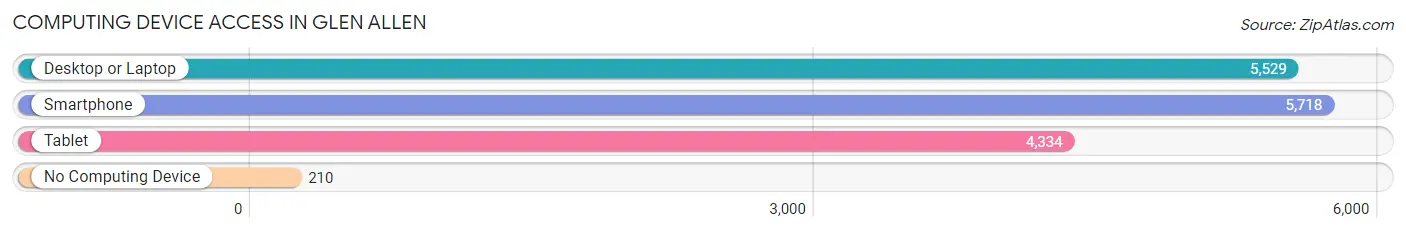
| Device Type | # Households | % Households |
| Desktop or Laptop | 5,529 | 87.2% |
| Smartphone | 5,718 | 90.2% |
| Tablet | 4,334 | 68.4% |
| No Computing Device | 210 | 3.3% |
| Total | 6,339 | 100.0% |
Internet Access in Glen Allen
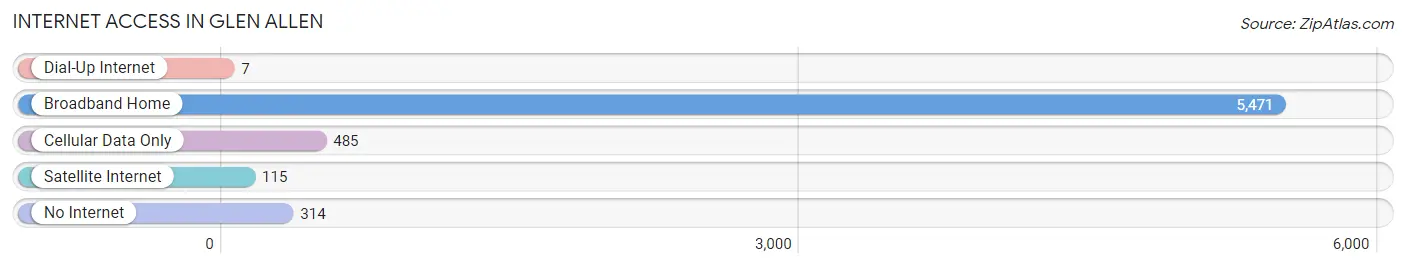
| Internet Type | # Households | % Households |
| Dial-Up Internet | 7 | 0.1% |
| Broadband Home | 5,471 | 86.3% |
| Cellular Data Only | 485 | 7.6% |
| Satellite Internet | 115 | 1.8% |
| No Internet | 314 | 5.0% |
| Total | 6,339 | 100.0% |
Glen Allen Summary
Glen Allen is an unincorporated community located in Henrico County, Virginia. It is a suburb of Richmond, the state capital, and is located about 15 miles northwest of the city. The population of Glen Allen was estimated to be 16,750 in 2019.
History
Glen Allen was originally known as Hungary, and was first settled in the early 1700s. The area was named after the Hungarian settlers who moved to the area from Pennsylvania. The town was renamed Glen Allen in 1878, after a local landowner, William Allen.
In the late 1800s, Glen Allen was a small farming community. The town was home to a number of small businesses, including a general store, a blacksmith shop, and a post office.
In the early 1900s, Glen Allen began to grow and develop. The town was home to a number of businesses, including a bank, a hotel, and a movie theater. The town also had a number of churches, including the First Baptist Church of Glen Allen, which was founded in 1906.
In the mid-1900s, Glen Allen began to experience rapid growth. The town was home to a number of new businesses, including a shopping center, a library, and a hospital. The town also had a number of new schools, including Glen Allen High School, which opened in 1959.
Geography
Glen Allen is located in Henrico County, Virginia. The town is situated in the Piedmont region of the state, and is located about 15 miles northwest of Richmond. The town is bordered by the James River to the east, and is located near the intersection of Interstate 95 and Interstate 64.
The town has a total area of 8.3 square miles, of which 8.2 square miles is land and 0.1 square miles is water. The town is located at an elevation of about 200 feet above sea level.
Economy
Glen Allen is home to a number of businesses and industries. The town is home to a number of retail stores, including a Walmart Supercenter, a Target, and a Lowe’s Home Improvement store. The town is also home to a number of restaurants, including a number of fast food restaurants, as well as a number of sit-down restaurants.
The town is also home to a number of corporate offices, including Capital One, which is headquartered in Glen Allen. The town is also home to a number of medical facilities, including the Henrico Doctors’ Hospital.
Demographics
As of the 2019 census, the population of Glen Allen was estimated to be 16,750. The town has a population density of 2,037 people per square mile. The median age of the population is 38.7 years, and the median household income is $77,945.
The racial makeup of the town is 79.2% White, 11.3% African American, 4.2% Asian, and 5.3% other. The town is home to a number of immigrants, including a large Hispanic population. The town also has a large number of people who identify as LGBT.
Conclusion
Glen Allen is a small town located in Henrico County, Virginia. The town has a long history, and has experienced rapid growth in recent years. The town is home to a number of businesses and industries, and has a diverse population. Glen Allen is a great place to live, work, and play.
Common Questions
What is Per Capita Income in Glen Allen?
Per Capita income in Glen Allen is $41,304.
What is the Median Family Income in Glen Allen?
Median Family Income in Glen Allen is $106,196.
What is the Median Household income in Glen Allen?
Median Household Income in Glen Allen is $88,206.
What is Income or Wage Gap in Glen Allen?
Income or Wage Gap in Glen Allen is 9.7%.
Women in Glen Allen earn 90.3 cents for every dollar earned by a man.
What is Inequality or Gini Index in Glen Allen?
Inequality or Gini Index in Glen Allen is 0.36.
What is the Total Population of Glen Allen?
Total Population of Glen Allen is 16,246.
What is the Total Male Population of Glen Allen?
Total Male Population of Glen Allen is 7,608.
What is the Total Female Population of Glen Allen?
Total Female Population of Glen Allen is 8,638.
What is the Ratio of Males per 100 Females in Glen Allen?
There are 88.08 Males per 100 Females in Glen Allen.
What is the Ratio of Females per 100 Males in Glen Allen?
There are 113.54 Females per 100 Males in Glen Allen.
What is the Median Population Age in Glen Allen?
Median Population Age in Glen Allen is 39.8 Years.
What is the Average Family Size in Glen Allen
Average Family Size in Glen Allen is 3.2 People.
What is the Average Household Size in Glen Allen
Average Household Size in Glen Allen is 2.6 People.
How Large is the Labor Force in Glen Allen?
There are 8,781 People in the Labor Forcein in Glen Allen.
What is the Percentage of People in the Labor Force in Glen Allen?
69.2% of People are in the Labor Force in Glen Allen.
What is the Unemployment Rate in Glen Allen?
Unemployment Rate in Glen Allen is 5.0%.