Pulaski, VA Map & Demographics
Pulaski Map
Pulaski Overview
$31,223
PER CAPITA INCOME
$63,847
AVG FAMILY INCOME
$55,213
AVG HOUSEHOLD INCOME
3.6%
WAGE / INCOME GAP [ % ]
96.4¢/ $1
WAGE / INCOME GAP [ $ ]
0.50
INEQUALITY / GINI INDEX
8,982
TOTAL POPULATION
4,327
MALE POPULATION
4,655
FEMALE POPULATION
92.95
MALES / 100 FEMALES
107.58
FEMALES / 100 MALES
40.7
MEDIAN AGE
2.9
AVG FAMILY SIZE
2.3
AVG HOUSEHOLD SIZE
4,165
LABOR FORCE [ PEOPLE ]
55.3%
PERCENT IN LABOR FORCE
4.1%
UNEMPLOYMENT RATE
Pulaski Zip Codes
Pulaski Area Codes
Income in Pulaski
Income Overview in Pulaski
Per Capita Income in Pulaski is $31,223, while median incomes of families and households are $63,847 and $55,213 respectively.
| Characteristic | Number | Measure |
| Per Capita Income | 8,982 | $31,223 |
| Median Family Income | 2,225 | $63,847 |
| Mean Family Income | 2,225 | $79,717 |
| Median Household Income | 3,832 | $55,213 |
| Mean Household Income | 3,832 | $71,061 |
| Income Deficit | 2,225 | $0 |
| Wage / Income Gap (%) | 8,982 | 3.61% |
| Wage / Income Gap ($) | 8,982 | 96.39¢ per $1 |
| Gini / Inequality Index | 8,982 | 0.50 |
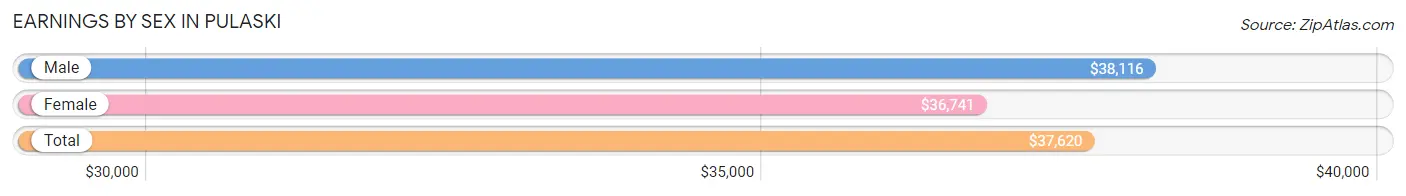
Earnings by Sex in Pulaski
Average Earnings in Pulaski are $37,620, $38,116 for men and $36,741 for women, a difference of 3.6%.
| Sex | Number | Average Earnings |
| Male | 2,347 (54.8%) | $38,116 |
| Female | 1,936 (45.2%) | $36,741 |
| Total | 4,283 (100.0%) | $37,620 |
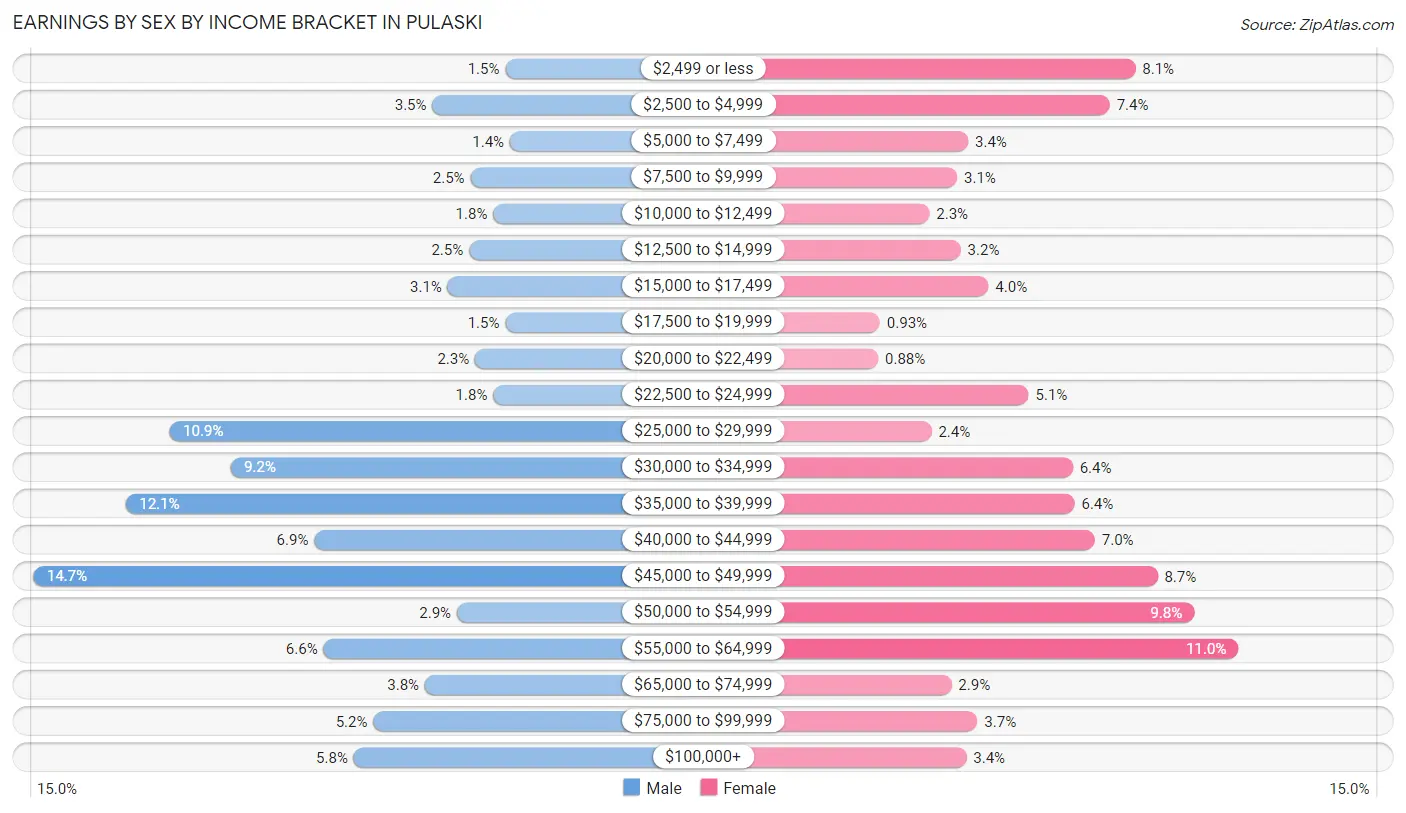
Earnings by Sex by Income Bracket in Pulaski
The most common earnings brackets in Pulaski are $45,000 to $49,999 for men (346 | 14.7%) and $55,000 to $64,999 for women (213 | 11.0%).
| Income | Male | Female |
| $2,499 or less | 35 (1.5%) | 157 (8.1%) |
| $2,500 to $4,999 | 83 (3.5%) | 143 (7.4%) |
| $5,000 to $7,499 | 32 (1.4%) | 66 (3.4%) |
| $7,500 to $9,999 | 58 (2.5%) | 60 (3.1%) |
| $10,000 to $12,499 | 43 (1.8%) | 45 (2.3%) |
| $12,500 to $14,999 | 59 (2.5%) | 62 (3.2%) |
| $15,000 to $17,499 | 73 (3.1%) | 77 (4.0%) |
| $17,500 to $19,999 | 35 (1.5%) | 18 (0.9%) |
| $20,000 to $22,499 | 55 (2.3%) | 17 (0.9%) |
| $22,500 to $24,999 | 43 (1.8%) | 99 (5.1%) |
| $25,000 to $29,999 | 256 (10.9%) | 46 (2.4%) |
| $30,000 to $34,999 | 216 (9.2%) | 123 (6.4%) |
| $35,000 to $39,999 | 285 (12.1%) | 124 (6.4%) |
| $40,000 to $44,999 | 161 (6.9%) | 135 (7.0%) |
| $45,000 to $49,999 | 346 (14.7%) | 169 (8.7%) |
| $50,000 to $54,999 | 67 (2.9%) | 189 (9.8%) |
| $55,000 to $64,999 | 155 (6.6%) | 213 (11.0%) |
| $65,000 to $74,999 | 88 (3.7%) | 57 (2.9%) |
| $75,000 to $99,999 | 122 (5.2%) | 71 (3.7%) |
| $100,000+ | 135 (5.8%) | 65 (3.4%) |
| Total | 2,347 (100.0%) | 1,936 (100.0%) |
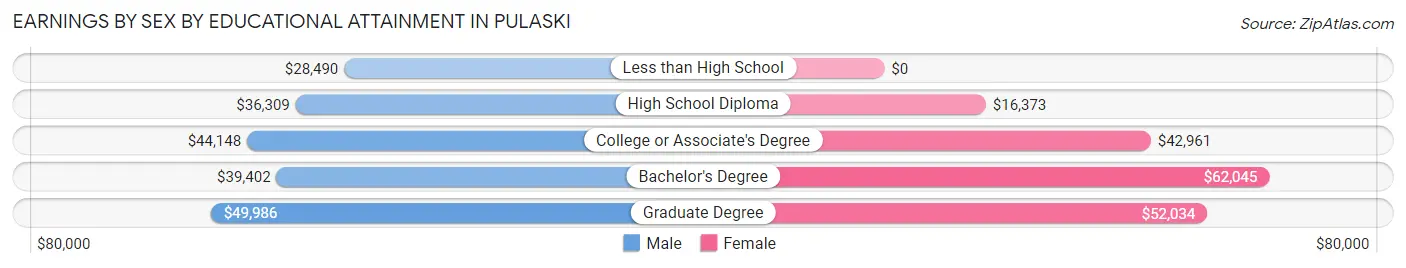
Earnings by Sex by Educational Attainment in Pulaski
Average earnings in Pulaski are $42,317 for men and $42,071 for women, a difference of 0.6%. Men with an educational attainment of graduate degree enjoy the highest average annual earnings of $49,986, while those with less than high school education earn the least with $28,490. Women with an educational attainment of bachelor's degree earn the most with the average annual earnings of $62,045, while those with high school diploma education have the smallest earnings of $16,373.
| Educational Attainment | Male Income | Female Income |
| Less than High School | $28,490 | $0 |
| High School Diploma | $36,309 | $16,373 |
| College or Associate's Degree | $44,148 | $42,961 |
| Bachelor's Degree | $39,402 | $62,045 |
| Graduate Degree | $49,986 | $52,034 |
| Total | $42,317 | $42,071 |
Family Income in Pulaski
Family Income Brackets in Pulaski
According to the Pulaski family income data, there are 532 families falling into the $50,000 to $74,999 income range, which is the most common income bracket and makes up 23.9% of all families. Conversely, the $10,000 to $14,999 income bracket is the least frequent group with only 51 families (2.3%) belonging to this category.
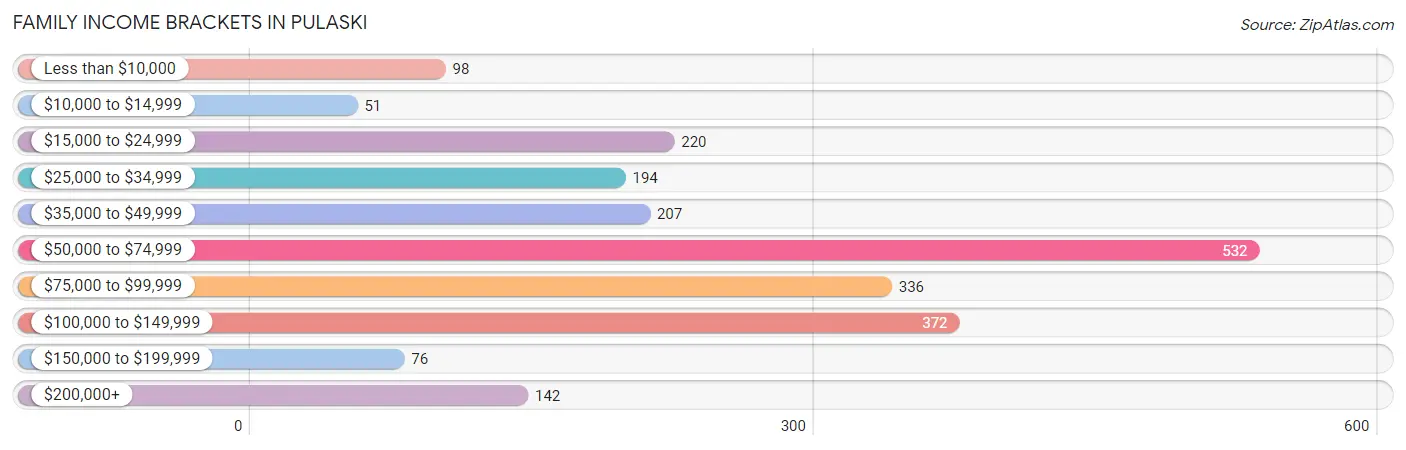
| Income Bracket | # Families | % Families |
| Less than $10,000 | 98 | 4.4% |
| $10,000 to $14,999 | 51 | 2.3% |
| $15,000 to $24,999 | 220 | 9.9% |
| $25,000 to $34,999 | 194 | 8.7% |
| $35,000 to $49,999 | 207 | 9.3% |
| $50,000 to $74,999 | 532 | 23.9% |
| $75,000 to $99,999 | 336 | 15.1% |
| $100,000 to $149,999 | 372 | 16.7% |
| $150,000 to $199,999 | 76 | 3.4% |
| $200,000+ | 142 | 6.4% |
Family Income by Famaliy Size in Pulaski
4-person families (333 | 15.0%) account for the highest median family income in Pulaski with $83,393 per family, while 2-person families (1,183 | 53.2%) have the highest median income of $30,678 per family member.
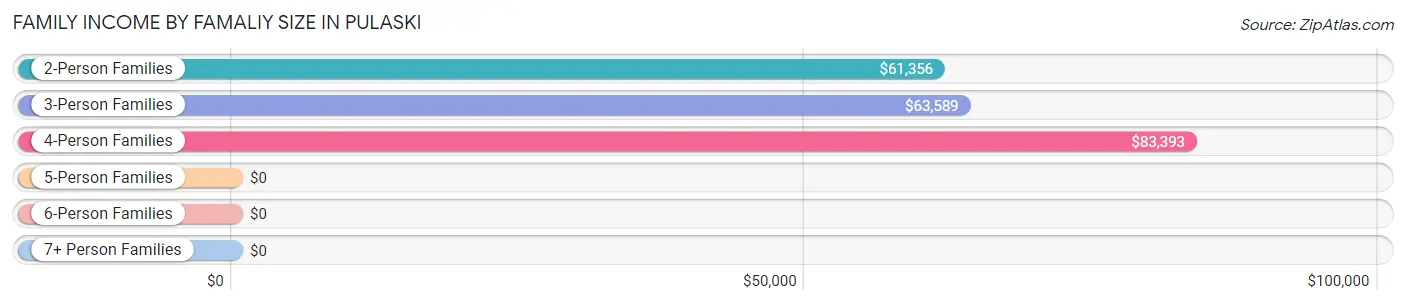
| Income Bracket | # Families | Median Income |
| 2-Person Families | 1,183 (53.2%) | $61,356 |
| 3-Person Families | 558 (25.1%) | $63,589 |
| 4-Person Families | 333 (15.0%) | $83,393 |
| 5-Person Families | 135 (6.1%) | $0 |
| 6-Person Families | 10 (0.4%) | $0 |
| 7+ Person Families | 6 (0.3%) | $0 |
| Total | 2,225 (100.0%) | $63,847 |
Family Income by Number of Earners in Pulaski
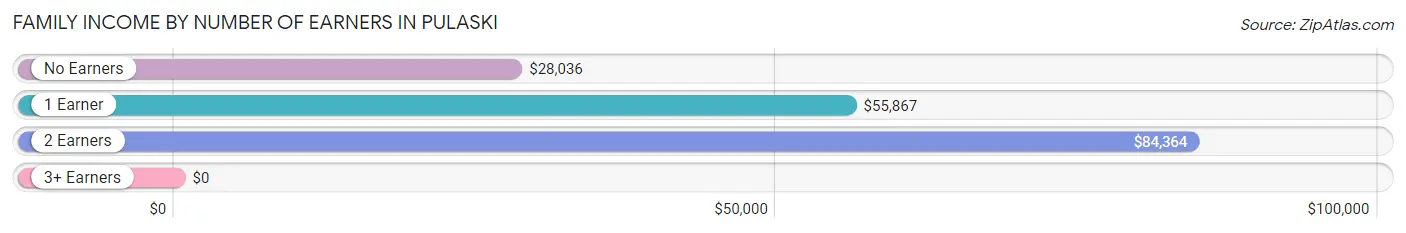
| Number of Earners | # Families | Median Income |
| No Earners | 515 (23.2%) | $28,036 |
| 1 Earner | 728 (32.7%) | $55,867 |
| 2 Earners | 804 (36.1%) | $84,364 |
| 3+ Earners | 178 (8.0%) | $0 |
| Total | 2,225 (100.0%) | $63,847 |
Household Income in Pulaski
Household Income Brackets in Pulaski
With 874 households falling in the category, the $50,000 to $74,999 income range is the most frequent in Pulaski, accounting for 22.8% of all households. In contrast, only 88 households (2.3%) fall into the $150,000 to $199,999 income bracket, making it the least populous group.
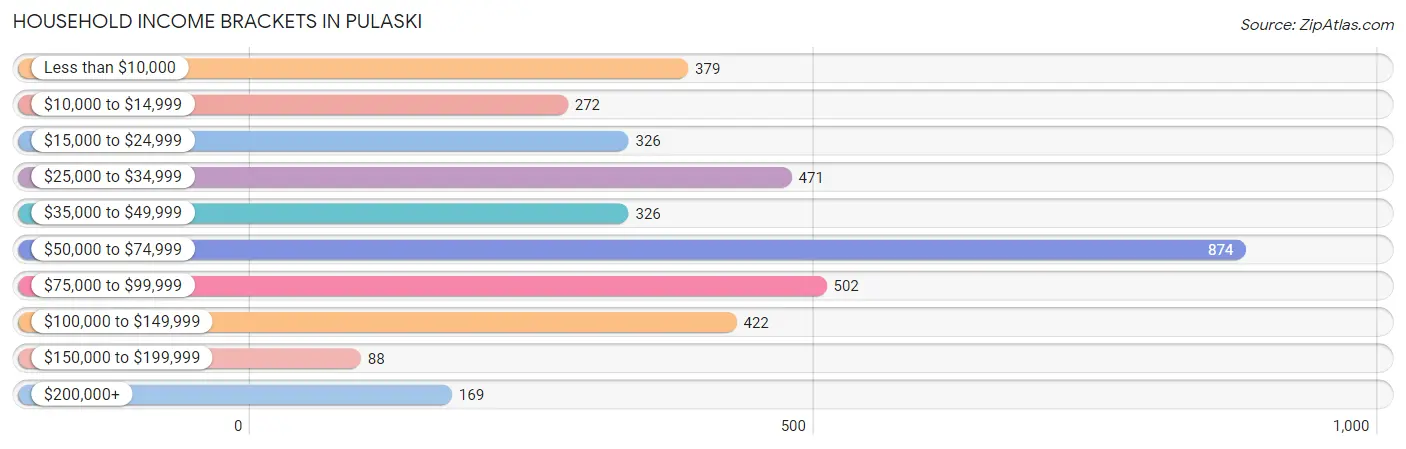
| Income Bracket | # Households | % Households |
| Less than $10,000 | 379 | 9.9% |
| $10,000 to $14,999 | 272 | 7.1% |
| $15,000 to $24,999 | 326 | 8.5% |
| $25,000 to $34,999 | 471 | 12.3% |
| $35,000 to $49,999 | 326 | 8.5% |
| $50,000 to $74,999 | 874 | 22.8% |
| $75,000 to $99,999 | 502 | 13.1% |
| $100,000 to $149,999 | 422 | 11.0% |
| $150,000 to $199,999 | 88 | 2.3% |
| $200,000+ | 169 | 4.4% |
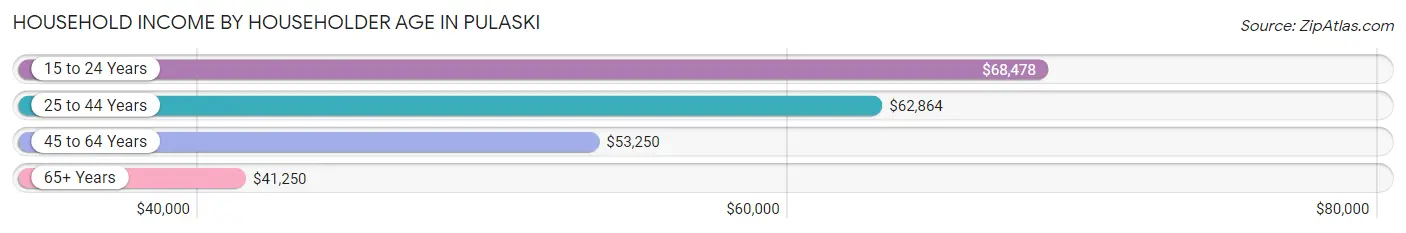
Household Income by Householder Age in Pulaski
The median household income in Pulaski is $55,213, with the highest median household income of $68,478 found in the 15 to 24 years age bracket for the primary householder. A total of 170 households (4.4%) fall into this category. Meanwhile, the 65+ years age bracket for the primary householder has the lowest median household income of $41,250, with 1,056 households (27.6%) in this group.
| Income Bracket | # Households | Median Income |
| 15 to 24 Years | 170 (4.4%) | $68,478 |
| 25 to 44 Years | 1,262 (32.9%) | $62,864 |
| 45 to 64 Years | 1,344 (35.1%) | $53,250 |
| 65+ Years | 1,056 (27.6%) | $41,250 |
| Total | 3,832 (100.0%) | $55,213 |
Poverty in Pulaski
Income Below Poverty by Sex and Age in Pulaski
With 18.7% poverty level for males and 26.2% for females among the residents of Pulaski, 15 year old males and 15 year old females are the most vulnerable to poverty, with 28 males (87.5%) and 40 females (100.0%) in their respective age groups living below the poverty level.
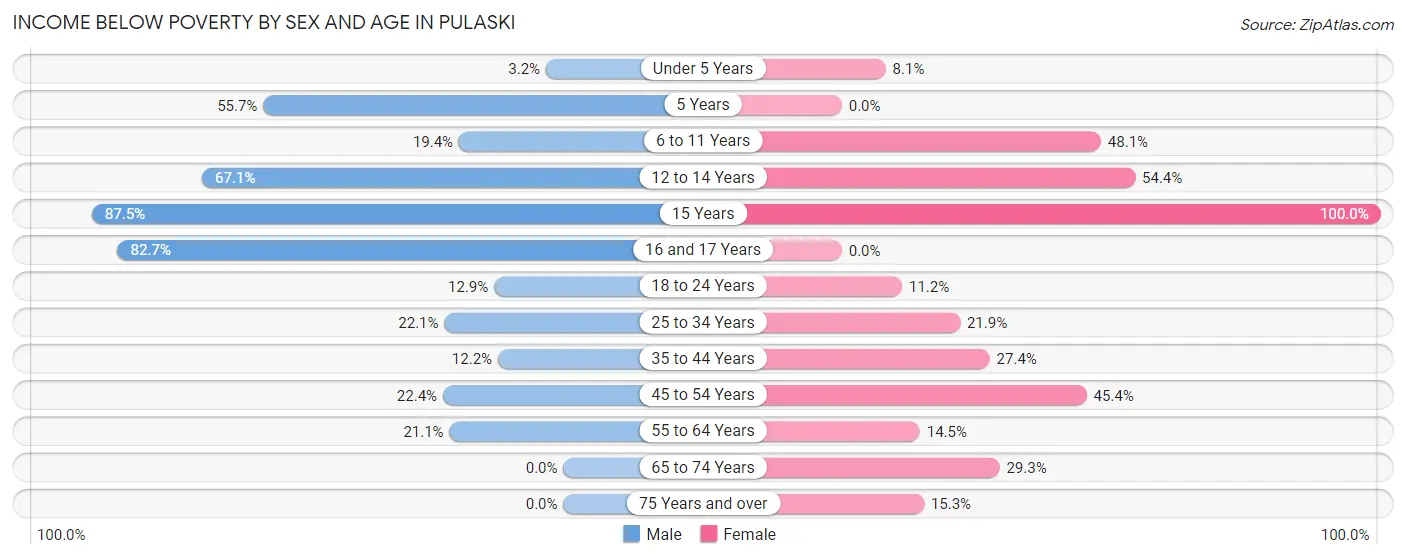
| Age Bracket | Male | Female |
| Under 5 Years | 8 (3.2%) | 18 (8.1%) |
| 5 Years | 39 (55.7%) | 0 (0.0%) |
| 6 to 11 Years | 56 (19.4%) | 151 (48.1%) |
| 12 to 14 Years | 59 (67.0%) | 49 (54.4%) |
| 15 Years | 28 (87.5%) | 40 (100.0%) |
| 16 and 17 Years | 91 (82.7%) | 0 (0.0%) |
| 18 to 24 Years | 46 (12.9%) | 36 (11.2%) |
| 25 to 34 Years | 209 (22.1%) | 170 (21.9%) |
| 35 to 44 Years | 69 (12.1%) | 104 (27.4%) |
| 45 to 54 Years | 91 (22.4%) | 288 (45.4%) |
| 55 to 64 Years | 108 (21.1%) | 98 (14.5%) |
| 65 to 74 Years | 0 (0.0%) | 173 (29.3%) |
| 75 Years and over | 0 (0.0%) | 63 (15.2%) |
| Total | 804 (18.7%) | 1,190 (26.2%) |
Income Above Poverty by Sex and Age in Pulaski
According to the poverty statistics in Pulaski, males aged 65 to 74 years and females aged 5 years are the age groups that are most secure financially, with 100.0% of males and 100.0% of females in these age groups living above the poverty line.
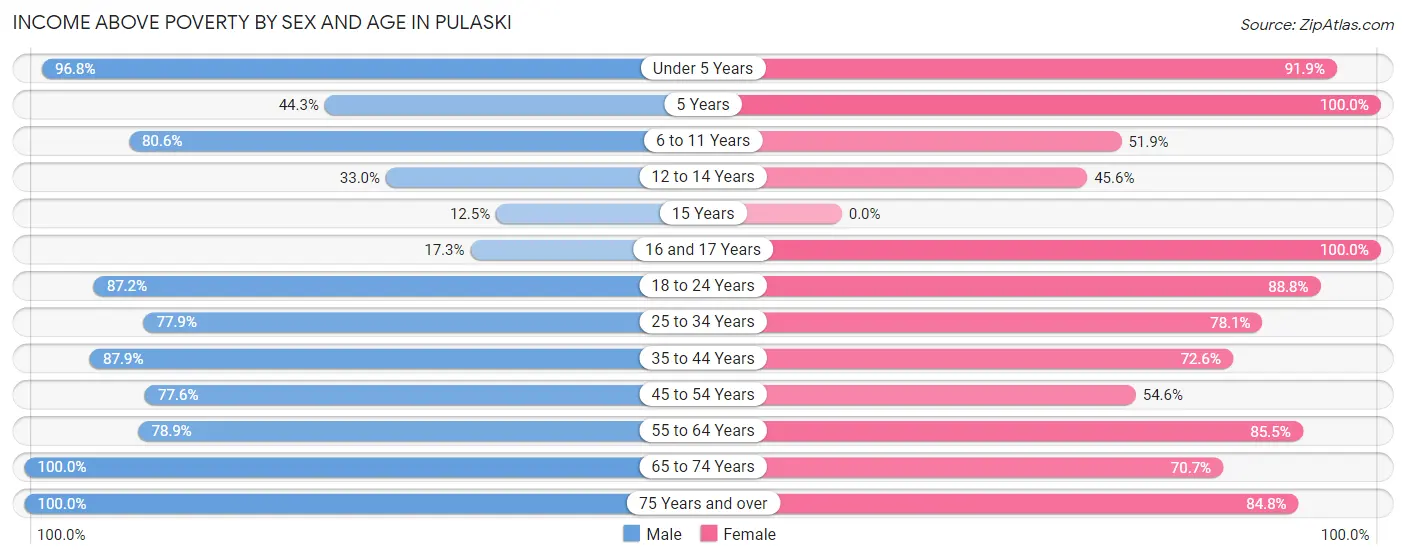
| Age Bracket | Male | Female |
| Under 5 Years | 239 (96.8%) | 203 (91.9%) |
| 5 Years | 31 (44.3%) | 21 (100.0%) |
| 6 to 11 Years | 233 (80.6%) | 163 (51.9%) |
| 12 to 14 Years | 29 (33.0%) | 41 (45.6%) |
| 15 Years | 4 (12.5%) | 0 (0.0%) |
| 16 and 17 Years | 19 (17.3%) | 65 (100.0%) |
| 18 to 24 Years | 312 (87.2%) | 286 (88.8%) |
| 25 to 34 Years | 737 (77.9%) | 605 (78.1%) |
| 35 to 44 Years | 499 (87.8%) | 275 (72.6%) |
| 45 to 54 Years | 316 (77.6%) | 346 (54.6%) |
| 55 to 64 Years | 403 (78.9%) | 579 (85.5%) |
| 65 to 74 Years | 431 (100.0%) | 418 (70.7%) |
| 75 Years and over | 237 (100.0%) | 350 (84.8%) |
| Total | 3,490 (81.3%) | 3,352 (73.8%) |
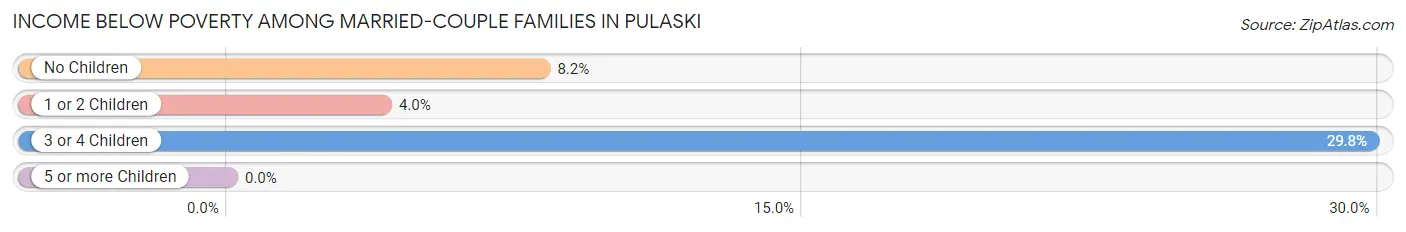
Income Below Poverty Among Married-Couple Families in Pulaski
The poverty statistics for married-couple families in Pulaski show that 7.4% or 108 of the total 1,465 families live below the poverty line. Families with 3 or 4 children have the highest poverty rate of 29.8%, comprising of 14 families. On the other hand, families with 1 or 2 children have the lowest poverty rate of 4.0%, which includes 21 families.
| Children | Above Poverty | Below Poverty |
| No Children | 822 (91.8%) | 73 (8.2%) |
| 1 or 2 Children | 502 (96.0%) | 21 (4.0%) |
| 3 or 4 Children | 33 (70.2%) | 14 (29.8%) |
| 5 or more Children | 0 (0.0%) | 0 (0.0%) |
| Total | 1,357 (92.6%) | 108 (7.4%) |
Income Below Poverty Among Single-Parent Households in Pulaski
According to the poverty data in Pulaski, 17.8% or 43 single-father households and 31.1% or 161 single-mother households are living below the poverty line. Among single-father households, those with 3 or 4 children have the highest poverty rate, with 43 households (100.0%) experiencing poverty. Likewise, among single-mother households, those with 3 or 4 children have the highest poverty rate, with 74 households (100.0%) falling below the poverty line.
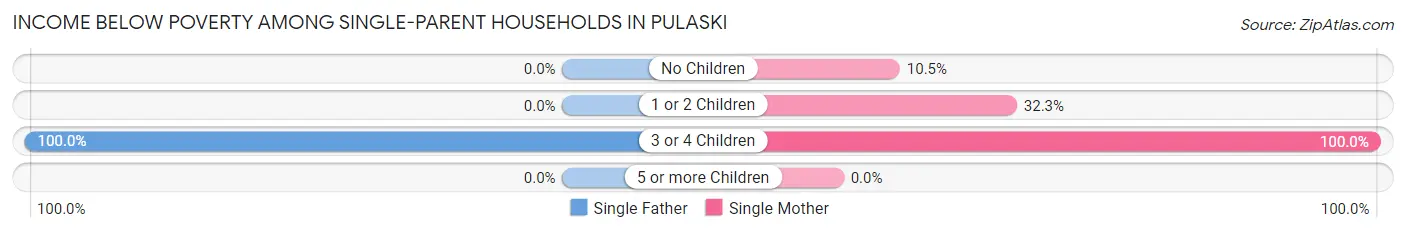
| Children | Single Father | Single Mother |
| No Children | 0 (0.0%) | 27 (10.5%) |
| 1 or 2 Children | 0 (0.0%) | 60 (32.3%) |
| 3 or 4 Children | 43 (100.0%) | 74 (100.0%) |
| 5 or more Children | 0 (0.0%) | 0 (0.0%) |
| Total | 43 (17.8%) | 161 (31.1%) |
Income Below Poverty Among Married-Couple vs Single-Parent Households in Pulaski
The poverty data for Pulaski shows that 108 of the married-couple family households (7.4%) and 204 of the single-parent households (26.8%) are living below the poverty level. Within the married-couple family households, those with 3 or 4 children have the highest poverty rate, with 14 households (29.8%) falling below the poverty line. Among the single-parent households, those with 3 or 4 children have the highest poverty rate, with 117 household (100.0%) living below poverty.
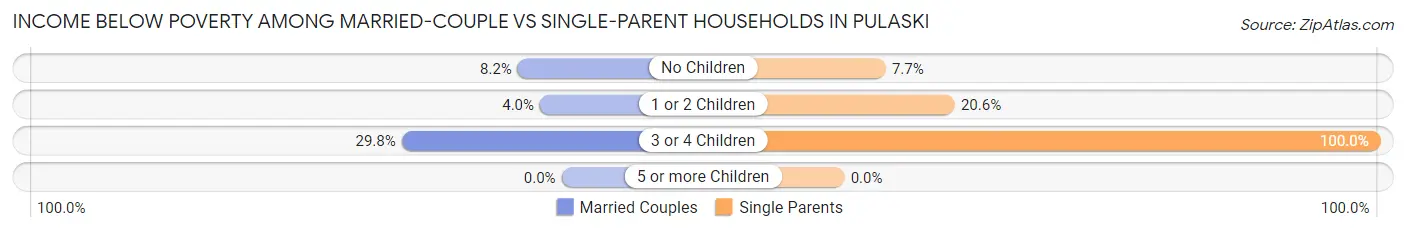
| Children | Married-Couple Families | Single-Parent Households |
| No Children | 73 (8.2%) | 27 (7.7%) |
| 1 or 2 Children | 21 (4.0%) | 60 (20.5%) |
| 3 or 4 Children | 14 (29.8%) | 117 (100.0%) |
| 5 or more Children | 0 (0.0%) | 0 (0.0%) |
| Total | 108 (7.4%) | 204 (26.8%) |
Race in Pulaski
The most populous races in Pulaski are White / Caucasian (7,733 | 86.1%), Black / African American (581 | 6.5%), and Two or more Races (485 | 5.4%).
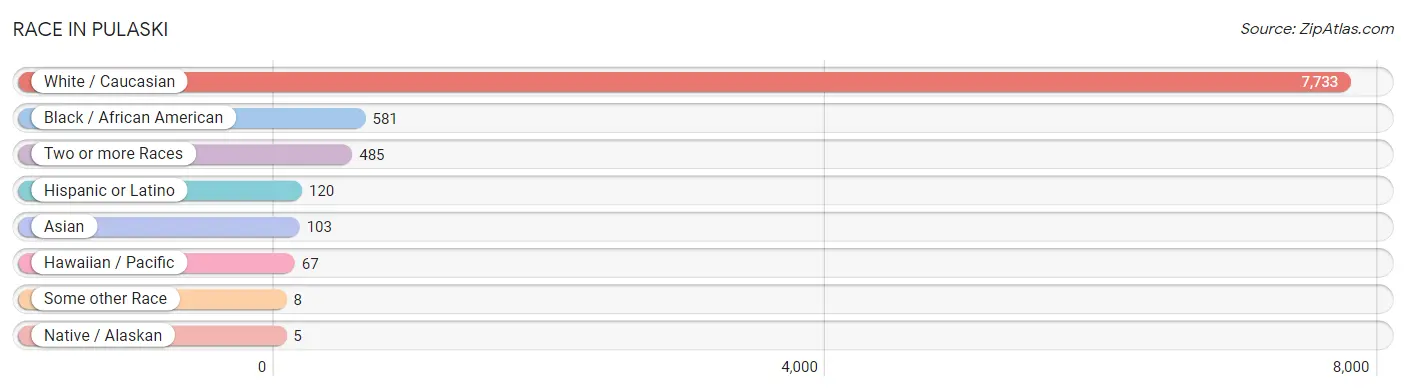
| Race | # Population | % Population |
| Asian | 103 | 1.1% |
| Black / African American | 581 | 6.5% |
| Hawaiian / Pacific | 67 | 0.7% |
| Hispanic or Latino | 120 | 1.3% |
| Native / Alaskan | 5 | 0.1% |
| White / Caucasian | 7,733 | 86.1% |
| Two or more Races | 485 | 5.4% |
| Some other Race | 8 | 0.1% |
| Total | 8,982 | 100.0% |
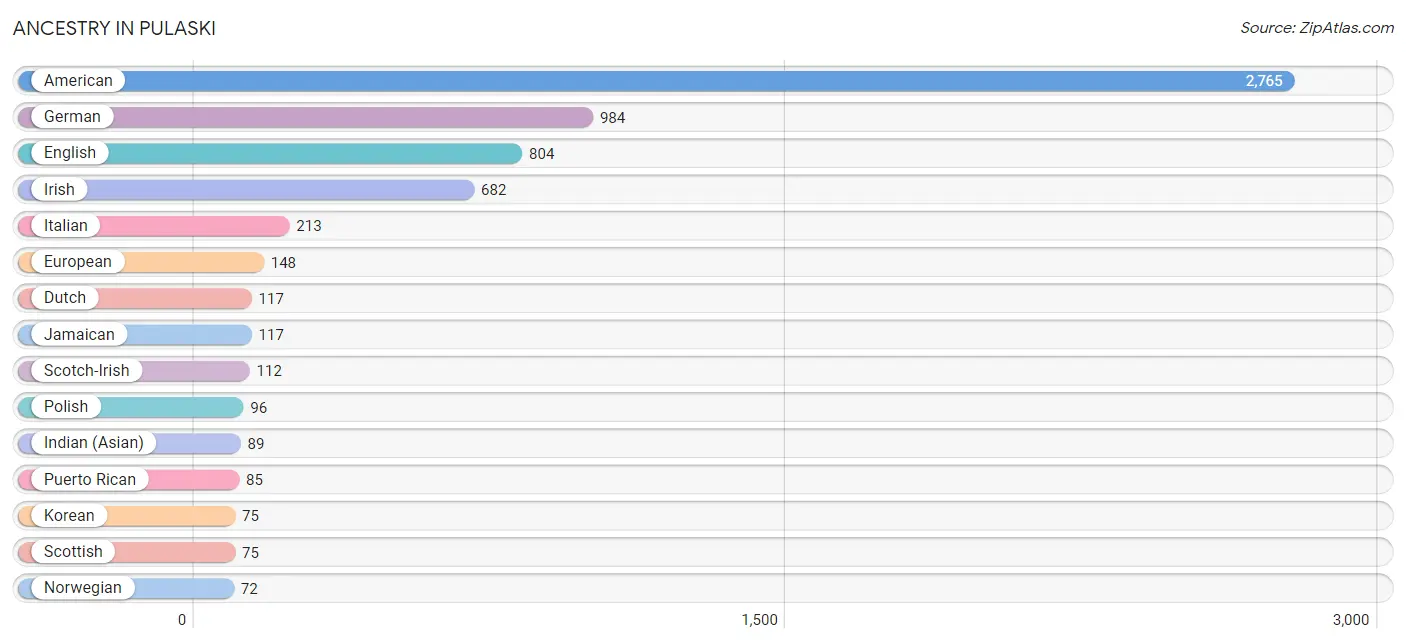
Ancestry in Pulaski
The most populous ancestries reported in Pulaski are American (2,765 | 30.8%), German (984 | 11.0%), English (804 | 8.9%), Irish (682 | 7.6%), and Italian (213 | 2.4%), together accounting for 60.7% of all Pulaski residents.
| Ancestry | # Population | % Population |
| African | 27 | 0.3% |
| American | 2,765 | 30.8% |
| Blackfeet | 5 | 0.1% |
| British | 6 | 0.1% |
| Burmese | 1 | 0.0% |
| Canadian | 13 | 0.1% |
| Central American | 2 | 0.0% |
| Central American Indian | 2 | 0.0% |
| Cherokee | 11 | 0.1% |
| Czech | 15 | 0.2% |
| Danish | 9 | 0.1% |
| Dutch | 117 | 1.3% |
| Eastern European | 5 | 0.1% |
| English | 804 | 8.9% |
| European | 148 | 1.7% |
| French | 70 | 0.8% |
| German | 984 | 11.0% |
| Guatemalan | 2 | 0.0% |
| Hungarian | 14 | 0.2% |
| Indian (Asian) | 89 | 1.0% |
| Irish | 682 | 7.6% |
| Italian | 213 | 2.4% |
| Jamaican | 117 | 1.3% |
| Korean | 75 | 0.8% |
| Lithuanian | 28 | 0.3% |
| Navajo | 3 | 0.0% |
| Norwegian | 72 | 0.8% |
| Pennsylvania German | 9 | 0.1% |
| Peruvian | 27 | 0.3% |
| Polish | 96 | 1.1% |
| Puerto Rican | 85 | 0.9% |
| Russian | 8 | 0.1% |
| Samoan | 67 | 0.7% |
| Scandinavian | 15 | 0.2% |
| Scotch-Irish | 112 | 1.3% |
| Scottish | 75 | 0.8% |
| South American | 27 | 0.3% |
| Spaniard | 6 | 0.1% |
| Sri Lankan | 22 | 0.2% |
| Subsaharan African | 27 | 0.3% |
| Swedish | 27 | 0.3% |
| Swiss | 7 | 0.1% |
| Thai | 57 | 0.6% |
| Ukrainian | 13 | 0.1% |
| Welsh | 52 | 0.6% | View All 45 Rows |
Immigrants in Pulaski
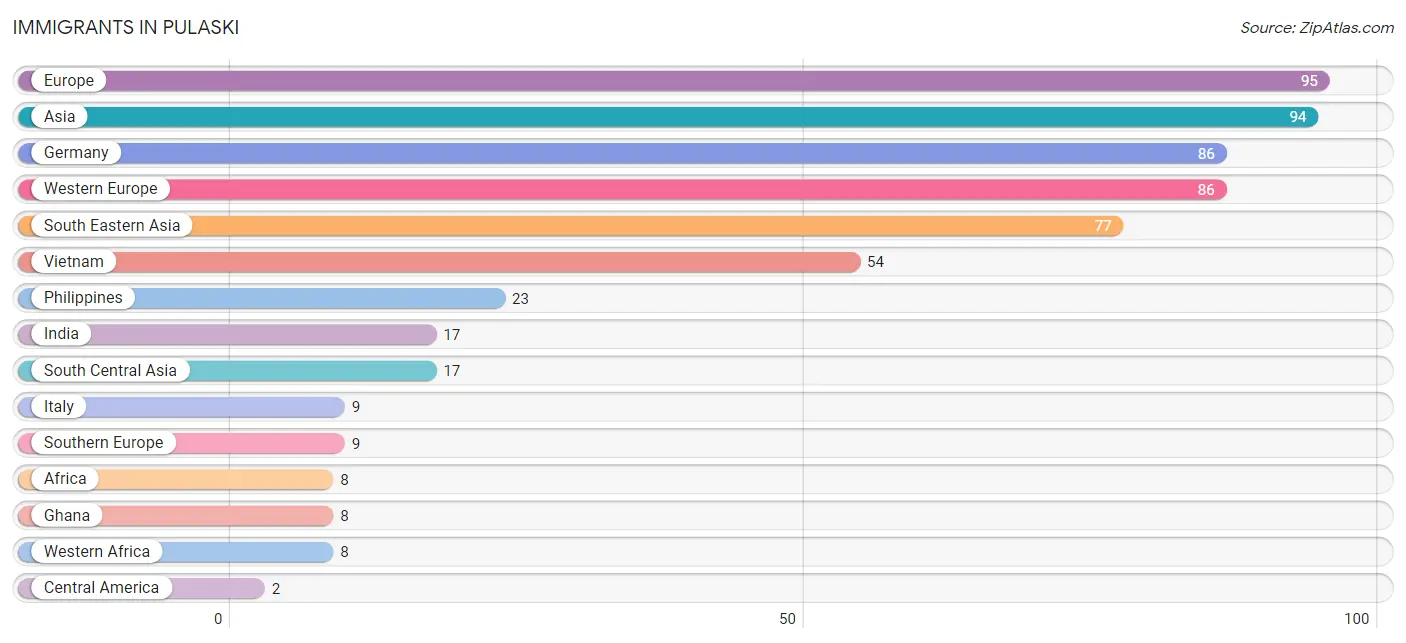
The most numerous immigrant groups reported in Pulaski came from Europe (95 | 1.1%), Asia (94 | 1.1%), Germany (86 | 1.0%), Western Europe (86 | 1.0%), and South Eastern Asia (77 | 0.9%), together accounting for 4.9% of all Pulaski residents.
| Immigration Origin | # Population | % Population |
| Africa | 8 | 0.1% |
| Asia | 94 | 1.1% |
| Central America | 2 | 0.0% |
| Europe | 95 | 1.1% |
| Germany | 86 | 1.0% |
| Ghana | 8 | 0.1% |
| Guatemala | 2 | 0.0% |
| India | 17 | 0.2% |
| Italy | 9 | 0.1% |
| Latin America | 2 | 0.0% |
| Philippines | 23 | 0.3% |
| South Central Asia | 17 | 0.2% |
| South Eastern Asia | 77 | 0.9% |
| Southern Europe | 9 | 0.1% |
| Vietnam | 54 | 0.6% |
| Western Africa | 8 | 0.1% |
| Western Europe | 86 | 1.0% | View All 17 Rows |
Sex and Age in Pulaski
Sex and Age in Pulaski
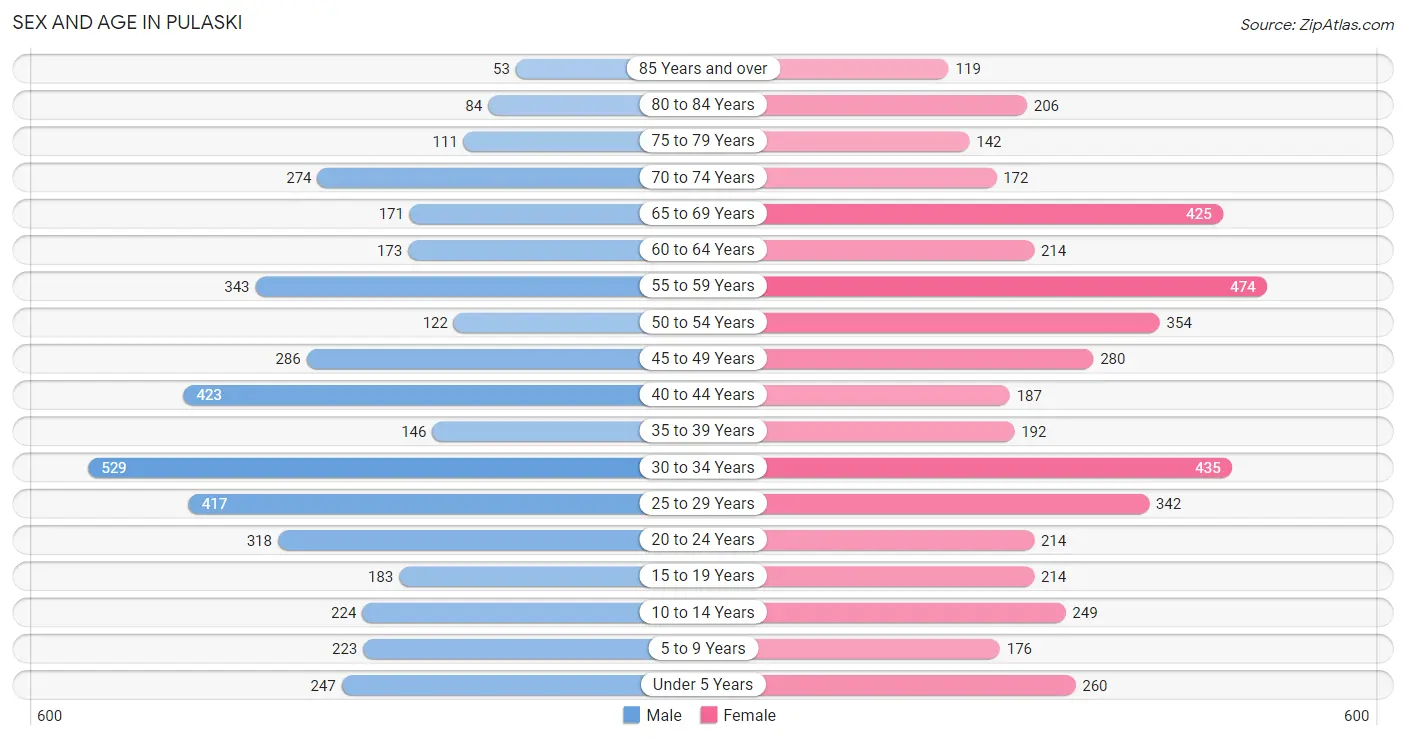
The most populous age groups in Pulaski are 30 to 34 Years (529 | 12.2%) for men and 55 to 59 Years (474 | 10.2%) for women.
| Age Bracket | Male | Female |
| Under 5 Years | 247 (5.7%) | 260 (5.6%) |
| 5 to 9 Years | 223 (5.1%) | 176 (3.8%) |
| 10 to 14 Years | 224 (5.2%) | 249 (5.3%) |
| 15 to 19 Years | 183 (4.2%) | 214 (4.6%) |
| 20 to 24 Years | 318 (7.3%) | 214 (4.6%) |
| 25 to 29 Years | 417 (9.6%) | 342 (7.3%) |
| 30 to 34 Years | 529 (12.2%) | 435 (9.3%) |
| 35 to 39 Years | 146 (3.4%) | 192 (4.1%) |
| 40 to 44 Years | 423 (9.8%) | 187 (4.0%) |
| 45 to 49 Years | 286 (6.6%) | 280 (6.0%) |
| 50 to 54 Years | 122 (2.8%) | 354 (7.6%) |
| 55 to 59 Years | 343 (7.9%) | 474 (10.2%) |
| 60 to 64 Years | 173 (4.0%) | 214 (4.6%) |
| 65 to 69 Years | 171 (4.0%) | 425 (9.1%) |
| 70 to 74 Years | 274 (6.3%) | 172 (3.7%) |
| 75 to 79 Years | 111 (2.6%) | 142 (3.0%) |
| 80 to 84 Years | 84 (1.9%) | 206 (4.4%) |
| 85 Years and over | 53 (1.2%) | 119 (2.6%) |
| Total | 4,327 (100.0%) | 4,655 (100.0%) |
Families and Households in Pulaski
Median Family Size in Pulaski
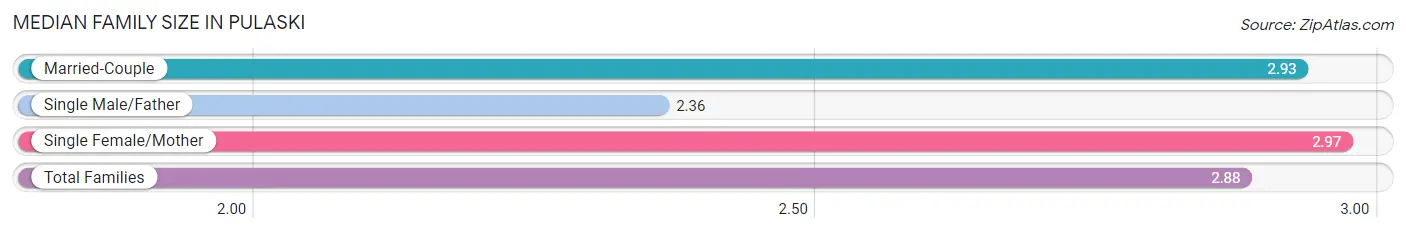
The median family size in Pulaski is 2.88 persons per family, with single female/mother families (518 | 23.3%) accounting for the largest median family size of 2.97 persons per family. On the other hand, single male/father families (242 | 10.9%) represent the smallest median family size with 2.36 persons per family.
| Family Type | # Families | Family Size |
| Married-Couple | 1,465 (65.8%) | 2.93 |
| Single Male/Father | 242 (10.9%) | 2.36 |
| Single Female/Mother | 518 (23.3%) | 2.97 |
| Total Families | 2,225 (100.0%) | 2.88 |
Median Household Size in Pulaski
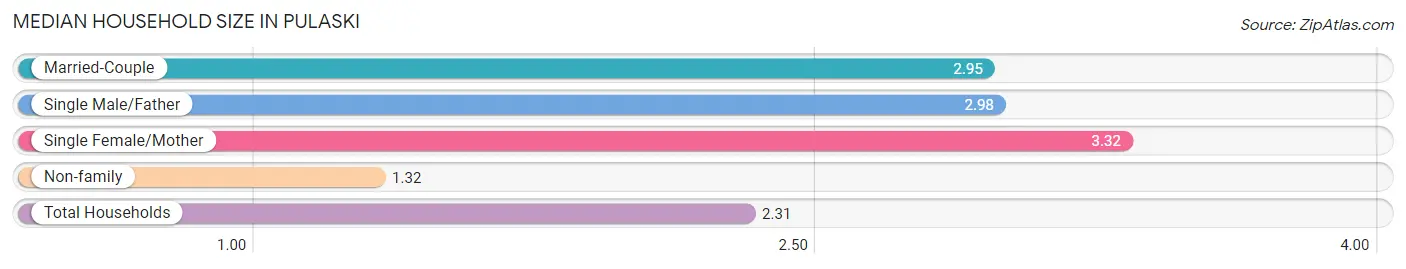
The median household size in Pulaski is 2.31 persons per household, with single female/mother households (518 | 13.5%) accounting for the largest median household size of 3.32 persons per household. non-family households (1,607 | 41.9%) represent the smallest median household size with 1.32 persons per household.
| Household Type | # Households | Household Size |
| Married-Couple | 1,465 (38.2%) | 2.95 |
| Single Male/Father | 242 (6.3%) | 2.98 |
| Single Female/Mother | 518 (13.5%) | 3.32 |
| Non-family | 1,607 (41.9%) | 1.32 |
| Total Households | 3,832 (100.0%) | 2.31 |
Household Size by Marriage Status in Pulaski
Out of a total of 3,832 households in Pulaski, 2,225 (58.1%) are family households, while 1,607 (41.9%) are nonfamily households. The most numerous type of family households are 2-person households, comprising 1,023, and the most common type of nonfamily households are 1-person households, comprising 1,155.
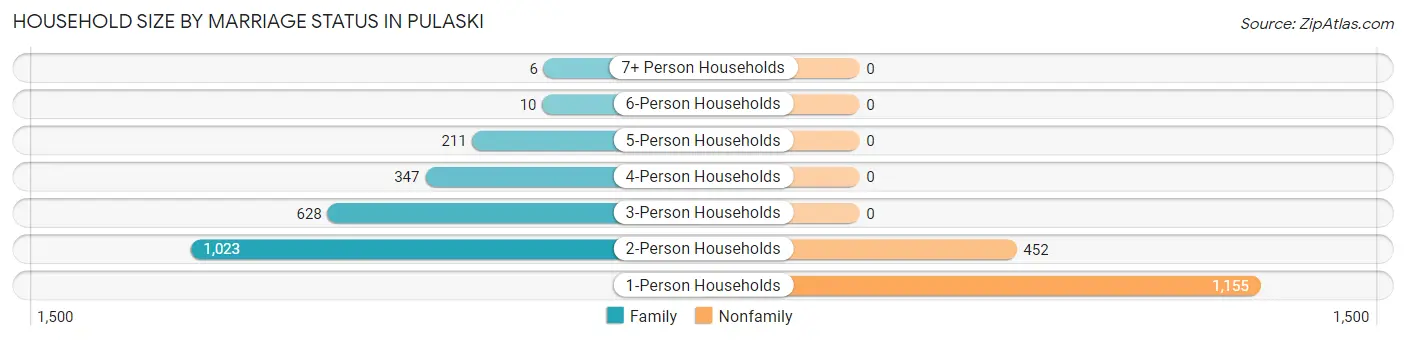
| Household Size | Family Households | Nonfamily Households |
| 1-Person Households | - | 1,155 (30.1%) |
| 2-Person Households | 1,023 (26.7%) | 452 (11.8%) |
| 3-Person Households | 628 (16.4%) | 0 (0.0%) |
| 4-Person Households | 347 (9.1%) | 0 (0.0%) |
| 5-Person Households | 211 (5.5%) | 0 (0.0%) |
| 6-Person Households | 10 (0.3%) | 0 (0.0%) |
| 7+ Person Households | 6 (0.2%) | 0 (0.0%) |
| Total | 2,225 (58.1%) | 1,607 (41.9%) |
Female Fertility in Pulaski
Fertility by Age in Pulaski
Average fertility rate in Pulaski is 40.0 births per 1,000 women. Women in the age bracket of 20 to 34 years have the highest fertility rate with 78.0 births per 1,000 women. Women in the age bracket of 20 to 34 years acount for 100.0% of all women with births.
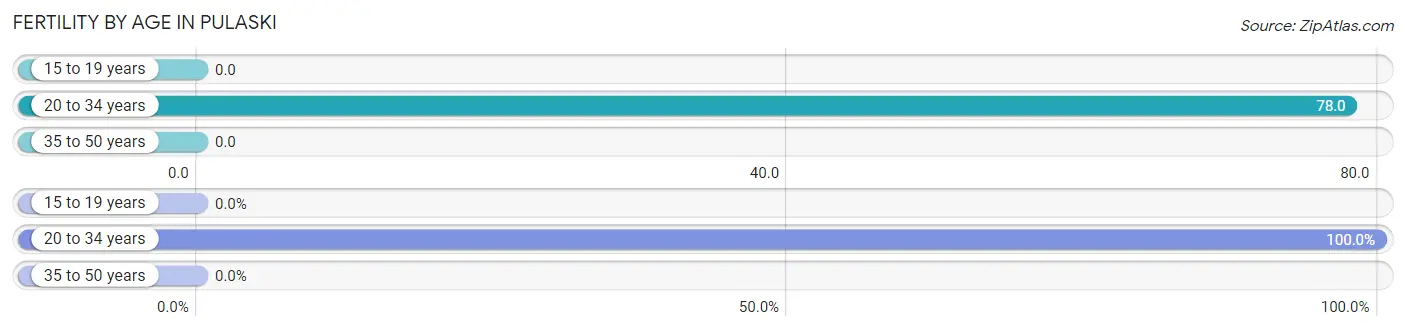
| Age Bracket | Women with Births | Births / 1,000 Women |
| 15 to 19 years | 0 (0.0%) | 0.0 |
| 20 to 34 years | 77 (100.0%) | 78.0 |
| 35 to 50 years | 0 (0.0%) | 0.0 |
| Total | 77 (100.0%) | 40.0 |
Fertility by Age by Marriage Status in Pulaski
26.0% of women with births (77) in Pulaski are married. The highest percentage of unmarried women with births falls into 20 to 34 years age bracket with 74.0% of them unmarried at the time of birth, while the lowest percentage of unmarried women with births belong to 20 to 34 years age bracket with 74.0% of them unmarried.
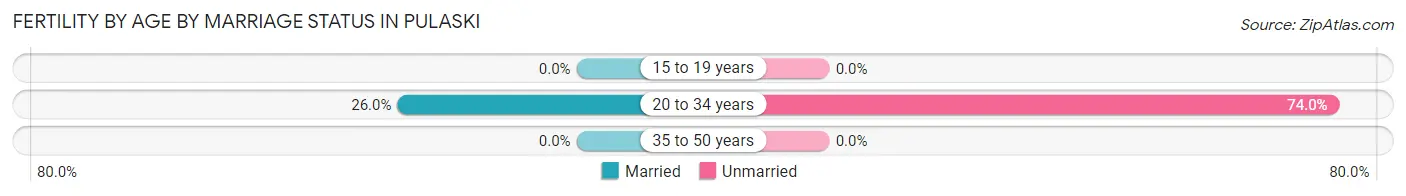
| Age Bracket | Married | Unmarried |
| 15 to 19 years | 0 (0.0%) | 0 (0.0%) |
| 20 to 34 years | 20 (26.0%) | 57 (74.0%) |
| 35 to 50 years | 0 (0.0%) | 0 (0.0%) |
| Total | 20 (26.0%) | 57 (74.0%) |
Fertility by Education in Pulaski
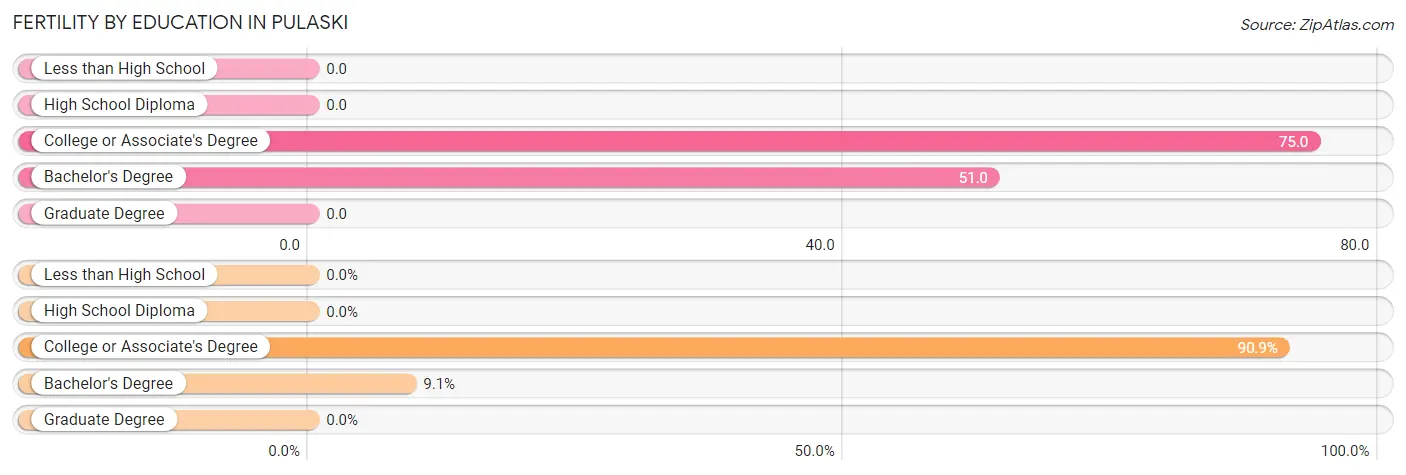
| Educational Attainment | Women with Births | Births / 1,000 Women |
| Less than High School | 0 (0.0%) | 0.0 |
| High School Diploma | 0 (0.0%) | 0.0 |
| College or Associate's Degree | 70 (90.9%) | 75.0 |
| Bachelor's Degree | 7 (9.1%) | 51.0 |
| Graduate Degree | 0 (0.0%) | 0.0 |
| Total | 77 (100.0%) | 40.0 |
Fertility by Education by Marriage Status in Pulaski
74.0% of women with births in Pulaski are unmarried. Women with the educational attainment of bachelor's degree are most likely to be married with 100.0% of them married at childbirth, while women with the educational attainment of college or associate's degree are least likely to be married with 81.4% of them unmarried at childbirth.
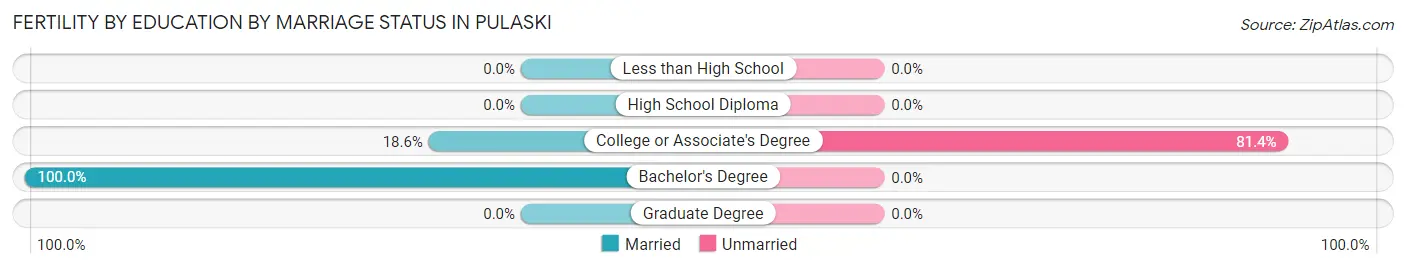
| Educational Attainment | Married | Unmarried |
| Less than High School | 0 (0.0%) | 0 (0.0%) |
| High School Diploma | 0 (0.0%) | 0 (0.0%) |
| College or Associate's Degree | 13 (18.6%) | 57 (81.4%) |
| Bachelor's Degree | 7 (100.0%) | 0 (0.0%) |
| Graduate Degree | 0 (0.0%) | 0 (0.0%) |
| Total | 20 (26.0%) | 57 (74.0%) |
Employment Characteristics in Pulaski
Employment by Class of Employer in Pulaski
Among the 3,977 employed individuals in Pulaski, private company employees (2,671 | 67.2%), local government employees (385 | 9.7%), and state government employees (308 | 7.7%) make up the most common classes of employment.
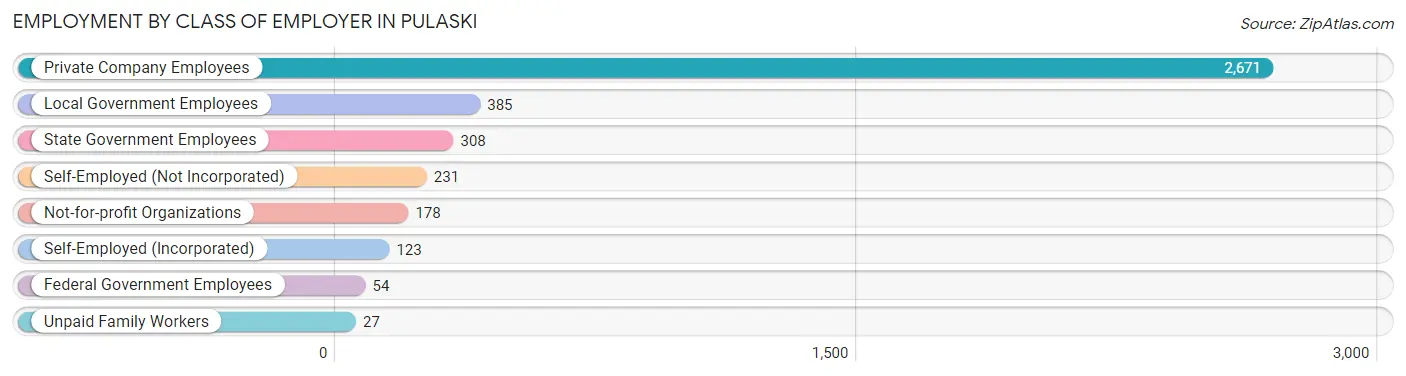
| Employer Class | # Employees | % Employees |
| Private Company Employees | 2,671 | 67.2% |
| Self-Employed (Incorporated) | 123 | 3.1% |
| Self-Employed (Not Incorporated) | 231 | 5.8% |
| Not-for-profit Organizations | 178 | 4.5% |
| Local Government Employees | 385 | 9.7% |
| State Government Employees | 308 | 7.7% |
| Federal Government Employees | 54 | 1.4% |
| Unpaid Family Workers | 27 | 0.7% |
| Total | 3,977 | 100.0% |
Employment Status by Age in Pulaski
According to the labor force statistics for Pulaski, out of the total population over 16 years of age (7,531), 55.3% or 4,165 individuals are in the labor force, with 4.1% or 171 of them unemployed. The age group with the highest labor force participation rate is 25 to 29 years, with 89.9% or 682 individuals in the labor force. Within the labor force, the 20 to 24 years age range has the highest percentage of unemployed individuals, with 11.8% or 42 of them being unemployed.
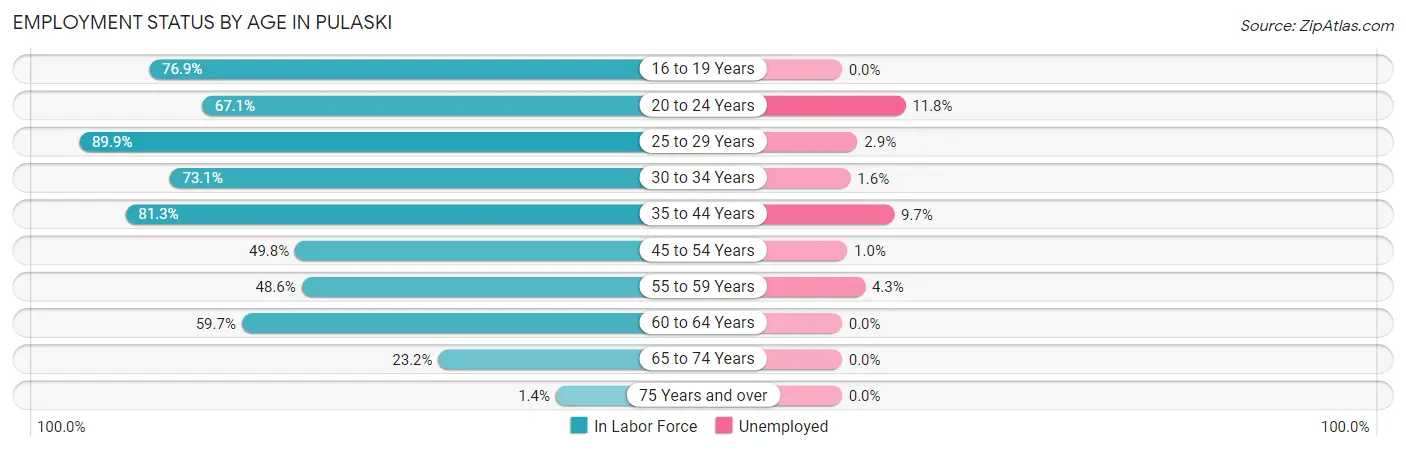
| Age Bracket | In Labor Force | Unemployed |
| 16 to 19 Years | 250 (76.9%) | 0 (0.0%) |
| 20 to 24 Years | 357 (67.1%) | 42 (11.8%) |
| 25 to 29 Years | 682 (89.9%) | 20 (2.9%) |
| 30 to 34 Years | 705 (73.1%) | 11 (1.6%) |
| 35 to 44 Years | 771 (81.3%) | 75 (9.7%) |
| 45 to 54 Years | 519 (49.8%) | 5 (1.0%) |
| 55 to 59 Years | 397 (48.6%) | 17 (4.3%) |
| 60 to 64 Years | 231 (59.7%) | 0 (0.0%) |
| 65 to 74 Years | 242 (23.2%) | 0 (0.0%) |
| 75 Years and over | 10 (1.4%) | 0 (0.0%) |
| Total | 4,165 (55.3%) | 171 (4.1%) |
Employment Status by Educational Attainment in Pulaski
According to labor force statistics for Pulaski, 67.2% of individuals (3,304) out of the total population between 25 and 64 years of age (4,917) are in the labor force, with 3.9% or 129 of them being unemployed. The group with the highest labor force participation rate are those with the educational attainment of bachelor's degree or higher, with 94.5% or 786 individuals in the labor force. Within the labor force, individuals with high school diploma education have the highest percentage of unemployment, with 6.9% or 56 of them being unemployed.
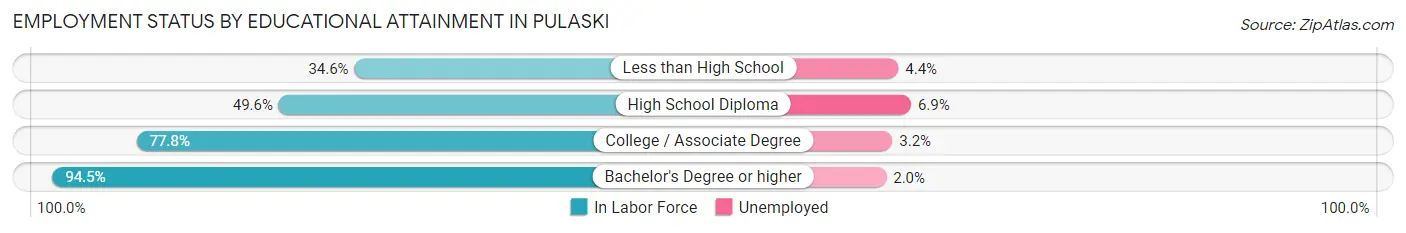
| Educational Attainment | In Labor Force | Unemployed |
| Less than High School | 159 (34.6%) | 20 (4.4%) |
| High School Diploma | 810 (49.6%) | 113 (6.9%) |
| College / Associate Degree | 1,550 (77.8%) | 64 (3.2%) |
| Bachelor's Degree or higher | 786 (94.5%) | 17 (2.0%) |
| Total | 3,304 (67.2%) | 192 (3.9%) |
Employment Occupations by Sex in Pulaski
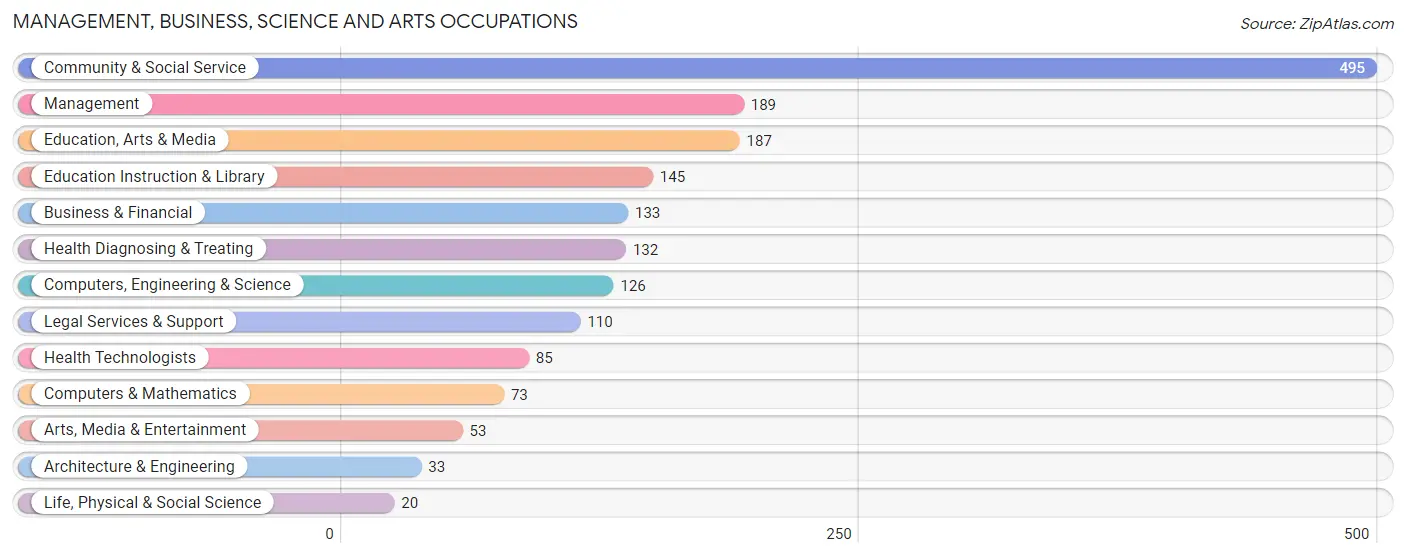
Management, Business, Science and Arts Occupations
The most common Management, Business, Science and Arts occupations in Pulaski are Community & Social Service (495 | 12.4%), Management (189 | 4.7%), Education, Arts & Media (187 | 4.7%), Education Instruction & Library (145 | 3.6%), and Business & Financial (133 | 3.3%).
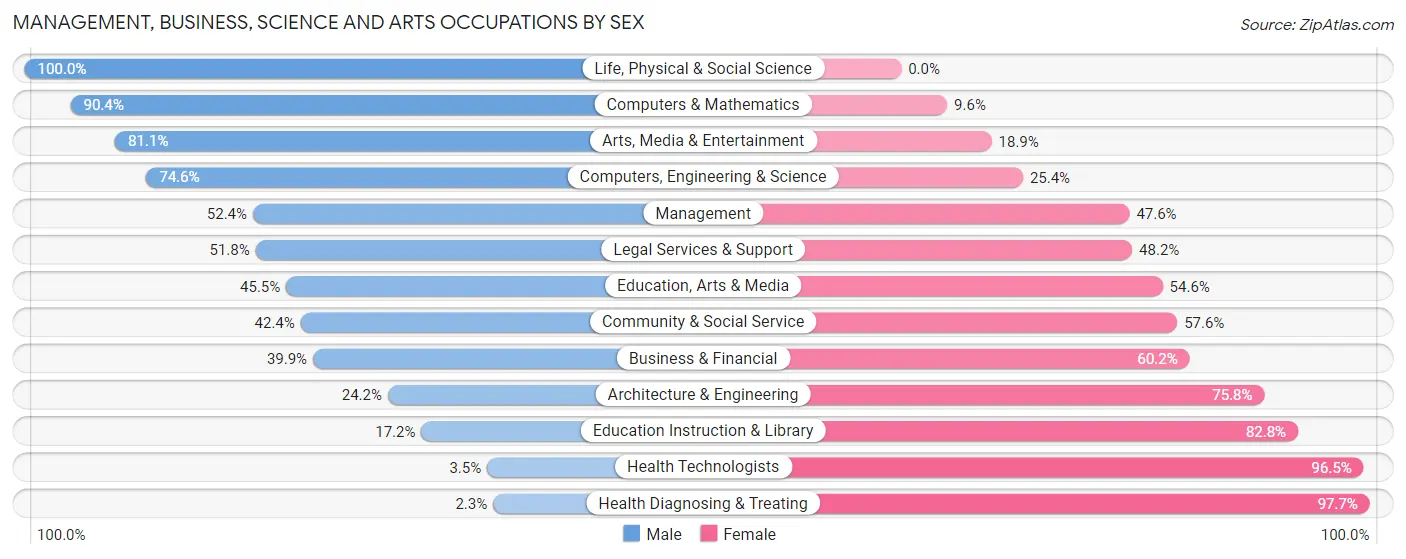
Management, Business, Science and Arts Occupations by Sex
Within the Management, Business, Science and Arts occupations in Pulaski, the most male-oriented occupations are Life, Physical & Social Science (100.0%), Computers & Mathematics (90.4%), and Arts, Media & Entertainment (81.1%), while the most female-oriented occupations are Health Diagnosing & Treating (97.7%), Health Technologists (96.5%), and Education Instruction & Library (82.8%).
| Occupation | Male | Female |
| Management | 99 (52.4%) | 90 (47.6%) |
| Business & Financial | 53 (39.9%) | 80 (60.2%) |
| Computers, Engineering & Science | 94 (74.6%) | 32 (25.4%) |
| Computers & Mathematics | 66 (90.4%) | 7 (9.6%) |
| Architecture & Engineering | 8 (24.2%) | 25 (75.8%) |
| Life, Physical & Social Science | 20 (100.0%) | 0 (0.0%) |
| Community & Social Service | 210 (42.4%) | 285 (57.6%) |
| Education, Arts & Media | 85 (45.5%) | 102 (54.5%) |
| Legal Services & Support | 57 (51.8%) | 53 (48.2%) |
| Education Instruction & Library | 25 (17.2%) | 120 (82.8%) |
| Arts, Media & Entertainment | 43 (81.1%) | 10 (18.9%) |
| Health Diagnosing & Treating | 3 (2.3%) | 129 (97.7%) |
| Health Technologists | 3 (3.5%) | 82 (96.5%) |
| Total (Category) | 459 (42.7%) | 616 (57.3%) |
| Total (Overall) | 2,286 (57.2%) | 1,708 (42.8%) |
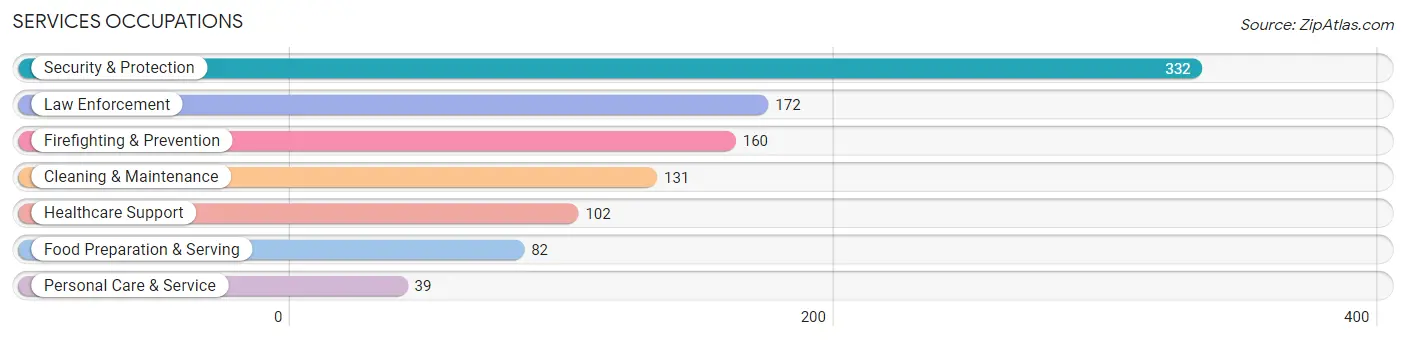
Services Occupations
The most common Services occupations in Pulaski are Security & Protection (332 | 8.3%), Law Enforcement (172 | 4.3%), Firefighting & Prevention (160 | 4.0%), Cleaning & Maintenance (131 | 3.3%), and Healthcare Support (102 | 2.5%).
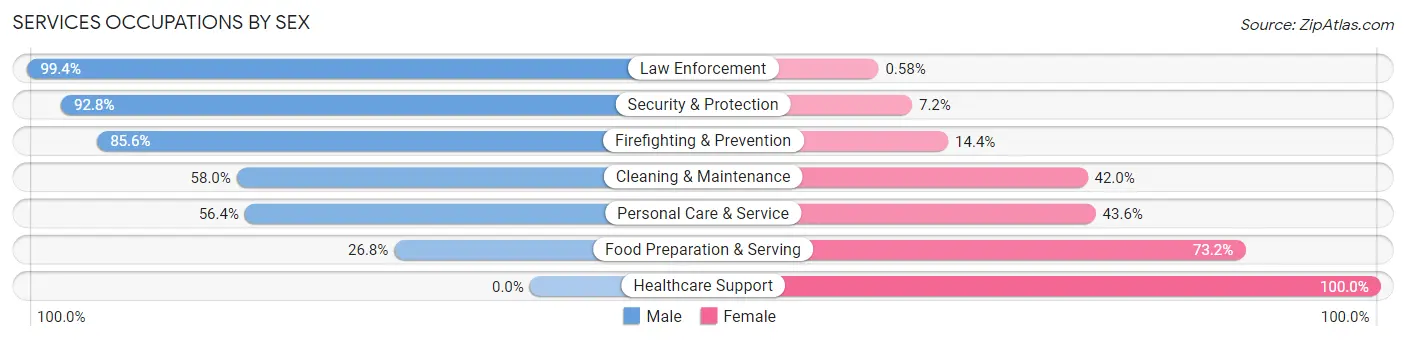
Services Occupations by Sex
Within the Services occupations in Pulaski, the most male-oriented occupations are Law Enforcement (99.4%), Security & Protection (92.8%), and Firefighting & Prevention (85.6%), while the most female-oriented occupations are Healthcare Support (100.0%), Food Preparation & Serving (73.2%), and Personal Care & Service (43.6%).
| Occupation | Male | Female |
| Healthcare Support | 0 (0.0%) | 102 (100.0%) |
| Security & Protection | 308 (92.8%) | 24 (7.2%) |
| Firefighting & Prevention | 137 (85.6%) | 23 (14.4%) |
| Law Enforcement | 171 (99.4%) | 1 (0.6%) |
| Food Preparation & Serving | 22 (26.8%) | 60 (73.2%) |
| Cleaning & Maintenance | 76 (58.0%) | 55 (42.0%) |
| Personal Care & Service | 22 (56.4%) | 17 (43.6%) |
| Total (Category) | 428 (62.4%) | 258 (37.6%) |
| Total (Overall) | 2,286 (57.2%) | 1,708 (42.8%) |
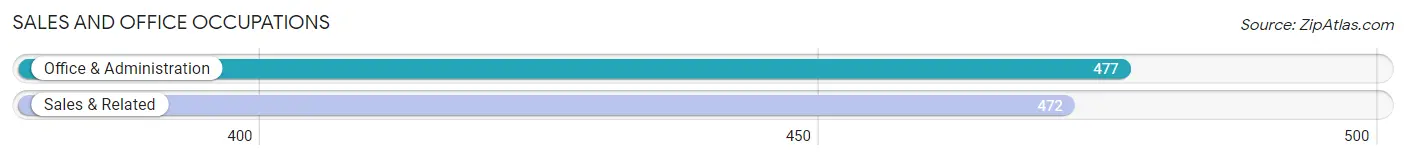
Sales and Office Occupations
The most common Sales and Office occupations in Pulaski are Office & Administration (477 | 11.9%), and Sales & Related (472 | 11.8%).
Sales and Office Occupations by Sex
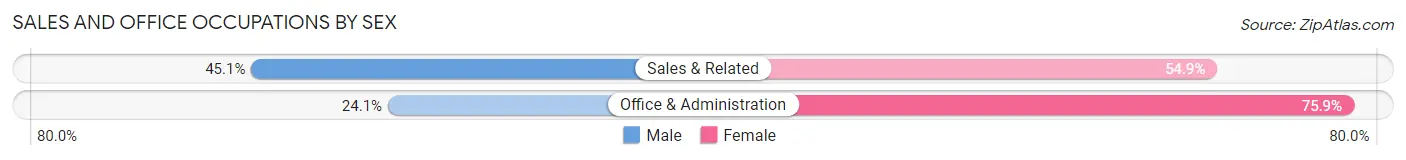
| Occupation | Male | Female |
| Sales & Related | 213 (45.1%) | 259 (54.9%) |
| Office & Administration | 115 (24.1%) | 362 (75.9%) |
| Total (Category) | 328 (34.6%) | 621 (65.4%) |
| Total (Overall) | 2,286 (57.2%) | 1,708 (42.8%) |
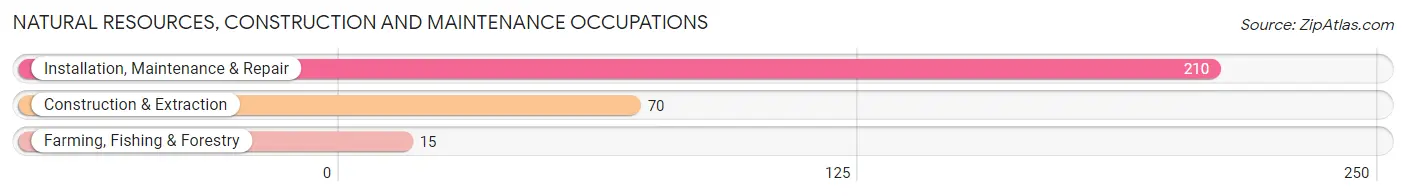
Natural Resources, Construction and Maintenance Occupations
The most common Natural Resources, Construction and Maintenance occupations in Pulaski are Installation, Maintenance & Repair (210 | 5.3%), Construction & Extraction (70 | 1.8%), and Farming, Fishing & Forestry (15 | 0.4%).
Natural Resources, Construction and Maintenance Occupations by Sex
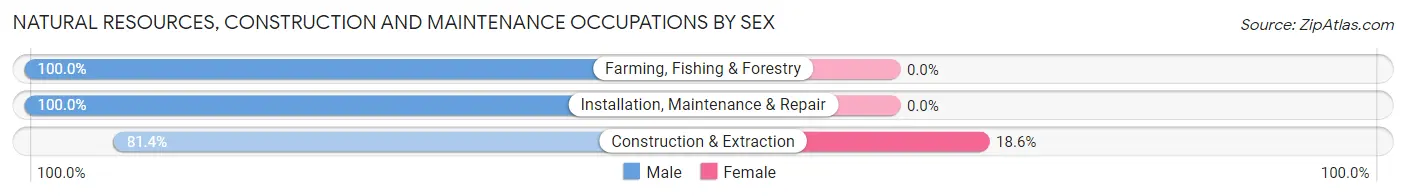
| Occupation | Male | Female |
| Farming, Fishing & Forestry | 15 (100.0%) | 0 (0.0%) |
| Construction & Extraction | 57 (81.4%) | 13 (18.6%) |
| Installation, Maintenance & Repair | 210 (100.0%) | 0 (0.0%) |
| Total (Category) | 282 (95.6%) | 13 (4.4%) |
| Total (Overall) | 2,286 (57.2%) | 1,708 (42.8%) |
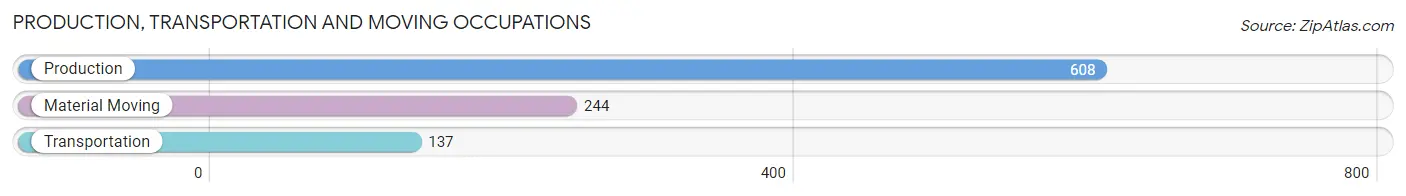
Production, Transportation and Moving Occupations
The most common Production, Transportation and Moving occupations in Pulaski are Production (608 | 15.2%), Material Moving (244 | 6.1%), and Transportation (137 | 3.4%).
Production, Transportation and Moving Occupations by Sex
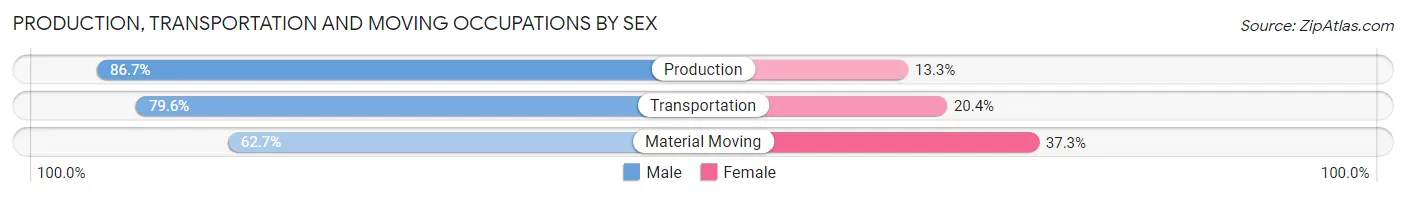
| Occupation | Male | Female |
| Production | 527 (86.7%) | 81 (13.3%) |
| Transportation | 109 (79.6%) | 28 (20.4%) |
| Material Moving | 153 (62.7%) | 91 (37.3%) |
| Total (Category) | 789 (79.8%) | 200 (20.2%) |
| Total (Overall) | 2,286 (57.2%) | 1,708 (42.8%) |
Employment Industries by Sex in Pulaski
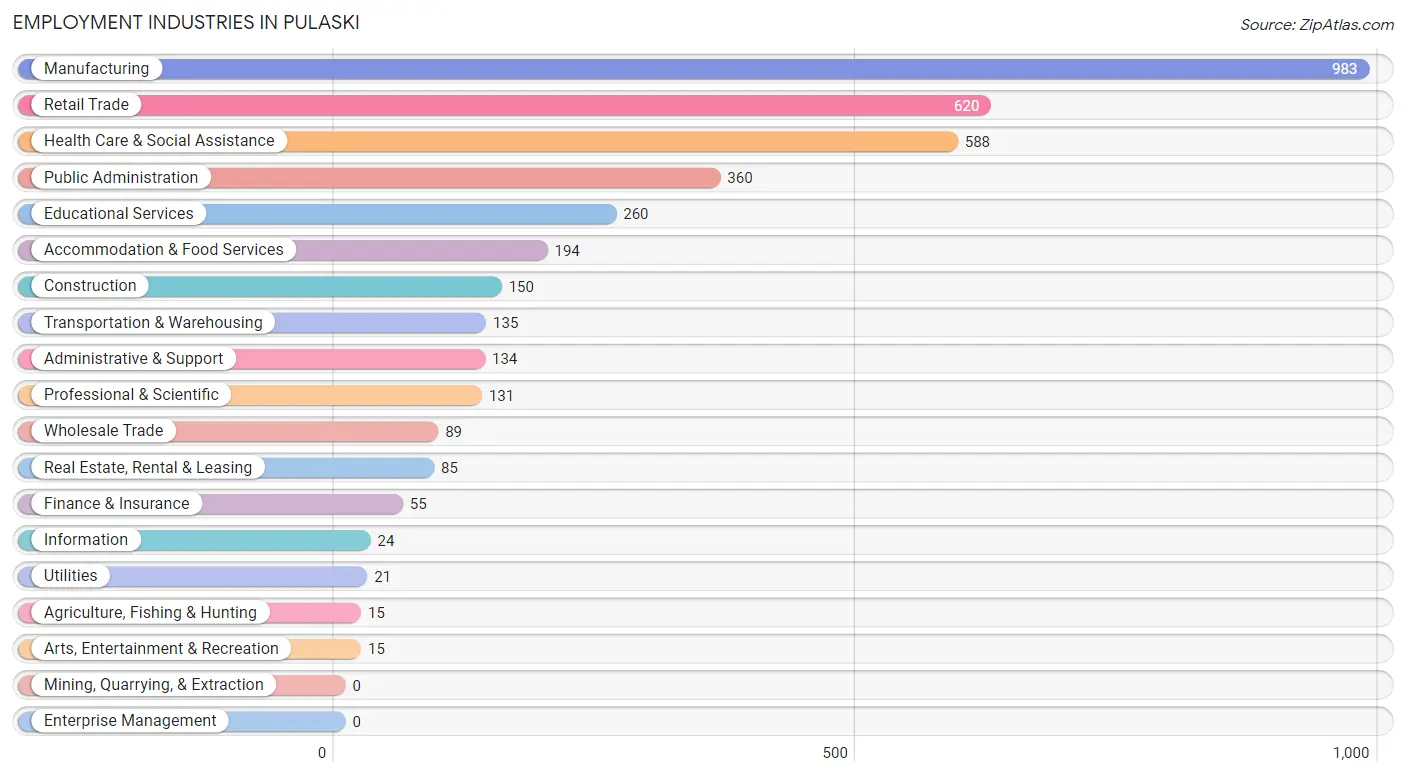
Employment Industries in Pulaski
The major employment industries in Pulaski include Manufacturing (983 | 24.6%), Retail Trade (620 | 15.5%), Health Care & Social Assistance (588 | 14.7%), Public Administration (360 | 9.0%), and Educational Services (260 | 6.5%).
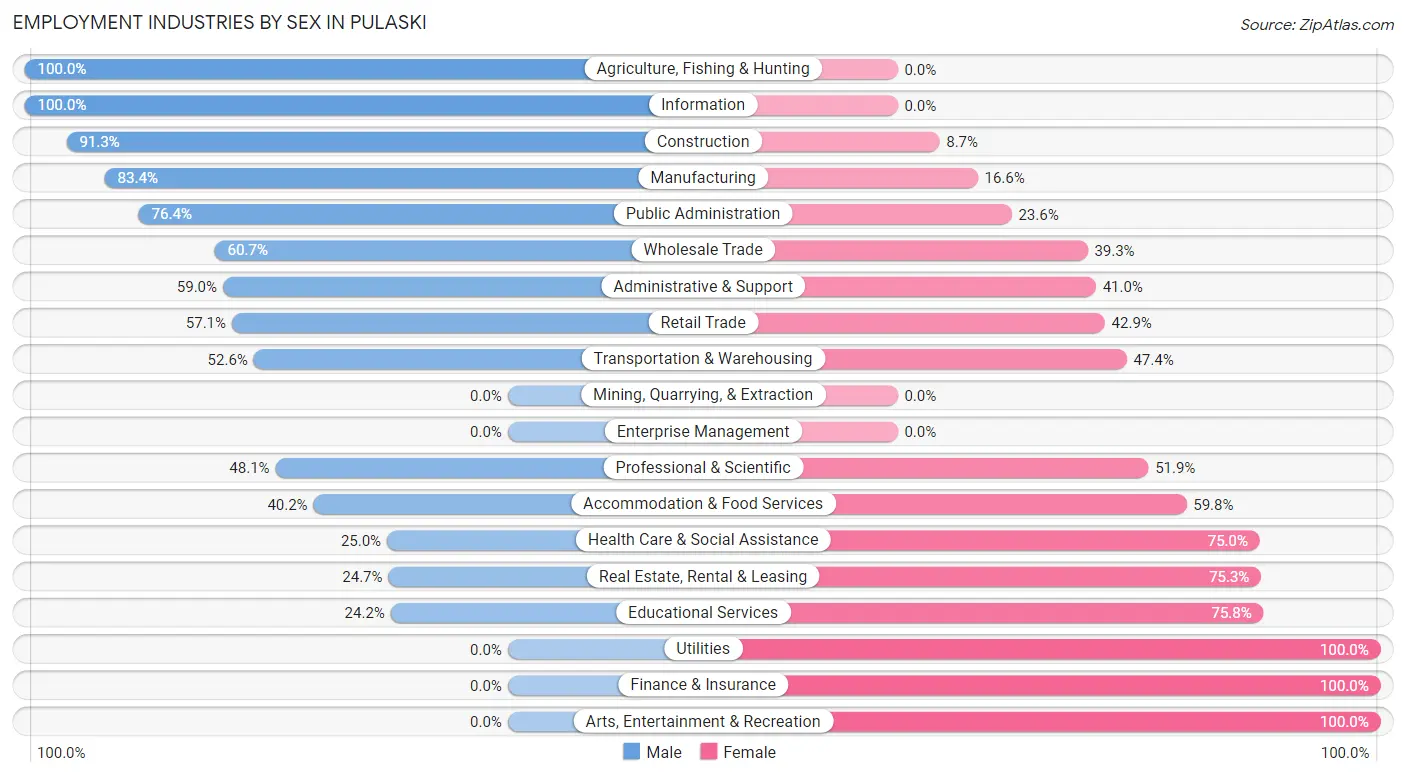
Employment Industries by Sex in Pulaski
The Pulaski industries that see more men than women are Agriculture, Fishing & Hunting (100.0%), Information (100.0%), and Construction (91.3%), whereas the industries that tend to have a higher number of women are Utilities (100.0%), Finance & Insurance (100.0%), and Arts, Entertainment & Recreation (100.0%).
| Industry | Male | Female |
| Agriculture, Fishing & Hunting | 15 (100.0%) | 0 (0.0%) |
| Mining, Quarrying, & Extraction | 0 (0.0%) | 0 (0.0%) |
| Construction | 137 (91.3%) | 13 (8.7%) |
| Manufacturing | 820 (83.4%) | 163 (16.6%) |
| Wholesale Trade | 54 (60.7%) | 35 (39.3%) |
| Retail Trade | 354 (57.1%) | 266 (42.9%) |
| Transportation & Warehousing | 71 (52.6%) | 64 (47.4%) |
| Utilities | 0 (0.0%) | 21 (100.0%) |
| Information | 24 (100.0%) | 0 (0.0%) |
| Finance & Insurance | 0 (0.0%) | 55 (100.0%) |
| Real Estate, Rental & Leasing | 21 (24.7%) | 64 (75.3%) |
| Professional & Scientific | 63 (48.1%) | 68 (51.9%) |
| Enterprise Management | 0 (0.0%) | 0 (0.0%) |
| Administrative & Support | 79 (59.0%) | 55 (41.0%) |
| Educational Services | 63 (24.2%) | 197 (75.8%) |
| Health Care & Social Assistance | 147 (25.0%) | 441 (75.0%) |
| Arts, Entertainment & Recreation | 0 (0.0%) | 15 (100.0%) |
| Accommodation & Food Services | 78 (40.2%) | 116 (59.8%) |
| Public Administration | 275 (76.4%) | 85 (23.6%) |
| Total | 2,286 (57.2%) | 1,708 (42.8%) |
Education in Pulaski
School Enrollment in Pulaski
The most common levels of schooling among the 1,469 students in Pulaski are elementary school (380 | 25.9%), middle school (333 | 22.7%), and high school (321 | 21.8%).
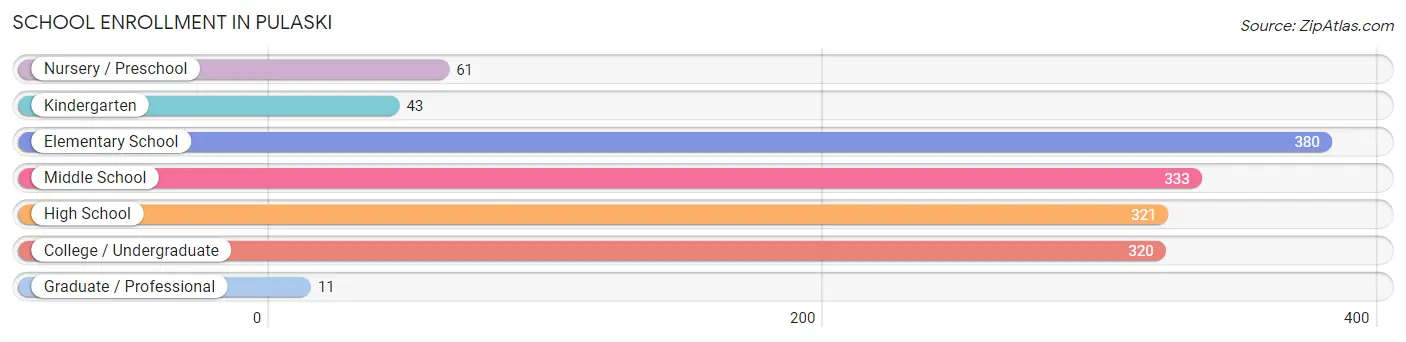
| School Level | # Students | % Students |
| Nursery / Preschool | 61 | 4.2% |
| Kindergarten | 43 | 2.9% |
| Elementary School | 380 | 25.9% |
| Middle School | 333 | 22.7% |
| High School | 321 | 21.8% |
| College / Undergraduate | 320 | 21.8% |
| Graduate / Professional | 11 | 0.7% |
| Total | 1,469 | 100.0% |
School Enrollment by Age by Funding Source in Pulaski
Out of a total of 1,469 students who are enrolled in schools in Pulaski, 137 (9.3%) attend a private institution, while the remaining 1,332 (90.7%) are enrolled in public schools. The age group of 3 to 4 year olds has the highest likelihood of being enrolled in private schools, with 29 (55.8% in the age bracket) enrolled. Conversely, the age group of 10 to 14 year olds has the lowest likelihood of being enrolled in a private school, with 466 (100.0% in the age bracket) attending a public institution.
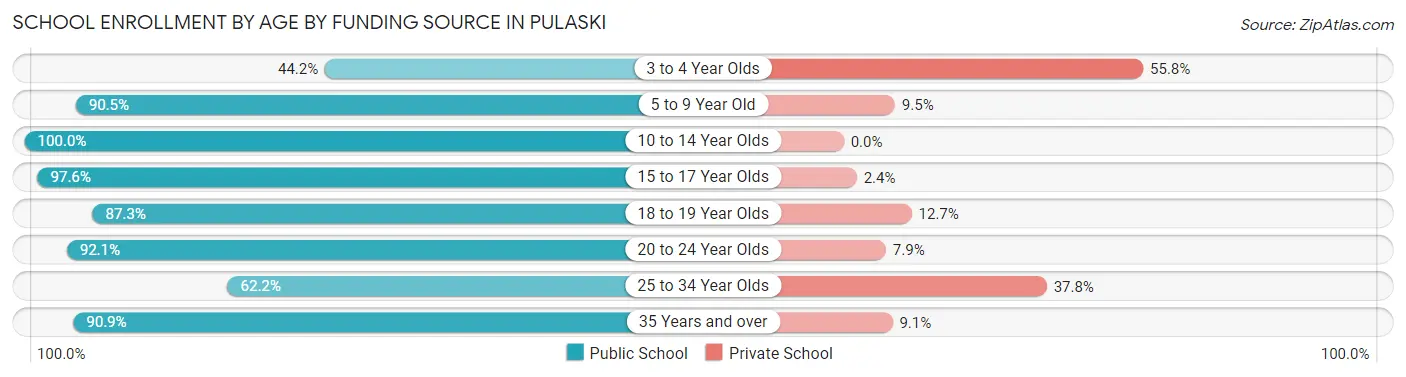
| Age Bracket | Public School | Private School |
| 3 to 4 Year Olds | 23 (44.2%) | 29 (55.8%) |
| 5 to 9 Year Old | 313 (90.5%) | 33 (9.5%) |
| 10 to 14 Year Olds | 466 (100.0%) | 0 (0.0%) |
| 15 to 17 Year Olds | 241 (97.6%) | 6 (2.4%) |
| 18 to 19 Year Olds | 69 (87.3%) | 10 (12.7%) |
| 20 to 24 Year Olds | 117 (92.1%) | 10 (7.9%) |
| 25 to 34 Year Olds | 74 (62.2%) | 45 (37.8%) |
| 35 Years and over | 30 (90.9%) | 3 (9.1%) |
| Total | 1,332 (90.7%) | 137 (9.3%) |
Educational Attainment by Field of Study in Pulaski
Psychology (234 | 19.6%), business (159 | 13.3%), education (156 | 13.1%), liberal arts & history (127 | 10.6%), and arts & humanities (122 | 10.2%) are the most common fields of study among 1,192 individuals in Pulaski who have obtained a bachelor's degree or higher.
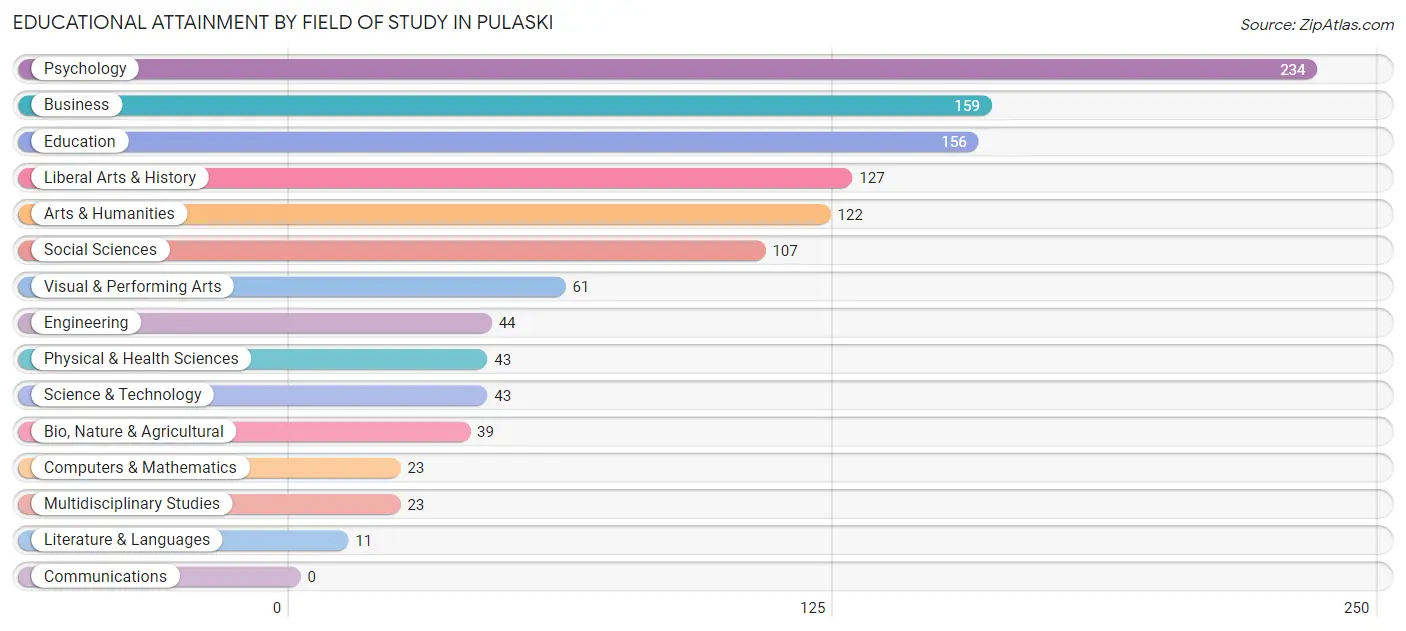
| Field of Study | # Graduates | % Graduates |
| Computers & Mathematics | 23 | 1.9% |
| Bio, Nature & Agricultural | 39 | 3.3% |
| Physical & Health Sciences | 43 | 3.6% |
| Psychology | 234 | 19.6% |
| Social Sciences | 107 | 9.0% |
| Engineering | 44 | 3.7% |
| Multidisciplinary Studies | 23 | 1.9% |
| Science & Technology | 43 | 3.6% |
| Business | 159 | 13.3% |
| Education | 156 | 13.1% |
| Literature & Languages | 11 | 0.9% |
| Liberal Arts & History | 127 | 10.6% |
| Visual & Performing Arts | 61 | 5.1% |
| Communications | 0 | 0.0% |
| Arts & Humanities | 122 | 10.2% |
| Total | 1,192 | 100.0% |
Transportation & Commute in Pulaski
Vehicle Availability by Sex in Pulaski
The most prevalent vehicle ownership categories in Pulaski are males with 2 vehicles (1,091, accounting for 47.8%) and females with 2 vehicles (668, making up 64.4%).
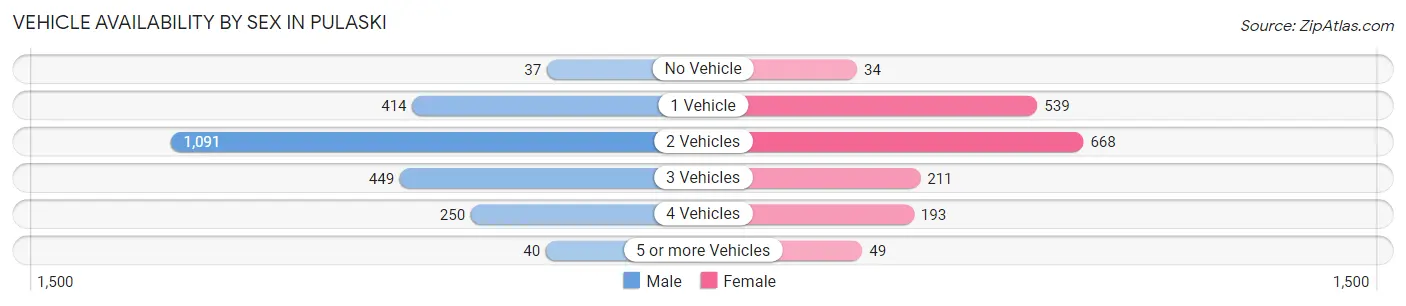
| Vehicles Available | Male | Female |
| No Vehicle | 37 (1.6%) | 34 (2.0%) |
| 1 Vehicle | 414 (18.1%) | 539 (31.8%) |
| 2 Vehicles | 1,091 (47.8%) | 668 (39.4%) |
| 3 Vehicles | 449 (19.7%) | 211 (12.5%) |
| 4 Vehicles | 250 (11.0%) | 193 (11.4%) |
| 5 or more Vehicles | 40 (1.8%) | 49 (2.9%) |
| Total | 2,281 (100.0%) | 1,694 (100.0%) |
Commute Time in Pulaski
The most frequently occuring commute durations in Pulaski are 15 to 19 minutes (771 commuters, 21.1%), 10 to 14 minutes (699 commuters, 19.2%), and 5 to 9 minutes (478 commuters, 13.1%).
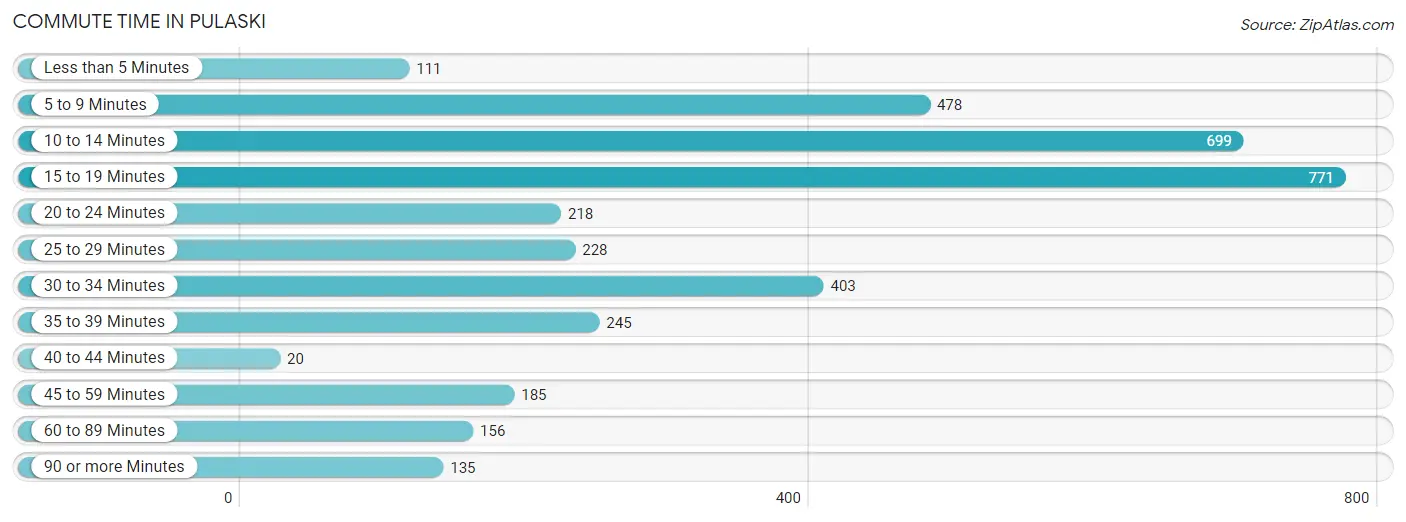
| Commute Time | # Commuters | % Commuters |
| Less than 5 Minutes | 111 | 3.0% |
| 5 to 9 Minutes | 478 | 13.1% |
| 10 to 14 Minutes | 699 | 19.2% |
| 15 to 19 Minutes | 771 | 21.1% |
| 20 to 24 Minutes | 218 | 6.0% |
| 25 to 29 Minutes | 228 | 6.2% |
| 30 to 34 Minutes | 403 | 11.0% |
| 35 to 39 Minutes | 245 | 6.7% |
| 40 to 44 Minutes | 20 | 0.5% |
| 45 to 59 Minutes | 185 | 5.1% |
| 60 to 89 Minutes | 156 | 4.3% |
| 90 or more Minutes | 135 | 3.7% |
Commute Time by Sex in Pulaski
The most common commute times in Pulaski are 10 to 14 minutes (522 commuters, 25.1%) for males and 15 to 19 minutes (356 commuters, 22.7%) for females.
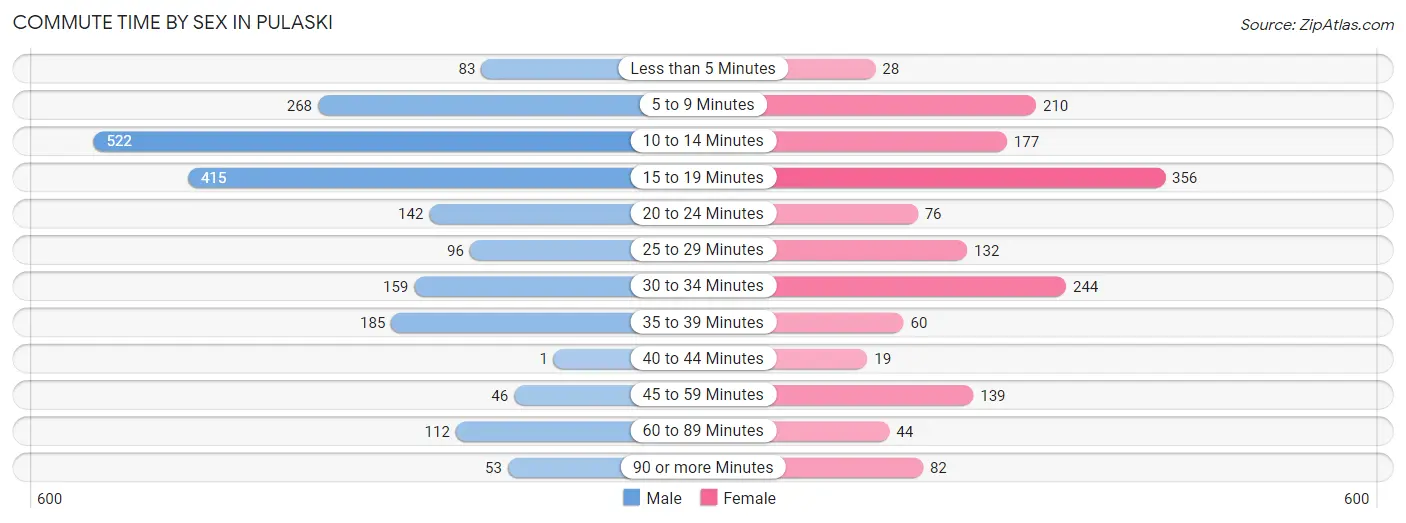
| Commute Time | Male | Female |
| Less than 5 Minutes | 83 (4.0%) | 28 (1.8%) |
| 5 to 9 Minutes | 268 (12.9%) | 210 (13.4%) |
| 10 to 14 Minutes | 522 (25.1%) | 177 (11.3%) |
| 15 to 19 Minutes | 415 (19.9%) | 356 (22.7%) |
| 20 to 24 Minutes | 142 (6.8%) | 76 (4.9%) |
| 25 to 29 Minutes | 96 (4.6%) | 132 (8.4%) |
| 30 to 34 Minutes | 159 (7.6%) | 244 (15.6%) |
| 35 to 39 Minutes | 185 (8.9%) | 60 (3.8%) |
| 40 to 44 Minutes | 1 (0.1%) | 19 (1.2%) |
| 45 to 59 Minutes | 46 (2.2%) | 139 (8.9%) |
| 60 to 89 Minutes | 112 (5.4%) | 44 (2.8%) |
| 90 or more Minutes | 53 (2.5%) | 82 (5.2%) |
Time of Departure to Work by Sex in Pulaski
The most frequent times of departure to work in Pulaski are 12:00 PM to 3:59 PM (359, 17.2%) for males and 12:00 PM to 3:59 PM (267, 17.0%) for females.
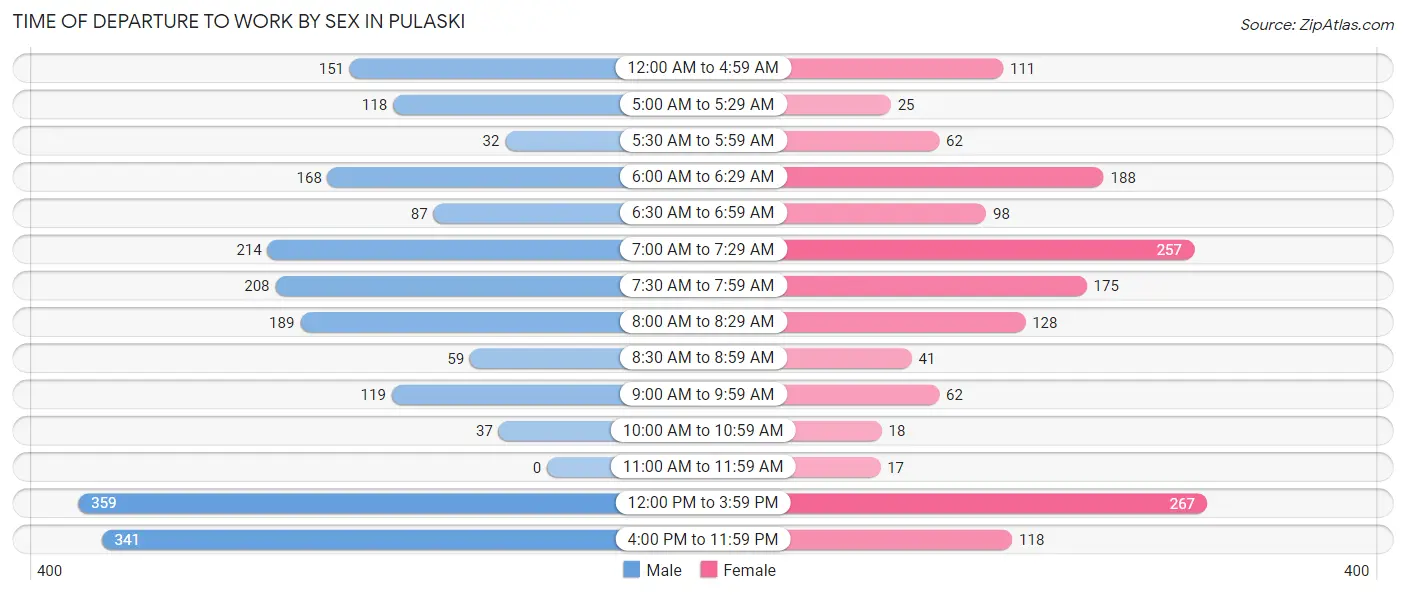
| Time of Departure | Male | Female |
| 12:00 AM to 4:59 AM | 151 (7.2%) | 111 (7.1%) |
| 5:00 AM to 5:29 AM | 118 (5.7%) | 25 (1.6%) |
| 5:30 AM to 5:59 AM | 32 (1.5%) | 62 (4.0%) |
| 6:00 AM to 6:29 AM | 168 (8.1%) | 188 (12.0%) |
| 6:30 AM to 6:59 AM | 87 (4.2%) | 98 (6.2%) |
| 7:00 AM to 7:29 AM | 214 (10.3%) | 257 (16.4%) |
| 7:30 AM to 7:59 AM | 208 (10.0%) | 175 (11.2%) |
| 8:00 AM to 8:29 AM | 189 (9.1%) | 128 (8.2%) |
| 8:30 AM to 8:59 AM | 59 (2.8%) | 41 (2.6%) |
| 9:00 AM to 9:59 AM | 119 (5.7%) | 62 (4.0%) |
| 10:00 AM to 10:59 AM | 37 (1.8%) | 18 (1.1%) |
| 11:00 AM to 11:59 AM | 0 (0.0%) | 17 (1.1%) |
| 12:00 PM to 3:59 PM | 359 (17.2%) | 267 (17.0%) |
| 4:00 PM to 11:59 PM | 341 (16.4%) | 118 (7.5%) |
| Total | 2,082 (100.0%) | 1,567 (100.0%) |
Housing Occupancy in Pulaski
Occupancy by Ownership in Pulaski
Of the total 3,832 dwellings in Pulaski, owner-occupied units account for 2,119 (55.3%), while renter-occupied units make up 1,713 (44.7%).
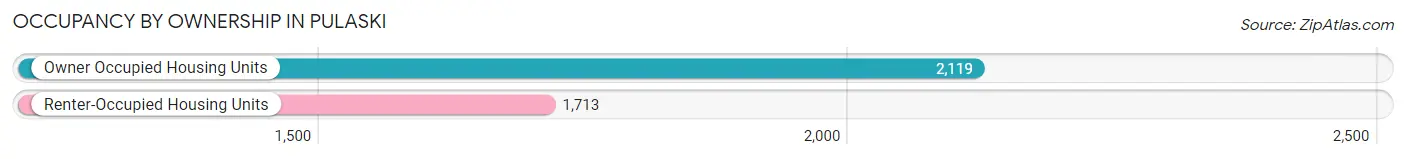
| Occupancy | # Housing Units | % Housing Units |
| Owner Occupied Housing Units | 2,119 | 55.3% |
| Renter-Occupied Housing Units | 1,713 | 44.7% |
| Total Occupied Housing Units | 3,832 | 100.0% |
Occupancy by Household Size in Pulaski
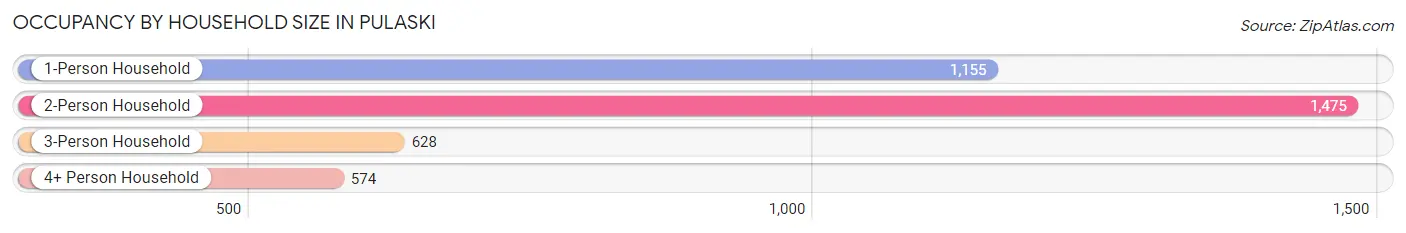
| Household Size | # Housing Units | % Housing Units |
| 1-Person Household | 1,155 | 30.1% |
| 2-Person Household | 1,475 | 38.5% |
| 3-Person Household | 628 | 16.4% |
| 4+ Person Household | 574 | 15.0% |
| Total Housing Units | 3,832 | 100.0% |
Occupancy by Ownership by Household Size in Pulaski
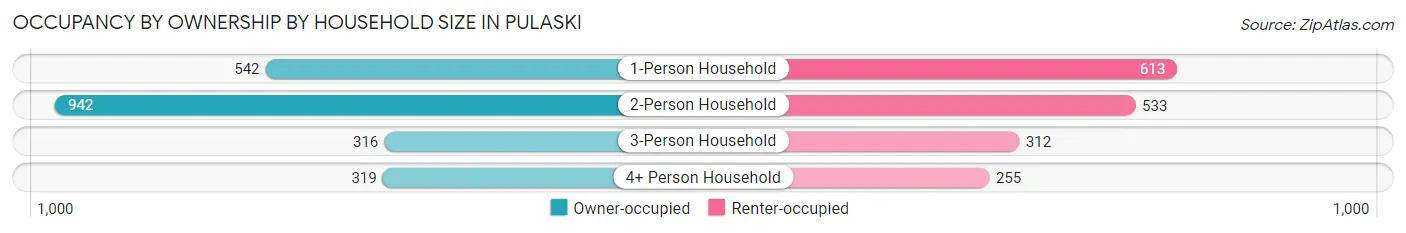
| Household Size | Owner-occupied | Renter-occupied |
| 1-Person Household | 542 (46.9%) | 613 (53.1%) |
| 2-Person Household | 942 (63.9%) | 533 (36.1%) |
| 3-Person Household | 316 (50.3%) | 312 (49.7%) |
| 4+ Person Household | 319 (55.6%) | 255 (44.4%) |
| Total Housing Units | 2,119 (55.3%) | 1,713 (44.7%) |
Occupancy by Educational Attainment in Pulaski
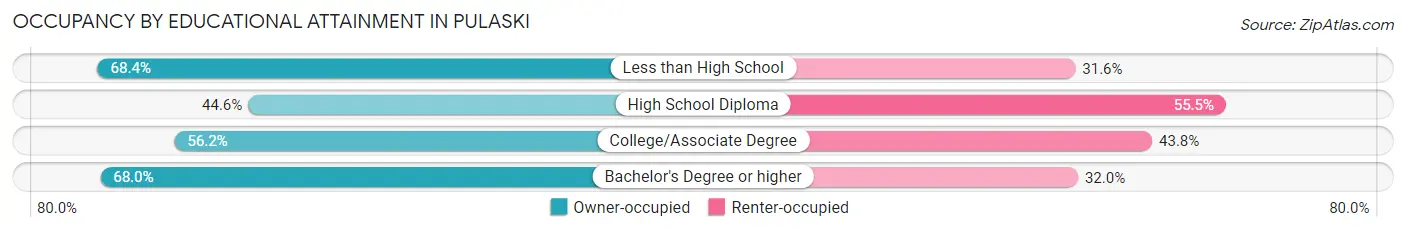
| Household Size | Owner-occupied | Renter-occupied |
| Less than High School | 262 (68.4%) | 121 (31.6%) |
| High School Diploma | 585 (44.6%) | 728 (55.4%) |
| College/Associate Degree | 862 (56.2%) | 671 (43.8%) |
| Bachelor's Degree or higher | 410 (68.0%) | 193 (32.0%) |
Occupancy by Age of Householder in Pulaski
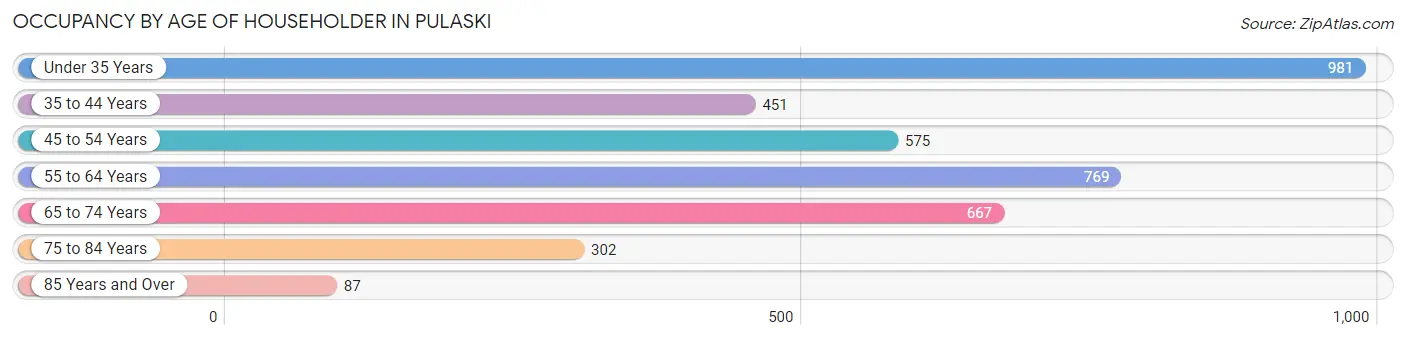
| Age Bracket | # Households | % Households |
| Under 35 Years | 981 | 25.6% |
| 35 to 44 Years | 451 | 11.8% |
| 45 to 54 Years | 575 | 15.0% |
| 55 to 64 Years | 769 | 20.1% |
| 65 to 74 Years | 667 | 17.4% |
| 75 to 84 Years | 302 | 7.9% |
| 85 Years and Over | 87 | 2.3% |
| Total | 3,832 | 100.0% |
Housing Finances in Pulaski
Median Income by Occupancy in Pulaski
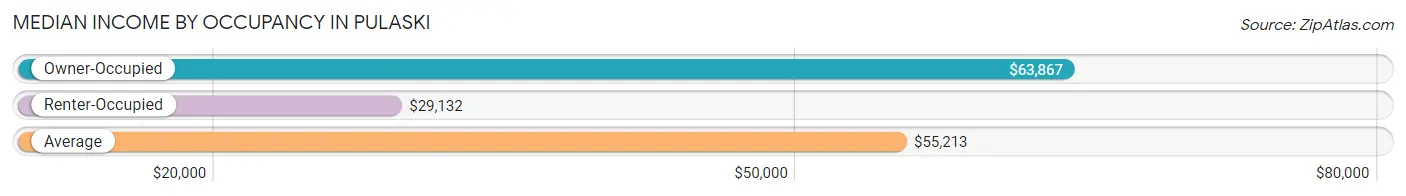
| Occupancy Type | # Households | Median Income |
| Owner-Occupied | 2,119 (55.3%) | $63,867 |
| Renter-Occupied | 1,713 (44.7%) | $29,132 |
| Average | 3,832 (100.0%) | $55,213 |
Occupancy by Householder Income Bracket in Pulaski
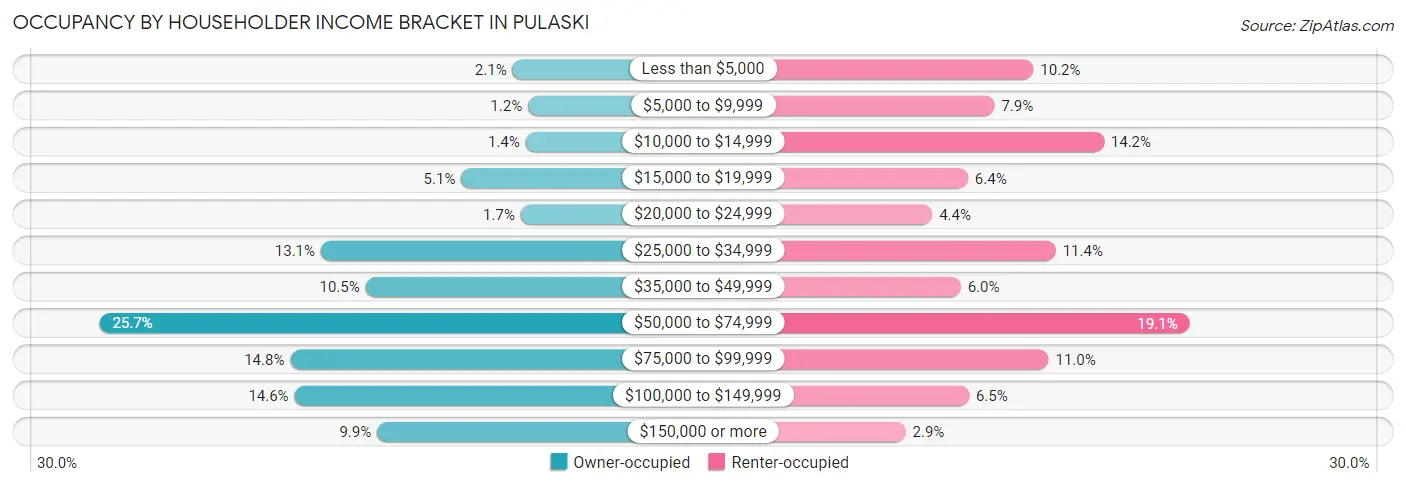
| Income Bracket | Owner-occupied | Renter-occupied |
| Less than $5,000 | 45 (2.1%) | 174 (10.2%) |
| $5,000 to $9,999 | 26 (1.2%) | 136 (7.9%) |
| $10,000 to $14,999 | 29 (1.4%) | 243 (14.2%) |
| $15,000 to $19,999 | 107 (5.1%) | 110 (6.4%) |
| $20,000 to $24,999 | 35 (1.7%) | 75 (4.4%) |
| $25,000 to $34,999 | 277 (13.1%) | 196 (11.4%) |
| $35,000 to $49,999 | 223 (10.5%) | 103 (6.0%) |
| $50,000 to $74,999 | 545 (25.7%) | 327 (19.1%) |
| $75,000 to $99,999 | 314 (14.8%) | 189 (11.0%) |
| $100,000 to $149,999 | 309 (14.6%) | 111 (6.5%) |
| $150,000 or more | 209 (9.9%) | 49 (2.9%) |
| Total | 2,119 (100.0%) | 1,713 (100.0%) |
Monthly Housing Cost Tiers in Pulaski
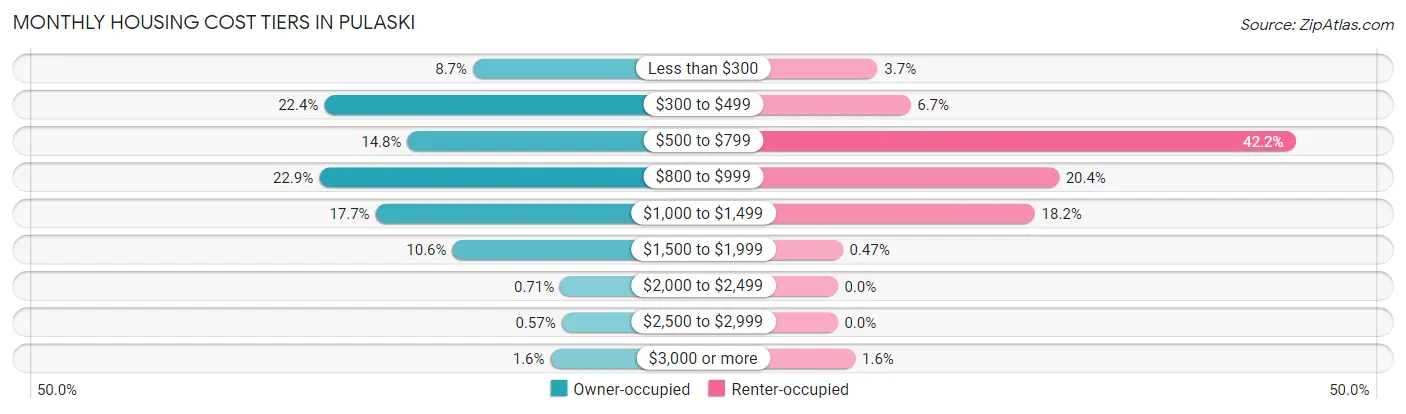
| Monthly Cost | Owner-occupied | Renter-occupied |
| Less than $300 | 185 (8.7%) | 63 (3.7%) |
| $300 to $499 | 475 (22.4%) | 115 (6.7%) |
| $500 to $799 | 313 (14.8%) | 722 (42.1%) |
| $800 to $999 | 485 (22.9%) | 349 (20.4%) |
| $1,000 to $1,499 | 375 (17.7%) | 311 (18.2%) |
| $1,500 to $1,999 | 225 (10.6%) | 8 (0.5%) |
| $2,000 to $2,499 | 15 (0.7%) | 0 (0.0%) |
| $2,500 to $2,999 | 12 (0.6%) | 0 (0.0%) |
| $3,000 or more | 34 (1.6%) | 28 (1.6%) |
| Total | 2,119 (100.0%) | 1,713 (100.0%) |
Physical Housing Characteristics in Pulaski
Housing Structures in Pulaski
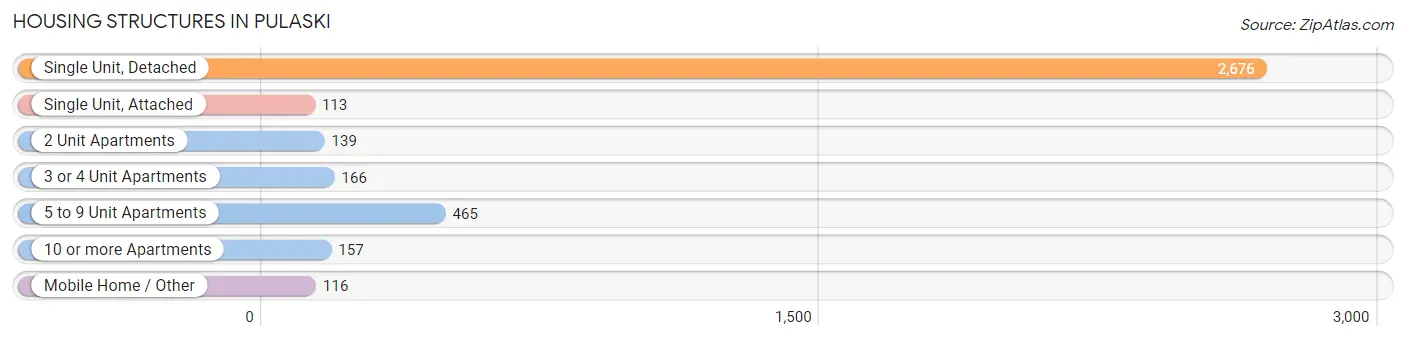
| Structure Type | # Housing Units | % Housing Units |
| Single Unit, Detached | 2,676 | 69.8% |
| Single Unit, Attached | 113 | 2.9% |
| 2 Unit Apartments | 139 | 3.6% |
| 3 or 4 Unit Apartments | 166 | 4.3% |
| 5 to 9 Unit Apartments | 465 | 12.1% |
| 10 or more Apartments | 157 | 4.1% |
| Mobile Home / Other | 116 | 3.0% |
| Total | 3,832 | 100.0% |
Housing Structures by Occupancy in Pulaski
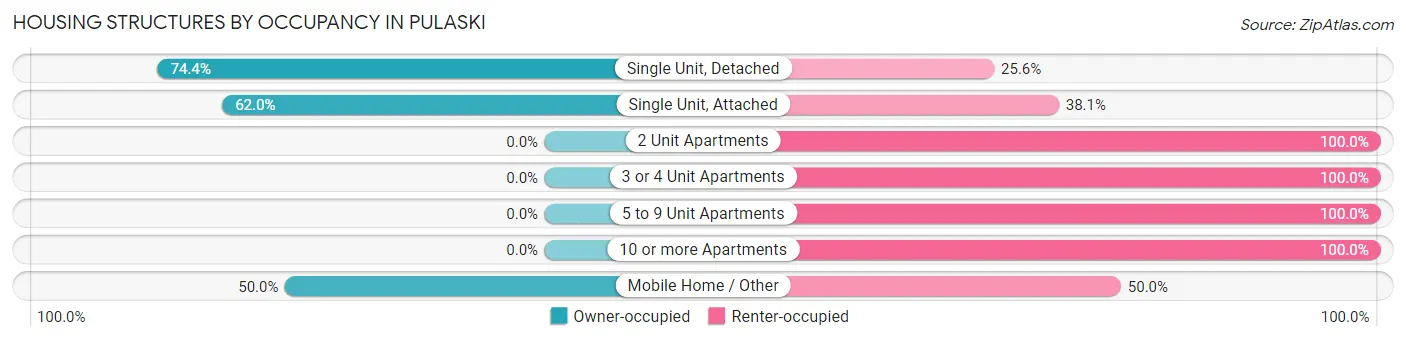
| Structure Type | Owner-occupied | Renter-occupied |
| Single Unit, Detached | 1,991 (74.4%) | 685 (25.6%) |
| Single Unit, Attached | 70 (62.0%) | 43 (38.1%) |
| 2 Unit Apartments | 0 (0.0%) | 139 (100.0%) |
| 3 or 4 Unit Apartments | 0 (0.0%) | 166 (100.0%) |
| 5 to 9 Unit Apartments | 0 (0.0%) | 465 (100.0%) |
| 10 or more Apartments | 0 (0.0%) | 157 (100.0%) |
| Mobile Home / Other | 58 (50.0%) | 58 (50.0%) |
| Total | 2,119 (55.3%) | 1,713 (44.7%) |
Housing Structures by Number of Rooms in Pulaski
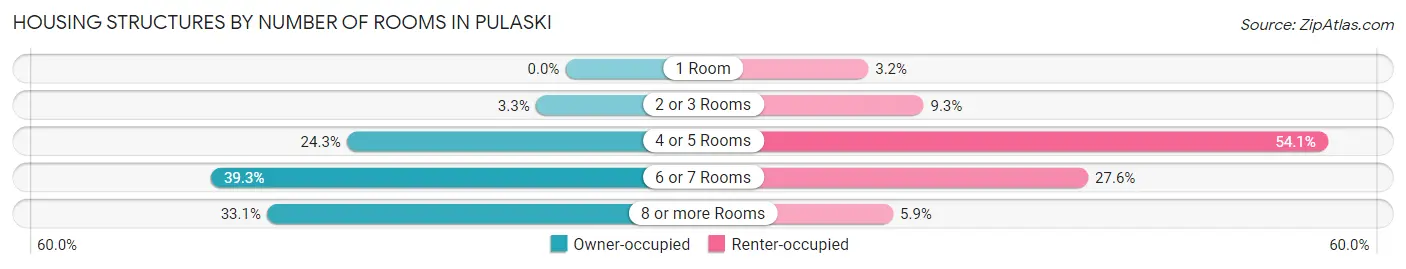
| Number of Rooms | Owner-occupied | Renter-occupied |
| 1 Room | 0 (0.0%) | 54 (3.2%) |
| 2 or 3 Rooms | 70 (3.3%) | 159 (9.3%) |
| 4 or 5 Rooms | 514 (24.3%) | 927 (54.1%) |
| 6 or 7 Rooms | 833 (39.3%) | 472 (27.6%) |
| 8 or more Rooms | 702 (33.1%) | 101 (5.9%) |
| Total | 2,119 (100.0%) | 1,713 (100.0%) |
Housing Structure by Heating Type in Pulaski
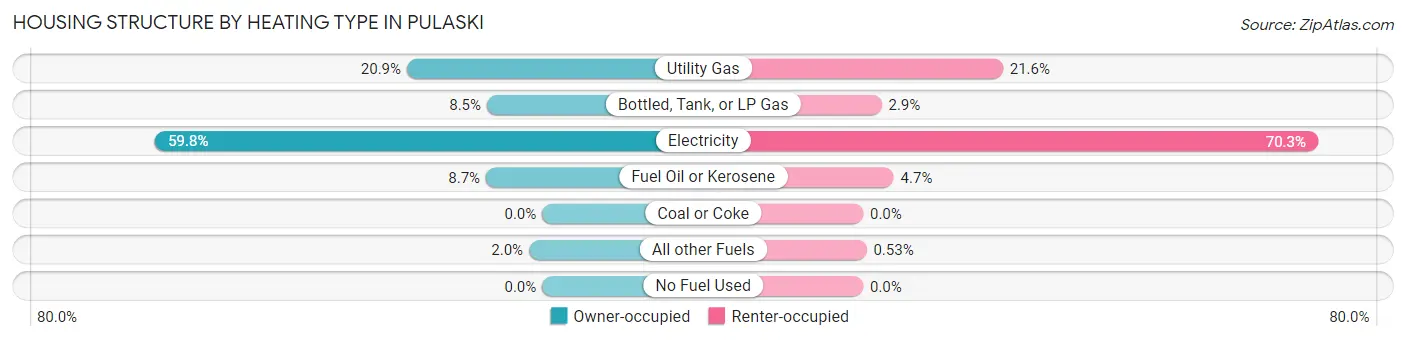
| Heating Type | Owner-occupied | Renter-occupied |
| Utility Gas | 443 (20.9%) | 370 (21.6%) |
| Bottled, Tank, or LP Gas | 181 (8.5%) | 49 (2.9%) |
| Electricity | 1,268 (59.8%) | 1,204 (70.3%) |
| Fuel Oil or Kerosene | 184 (8.7%) | 81 (4.7%) |
| Coal or Coke | 0 (0.0%) | 0 (0.0%) |
| All other Fuels | 43 (2.0%) | 9 (0.5%) |
| No Fuel Used | 0 (0.0%) | 0 (0.0%) |
| Total | 2,119 (100.0%) | 1,713 (100.0%) |
Household Vehicle Usage in Pulaski
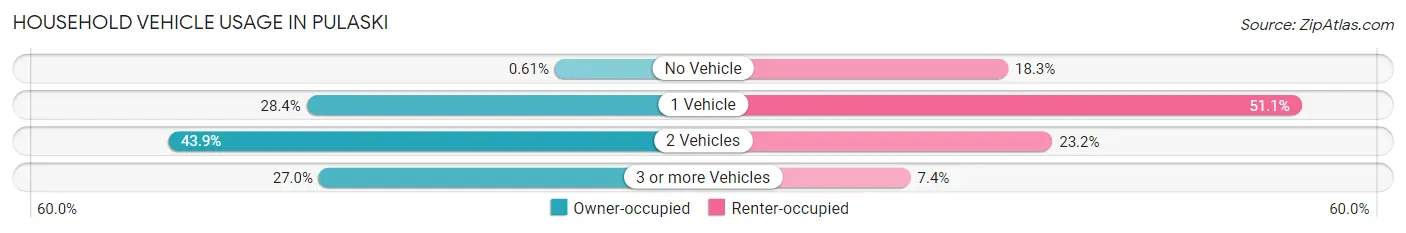
| Vehicles per Household | Owner-occupied | Renter-occupied |
| No Vehicle | 13 (0.6%) | 313 (18.3%) |
| 1 Vehicle | 602 (28.4%) | 876 (51.1%) |
| 2 Vehicles | 931 (43.9%) | 398 (23.2%) |
| 3 or more Vehicles | 573 (27.0%) | 126 (7.4%) |
| Total | 2,119 (100.0%) | 1,713 (100.0%) |
Real Estate & Mortgages in Pulaski
Real Estate and Mortgage Overview in Pulaski
| Characteristic | Without Mortgage | With Mortgage |
| Housing Units | 760 | 1,359 |
| Median Property Value | $105,600 | $152,400 |
| Median Household Income | $57,442 | $198 |
| Monthly Housing Costs | $371 | $29 |
| Real Estate Taxes | $944 | $58 |
Property Value by Mortgage Status in Pulaski
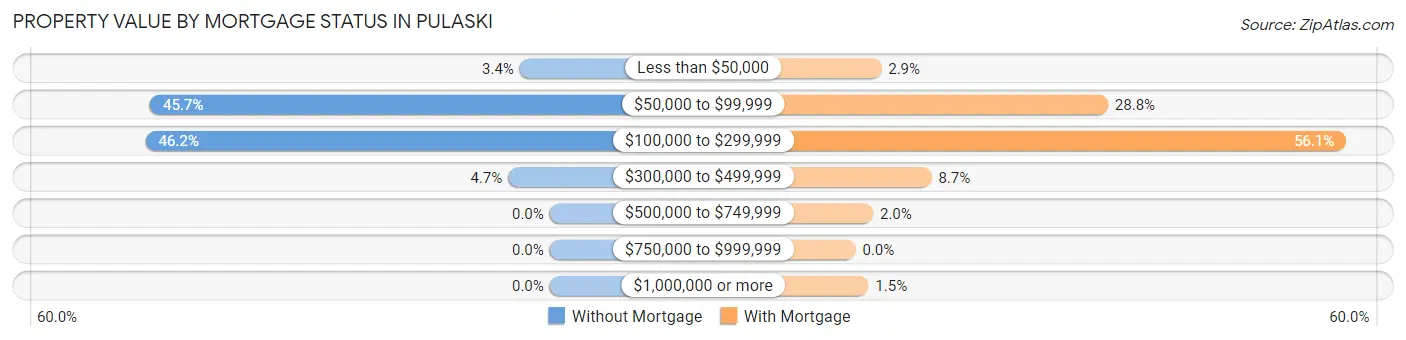
| Property Value | Without Mortgage | With Mortgage |
| Less than $50,000 | 26 (3.4%) | 40 (2.9%) |
| $50,000 to $99,999 | 347 (45.7%) | 392 (28.8%) |
| $100,000 to $299,999 | 351 (46.2%) | 762 (56.1%) |
| $300,000 to $499,999 | 36 (4.7%) | 118 (8.7%) |
| $500,000 to $749,999 | 0 (0.0%) | 27 (2.0%) |
| $750,000 to $999,999 | 0 (0.0%) | 0 (0.0%) |
| $1,000,000 or more | 0 (0.0%) | 20 (1.5%) |
| Total | 760 (100.0%) | 1,359 (100.0%) |
Household Income by Mortgage Status in Pulaski
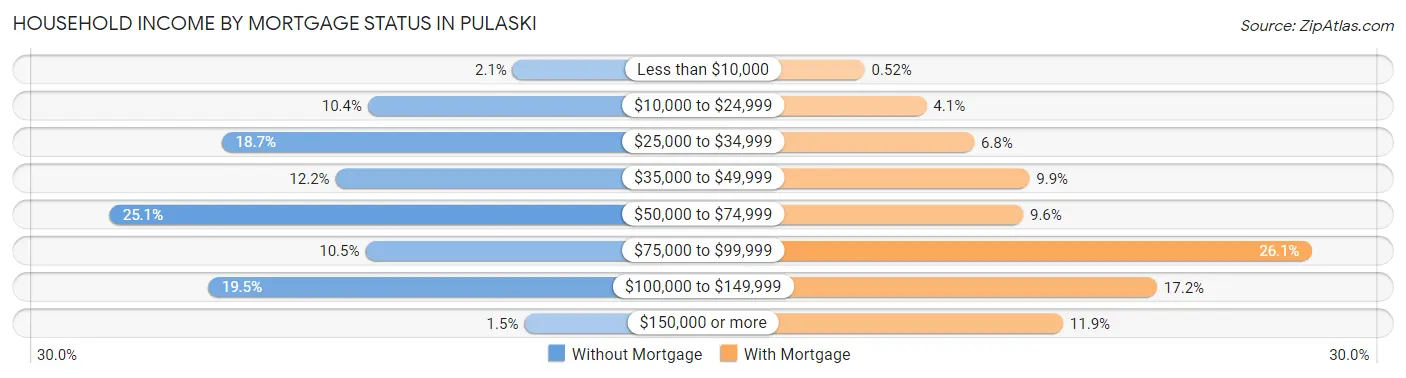
| Household Income | Without Mortgage | With Mortgage |
| Less than $10,000 | 16 (2.1%) | 7 (0.5%) |
| $10,000 to $24,999 | 79 (10.4%) | 55 (4.1%) |
| $25,000 to $34,999 | 142 (18.7%) | 92 (6.8%) |
| $35,000 to $49,999 | 93 (12.2%) | 135 (9.9%) |
| $50,000 to $74,999 | 191 (25.1%) | 130 (9.6%) |
| $75,000 to $99,999 | 80 (10.5%) | 354 (26.1%) |
| $100,000 to $149,999 | 148 (19.5%) | 234 (17.2%) |
| $150,000 or more | 11 (1.5%) | 161 (11.8%) |
| Total | 760 (100.0%) | 1,359 (100.0%) |
Property Value to Household Income Ratio in Pulaski
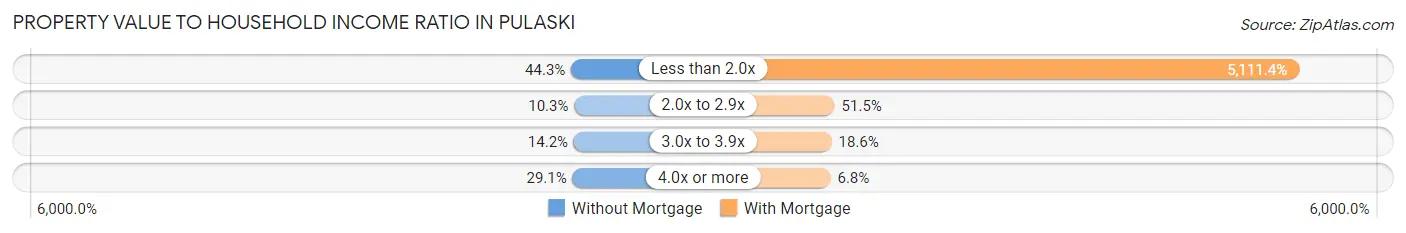
| Value-to-Income Ratio | Without Mortgage | With Mortgage |
| Less than 2.0x | 337 (44.3%) | 69,464 (5,111.4%) |
| 2.0x to 2.9x | 78 (10.3%) | 700 (51.5%) |
| 3.0x to 3.9x | 108 (14.2%) | 253 (18.6%) |
| 4.0x or more | 221 (29.1%) | 92 (6.8%) |
| Total | 760 (100.0%) | 1,359 (100.0%) |
Real Estate Taxes by Mortgage Status in Pulaski
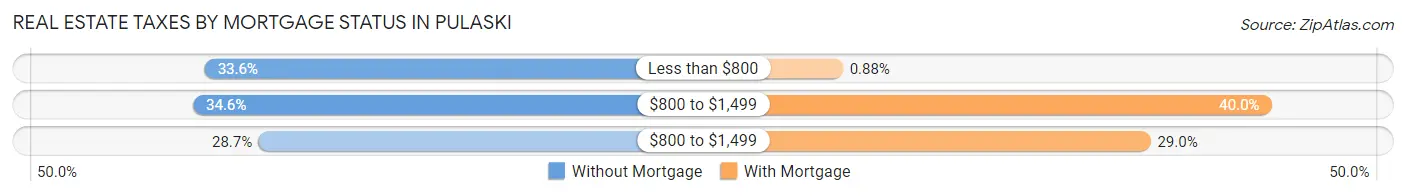
| Property Taxes | Without Mortgage | With Mortgage |
| Less than $800 | 255 (33.6%) | 12 (0.9%) |
| $800 to $1,499 | 263 (34.6%) | 544 (40.0%) |
| $800 to $1,499 | 218 (28.7%) | 394 (29.0%) |
| Total | 760 (100.0%) | 1,359 (100.0%) |
Health & Disability in Pulaski
Health Insurance Coverage by Age in Pulaski
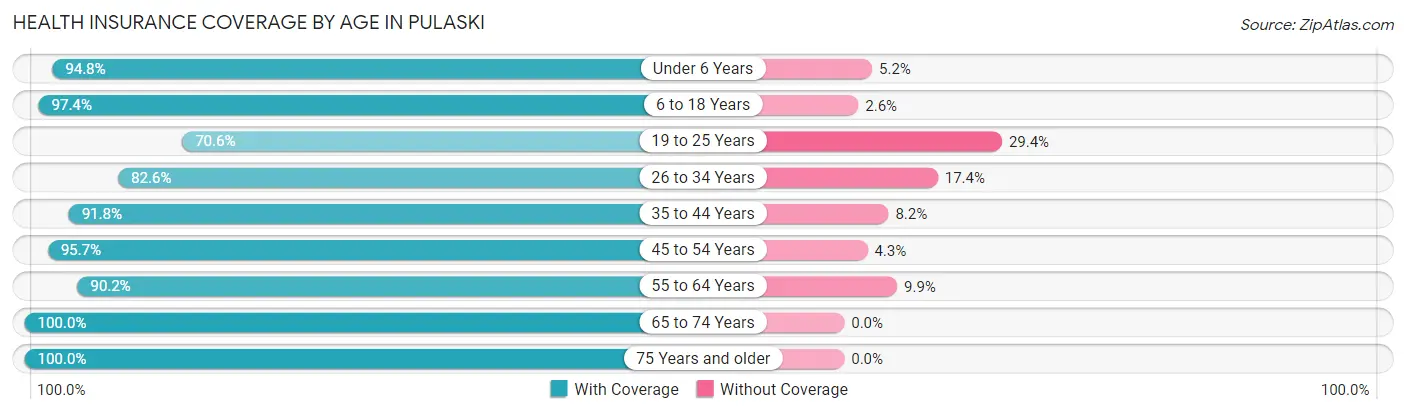
| Age Bracket | With Coverage | Without Coverage |
| Under 6 Years | 567 (94.8%) | 31 (5.2%) |
| 6 to 18 Years | 1,079 (97.4%) | 29 (2.6%) |
| 19 to 25 Years | 485 (70.6%) | 202 (29.4%) |
| 26 to 34 Years | 1,349 (82.6%) | 285 (17.4%) |
| 35 to 44 Years | 869 (91.8%) | 78 (8.2%) |
| 45 to 54 Years | 996 (95.7%) | 45 (4.3%) |
| 55 to 64 Years | 1,071 (90.1%) | 117 (9.9%) |
| 65 to 74 Years | 1,022 (100.0%) | 0 (0.0%) |
| 75 Years and older | 650 (100.0%) | 0 (0.0%) |
| Total | 8,088 (91.1%) | 787 (8.9%) |
Health Insurance Coverage by Citizenship Status in Pulaski
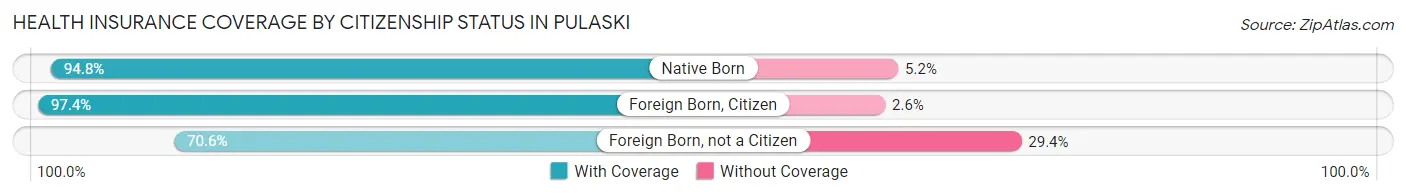
| Citizenship Status | With Coverage | Without Coverage |
| Native Born | 567 (94.8%) | 31 (5.2%) |
| Foreign Born, Citizen | 1,079 (97.4%) | 29 (2.6%) |
| Foreign Born, not a Citizen | 485 (70.6%) | 202 (29.4%) |
Health Insurance Coverage by Household Income in Pulaski
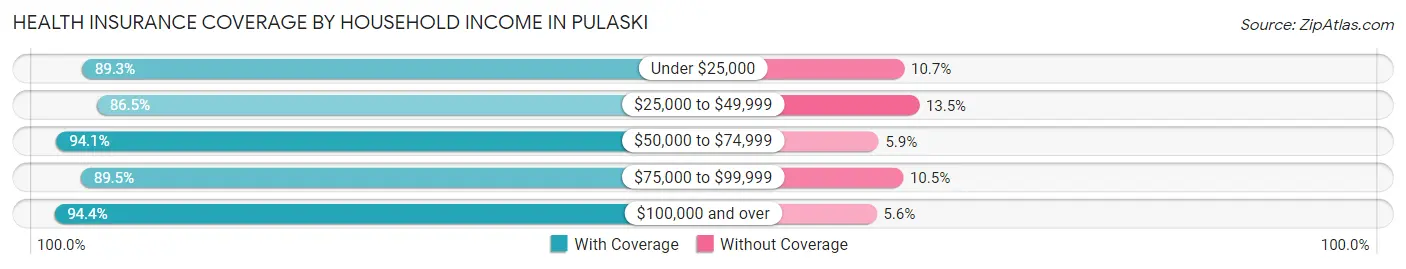
| Household Income | With Coverage | Without Coverage |
| Under $25,000 | 1,506 (89.3%) | 181 (10.7%) |
| $25,000 to $49,999 | 1,363 (86.5%) | 213 (13.5%) |
| $50,000 to $74,999 | 1,852 (94.1%) | 117 (5.9%) |
| $75,000 to $99,999 | 1,325 (89.5%) | 156 (10.5%) |
| $100,000 and over | 2,038 (94.4%) | 120 (5.6%) |
Public vs Private Health Insurance Coverage by Age in Pulaski
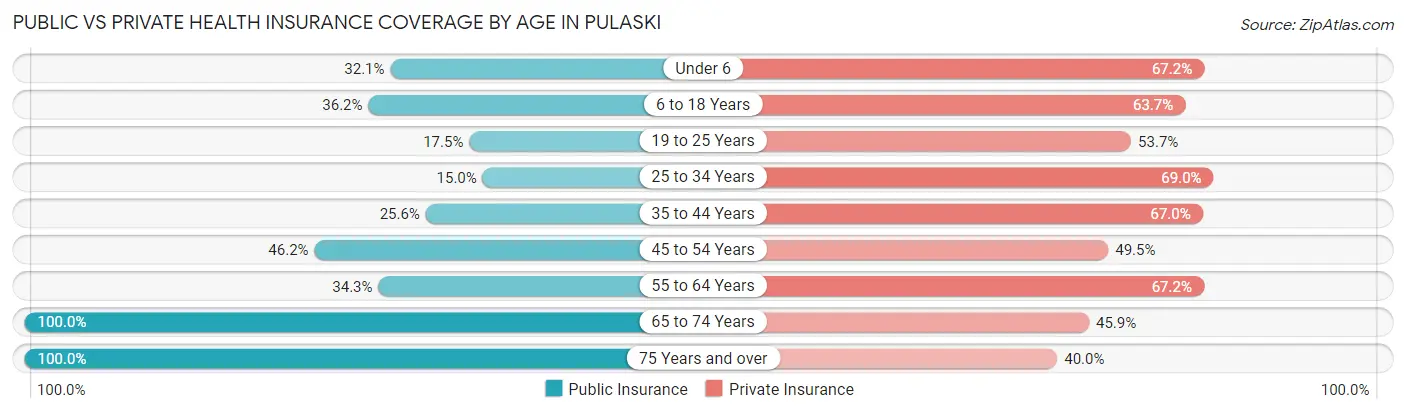
| Age Bracket | Public Insurance | Private Insurance |
| Under 6 | 192 (32.1%) | 402 (67.2%) |
| 6 to 18 Years | 401 (36.2%) | 706 (63.7%) |
| 19 to 25 Years | 120 (17.5%) | 369 (53.7%) |
| 25 to 34 Years | 245 (15.0%) | 1,127 (69.0%) |
| 35 to 44 Years | 242 (25.6%) | 634 (66.9%) |
| 45 to 54 Years | 481 (46.2%) | 515 (49.5%) |
| 55 to 64 Years | 408 (34.3%) | 798 (67.2%) |
| 65 to 74 Years | 1,022 (100.0%) | 469 (45.9%) |
| 75 Years and over | 650 (100.0%) | 260 (40.0%) |
| Total | 3,761 (42.4%) | 5,280 (59.5%) |
Disability Status by Sex by Age in Pulaski
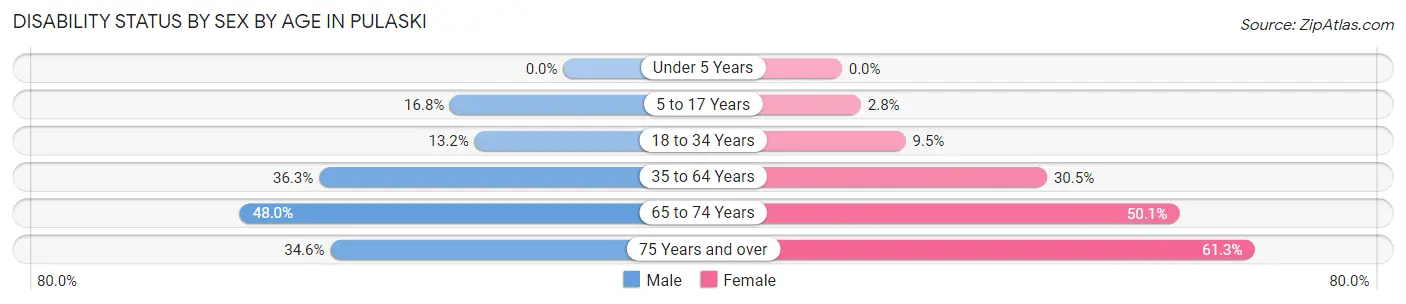
| Age Bracket | Male | Female |
| Under 5 Years | 0 (0.0%) | 0 (0.0%) |
| 5 to 17 Years | 99 (16.8%) | 15 (2.8%) |
| 18 to 34 Years | 172 (13.2%) | 104 (9.5%) |
| 35 to 64 Years | 539 (36.3%) | 515 (30.5%) |
| 65 to 74 Years | 207 (48.0%) | 296 (50.1%) |
| 75 Years and over | 82 (34.6%) | 253 (61.3%) |
Disability Class by Sex by Age in Pulaski
Disability Class: Hearing Difficulty
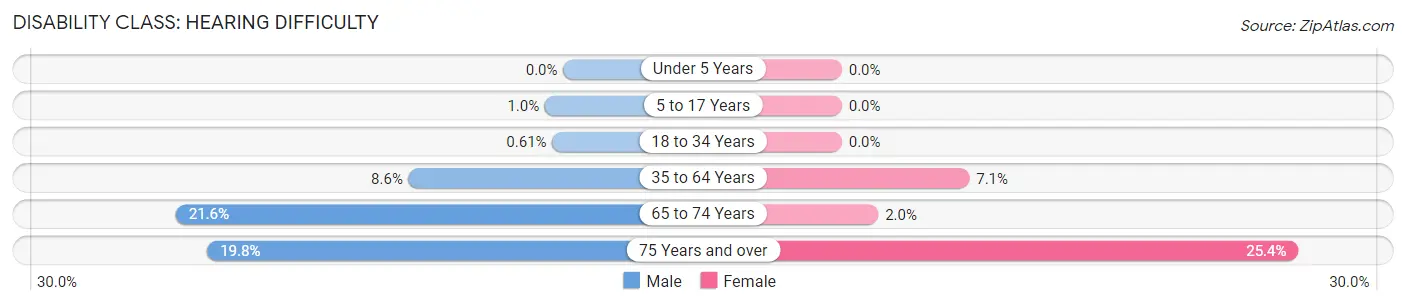
| Age Bracket | Male | Female |
| Under 5 Years | 0 (0.0%) | 0 (0.0%) |
| 5 to 17 Years | 6 (1.0%) | 0 (0.0%) |
| 18 to 34 Years | 8 (0.6%) | 0 (0.0%) |
| 35 to 64 Years | 128 (8.6%) | 120 (7.1%) |
| 65 to 74 Years | 93 (21.6%) | 12 (2.0%) |
| 75 Years and over | 47 (19.8%) | 105 (25.4%) |
Disability Class: Vision Difficulty
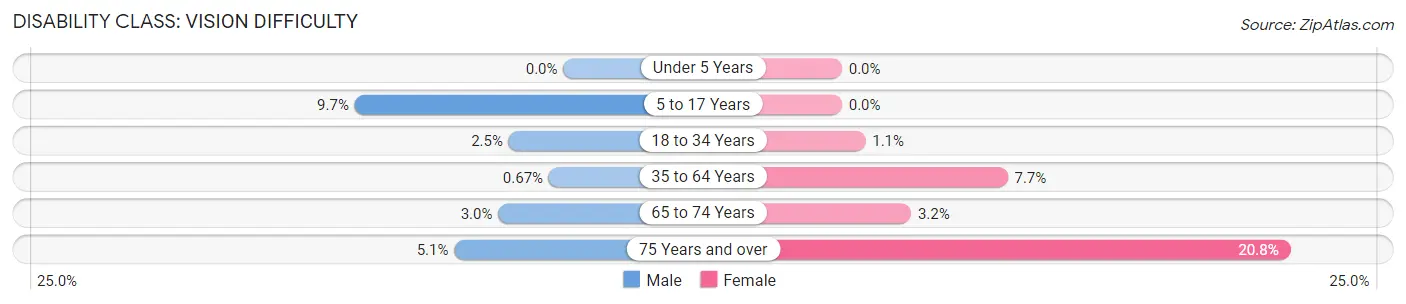
| Age Bracket | Male | Female |
| Under 5 Years | 0 (0.0%) | 0 (0.0%) |
| 5 to 17 Years | 57 (9.7%) | 0 (0.0%) |
| 18 to 34 Years | 33 (2.5%) | 12 (1.1%) |
| 35 to 64 Years | 10 (0.7%) | 130 (7.7%) |
| 65 to 74 Years | 13 (3.0%) | 19 (3.2%) |
| 75 Years and over | 12 (5.1%) | 86 (20.8%) |
Disability Class: Cognitive Difficulty
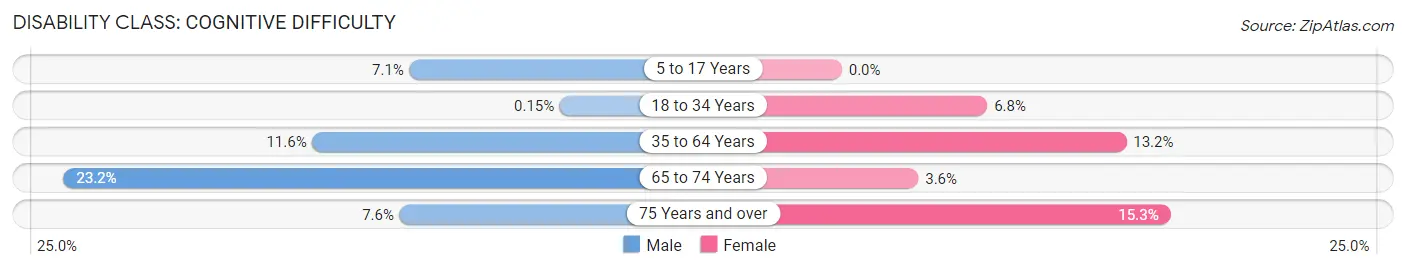
| Age Bracket | Male | Female |
| 5 to 17 Years | 42 (7.1%) | 0 (0.0%) |
| 18 to 34 Years | 2 (0.2%) | 74 (6.8%) |
| 35 to 64 Years | 173 (11.6%) | 223 (13.2%) |
| 65 to 74 Years | 100 (23.2%) | 21 (3.5%) |
| 75 Years and over | 18 (7.6%) | 63 (15.2%) |
Disability Class: Ambulatory Difficulty
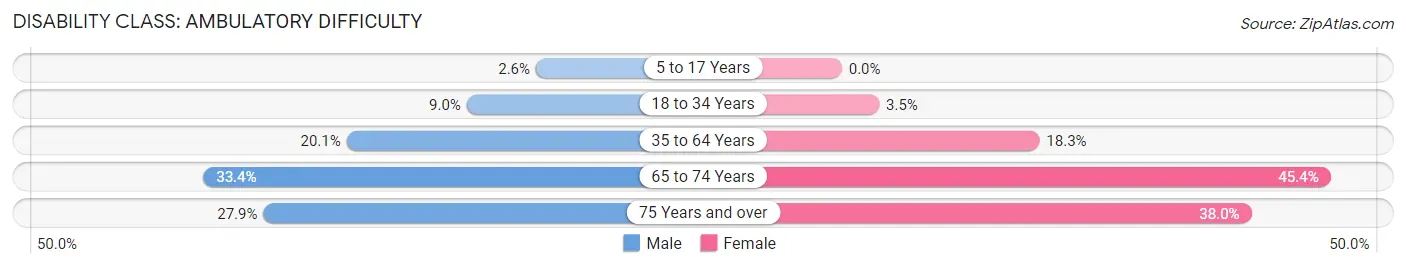
| Age Bracket | Male | Female |
| 5 to 17 Years | 15 (2.5%) | 0 (0.0%) |
| 18 to 34 Years | 117 (9.0%) | 38 (3.5%) |
| 35 to 64 Years | 299 (20.1%) | 310 (18.3%) |
| 65 to 74 Years | 144 (33.4%) | 268 (45.4%) |
| 75 Years and over | 66 (27.9%) | 157 (38.0%) |
Disability Class: Self-Care Difficulty
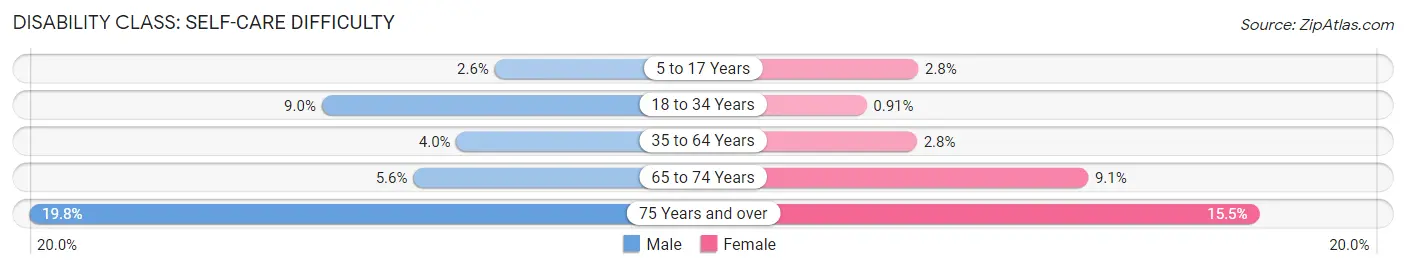
| Age Bracket | Male | Female |
| 5 to 17 Years | 15 (2.5%) | 15 (2.8%) |
| 18 to 34 Years | 117 (9.0%) | 10 (0.9%) |
| 35 to 64 Years | 59 (4.0%) | 47 (2.8%) |
| 65 to 74 Years | 24 (5.6%) | 54 (9.1%) |
| 75 Years and over | 47 (19.8%) | 64 (15.5%) |
Technology Access in Pulaski
Computing Device Access in Pulaski
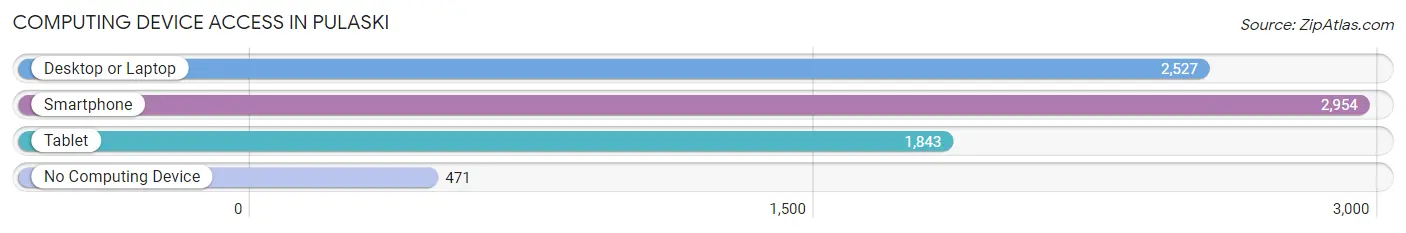
| Device Type | # Households | % Households |
| Desktop or Laptop | 2,527 | 65.9% |
| Smartphone | 2,954 | 77.1% |
| Tablet | 1,843 | 48.1% |
| No Computing Device | 471 | 12.3% |
| Total | 3,832 | 100.0% |
Internet Access in Pulaski
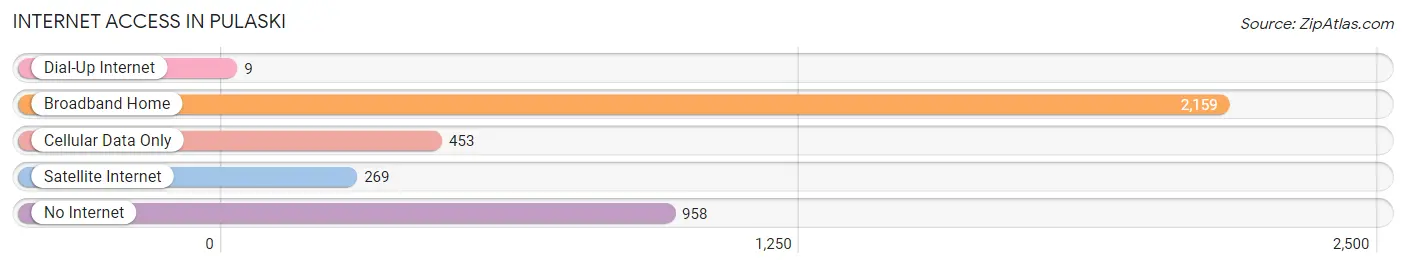
| Internet Type | # Households | % Households |
| Dial-Up Internet | 9 | 0.2% |
| Broadband Home | 2,159 | 56.3% |
| Cellular Data Only | 453 | 11.8% |
| Satellite Internet | 269 | 7.0% |
| No Internet | 958 | 25.0% |
| Total | 3,832 | 100.0% |
Pulaski Summary
Pulaski, Virginia is a town located in the New River Valley of Southwest Virginia. It is the county seat of Pulaski County and is situated along the banks of the New River. The town is named after Kazimierz Pułaski, a Polish patriot and Revolutionary War hero. The town has a population of 8,743 as of the 2010 census and is part of the Blacksburg-Christiansburg-Radford Metropolitan Statistical Area.
History
The area that is now Pulaski was first settled in the late 1700s by settlers from Pennsylvania and Virginia. The town was officially established in 1839 and named after Kazimierz Pułaski, a Polish patriot and Revolutionary War hero. The town was incorporated in 1874 and was the site of the Battle of Cloyd’s Mountain in 1864. The battle was a Confederate victory and was the last major battle of the Civil War in Southwest Virginia.
Geography
Pulaski is located in the New River Valley of Southwest Virginia. It is situated along the banks of the New River and is surrounded by the Blue Ridge Mountains. The town has a total area of 8.3 square miles, all of which is land. The town is located at an elevation of 1,845 feet.
Economy
Pulaski’s economy is largely based on manufacturing and tourism. The town is home to several manufacturing companies, including Volvo Trucks North America, which is the largest employer in the town. Other major employers include Pulaski Furniture Corporation, Pulaski County Public Schools, and New River Community College. Tourism is also an important part of the local economy, with the town being a popular destination for outdoor activities such as fishing, camping, and hiking.
Demographics
As of the 2010 census, Pulaski had a population of 8,743. The racial makeup of the town was 87.3% White, 8.3% African American, 0.4% Native American, 0.7% Asian, 0.1% Pacific Islander, 1.2% from other races, and 2.0% from two or more races. Hispanic or Latino of any race were 3.2% of the population. The median household income was $33,945 and the median family income was $41,919. The per capita income was $17,945.
Pulaski is a small town with a rich history and a vibrant economy. It is a popular destination for outdoor activities and is home to several manufacturing companies. The town has a diverse population and a median household income that is slightly below the national average.
Common Questions
What is Per Capita Income in Pulaski?
Per Capita income in Pulaski is $31,223.
What is the Median Family Income in Pulaski?
Median Family Income in Pulaski is $63,847.
What is the Median Household income in Pulaski?
Median Household Income in Pulaski is $55,213.
What is Income or Wage Gap in Pulaski?
Income or Wage Gap in Pulaski is 3.6%.
Women in Pulaski earn 96.4 cents for every dollar earned by a man.
What is Inequality or Gini Index in Pulaski?
Inequality or Gini Index in Pulaski is 0.50.
What is the Total Population of Pulaski?
Total Population of Pulaski is 8,982.
What is the Total Male Population of Pulaski?
Total Male Population of Pulaski is 4,327.
What is the Total Female Population of Pulaski?
Total Female Population of Pulaski is 4,655.
What is the Ratio of Males per 100 Females in Pulaski?
There are 92.95 Males per 100 Females in Pulaski.
What is the Ratio of Females per 100 Males in Pulaski?
There are 107.58 Females per 100 Males in Pulaski.
What is the Median Population Age in Pulaski?
Median Population Age in Pulaski is 40.7 Years.
What is the Average Family Size in Pulaski
Average Family Size in Pulaski is 2.9 People.
What is the Average Household Size in Pulaski
Average Household Size in Pulaski is 2.3 People.
How Large is the Labor Force in Pulaski?
There are 4,165 People in the Labor Forcein in Pulaski.
What is the Percentage of People in the Labor Force in Pulaski?
55.3% of People are in the Labor Force in Pulaski.
What is the Unemployment Rate in Pulaski?
Unemployment Rate in Pulaski is 4.1%.