Glade Spring, VA Map & Demographics
Glade Spring Map
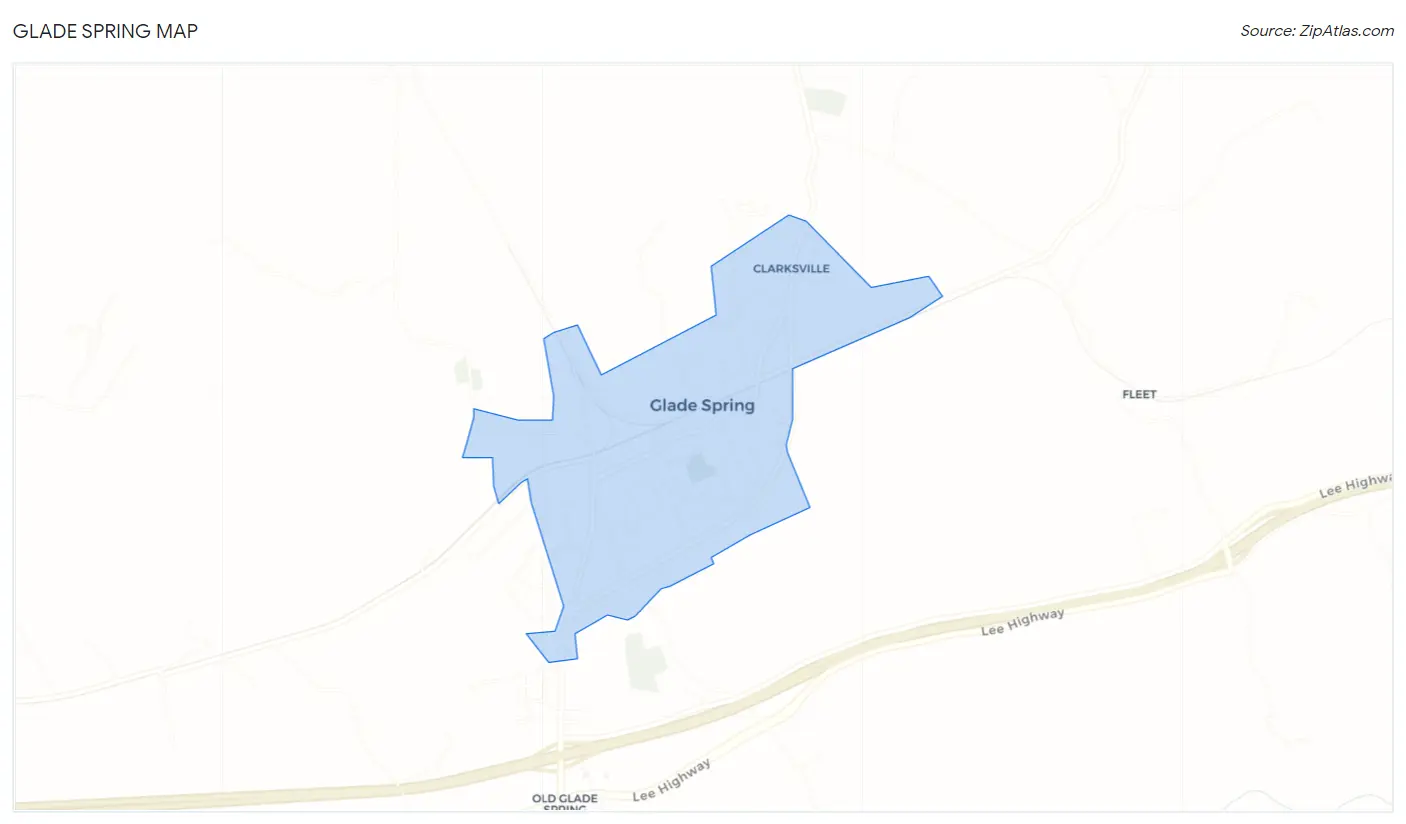
Glade Spring Overview
$23,995
PER CAPITA INCOME
$78,125
AVG FAMILY INCOME
$70,000
AVG HOUSEHOLD INCOME
1.1%
WAGE / INCOME GAP [ % ]
98.9¢/ $1
WAGE / INCOME GAP [ $ ]
0.38
INEQUALITY / GINI INDEX
2,249
TOTAL POPULATION
956
MALE POPULATION
1,293
FEMALE POPULATION
73.94
MALES / 100 FEMALES
135.25
FEMALES / 100 MALES
35.7
MEDIAN AGE
4.1
AVG FAMILY SIZE
3.4
AVG HOUSEHOLD SIZE
867
LABOR FORCE [ PEOPLE ]
55.6%
PERCENT IN LABOR FORCE
2.4%
UNEMPLOYMENT RATE
Glade Spring Zip Codes
Glade Spring Area Codes
Income in Glade Spring
Income Overview in Glade Spring
Per Capita Income in Glade Spring is $23,995, while median incomes of families and households are $78,125 and $70,000 respectively.
| Characteristic | Number | Measure |
| Per Capita Income | 2,249 | $23,995 |
| Median Family Income | 491 | $78,125 |
| Mean Family Income | 491 | $85,370 |
| Median Household Income | 654 | $70,000 |
| Mean Household Income | 654 | $74,554 |
| Income Deficit | 491 | $0 |
| Wage / Income Gap (%) | 2,249 | 1.13% |
| Wage / Income Gap ($) | 2,249 | 98.87¢ per $1 |
| Gini / Inequality Index | 2,249 | 0.38 |
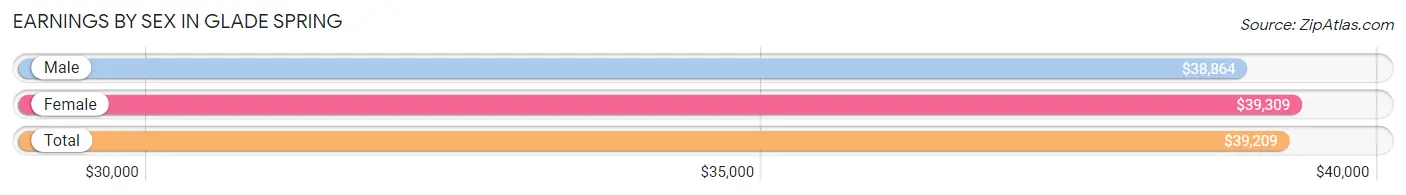
Earnings by Sex in Glade Spring
Average Earnings in Glade Spring are $39,209, $38,864 for men and $39,309 for women, a difference of 1.1%.
| Sex | Number | Average Earnings |
| Male | 452 (50.2%) | $38,864 |
| Female | 449 (49.8%) | $39,309 |
| Total | 901 (100.0%) | $39,209 |
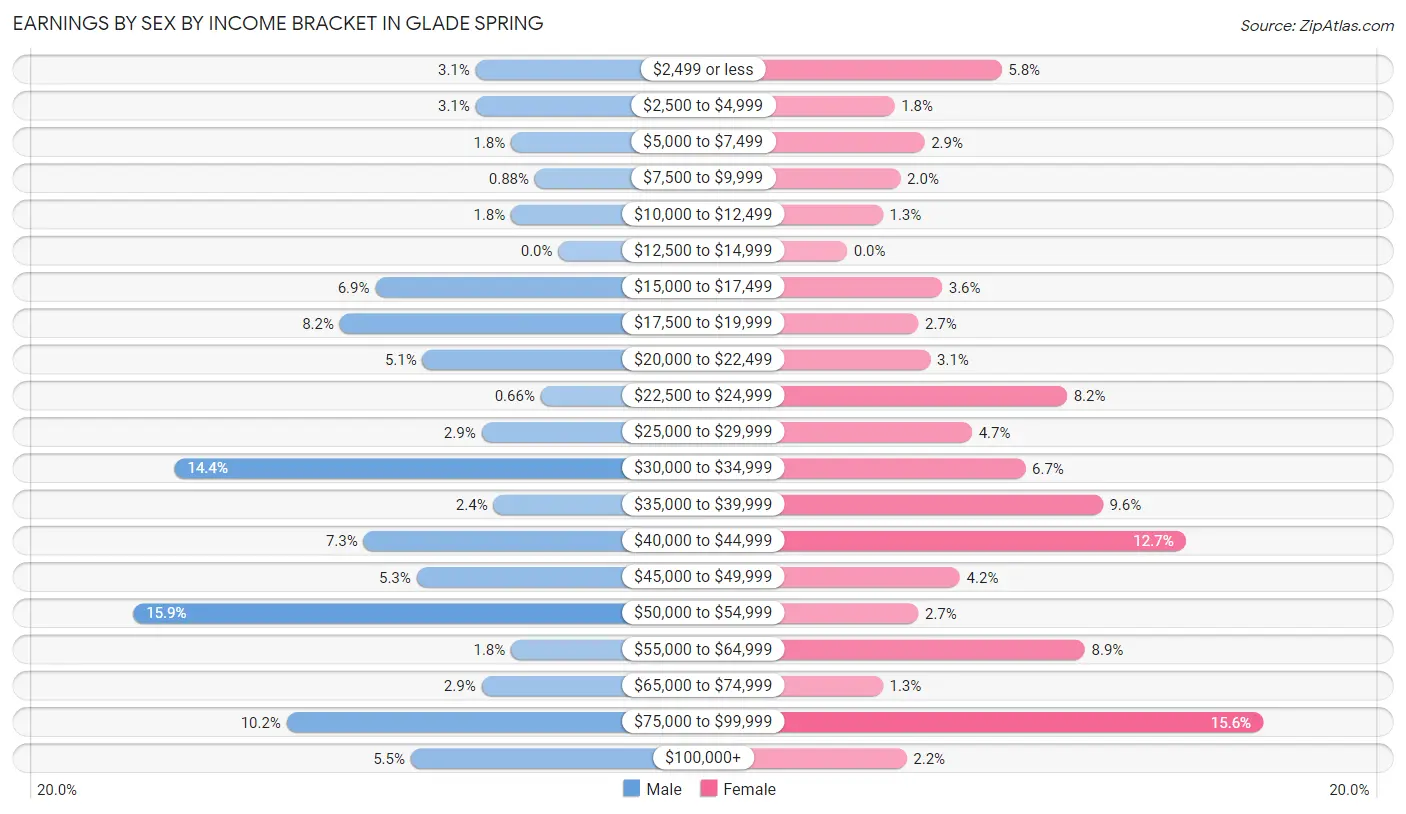
Earnings by Sex by Income Bracket in Glade Spring
The most common earnings brackets in Glade Spring are $50,000 to $54,999 for men (72 | 15.9%) and $75,000 to $99,999 for women (70 | 15.6%).
| Income | Male | Female |
| $2,499 or less | 14 (3.1%) | 26 (5.8%) |
| $2,500 to $4,999 | 14 (3.1%) | 8 (1.8%) |
| $5,000 to $7,499 | 8 (1.8%) | 13 (2.9%) |
| $7,500 to $9,999 | 4 (0.9%) | 9 (2.0%) |
| $10,000 to $12,499 | 8 (1.8%) | 6 (1.3%) |
| $12,500 to $14,999 | 0 (0.0%) | 0 (0.0%) |
| $15,000 to $17,499 | 31 (6.9%) | 16 (3.6%) |
| $17,500 to $19,999 | 37 (8.2%) | 12 (2.7%) |
| $20,000 to $22,499 | 23 (5.1%) | 14 (3.1%) |
| $22,500 to $24,999 | 3 (0.7%) | 37 (8.2%) |
| $25,000 to $29,999 | 13 (2.9%) | 21 (4.7%) |
| $30,000 to $34,999 | 65 (14.4%) | 30 (6.7%) |
| $35,000 to $39,999 | 11 (2.4%) | 43 (9.6%) |
| $40,000 to $44,999 | 33 (7.3%) | 57 (12.7%) |
| $45,000 to $49,999 | 24 (5.3%) | 19 (4.2%) |
| $50,000 to $54,999 | 72 (15.9%) | 12 (2.7%) |
| $55,000 to $64,999 | 8 (1.8%) | 40 (8.9%) |
| $65,000 to $74,999 | 13 (2.9%) | 6 (1.3%) |
| $75,000 to $99,999 | 46 (10.2%) | 70 (15.6%) |
| $100,000+ | 25 (5.5%) | 10 (2.2%) |
| Total | 452 (100.0%) | 449 (100.0%) |
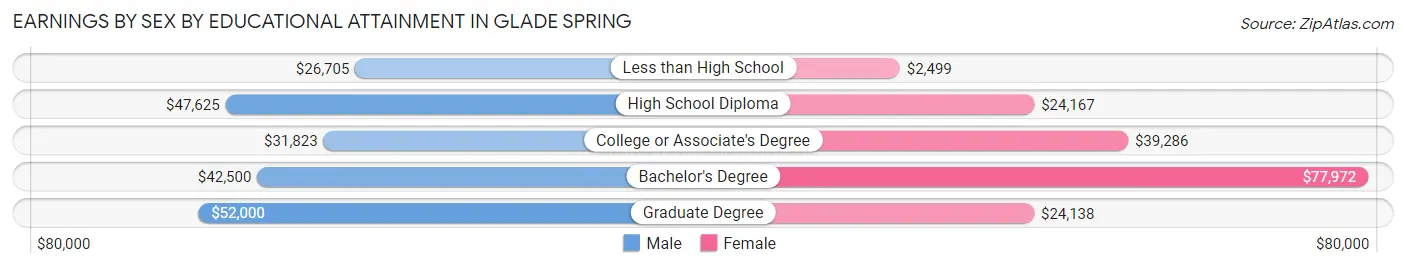
Earnings by Sex by Educational Attainment in Glade Spring
Average earnings in Glade Spring are $45,089 for men and $40,094 for women, a difference of 11.1%. Men with an educational attainment of graduate degree enjoy the highest average annual earnings of $52,000, while those with less than high school education earn the least with $26,705. Women with an educational attainment of bachelor's degree earn the most with the average annual earnings of $77,972, while those with less than high school education have the smallest earnings of $2,499.
| Educational Attainment | Male Income | Female Income |
| Less than High School | $26,705 | $2,499 |
| High School Diploma | $47,625 | $24,167 |
| College or Associate's Degree | $31,823 | $39,286 |
| Bachelor's Degree | $42,500 | $77,972 |
| Graduate Degree | $52,000 | $24,138 |
| Total | $45,089 | $40,094 |
Family Income in Glade Spring
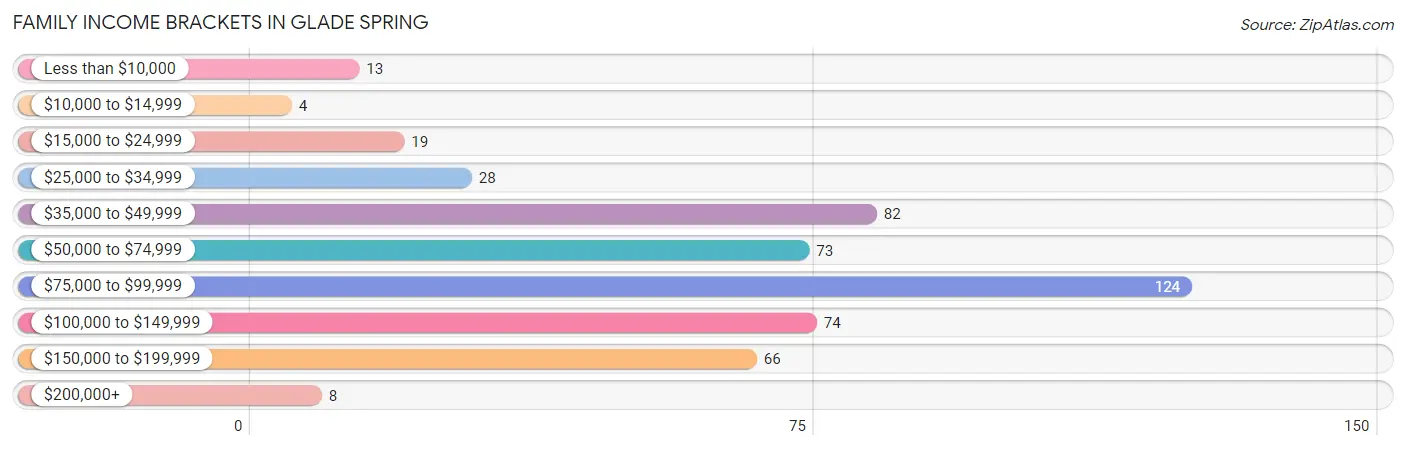
Family Income Brackets in Glade Spring
According to the Glade Spring family income data, there are 124 families falling into the $75,000 to $99,999 income range, which is the most common income bracket and makes up 25.3% of all families. Conversely, the $10,000 to $14,999 income bracket is the least frequent group with only 4 families (0.8%) belonging to this category.
| Income Bracket | # Families | % Families |
| Less than $10,000 | 13 | 2.6% |
| $10,000 to $14,999 | 4 | 0.8% |
| $15,000 to $24,999 | 19 | 3.9% |
| $25,000 to $34,999 | 28 | 5.7% |
| $35,000 to $49,999 | 82 | 16.7% |
| $50,000 to $74,999 | 73 | 14.9% |
| $75,000 to $99,999 | 124 | 25.3% |
| $100,000 to $149,999 | 74 | 15.1% |
| $150,000 to $199,999 | 66 | 13.4% |
| $200,000+ | 8 | 1.6% |
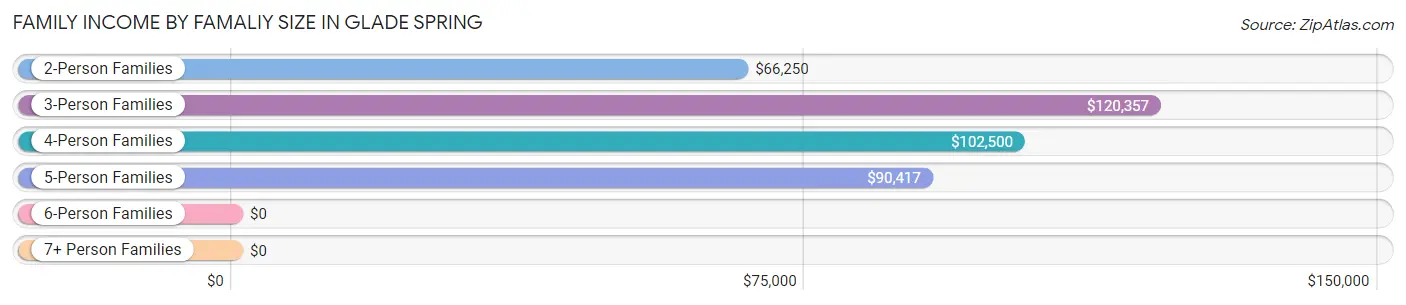
Family Income by Famaliy Size in Glade Spring
3-person families (78 | 15.9%) account for the highest median family income in Glade Spring with $120,357 per family, while 3-person families (78 | 15.9%) have the highest median income of $40,119 per family member.
| Income Bracket | # Families | Median Income |
| 2-Person Families | 261 (53.2%) | $66,250 |
| 3-Person Families | 78 (15.9%) | $120,357 |
| 4-Person Families | 64 (13.0%) | $102,500 |
| 5-Person Families | 21 (4.3%) | $90,417 |
| 6-Person Families | 8 (1.6%) | $0 |
| 7+ Person Families | 59 (12.0%) | $0 |
| Total | 491 (100.0%) | $78,125 |
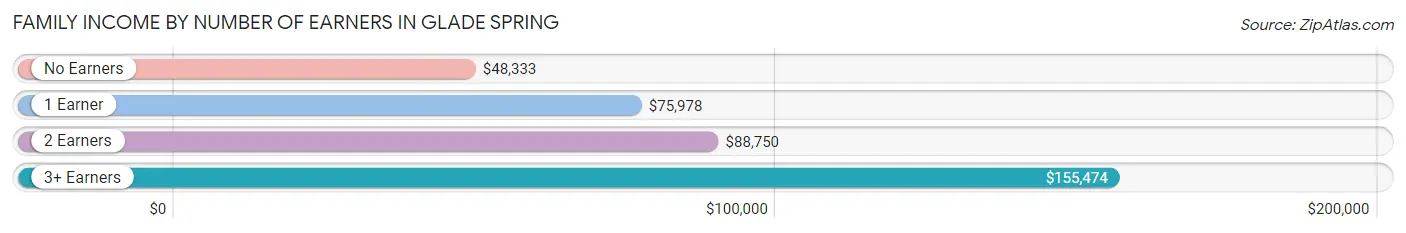
Family Income by Number of Earners in Glade Spring
The median family income in Glade Spring is $78,125, with families comprising 3+ earners (67) having the highest median family income of $155,474, while families with no earners (80) have the lowest median family income of $48,333, accounting for 13.7% and 16.3% of families, respectively.
| Number of Earners | # Families | Median Income |
| No Earners | 80 (16.3%) | $48,333 |
| 1 Earner | 208 (42.4%) | $75,978 |
| 2 Earners | 136 (27.7%) | $88,750 |
| 3+ Earners | 67 (13.7%) | $155,474 |
| Total | 491 (100.0%) | $78,125 |
Household Income in Glade Spring
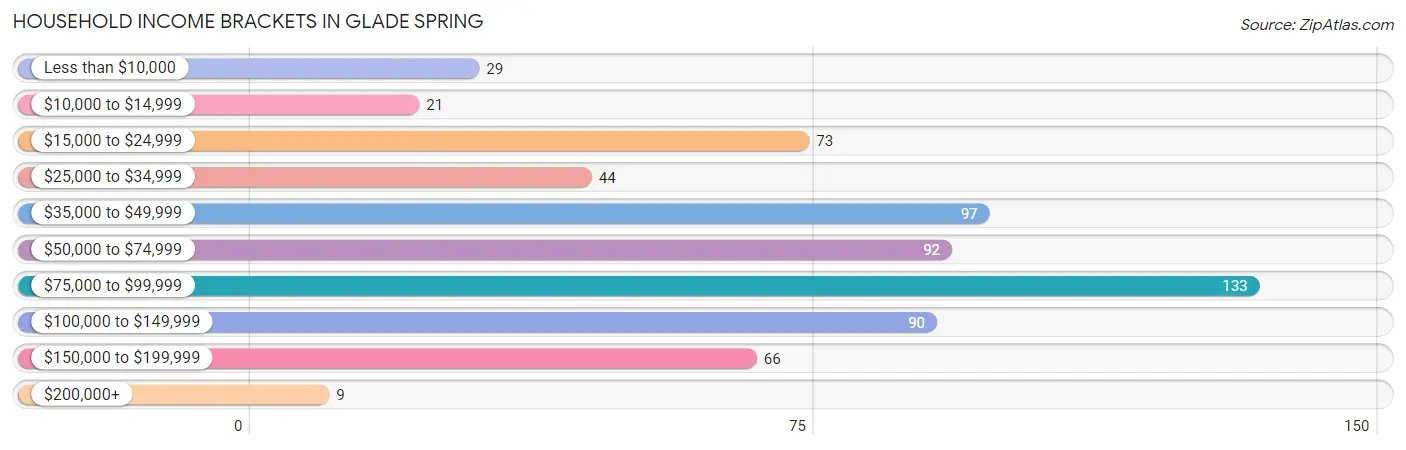
Household Income Brackets in Glade Spring
With 133 households falling in the category, the $75,000 to $99,999 income range is the most frequent in Glade Spring, accounting for 20.3% of all households. In contrast, only 9 households (1.4%) fall into the $200,000+ income bracket, making it the least populous group.
| Income Bracket | # Households | % Households |
| Less than $10,000 | 29 | 4.4% |
| $10,000 to $14,999 | 21 | 3.2% |
| $15,000 to $24,999 | 73 | 11.2% |
| $25,000 to $34,999 | 44 | 6.7% |
| $35,000 to $49,999 | 97 | 14.8% |
| $50,000 to $74,999 | 92 | 14.1% |
| $75,000 to $99,999 | 133 | 20.3% |
| $100,000 to $149,999 | 90 | 13.8% |
| $150,000 to $199,999 | 66 | 10.1% |
| $200,000+ | 9 | 1.4% |
Household Income by Householder Age in Glade Spring
The median household income in Glade Spring is $70,000, with the highest median household income of $85,268 found in the 45 to 64 years age bracket for the primary householder. A total of 215 households (32.9%) fall into this category. Meanwhile, the 15 to 24 years age bracket for the primary householder has the lowest median household income of $0, with 5 households (0.8%) in this group.
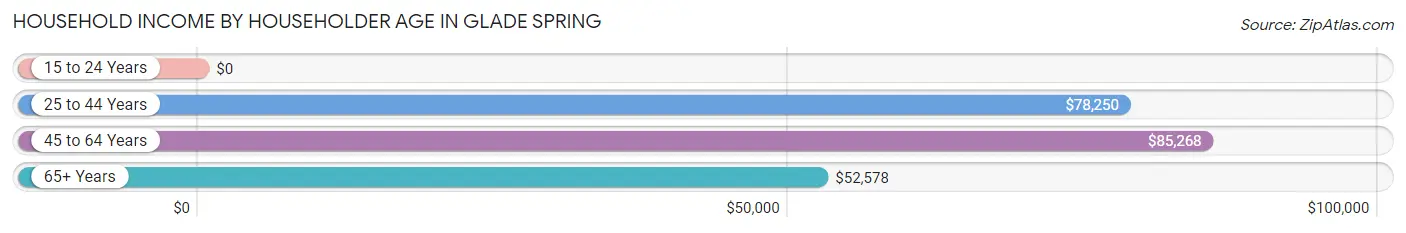
| Income Bracket | # Households | Median Income |
| 15 to 24 Years | 5 (0.8%) | $0 |
| 25 to 44 Years | 123 (18.8%) | $78,250 |
| 45 to 64 Years | 215 (32.9%) | $85,268 |
| 65+ Years | 311 (47.5%) | $52,578 |
| Total | 654 (100.0%) | $70,000 |
Poverty in Glade Spring
Income Below Poverty by Sex and Age in Glade Spring
With 7.5% poverty level for males and 11.6% for females among the residents of Glade Spring, 5 year old males and 12 to 14 year old females are the most vulnerable to poverty, with 5 males (38.5%) and 26 females (44.1%) in their respective age groups living below the poverty level.
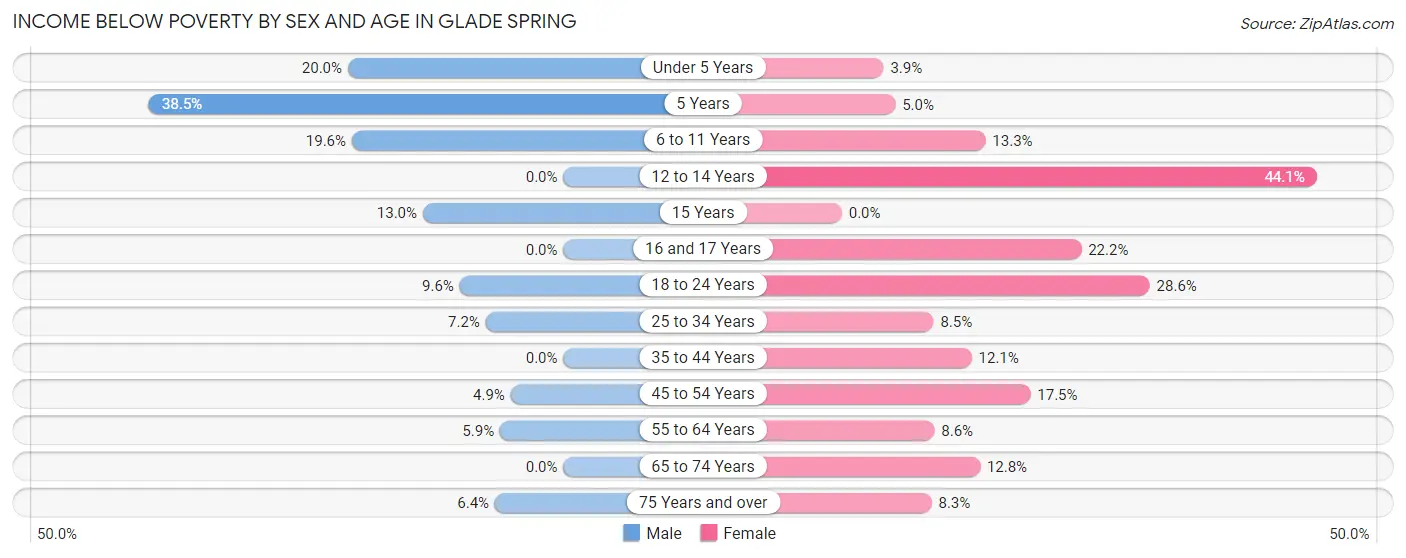
| Age Bracket | Male | Female |
| Under 5 Years | 8 (20.0%) | 6 (3.9%) |
| 5 Years | 5 (38.5%) | 7 (5.0%) |
| 6 to 11 Years | 21 (19.6%) | 16 (13.3%) |
| 12 to 14 Years | 0 (0.0%) | 26 (44.1%) |
| 15 Years | 3 (13.0%) | 0 (0.0%) |
| 16 and 17 Years | 0 (0.0%) | 4 (22.2%) |
| 18 to 24 Years | 10 (9.6%) | 8 (28.6%) |
| 25 to 34 Years | 8 (7.2%) | 12 (8.5%) |
| 35 to 44 Years | 0 (0.0%) | 10 (12.0%) |
| 45 to 54 Years | 9 (4.9%) | 21 (17.5%) |
| 55 to 64 Years | 4 (5.9%) | 14 (8.6%) |
| 65 to 74 Years | 0 (0.0%) | 15 (12.8%) |
| 75 Years and over | 4 (6.4%) | 11 (8.3%) |
| Total | 72 (7.5%) | 150 (11.6%) |
Income Above Poverty by Sex and Age in Glade Spring
According to the poverty statistics in Glade Spring, males aged 12 to 14 years and females aged 15 years are the age groups that are most secure financially, with 100.0% of males and 100.0% of females in these age groups living above the poverty line.
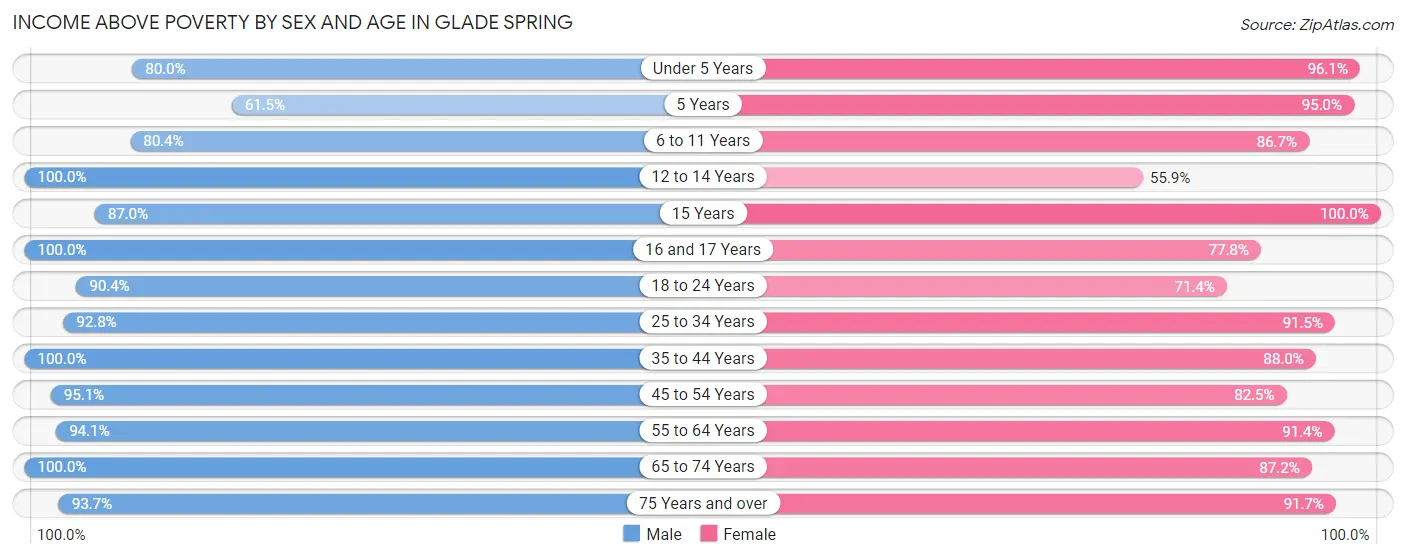
| Age Bracket | Male | Female |
| Under 5 Years | 32 (80.0%) | 149 (96.1%) |
| 5 Years | 8 (61.5%) | 134 (95.0%) |
| 6 to 11 Years | 86 (80.4%) | 104 (86.7%) |
| 12 to 14 Years | 16 (100.0%) | 33 (55.9%) |
| 15 Years | 20 (87.0%) | 16 (100.0%) |
| 16 and 17 Years | 20 (100.0%) | 14 (77.8%) |
| 18 to 24 Years | 94 (90.4%) | 20 (71.4%) |
| 25 to 34 Years | 103 (92.8%) | 129 (91.5%) |
| 35 to 44 Years | 72 (100.0%) | 73 (87.9%) |
| 45 to 54 Years | 175 (95.1%) | 99 (82.5%) |
| 55 to 64 Years | 64 (94.1%) | 149 (91.4%) |
| 65 to 74 Years | 135 (100.0%) | 102 (87.2%) |
| 75 Years and over | 59 (93.6%) | 121 (91.7%) |
| Total | 884 (92.5%) | 1,143 (88.4%) |
Income Below Poverty Among Married-Couple Families in Glade Spring
The poverty statistics for married-couple families in Glade Spring show that 3.0% or 10 of the total 336 families live below the poverty line. Families with 5 or more children have the highest poverty rate of 20.0%, comprising of 6 families. On the other hand, families with no children have the lowest poverty rate of 0.0%, which includes 0 families.
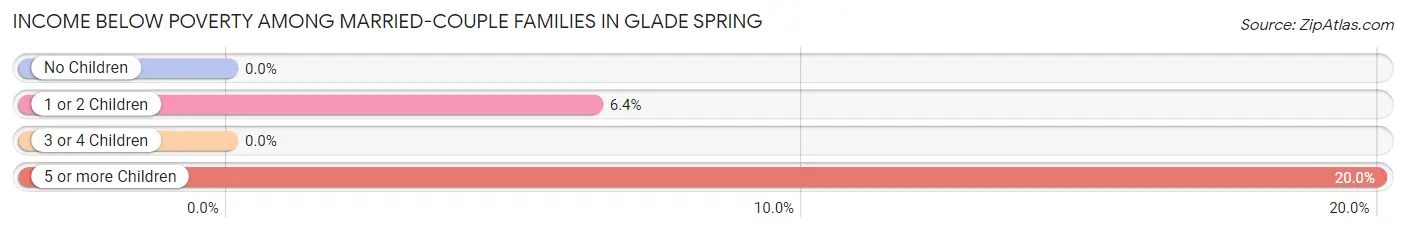
| Children | Above Poverty | Below Poverty |
| No Children | 211 (100.0%) | 0 (0.0%) |
| 1 or 2 Children | 59 (93.6%) | 4 (6.4%) |
| 3 or 4 Children | 32 (100.0%) | 0 (0.0%) |
| 5 or more Children | 24 (80.0%) | 6 (20.0%) |
| Total | 326 (97.0%) | 10 (3.0%) |
Income Below Poverty Among Single-Parent Households in Glade Spring
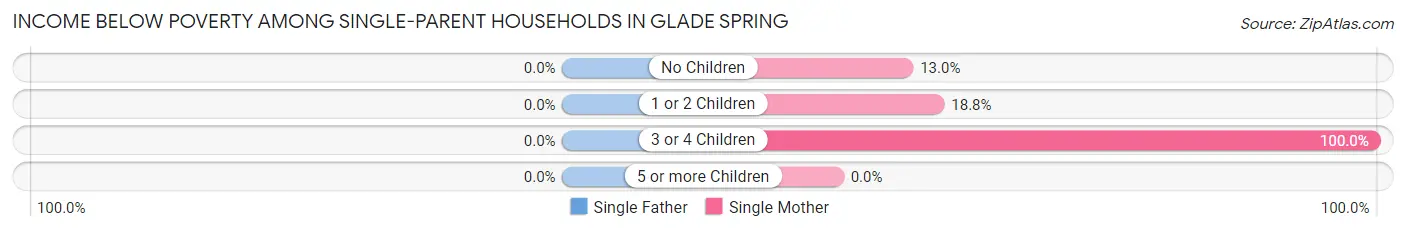
| Children | Single Father | Single Mother |
| No Children | 0 (0.0%) | 7 (13.0%) |
| 1 or 2 Children | 0 (0.0%) | 3 (18.8%) |
| 3 or 4 Children | 0 (0.0%) | 14 (100.0%) |
| 5 or more Children | 0 (0.0%) | 0 (0.0%) |
| Total | 0 (0.0%) | 24 (28.6%) |
Income Below Poverty Among Married-Couple vs Single-Parent Households in Glade Spring
The poverty data for Glade Spring shows that 10 of the married-couple family households (3.0%) and 24 of the single-parent households (15.5%) are living below the poverty level. Within the married-couple family households, those with 5 or more children have the highest poverty rate, with 6 households (20.0%) falling below the poverty line. Among the single-parent households, those with 3 or 4 children have the highest poverty rate, with 14 household (43.8%) living below poverty.
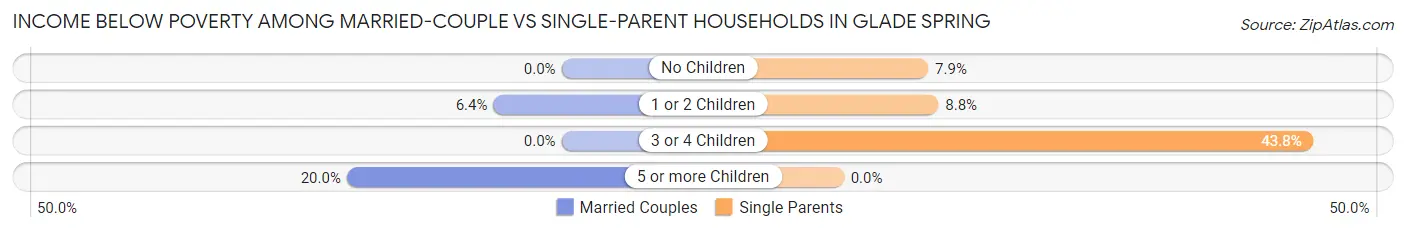
| Children | Married-Couple Families | Single-Parent Households |
| No Children | 0 (0.0%) | 7 (7.9%) |
| 1 or 2 Children | 4 (6.4%) | 3 (8.8%) |
| 3 or 4 Children | 0 (0.0%) | 14 (43.8%) |
| 5 or more Children | 6 (20.0%) | 0 (0.0%) |
| Total | 10 (3.0%) | 24 (15.5%) |
Race in Glade Spring
The most populous races in Glade Spring are White / Caucasian (2,180 | 96.9%), Two or more Races (36 | 1.6%), and Black / African American (22 | 1.0%).
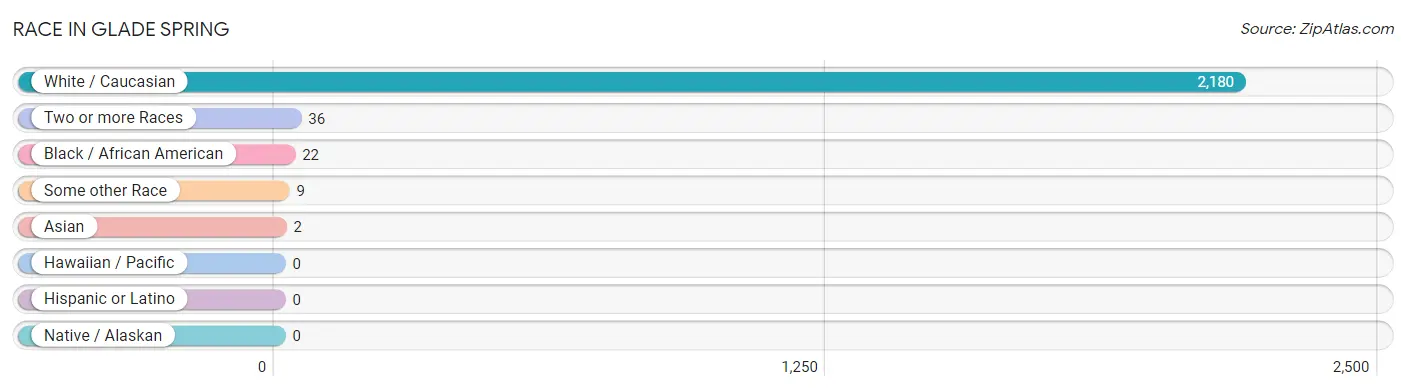
| Race | # Population | % Population |
| Asian | 2 | 0.1% |
| Black / African American | 22 | 1.0% |
| Hawaiian / Pacific | 0 | 0.0% |
| Hispanic or Latino | 0 | 0.0% |
| Native / Alaskan | 0 | 0.0% |
| White / Caucasian | 2,180 | 96.9% |
| Two or more Races | 36 | 1.6% |
| Some other Race | 9 | 0.4% |
| Total | 2,249 | 100.0% |
Ancestry in Glade Spring
The most populous ancestries reported in Glade Spring are American (1,105 | 49.1%), English (277 | 12.3%), Irish (183 | 8.1%), Scotch-Irish (74 | 3.3%), and German (64 | 2.9%), together accounting for 75.7% of all Glade Spring residents.
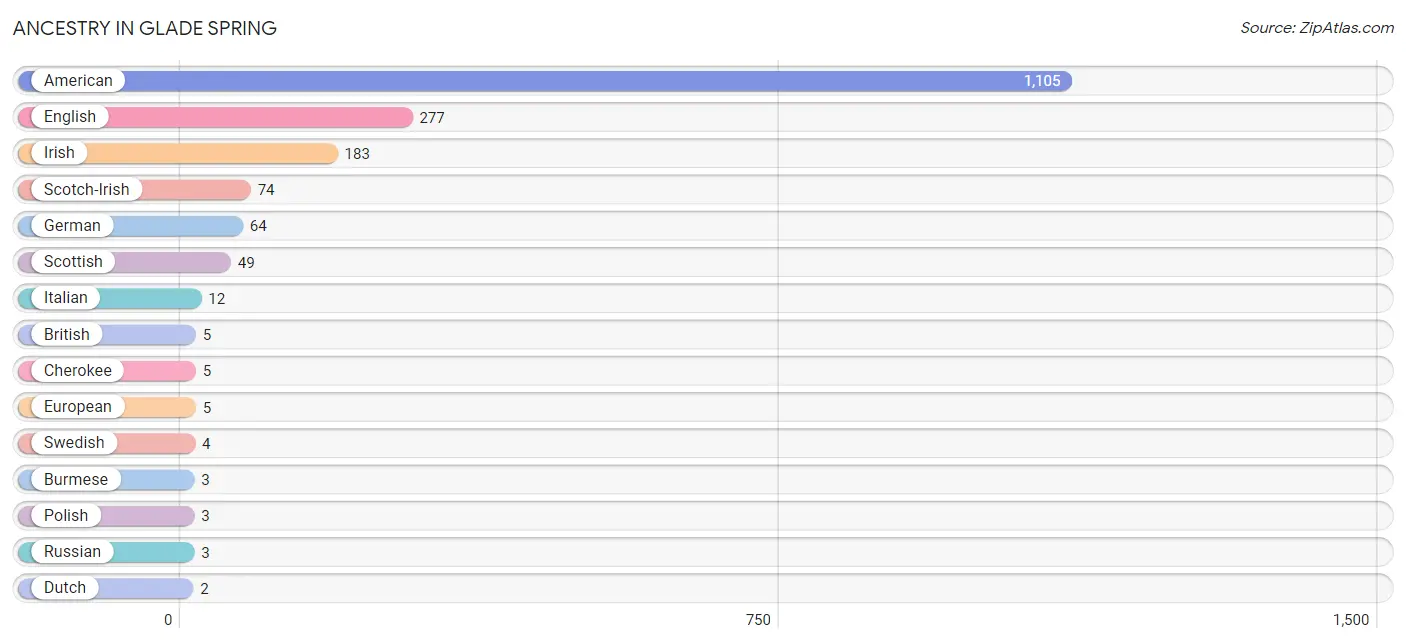
| Ancestry | # Population | % Population |
| American | 1,105 | 49.1% |
| British | 5 | 0.2% |
| Burmese | 3 | 0.1% |
| Cherokee | 5 | 0.2% |
| Dutch | 2 | 0.1% |
| English | 277 | 12.3% |
| European | 5 | 0.2% |
| Finnish | 2 | 0.1% |
| German | 64 | 2.9% |
| Irish | 183 | 8.1% |
| Italian | 12 | 0.5% |
| Korean | 2 | 0.1% |
| Northern European | 2 | 0.1% |
| Polish | 3 | 0.1% |
| Russian | 3 | 0.1% |
| Scotch-Irish | 74 | 3.3% |
| Scottish | 49 | 2.2% |
| Swedish | 4 | 0.2% | View All 18 Rows |
Immigrants in Glade Spring
The most numerous immigrant groups reported in Glade Spring came from Asia (2 | 0.1%), Philippines (2 | 0.1%), and South Eastern Asia (2 | 0.1%), together accounting for 0.3% of all Glade Spring residents.
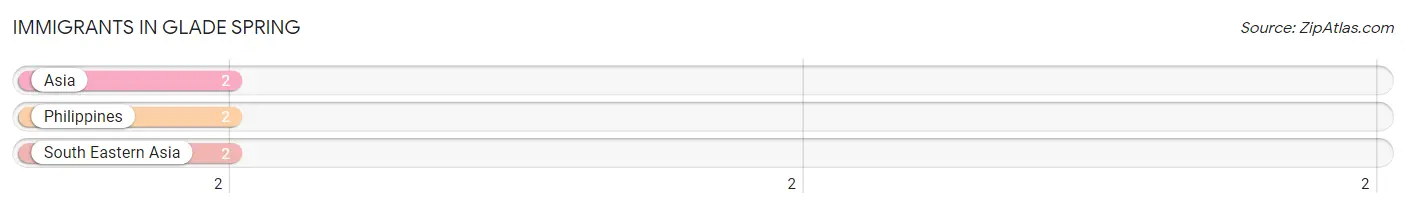
| Immigration Origin | # Population | % Population |
| Asia | 2 | 0.1% |
| Philippines | 2 | 0.1% |
| South Eastern Asia | 2 | 0.1% | View All 3 Rows |
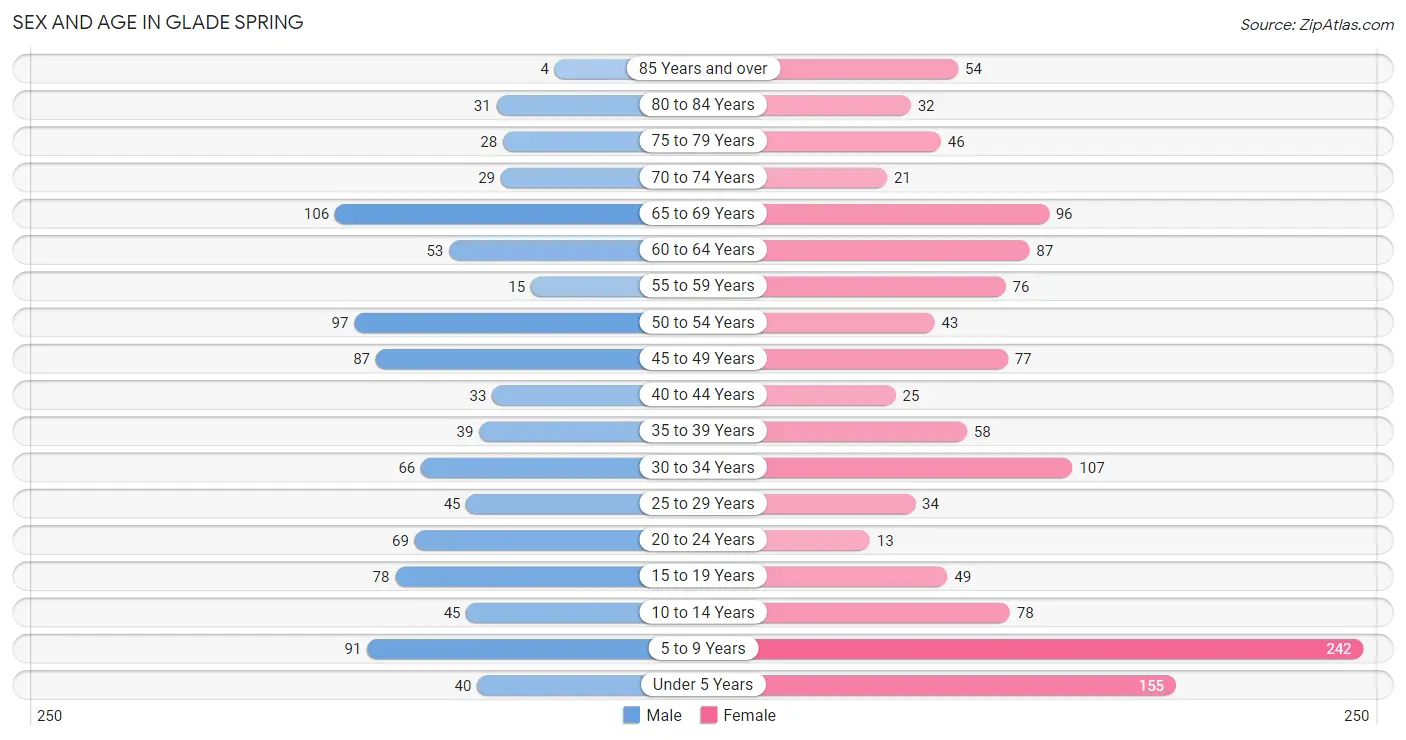
Sex and Age in Glade Spring
Sex and Age in Glade Spring
The most populous age groups in Glade Spring are 65 to 69 Years (106 | 11.1%) for men and 5 to 9 Years (242 | 18.7%) for women.
| Age Bracket | Male | Female |
| Under 5 Years | 40 (4.2%) | 155 (12.0%) |
| 5 to 9 Years | 91 (9.5%) | 242 (18.7%) |
| 10 to 14 Years | 45 (4.7%) | 78 (6.0%) |
| 15 to 19 Years | 78 (8.2%) | 49 (3.8%) |
| 20 to 24 Years | 69 (7.2%) | 13 (1.0%) |
| 25 to 29 Years | 45 (4.7%) | 34 (2.6%) |
| 30 to 34 Years | 66 (6.9%) | 107 (8.3%) |
| 35 to 39 Years | 39 (4.1%) | 58 (4.5%) |
| 40 to 44 Years | 33 (3.5%) | 25 (1.9%) |
| 45 to 49 Years | 87 (9.1%) | 77 (6.0%) |
| 50 to 54 Years | 97 (10.2%) | 43 (3.3%) |
| 55 to 59 Years | 15 (1.6%) | 76 (5.9%) |
| 60 to 64 Years | 53 (5.5%) | 87 (6.7%) |
| 65 to 69 Years | 106 (11.1%) | 96 (7.4%) |
| 70 to 74 Years | 29 (3.0%) | 21 (1.6%) |
| 75 to 79 Years | 28 (2.9%) | 46 (3.6%) |
| 80 to 84 Years | 31 (3.2%) | 32 (2.5%) |
| 85 Years and over | 4 (0.4%) | 54 (4.2%) |
| Total | 956 (100.0%) | 1,293 (100.0%) |
Families and Households in Glade Spring
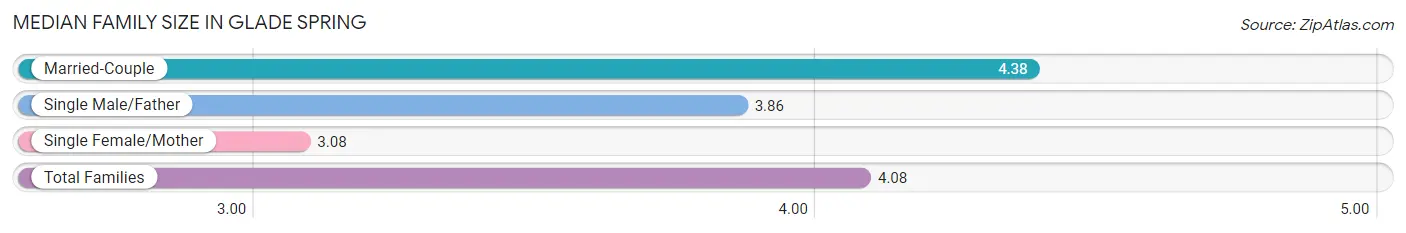
Median Family Size in Glade Spring
The median family size in Glade Spring is 4.08 persons per family, with married-couple families (336 | 68.4%) accounting for the largest median family size of 4.38 persons per family. On the other hand, single female/mother families (84 | 17.1%) represent the smallest median family size with 3.08 persons per family.
| Family Type | # Families | Family Size |
| Married-Couple | 336 (68.4%) | 4.38 |
| Single Male/Father | 71 (14.5%) | 3.86 |
| Single Female/Mother | 84 (17.1%) | 3.08 |
| Total Families | 491 (100.0%) | 4.08 |
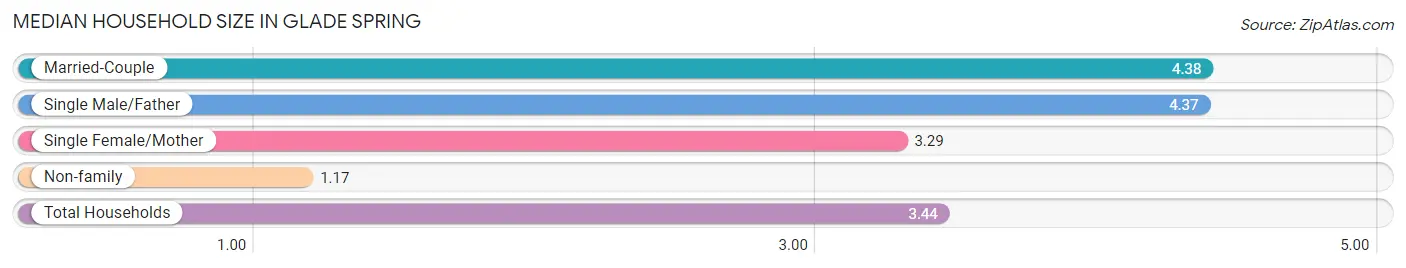
Median Household Size in Glade Spring
The median household size in Glade Spring is 3.44 persons per household, with married-couple households (336 | 51.4%) accounting for the largest median household size of 4.38 persons per household. non-family households (163 | 24.9%) represent the smallest median household size with 1.17 persons per household.
| Household Type | # Households | Household Size |
| Married-Couple | 336 (51.4%) | 4.38 |
| Single Male/Father | 71 (10.9%) | 4.37 |
| Single Female/Mother | 84 (12.8%) | 3.29 |
| Non-family | 163 (24.9%) | 1.17 |
| Total Households | 654 (100.0%) | 3.44 |
Household Size by Marriage Status in Glade Spring
Out of a total of 654 households in Glade Spring, 491 (75.1%) are family households, while 163 (24.9%) are nonfamily households. The most numerous type of family households are 2-person households, comprising 242, and the most common type of nonfamily households are 1-person households, comprising 143.
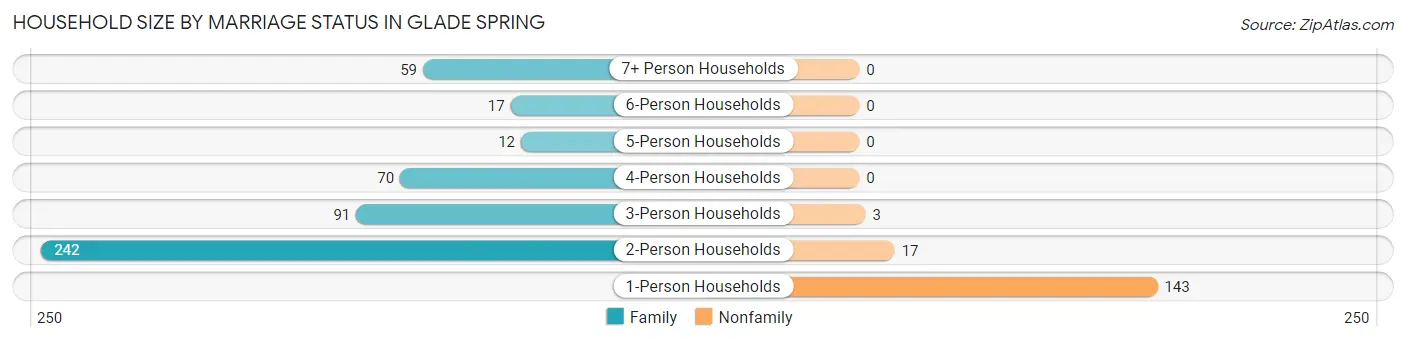
| Household Size | Family Households | Nonfamily Households |
| 1-Person Households | - | 143 (21.9%) |
| 2-Person Households | 242 (37.0%) | 17 (2.6%) |
| 3-Person Households | 91 (13.9%) | 3 (0.5%) |
| 4-Person Households | 70 (10.7%) | 0 (0.0%) |
| 5-Person Households | 12 (1.8%) | 0 (0.0%) |
| 6-Person Households | 17 (2.6%) | 0 (0.0%) |
| 7+ Person Households | 59 (9.0%) | 0 (0.0%) |
| Total | 491 (75.1%) | 163 (24.9%) |
Female Fertility in Glade Spring
Fertility by Age in Glade Spring
Average fertility rate in Glade Spring is 52.0 births per 1,000 women. Women in the age bracket of 20 to 34 years have the highest fertility rate with 123.0 births per 1,000 women. Women in the age bracket of 20 to 34 years acount for 100.0% of all women with births.
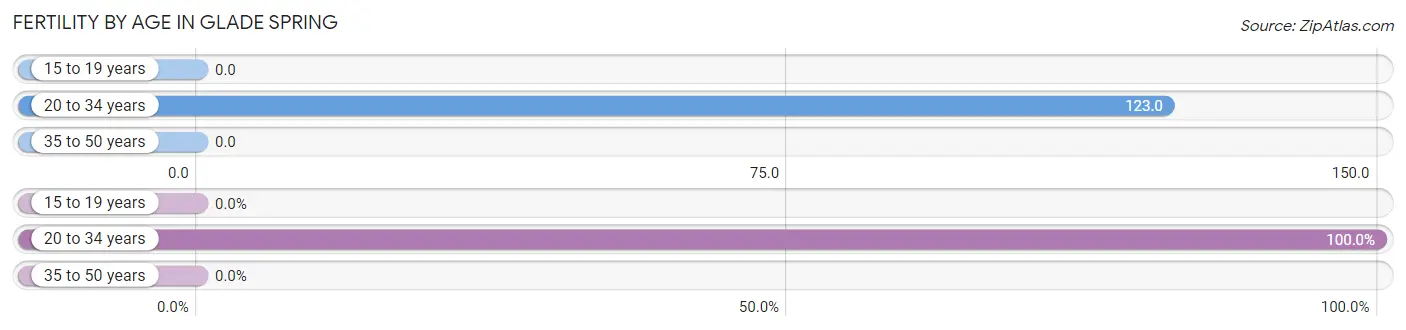
| Age Bracket | Women with Births | Births / 1,000 Women |
| 15 to 19 years | 0 (0.0%) | 0.0 |
| 20 to 34 years | 19 (100.0%) | 123.0 |
| 35 to 50 years | 0 (0.0%) | 0.0 |
| Total | 19 (100.0%) | 52.0 |
Fertility by Age by Marriage Status in Glade Spring
84.2% of women with births (19) in Glade Spring are married. The highest percentage of unmarried women with births falls into 20 to 34 years age bracket with 15.8% of them unmarried at the time of birth, while the lowest percentage of unmarried women with births belong to 20 to 34 years age bracket with 15.8% of them unmarried.
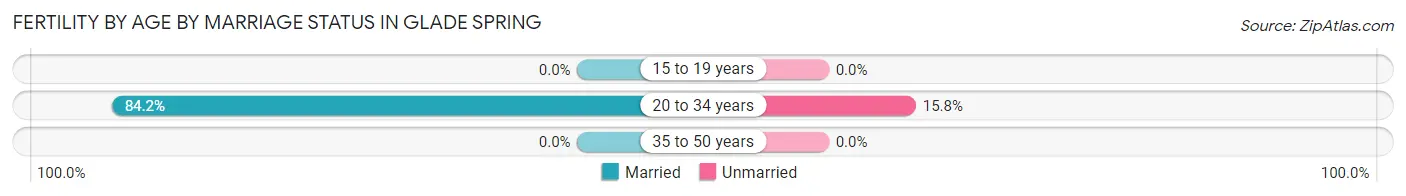
| Age Bracket | Married | Unmarried |
| 15 to 19 years | 0 (0.0%) | 0 (0.0%) |
| 20 to 34 years | 16 (84.2%) | 3 (15.8%) |
| 35 to 50 years | 0 (0.0%) | 0 (0.0%) |
| Total | 16 (84.2%) | 3 (15.8%) |
Fertility by Education in Glade Spring
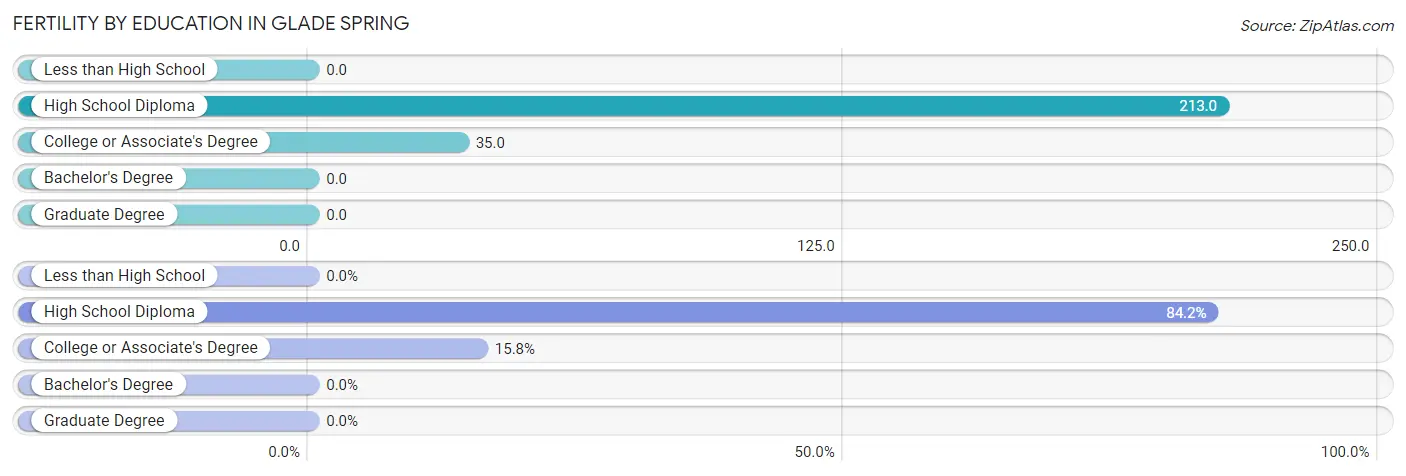
| Educational Attainment | Women with Births | Births / 1,000 Women |
| Less than High School | 0 (0.0%) | 0.0 |
| High School Diploma | 16 (84.2%) | 213.0 |
| College or Associate's Degree | 3 (15.8%) | 35.0 |
| Bachelor's Degree | 0 (0.0%) | 0.0 |
| Graduate Degree | 0 (0.0%) | 0.0 |
| Total | 19 (100.0%) | 52.0 |
Fertility by Education by Marriage Status in Glade Spring
15.8% of women with births in Glade Spring are unmarried. Women with the educational attainment of high school diploma are most likely to be married with 100.0% of them married at childbirth, while women with the educational attainment of college or associate's degree are least likely to be married with 100.0% of them unmarried at childbirth.
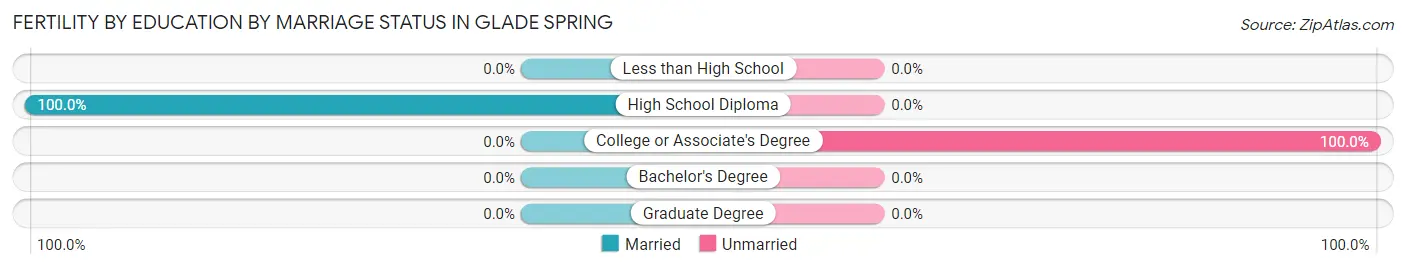
| Educational Attainment | Married | Unmarried |
| Less than High School | 0 (0.0%) | 0 (0.0%) |
| High School Diploma | 16 (100.0%) | 0 (0.0%) |
| College or Associate's Degree | 0 (0.0%) | 3 (100.0%) |
| Bachelor's Degree | 0 (0.0%) | 0 (0.0%) |
| Graduate Degree | 0 (0.0%) | 0 (0.0%) |
| Total | 16 (84.2%) | 3 (15.8%) |
Employment Characteristics in Glade Spring
Employment by Class of Employer in Glade Spring
Among the 820 employed individuals in Glade Spring, private company employees (525 | 64.0%), not-for-profit organizations (88 | 10.7%), and state government employees (87 | 10.6%) make up the most common classes of employment.
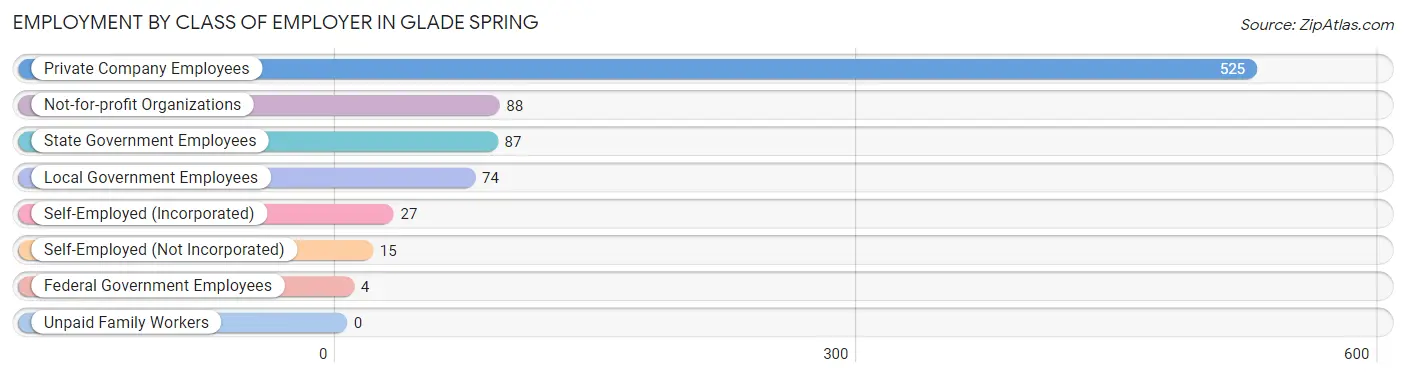
| Employer Class | # Employees | % Employees |
| Private Company Employees | 525 | 64.0% |
| Self-Employed (Incorporated) | 27 | 3.3% |
| Self-Employed (Not Incorporated) | 15 | 1.8% |
| Not-for-profit Organizations | 88 | 10.7% |
| Local Government Employees | 74 | 9.0% |
| State Government Employees | 87 | 10.6% |
| Federal Government Employees | 4 | 0.5% |
| Unpaid Family Workers | 0 | 0.0% |
| Total | 820 | 100.0% |
Employment Status by Age in Glade Spring
According to the labor force statistics for Glade Spring, out of the total population over 16 years of age (1,559), 55.6% or 867 individuals are in the labor force, with 2.4% or 21 of them unemployed. The age group with the highest labor force participation rate is 30 to 34 years, with 98.3% or 170 individuals in the labor force. Within the labor force, the 75 years and over age range has the highest percentage of unemployed individuals, with 12.5% or 4 of them being unemployed.
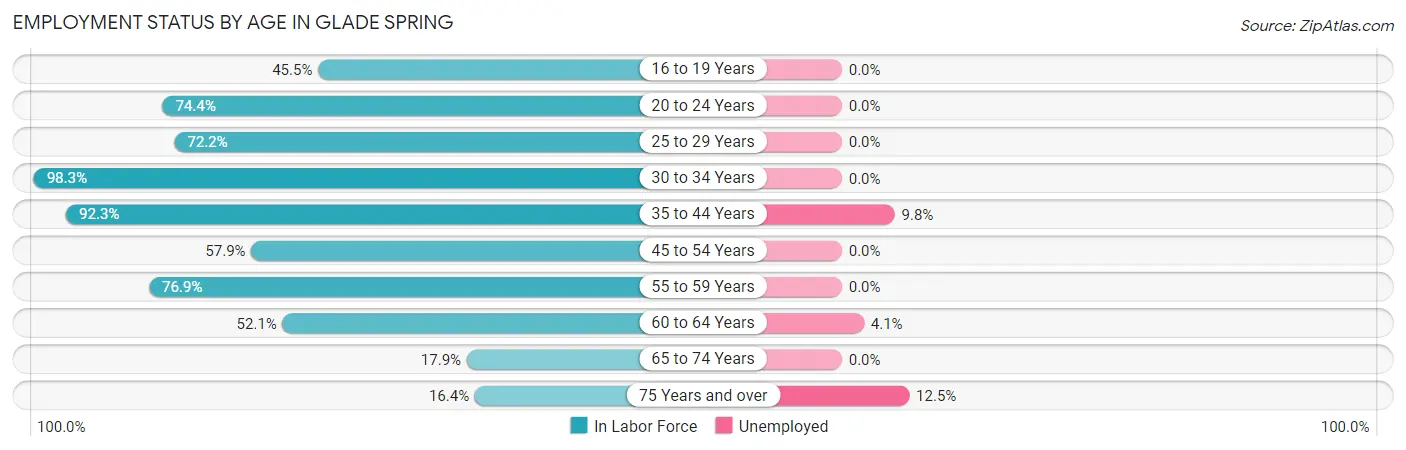
| Age Bracket | In Labor Force | Unemployed |
| 16 to 19 Years | 40 (45.5%) | 0 (0.0%) |
| 20 to 24 Years | 61 (74.4%) | 0 (0.0%) |
| 25 to 29 Years | 57 (72.2%) | 0 (0.0%) |
| 30 to 34 Years | 170 (98.3%) | 0 (0.0%) |
| 35 to 44 Years | 143 (92.3%) | 14 (9.8%) |
| 45 to 54 Years | 176 (57.9%) | 0 (0.0%) |
| 55 to 59 Years | 70 (76.9%) | 0 (0.0%) |
| 60 to 64 Years | 73 (52.1%) | 3 (4.1%) |
| 65 to 74 Years | 45 (17.9%) | 0 (0.0%) |
| 75 Years and over | 32 (16.4%) | 4 (12.5%) |
| Total | 867 (55.6%) | 21 (2.4%) |
Employment Status by Educational Attainment in Glade Spring
According to labor force statistics for Glade Spring, 73.1% of individuals (689) out of the total population between 25 and 64 years of age (942) are in the labor force, with 2.5% or 17 of them being unemployed. The group with the highest labor force participation rate are those with the educational attainment of bachelor's degree or higher, with 76.4% or 204 individuals in the labor force. Within the labor force, individuals with college / associate degree education have the highest percentage of unemployment, with 7.1% or 14 of them being unemployed.
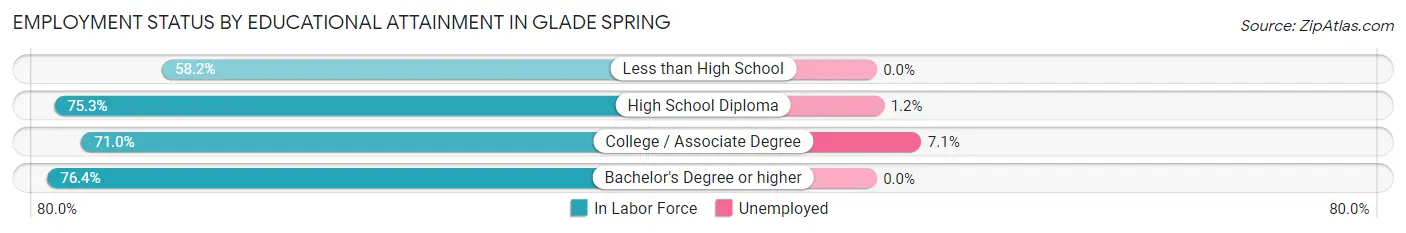
| Educational Attainment | In Labor Force | Unemployed |
| Less than High School | 39 (58.2%) | 0 (0.0%) |
| High School Diploma | 250 (75.3%) | 4 (1.2%) |
| College / Associate Degree | 196 (71.0%) | 20 (7.1%) |
| Bachelor's Degree or higher | 204 (76.4%) | 0 (0.0%) |
| Total | 689 (73.1%) | 24 (2.5%) |
Employment Occupations by Sex in Glade Spring
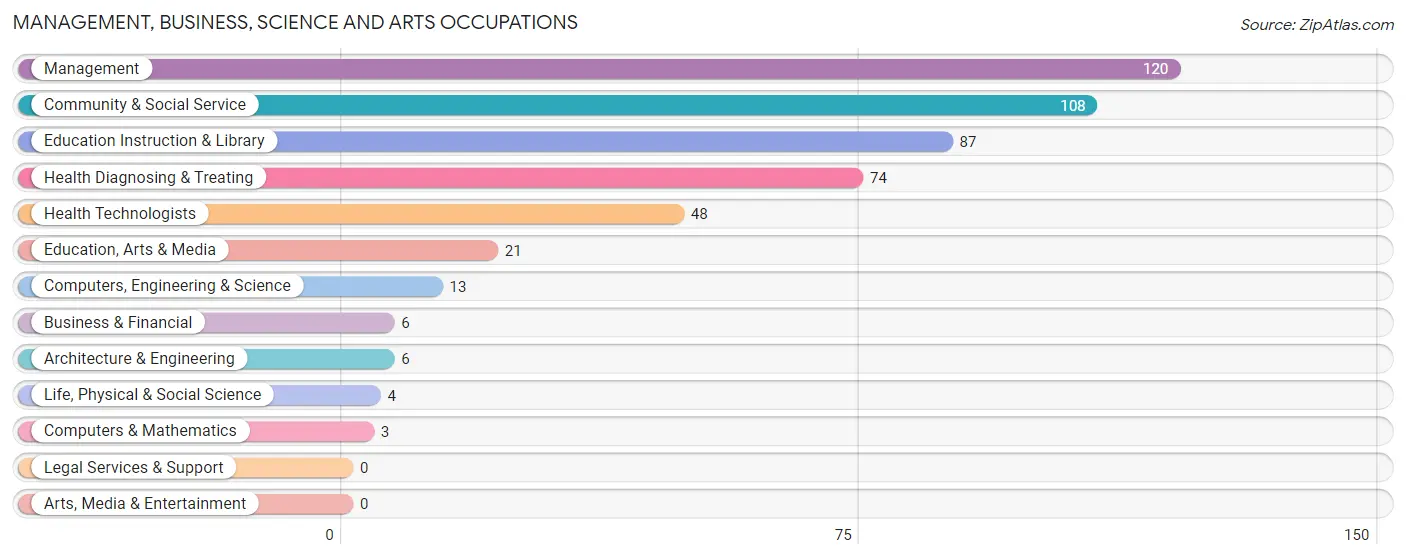
Management, Business, Science and Arts Occupations
The most common Management, Business, Science and Arts occupations in Glade Spring are Management (120 | 14.2%), Community & Social Service (108 | 12.8%), Education Instruction & Library (87 | 10.3%), Health Diagnosing & Treating (74 | 8.7%), and Health Technologists (48 | 5.7%).
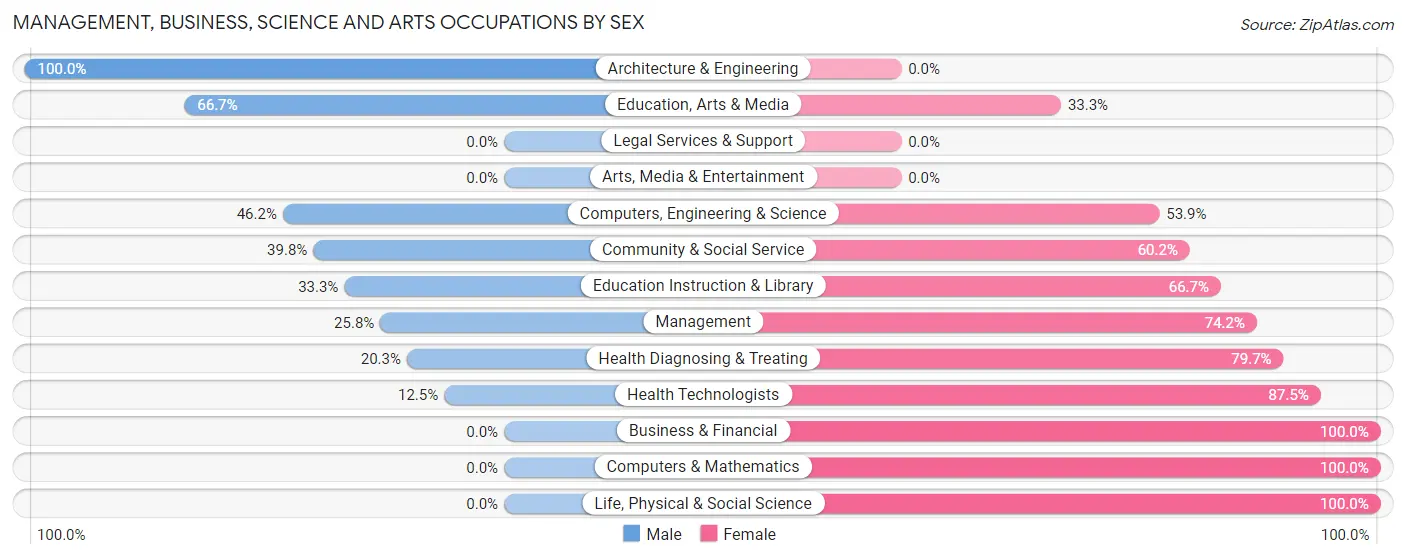
Management, Business, Science and Arts Occupations by Sex
Within the Management, Business, Science and Arts occupations in Glade Spring, the most male-oriented occupations are Architecture & Engineering (100.0%), Education, Arts & Media (66.7%), and Computers, Engineering & Science (46.2%), while the most female-oriented occupations are Business & Financial (100.0%), Computers & Mathematics (100.0%), and Life, Physical & Social Science (100.0%).
| Occupation | Male | Female |
| Management | 31 (25.8%) | 89 (74.2%) |
| Business & Financial | 0 (0.0%) | 6 (100.0%) |
| Computers, Engineering & Science | 6 (46.2%) | 7 (53.8%) |
| Computers & Mathematics | 0 (0.0%) | 3 (100.0%) |
| Architecture & Engineering | 6 (100.0%) | 0 (0.0%) |
| Life, Physical & Social Science | 0 (0.0%) | 4 (100.0%) |
| Community & Social Service | 43 (39.8%) | 65 (60.2%) |
| Education, Arts & Media | 14 (66.7%) | 7 (33.3%) |
| Legal Services & Support | 0 (0.0%) | 0 (0.0%) |
| Education Instruction & Library | 29 (33.3%) | 58 (66.7%) |
| Arts, Media & Entertainment | 0 (0.0%) | 0 (0.0%) |
| Health Diagnosing & Treating | 15 (20.3%) | 59 (79.7%) |
| Health Technologists | 6 (12.5%) | 42 (87.5%) |
| Total (Category) | 95 (29.6%) | 226 (70.4%) |
| Total (Overall) | 440 (52.0%) | 406 (48.0%) |
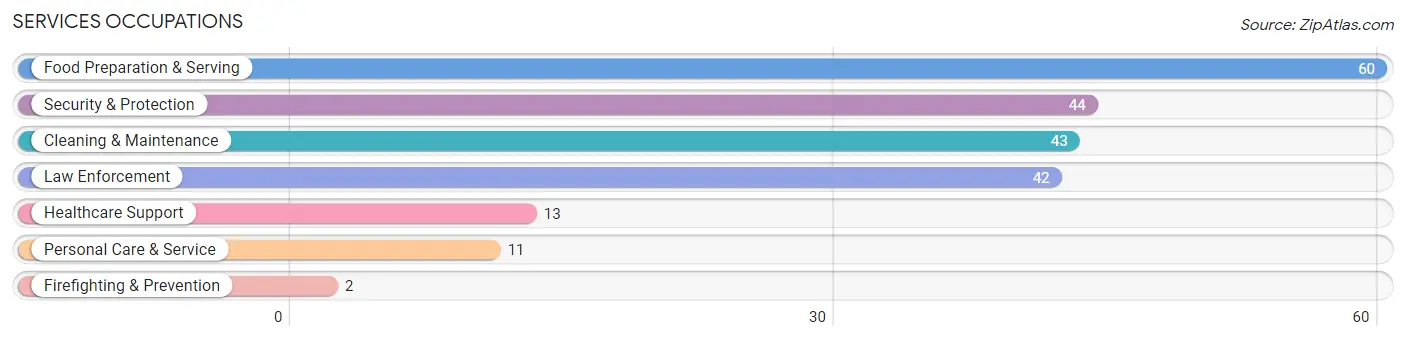
Services Occupations
The most common Services occupations in Glade Spring are Food Preparation & Serving (60 | 7.1%), Security & Protection (44 | 5.2%), Cleaning & Maintenance (43 | 5.1%), Law Enforcement (42 | 5.0%), and Healthcare Support (13 | 1.5%).
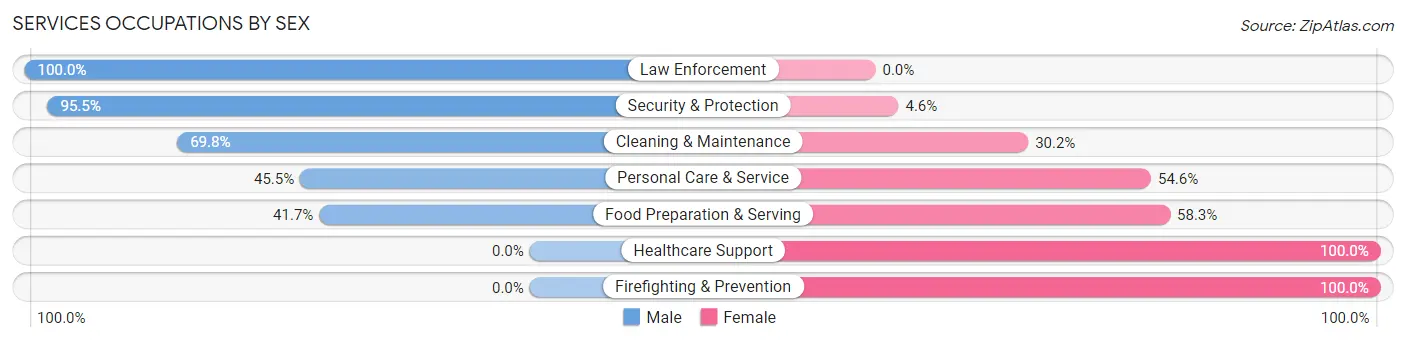
Services Occupations by Sex
Within the Services occupations in Glade Spring, the most male-oriented occupations are Law Enforcement (100.0%), Security & Protection (95.5%), and Cleaning & Maintenance (69.8%), while the most female-oriented occupations are Healthcare Support (100.0%), Firefighting & Prevention (100.0%), and Food Preparation & Serving (58.3%).
| Occupation | Male | Female |
| Healthcare Support | 0 (0.0%) | 13 (100.0%) |
| Security & Protection | 42 (95.5%) | 2 (4.5%) |
| Firefighting & Prevention | 0 (0.0%) | 2 (100.0%) |
| Law Enforcement | 42 (100.0%) | 0 (0.0%) |
| Food Preparation & Serving | 25 (41.7%) | 35 (58.3%) |
| Cleaning & Maintenance | 30 (69.8%) | 13 (30.2%) |
| Personal Care & Service | 5 (45.5%) | 6 (54.5%) |
| Total (Category) | 102 (59.7%) | 69 (40.4%) |
| Total (Overall) | 440 (52.0%) | 406 (48.0%) |
Sales and Office Occupations
The most common Sales and Office occupations in Glade Spring are Sales & Related (76 | 9.0%), and Office & Administration (50 | 5.9%).
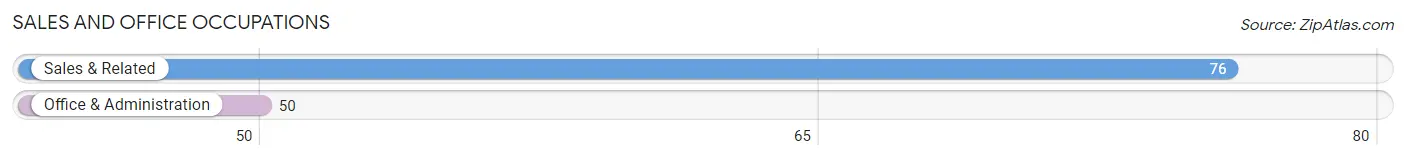
Sales and Office Occupations by Sex
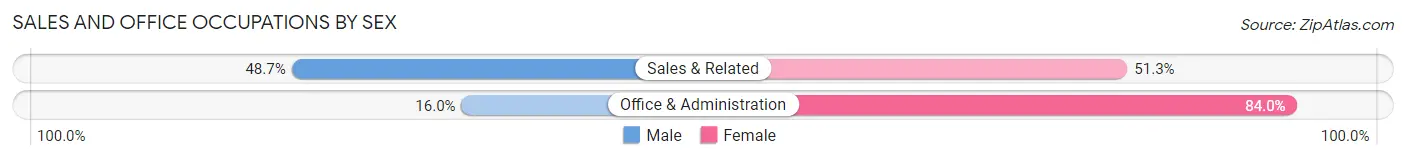
| Occupation | Male | Female |
| Sales & Related | 37 (48.7%) | 39 (51.3%) |
| Office & Administration | 8 (16.0%) | 42 (84.0%) |
| Total (Category) | 45 (35.7%) | 81 (64.3%) |
| Total (Overall) | 440 (52.0%) | 406 (48.0%) |
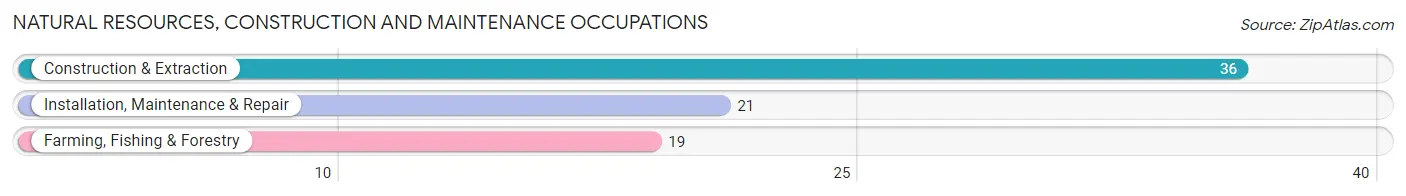
Natural Resources, Construction and Maintenance Occupations
The most common Natural Resources, Construction and Maintenance occupations in Glade Spring are Construction & Extraction (36 | 4.3%), Installation, Maintenance & Repair (21 | 2.5%), and Farming, Fishing & Forestry (19 | 2.2%).
Natural Resources, Construction and Maintenance Occupations by Sex
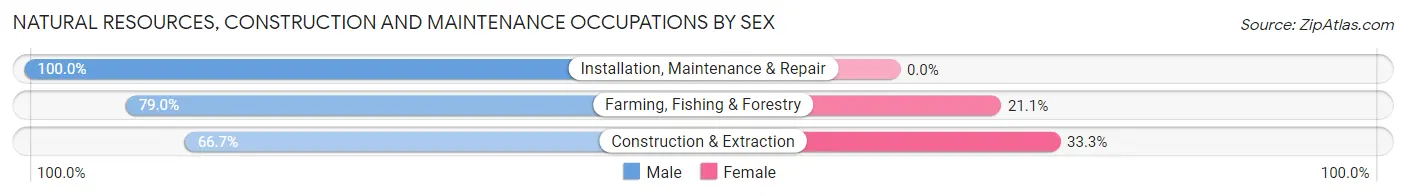
| Occupation | Male | Female |
| Farming, Fishing & Forestry | 15 (78.9%) | 4 (21.0%) |
| Construction & Extraction | 24 (66.7%) | 12 (33.3%) |
| Installation, Maintenance & Repair | 21 (100.0%) | 0 (0.0%) |
| Total (Category) | 60 (78.9%) | 16 (21.0%) |
| Total (Overall) | 440 (52.0%) | 406 (48.0%) |
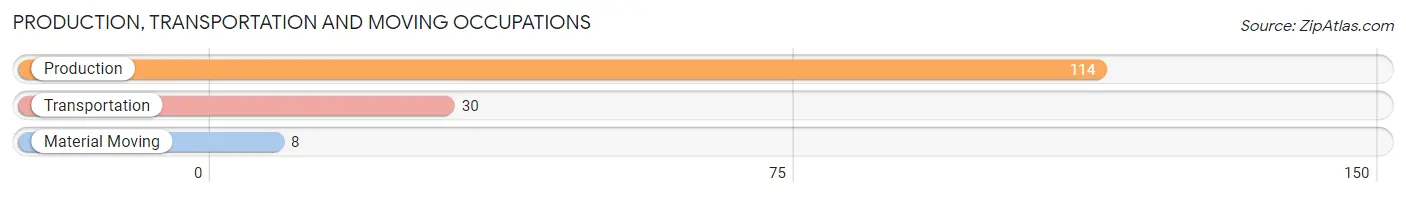
Production, Transportation and Moving Occupations
The most common Production, Transportation and Moving occupations in Glade Spring are Production (114 | 13.5%), Transportation (30 | 3.5%), and Material Moving (8 | 0.9%).
Production, Transportation and Moving Occupations by Sex
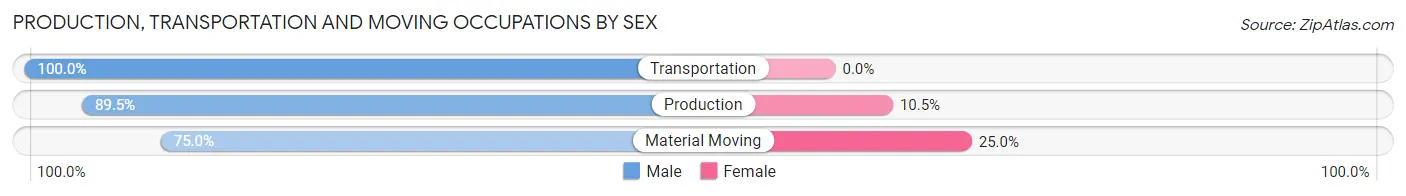
| Occupation | Male | Female |
| Production | 102 (89.5%) | 12 (10.5%) |
| Transportation | 30 (100.0%) | 0 (0.0%) |
| Material Moving | 6 (75.0%) | 2 (25.0%) |
| Total (Category) | 138 (90.8%) | 14 (9.2%) |
| Total (Overall) | 440 (52.0%) | 406 (48.0%) |
Employment Industries by Sex in Glade Spring
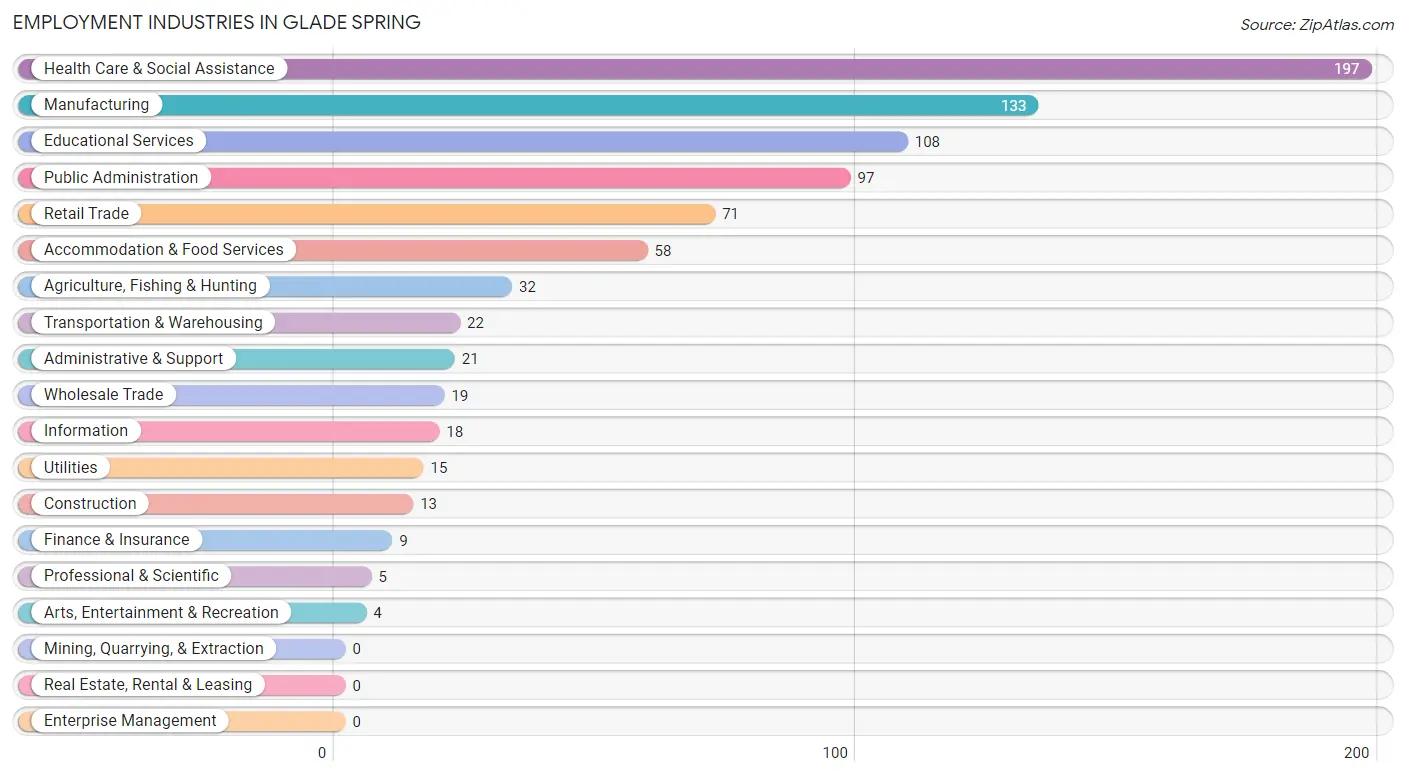
Employment Industries in Glade Spring
The major employment industries in Glade Spring include Health Care & Social Assistance (197 | 23.3%), Manufacturing (133 | 15.7%), Educational Services (108 | 12.8%), Public Administration (97 | 11.5%), and Retail Trade (71 | 8.4%).
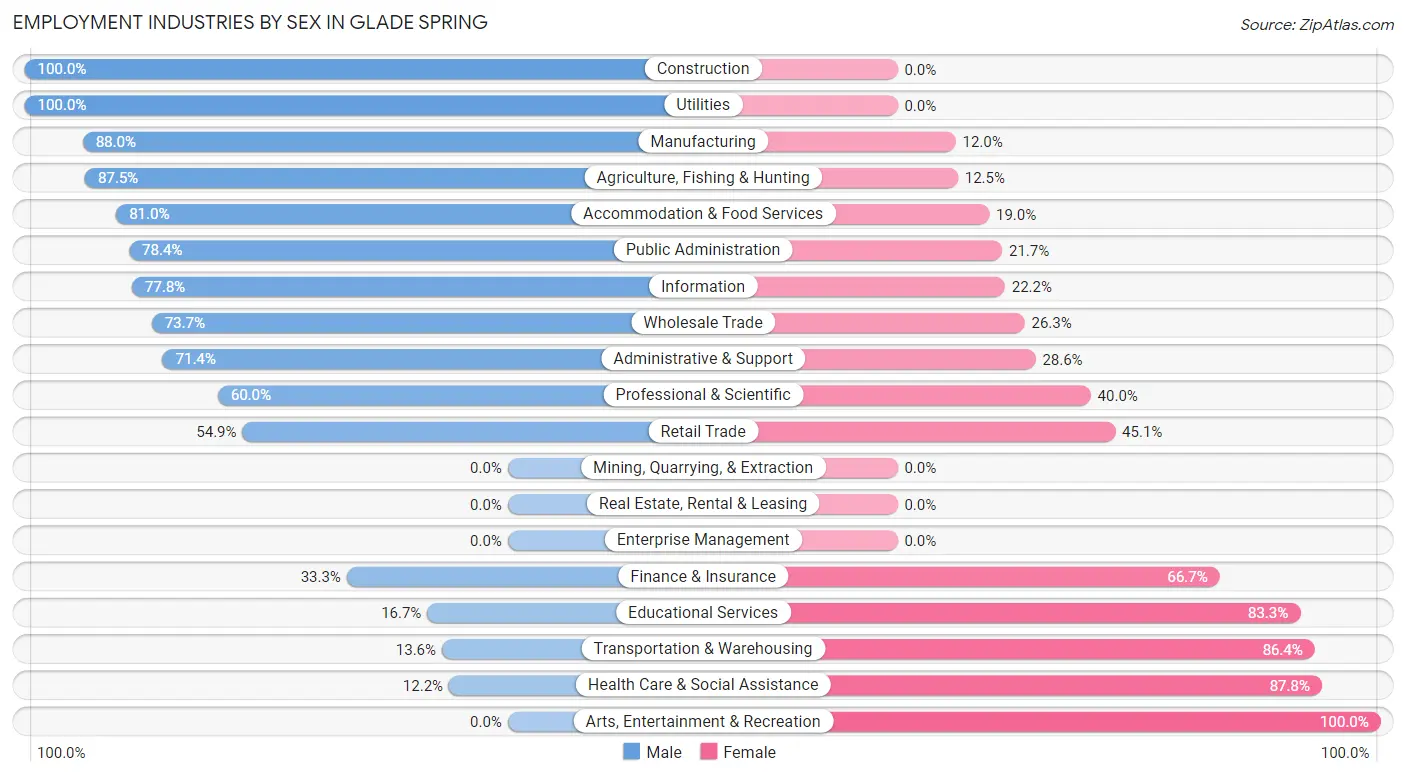
Employment Industries by Sex in Glade Spring
The Glade Spring industries that see more men than women are Construction (100.0%), Utilities (100.0%), and Manufacturing (88.0%), whereas the industries that tend to have a higher number of women are Arts, Entertainment & Recreation (100.0%), Health Care & Social Assistance (87.8%), and Transportation & Warehousing (86.4%).
| Industry | Male | Female |
| Agriculture, Fishing & Hunting | 28 (87.5%) | 4 (12.5%) |
| Mining, Quarrying, & Extraction | 0 (0.0%) | 0 (0.0%) |
| Construction | 13 (100.0%) | 0 (0.0%) |
| Manufacturing | 117 (88.0%) | 16 (12.0%) |
| Wholesale Trade | 14 (73.7%) | 5 (26.3%) |
| Retail Trade | 39 (54.9%) | 32 (45.1%) |
| Transportation & Warehousing | 3 (13.6%) | 19 (86.4%) |
| Utilities | 15 (100.0%) | 0 (0.0%) |
| Information | 14 (77.8%) | 4 (22.2%) |
| Finance & Insurance | 3 (33.3%) | 6 (66.7%) |
| Real Estate, Rental & Leasing | 0 (0.0%) | 0 (0.0%) |
| Professional & Scientific | 3 (60.0%) | 2 (40.0%) |
| Enterprise Management | 0 (0.0%) | 0 (0.0%) |
| Administrative & Support | 15 (71.4%) | 6 (28.6%) |
| Educational Services | 18 (16.7%) | 90 (83.3%) |
| Health Care & Social Assistance | 24 (12.2%) | 173 (87.8%) |
| Arts, Entertainment & Recreation | 0 (0.0%) | 4 (100.0%) |
| Accommodation & Food Services | 47 (81.0%) | 11 (19.0%) |
| Public Administration | 76 (78.3%) | 21 (21.6%) |
| Total | 440 (52.0%) | 406 (48.0%) |
Education in Glade Spring
School Enrollment in Glade Spring
The most common levels of schooling among the 525 students in Glade Spring are elementary school (154 | 29.3%), kindergarten (138 | 26.3%), and high school (111 | 21.1%).
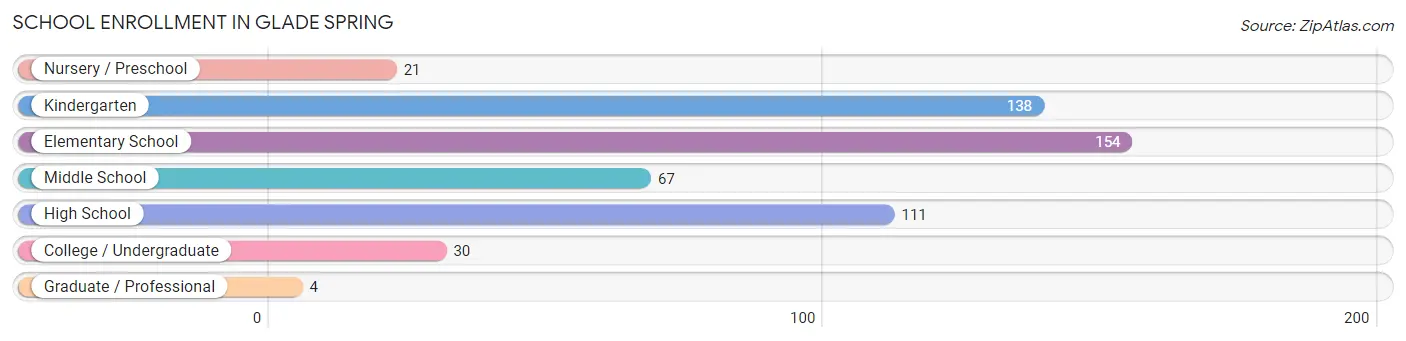
| School Level | # Students | % Students |
| Nursery / Preschool | 21 | 4.0% |
| Kindergarten | 138 | 26.3% |
| Elementary School | 154 | 29.3% |
| Middle School | 67 | 12.8% |
| High School | 111 | 21.1% |
| College / Undergraduate | 30 | 5.7% |
| Graduate / Professional | 4 | 0.8% |
| Total | 525 | 100.0% |
School Enrollment by Age by Funding Source in Glade Spring
Out of a total of 525 students who are enrolled in schools in Glade Spring, 71 (13.5%) attend a private institution, while the remaining 454 (86.5%) are enrolled in public schools. The age group of 3 to 4 year olds has the highest likelihood of being enrolled in private schools, with 3 (60.0% in the age bracket) enrolled. Conversely, the age group of 15 to 17 year olds has the lowest likelihood of being enrolled in a private school, with 63 (100.0% in the age bracket) attending a public institution.
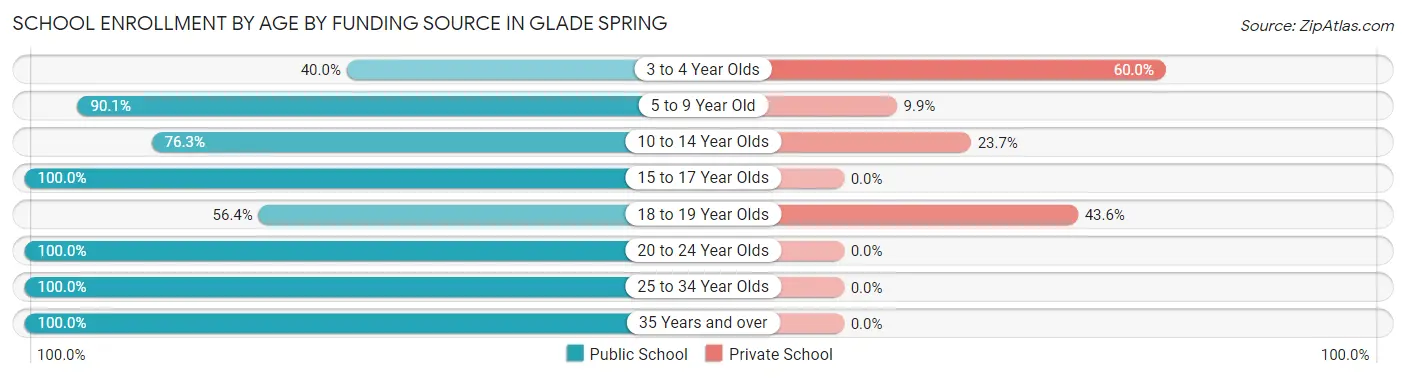
| Age Bracket | Public School | Private School |
| 3 to 4 Year Olds | 2 (40.0%) | 3 (60.0%) |
| 5 to 9 Year Old | 265 (90.1%) | 29 (9.9%) |
| 10 to 14 Year Olds | 71 (76.3%) | 22 (23.7%) |
| 15 to 17 Year Olds | 63 (100.0%) | 0 (0.0%) |
| 18 to 19 Year Olds | 22 (56.4%) | 17 (43.6%) |
| 20 to 24 Year Olds | 6 (100.0%) | 0 (0.0%) |
| 25 to 34 Year Olds | 21 (100.0%) | 0 (0.0%) |
| 35 Years and over | 4 (100.0%) | 0 (0.0%) |
| Total | 454 (86.5%) | 71 (13.5%) |
Educational Attainment by Field of Study in Glade Spring
Business (94 | 23.0%), psychology (57 | 13.9%), education (57 | 13.9%), physical & health sciences (43 | 10.5%), and science & technology (39 | 9.5%) are the most common fields of study among 409 individuals in Glade Spring who have obtained a bachelor's degree or higher.
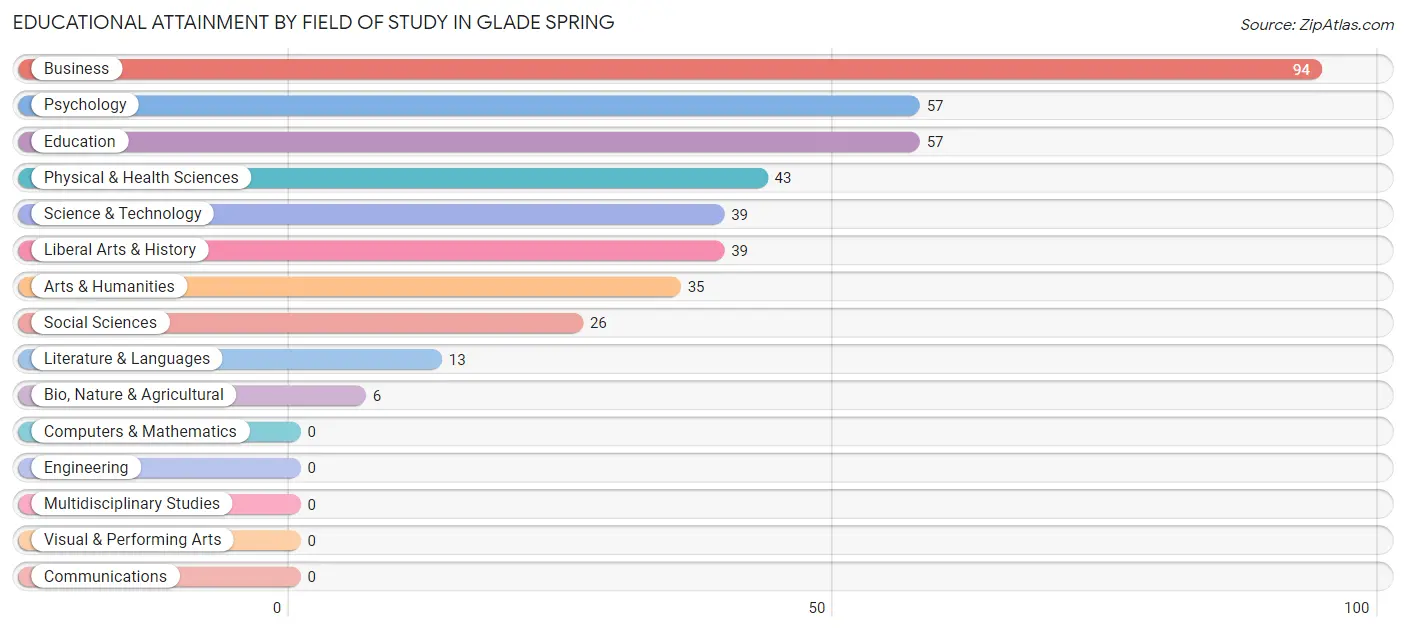
| Field of Study | # Graduates | % Graduates |
| Computers & Mathematics | 0 | 0.0% |
| Bio, Nature & Agricultural | 6 | 1.5% |
| Physical & Health Sciences | 43 | 10.5% |
| Psychology | 57 | 13.9% |
| Social Sciences | 26 | 6.4% |
| Engineering | 0 | 0.0% |
| Multidisciplinary Studies | 0 | 0.0% |
| Science & Technology | 39 | 9.5% |
| Business | 94 | 23.0% |
| Education | 57 | 13.9% |
| Literature & Languages | 13 | 3.2% |
| Liberal Arts & History | 39 | 9.5% |
| Visual & Performing Arts | 0 | 0.0% |
| Communications | 0 | 0.0% |
| Arts & Humanities | 35 | 8.6% |
| Total | 409 | 100.0% |
Transportation & Commute in Glade Spring
Vehicle Availability by Sex in Glade Spring
The most prevalent vehicle ownership categories in Glade Spring are males with 2 vehicles (184, accounting for 43.5%) and females with 2 vehicles (213, making up 46.4%).
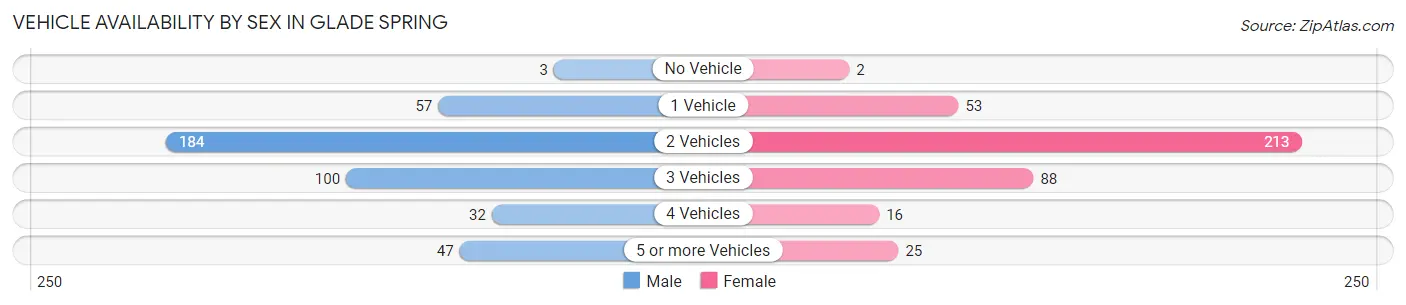
| Vehicles Available | Male | Female |
| No Vehicle | 3 (0.7%) | 2 (0.5%) |
| 1 Vehicle | 57 (13.5%) | 53 (13.4%) |
| 2 Vehicles | 184 (43.5%) | 213 (53.6%) |
| 3 Vehicles | 100 (23.6%) | 88 (22.2%) |
| 4 Vehicles | 32 (7.6%) | 16 (4.0%) |
| 5 or more Vehicles | 47 (11.1%) | 25 (6.3%) |
| Total | 423 (100.0%) | 397 (100.0%) |
Commute Time in Glade Spring
The most frequently occuring commute durations in Glade Spring are 20 to 24 minutes (205 commuters, 25.4%), 15 to 19 minutes (137 commuters, 17.0%), and 30 to 34 minutes (136 commuters, 16.8%).
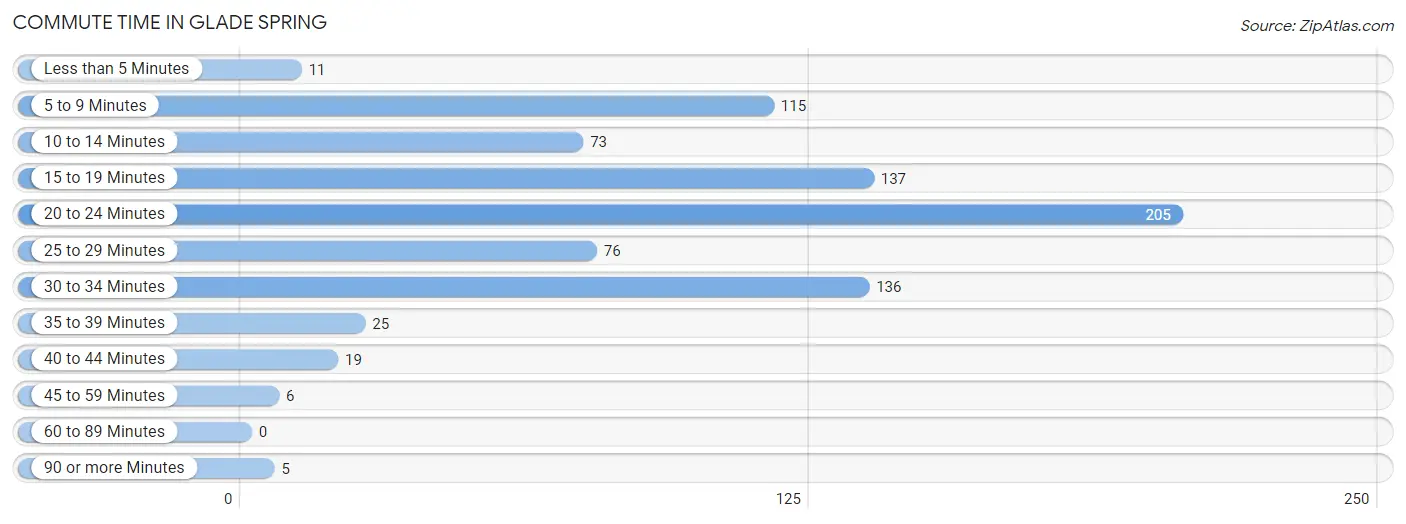
| Commute Time | # Commuters | % Commuters |
| Less than 5 Minutes | 11 | 1.4% |
| 5 to 9 Minutes | 115 | 14.2% |
| 10 to 14 Minutes | 73 | 9.0% |
| 15 to 19 Minutes | 137 | 17.0% |
| 20 to 24 Minutes | 205 | 25.4% |
| 25 to 29 Minutes | 76 | 9.4% |
| 30 to 34 Minutes | 136 | 16.8% |
| 35 to 39 Minutes | 25 | 3.1% |
| 40 to 44 Minutes | 19 | 2.4% |
| 45 to 59 Minutes | 6 | 0.7% |
| 60 to 89 Minutes | 0 | 0.0% |
| 90 or more Minutes | 5 | 0.6% |
Commute Time by Sex in Glade Spring
The most common commute times in Glade Spring are 5 to 9 minutes (93 commuters, 22.3%) for males and 20 to 24 minutes (132 commuters, 33.9%) for females.
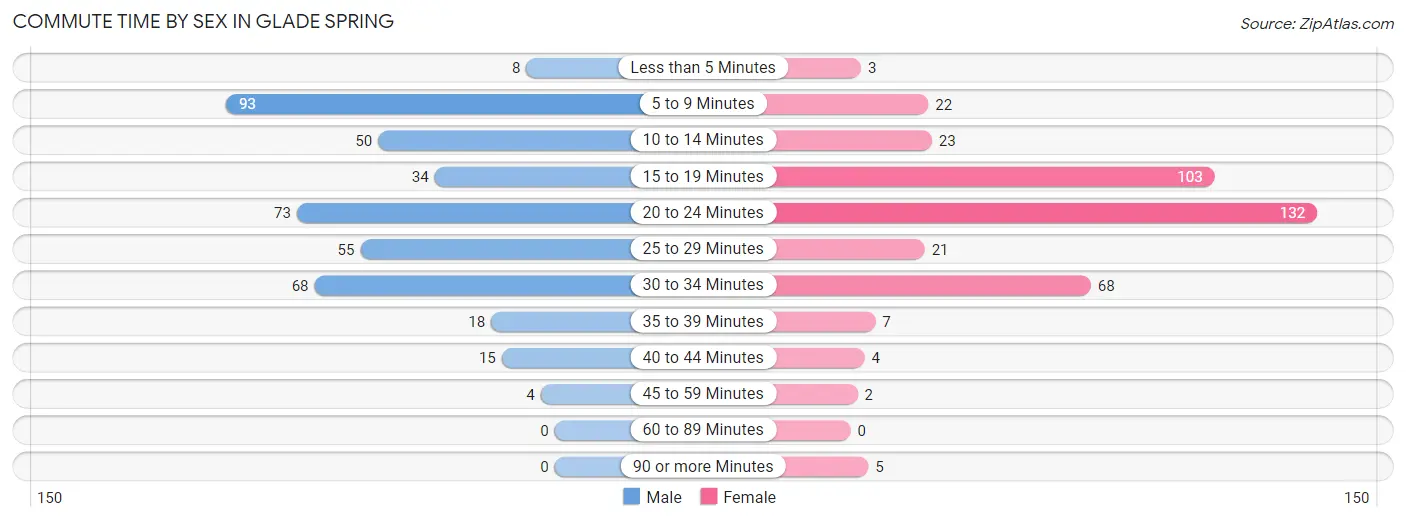
| Commute Time | Male | Female |
| Less than 5 Minutes | 8 (1.9%) | 3 (0.8%) |
| 5 to 9 Minutes | 93 (22.3%) | 22 (5.6%) |
| 10 to 14 Minutes | 50 (12.0%) | 23 (5.9%) |
| 15 to 19 Minutes | 34 (8.1%) | 103 (26.4%) |
| 20 to 24 Minutes | 73 (17.5%) | 132 (33.9%) |
| 25 to 29 Minutes | 55 (13.2%) | 21 (5.4%) |
| 30 to 34 Minutes | 68 (16.3%) | 68 (17.4%) |
| 35 to 39 Minutes | 18 (4.3%) | 7 (1.8%) |
| 40 to 44 Minutes | 15 (3.6%) | 4 (1.0%) |
| 45 to 59 Minutes | 4 (1.0%) | 2 (0.5%) |
| 60 to 89 Minutes | 0 (0.0%) | 0 (0.0%) |
| 90 or more Minutes | 0 (0.0%) | 5 (1.3%) |
Time of Departure to Work by Sex in Glade Spring
The most frequent times of departure to work in Glade Spring are 12:00 PM to 3:59 PM (111, 26.6%) for males and 7:00 AM to 7:29 AM (75, 19.2%) for females.
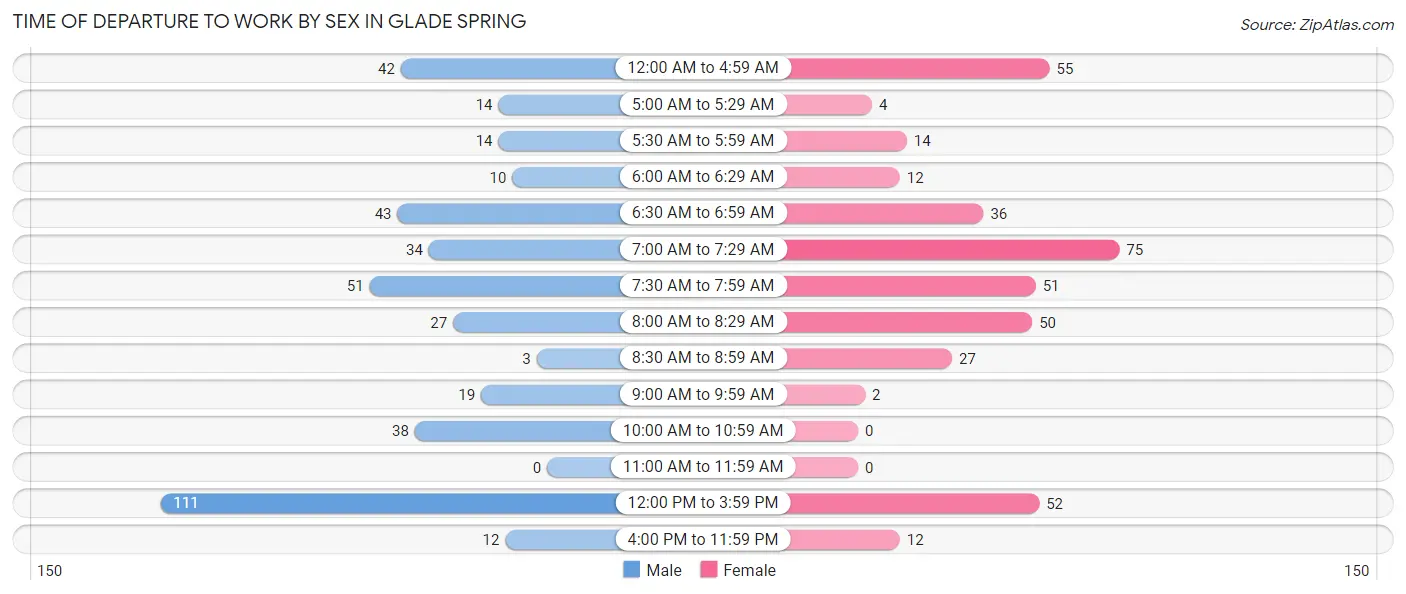
| Time of Departure | Male | Female |
| 12:00 AM to 4:59 AM | 42 (10.1%) | 55 (14.1%) |
| 5:00 AM to 5:29 AM | 14 (3.4%) | 4 (1.0%) |
| 5:30 AM to 5:59 AM | 14 (3.4%) | 14 (3.6%) |
| 6:00 AM to 6:29 AM | 10 (2.4%) | 12 (3.1%) |
| 6:30 AM to 6:59 AM | 43 (10.3%) | 36 (9.2%) |
| 7:00 AM to 7:29 AM | 34 (8.1%) | 75 (19.2%) |
| 7:30 AM to 7:59 AM | 51 (12.2%) | 51 (13.1%) |
| 8:00 AM to 8:29 AM | 27 (6.5%) | 50 (12.8%) |
| 8:30 AM to 8:59 AM | 3 (0.7%) | 27 (6.9%) |
| 9:00 AM to 9:59 AM | 19 (4.5%) | 2 (0.5%) |
| 10:00 AM to 10:59 AM | 38 (9.1%) | 0 (0.0%) |
| 11:00 AM to 11:59 AM | 0 (0.0%) | 0 (0.0%) |
| 12:00 PM to 3:59 PM | 111 (26.6%) | 52 (13.3%) |
| 4:00 PM to 11:59 PM | 12 (2.9%) | 12 (3.1%) |
| Total | 418 (100.0%) | 390 (100.0%) |
Housing Occupancy in Glade Spring
Occupancy by Ownership in Glade Spring
Of the total 654 dwellings in Glade Spring, owner-occupied units account for 536 (82.0%), while renter-occupied units make up 118 (18.0%).
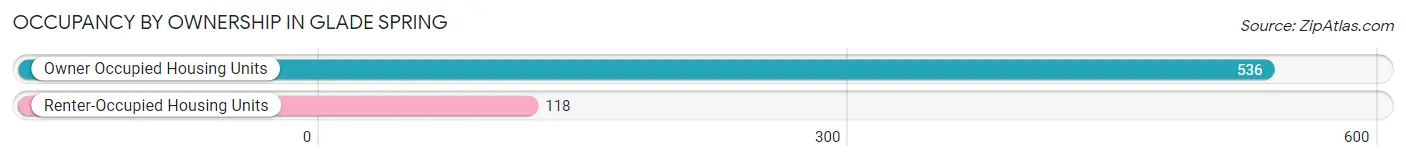
| Occupancy | # Housing Units | % Housing Units |
| Owner Occupied Housing Units | 536 | 82.0% |
| Renter-Occupied Housing Units | 118 | 18.0% |
| Total Occupied Housing Units | 654 | 100.0% |
Occupancy by Household Size in Glade Spring
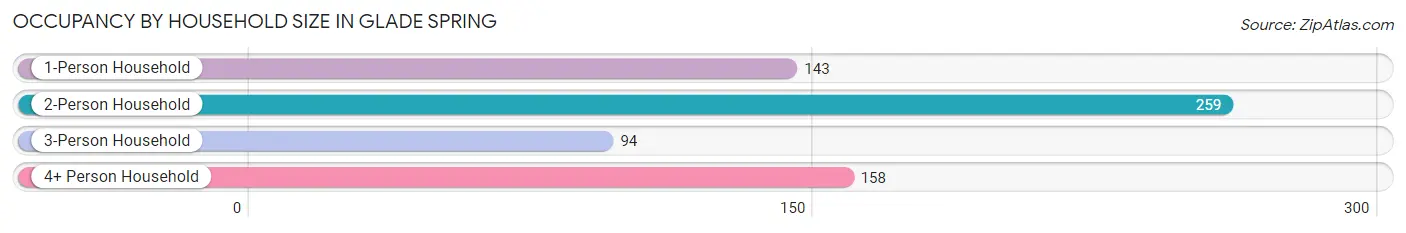
| Household Size | # Housing Units | % Housing Units |
| 1-Person Household | 143 | 21.9% |
| 2-Person Household | 259 | 39.6% |
| 3-Person Household | 94 | 14.4% |
| 4+ Person Household | 158 | 24.2% |
| Total Housing Units | 654 | 100.0% |
Occupancy by Ownership by Household Size in Glade Spring
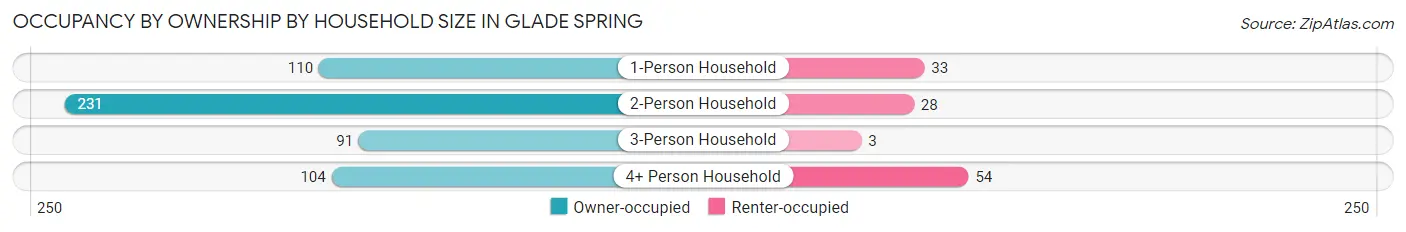
| Household Size | Owner-occupied | Renter-occupied |
| 1-Person Household | 110 (76.9%) | 33 (23.1%) |
| 2-Person Household | 231 (89.2%) | 28 (10.8%) |
| 3-Person Household | 91 (96.8%) | 3 (3.2%) |
| 4+ Person Household | 104 (65.8%) | 54 (34.2%) |
| Total Housing Units | 536 (82.0%) | 118 (18.0%) |
Occupancy by Educational Attainment in Glade Spring
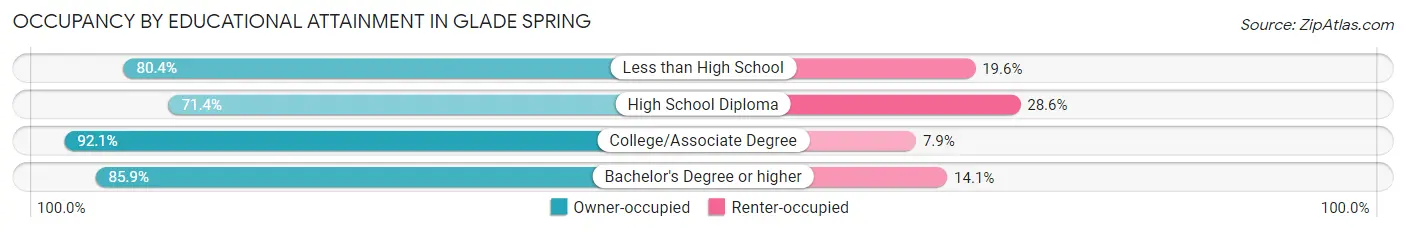
| Household Size | Owner-occupied | Renter-occupied |
| Less than High School | 90 (80.4%) | 22 (19.6%) |
| High School Diploma | 155 (71.4%) | 62 (28.6%) |
| College/Associate Degree | 175 (92.1%) | 15 (7.9%) |
| Bachelor's Degree or higher | 116 (85.9%) | 19 (14.1%) |
Occupancy by Age of Householder in Glade Spring
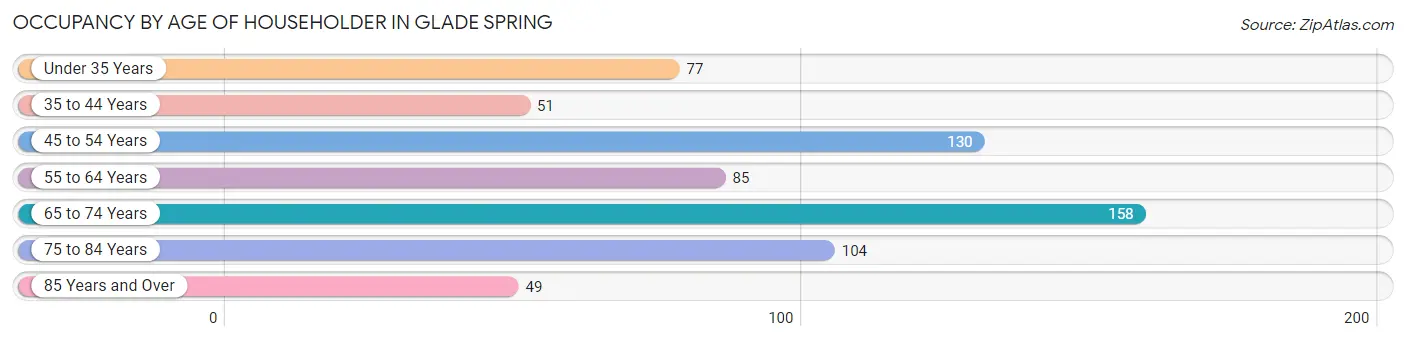
| Age Bracket | # Households | % Households |
| Under 35 Years | 77 | 11.8% |
| 35 to 44 Years | 51 | 7.8% |
| 45 to 54 Years | 130 | 19.9% |
| 55 to 64 Years | 85 | 13.0% |
| 65 to 74 Years | 158 | 24.2% |
| 75 to 84 Years | 104 | 15.9% |
| 85 Years and Over | 49 | 7.5% |
| Total | 654 | 100.0% |
Housing Finances in Glade Spring
Median Income by Occupancy in Glade Spring
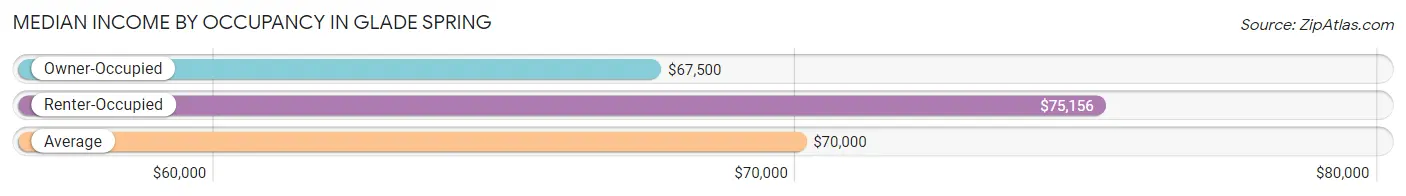
| Occupancy Type | # Households | Median Income |
| Owner-Occupied | 536 (82.0%) | $67,500 |
| Renter-Occupied | 118 (18.0%) | $75,156 |
| Average | 654 (100.0%) | $70,000 |
Occupancy by Householder Income Bracket in Glade Spring
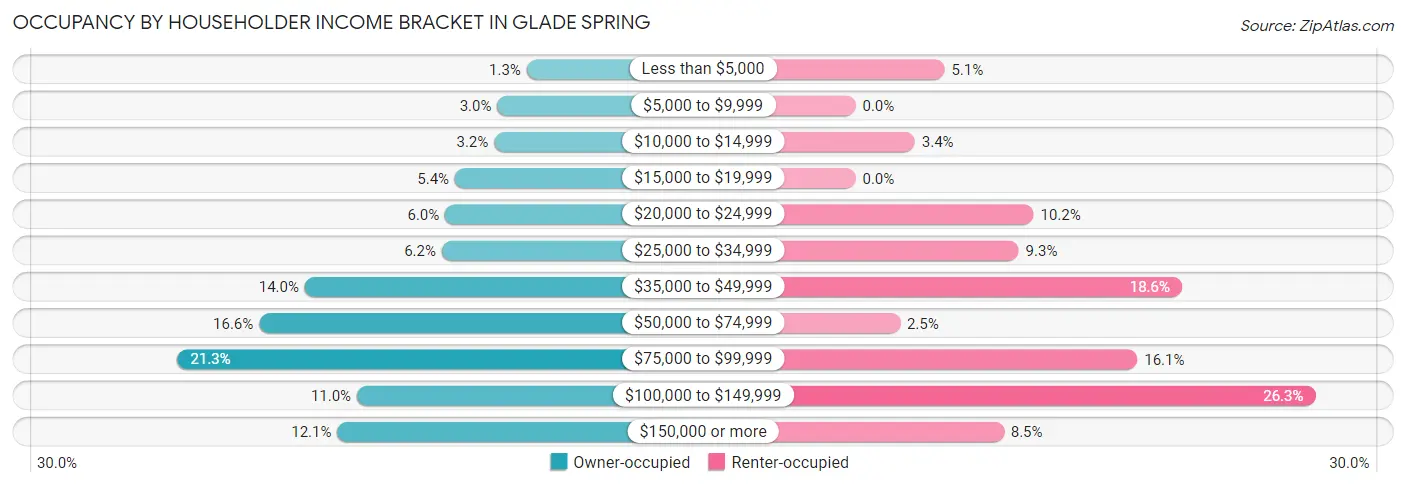
| Income Bracket | Owner-occupied | Renter-occupied |
| Less than $5,000 | 7 (1.3%) | 6 (5.1%) |
| $5,000 to $9,999 | 16 (3.0%) | 0 (0.0%) |
| $10,000 to $14,999 | 17 (3.2%) | 4 (3.4%) |
| $15,000 to $19,999 | 29 (5.4%) | 0 (0.0%) |
| $20,000 to $24,999 | 32 (6.0%) | 12 (10.2%) |
| $25,000 to $34,999 | 33 (6.2%) | 11 (9.3%) |
| $35,000 to $49,999 | 75 (14.0%) | 22 (18.6%) |
| $50,000 to $74,999 | 89 (16.6%) | 3 (2.5%) |
| $75,000 to $99,999 | 114 (21.3%) | 19 (16.1%) |
| $100,000 to $149,999 | 59 (11.0%) | 31 (26.3%) |
| $150,000 or more | 65 (12.1%) | 10 (8.5%) |
| Total | 536 (100.0%) | 118 (100.0%) |
Monthly Housing Cost Tiers in Glade Spring
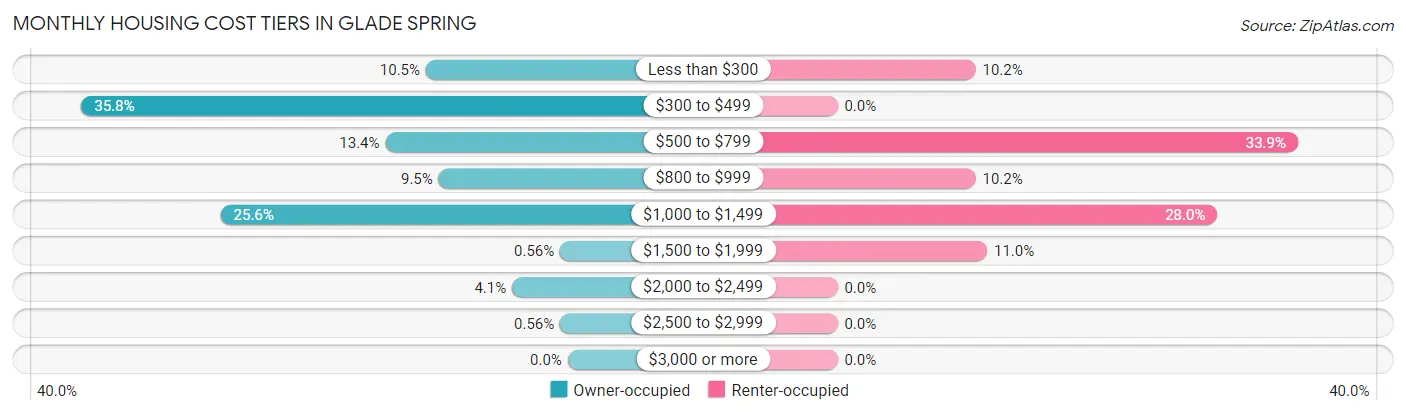
| Monthly Cost | Owner-occupied | Renter-occupied |
| Less than $300 | 56 (10.4%) | 12 (10.2%) |
| $300 to $499 | 192 (35.8%) | 0 (0.0%) |
| $500 to $799 | 72 (13.4%) | 40 (33.9%) |
| $800 to $999 | 51 (9.5%) | 12 (10.2%) |
| $1,000 to $1,499 | 137 (25.6%) | 33 (28.0%) |
| $1,500 to $1,999 | 3 (0.6%) | 13 (11.0%) |
| $2,000 to $2,499 | 22 (4.1%) | 0 (0.0%) |
| $2,500 to $2,999 | 3 (0.6%) | 0 (0.0%) |
| $3,000 or more | 0 (0.0%) | 0 (0.0%) |
| Total | 536 (100.0%) | 118 (100.0%) |
Physical Housing Characteristics in Glade Spring
Housing Structures in Glade Spring
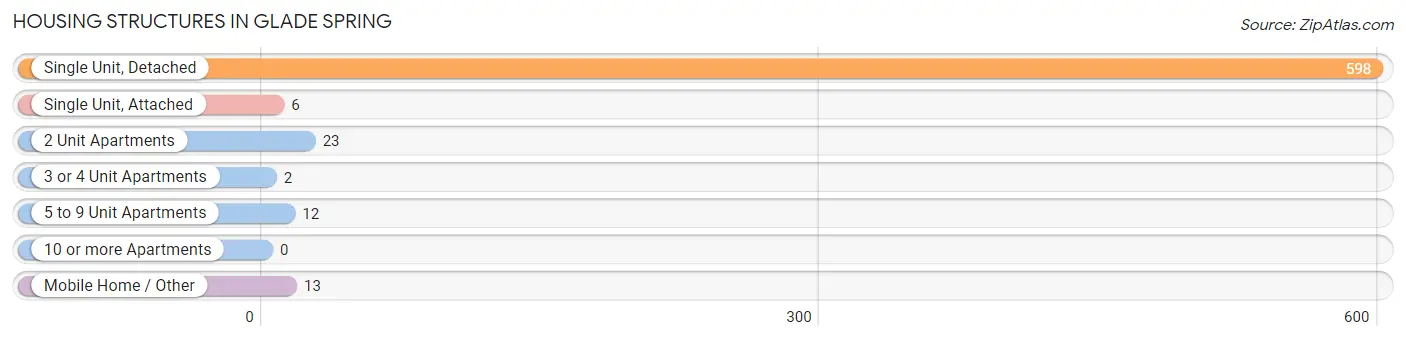
| Structure Type | # Housing Units | % Housing Units |
| Single Unit, Detached | 598 | 91.4% |
| Single Unit, Attached | 6 | 0.9% |
| 2 Unit Apartments | 23 | 3.5% |
| 3 or 4 Unit Apartments | 2 | 0.3% |
| 5 to 9 Unit Apartments | 12 | 1.8% |
| 10 or more Apartments | 0 | 0.0% |
| Mobile Home / Other | 13 | 2.0% |
| Total | 654 | 100.0% |
Housing Structures by Occupancy in Glade Spring
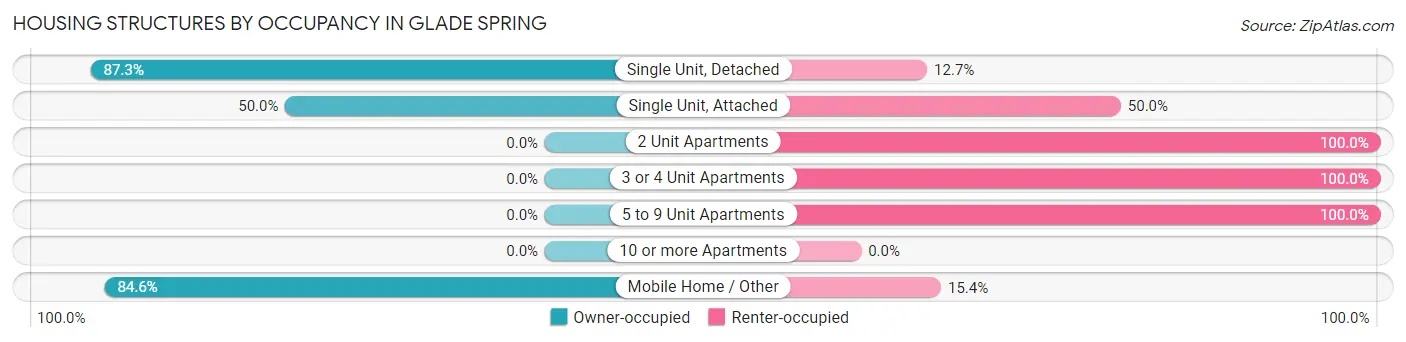
| Structure Type | Owner-occupied | Renter-occupied |
| Single Unit, Detached | 522 (87.3%) | 76 (12.7%) |
| Single Unit, Attached | 3 (50.0%) | 3 (50.0%) |
| 2 Unit Apartments | 0 (0.0%) | 23 (100.0%) |
| 3 or 4 Unit Apartments | 0 (0.0%) | 2 (100.0%) |
| 5 to 9 Unit Apartments | 0 (0.0%) | 12 (100.0%) |
| 10 or more Apartments | 0 (0.0%) | 0 (0.0%) |
| Mobile Home / Other | 11 (84.6%) | 2 (15.4%) |
| Total | 536 (82.0%) | 118 (18.0%) |
Housing Structures by Number of Rooms in Glade Spring
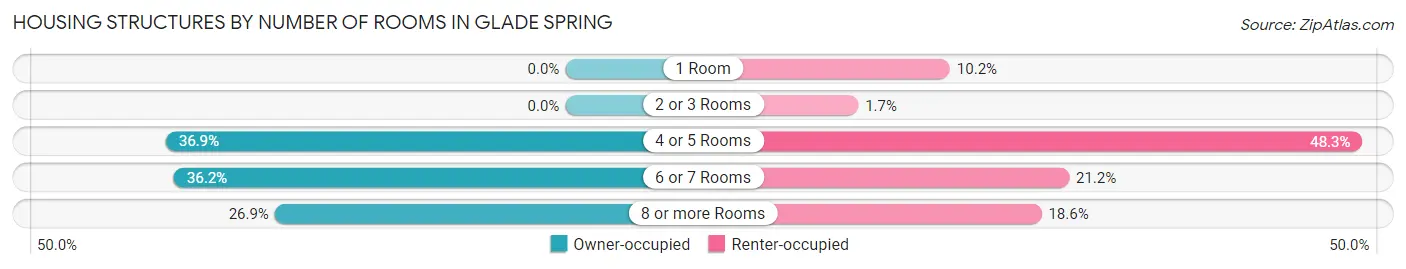
| Number of Rooms | Owner-occupied | Renter-occupied |
| 1 Room | 0 (0.0%) | 12 (10.2%) |
| 2 or 3 Rooms | 0 (0.0%) | 2 (1.7%) |
| 4 or 5 Rooms | 198 (36.9%) | 57 (48.3%) |
| 6 or 7 Rooms | 194 (36.2%) | 25 (21.2%) |
| 8 or more Rooms | 144 (26.9%) | 22 (18.6%) |
| Total | 536 (100.0%) | 118 (100.0%) |
Housing Structure by Heating Type in Glade Spring
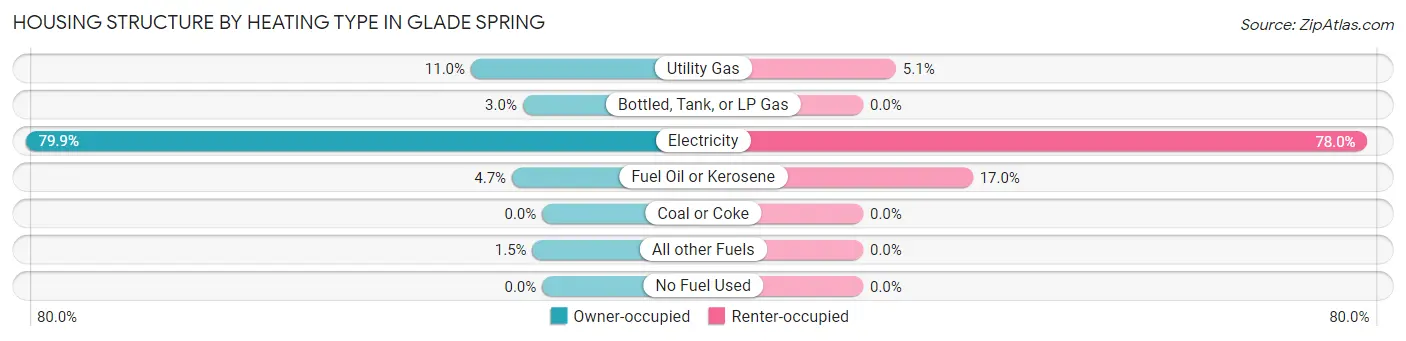
| Heating Type | Owner-occupied | Renter-occupied |
| Utility Gas | 59 (11.0%) | 6 (5.1%) |
| Bottled, Tank, or LP Gas | 16 (3.0%) | 0 (0.0%) |
| Electricity | 428 (79.8%) | 92 (78.0%) |
| Fuel Oil or Kerosene | 25 (4.7%) | 20 (17.0%) |
| Coal or Coke | 0 (0.0%) | 0 (0.0%) |
| All other Fuels | 8 (1.5%) | 0 (0.0%) |
| No Fuel Used | 0 (0.0%) | 0 (0.0%) |
| Total | 536 (100.0%) | 118 (100.0%) |
Household Vehicle Usage in Glade Spring
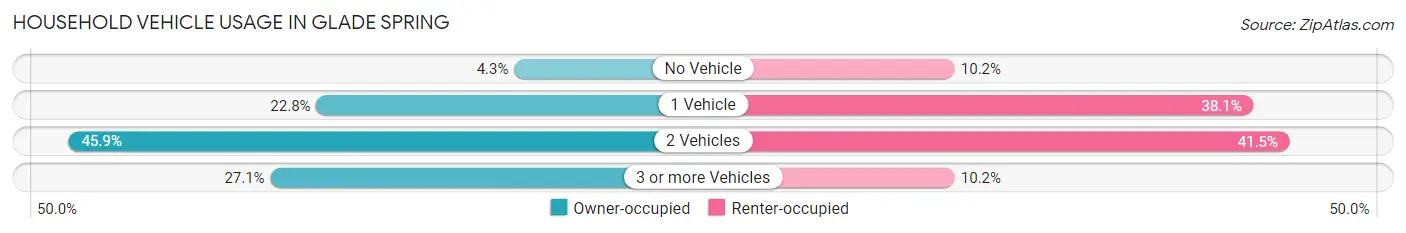
| Vehicles per Household | Owner-occupied | Renter-occupied |
| No Vehicle | 23 (4.3%) | 12 (10.2%) |
| 1 Vehicle | 122 (22.8%) | 45 (38.1%) |
| 2 Vehicles | 246 (45.9%) | 49 (41.5%) |
| 3 or more Vehicles | 145 (27.1%) | 12 (10.2%) |
| Total | 536 (100.0%) | 118 (100.0%) |
Real Estate & Mortgages in Glade Spring
Real Estate and Mortgage Overview in Glade Spring
| Characteristic | Without Mortgage | With Mortgage |
| Housing Units | 314 | 222 |
| Median Property Value | $162,000 | $162,500 |
| Median Household Income | $52,143 | $49 |
| Monthly Housing Costs | $396 | $0 |
| Real Estate Taxes | $942 | $0 |
Property Value by Mortgage Status in Glade Spring
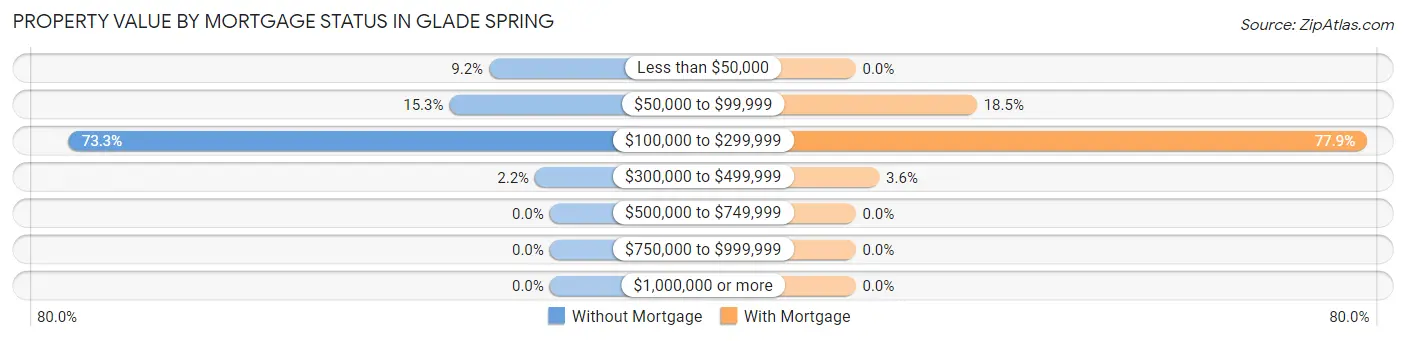
| Property Value | Without Mortgage | With Mortgage |
| Less than $50,000 | 29 (9.2%) | 0 (0.0%) |
| $50,000 to $99,999 | 48 (15.3%) | 41 (18.5%) |
| $100,000 to $299,999 | 230 (73.3%) | 173 (77.9%) |
| $300,000 to $499,999 | 7 (2.2%) | 8 (3.6%) |
| $500,000 to $749,999 | 0 (0.0%) | 0 (0.0%) |
| $750,000 to $999,999 | 0 (0.0%) | 0 (0.0%) |
| $1,000,000 or more | 0 (0.0%) | 0 (0.0%) |
| Total | 314 (100.0%) | 222 (100.0%) |
Household Income by Mortgage Status in Glade Spring
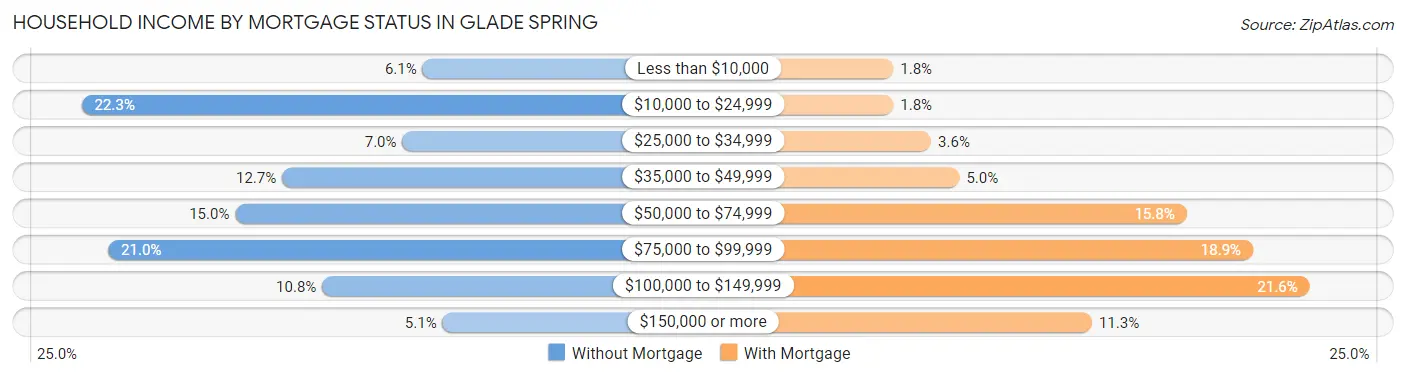
| Household Income | Without Mortgage | With Mortgage |
| Less than $10,000 | 19 (6.0%) | 4 (1.8%) |
| $10,000 to $24,999 | 70 (22.3%) | 4 (1.8%) |
| $25,000 to $34,999 | 22 (7.0%) | 8 (3.6%) |
| $35,000 to $49,999 | 40 (12.7%) | 11 (5.0%) |
| $50,000 to $74,999 | 47 (15.0%) | 35 (15.8%) |
| $75,000 to $99,999 | 66 (21.0%) | 42 (18.9%) |
| $100,000 to $149,999 | 34 (10.8%) | 48 (21.6%) |
| $150,000 or more | 16 (5.1%) | 25 (11.3%) |
| Total | 314 (100.0%) | 222 (100.0%) |
Property Value to Household Income Ratio in Glade Spring
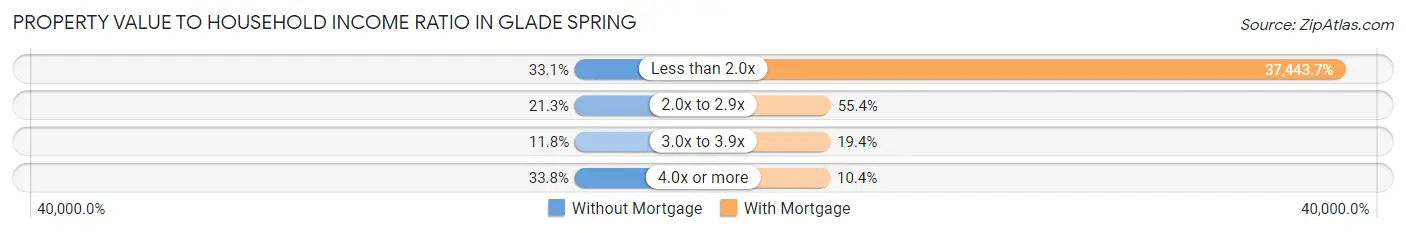
| Value-to-Income Ratio | Without Mortgage | With Mortgage |
| Less than 2.0x | 104 (33.1%) | 83,125 (37,443.7%) |
| 2.0x to 2.9x | 67 (21.3%) | 123 (55.4%) |
| 3.0x to 3.9x | 37 (11.8%) | 43 (19.4%) |
| 4.0x or more | 106 (33.8%) | 23 (10.4%) |
| Total | 314 (100.0%) | 222 (100.0%) |
Real Estate Taxes by Mortgage Status in Glade Spring
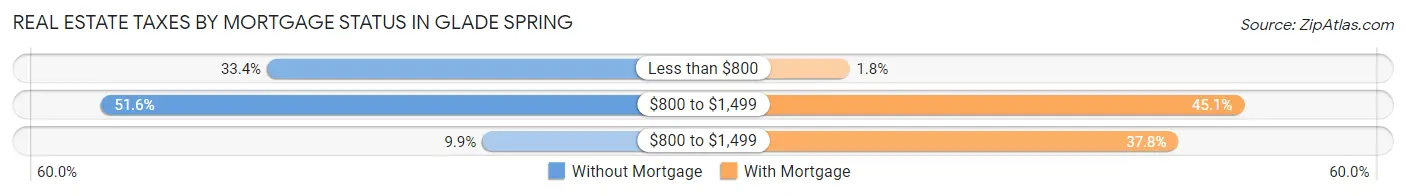
| Property Taxes | Without Mortgage | With Mortgage |
| Less than $800 | 105 (33.4%) | 4 (1.8%) |
| $800 to $1,499 | 162 (51.6%) | 100 (45.1%) |
| $800 to $1,499 | 31 (9.9%) | 84 (37.8%) |
| Total | 314 (100.0%) | 222 (100.0%) |
Health & Disability in Glade Spring
Health Insurance Coverage by Age in Glade Spring
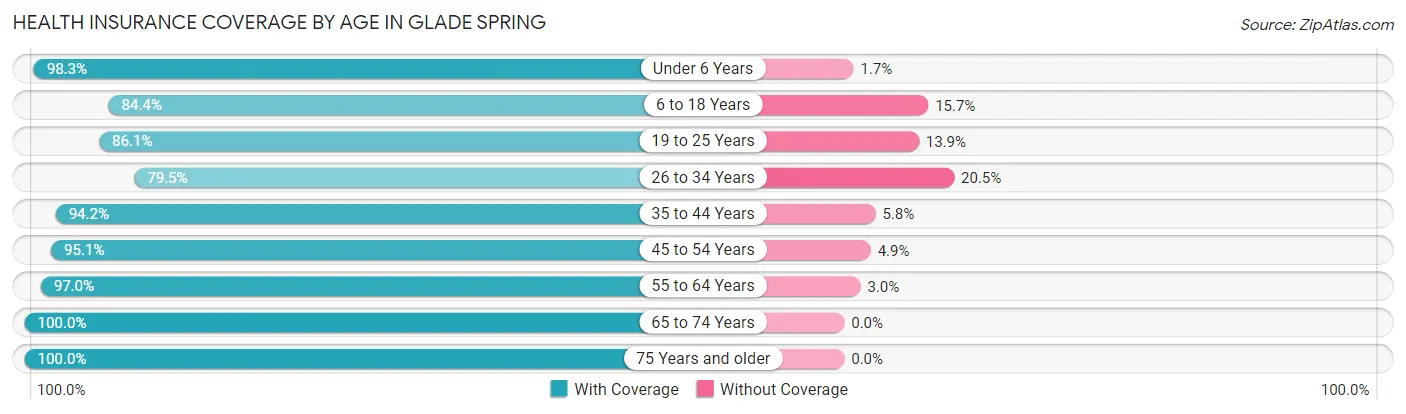
| Age Bracket | With Coverage | Without Coverage |
| Under 6 Years | 343 (98.3%) | 6 (1.7%) |
| 6 to 18 Years | 345 (84.4%) | 64 (15.7%) |
| 19 to 25 Years | 124 (86.1%) | 20 (13.9%) |
| 26 to 34 Years | 167 (79.5%) | 43 (20.5%) |
| 35 to 44 Years | 146 (94.2%) | 9 (5.8%) |
| 45 to 54 Years | 289 (95.1%) | 15 (4.9%) |
| 55 to 64 Years | 224 (97.0%) | 7 (3.0%) |
| 65 to 74 Years | 252 (100.0%) | 0 (0.0%) |
| 75 Years and older | 195 (100.0%) | 0 (0.0%) |
| Total | 2,085 (92.7%) | 164 (7.3%) |
Health Insurance Coverage by Citizenship Status in Glade Spring
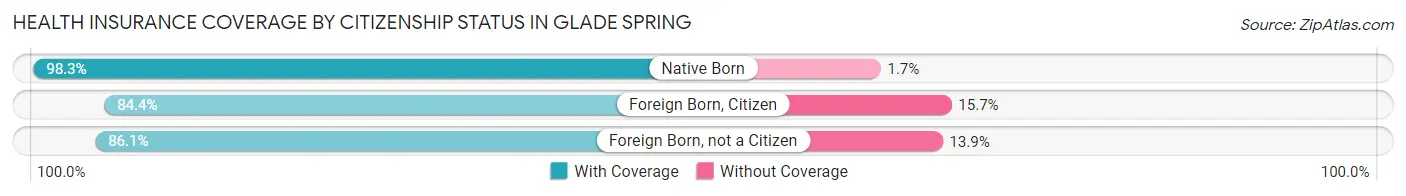
| Citizenship Status | With Coverage | Without Coverage |
| Native Born | 343 (98.3%) | 6 (1.7%) |
| Foreign Born, Citizen | 345 (84.4%) | 64 (15.7%) |
| Foreign Born, not a Citizen | 124 (86.1%) | 20 (13.9%) |
Health Insurance Coverage by Household Income in Glade Spring
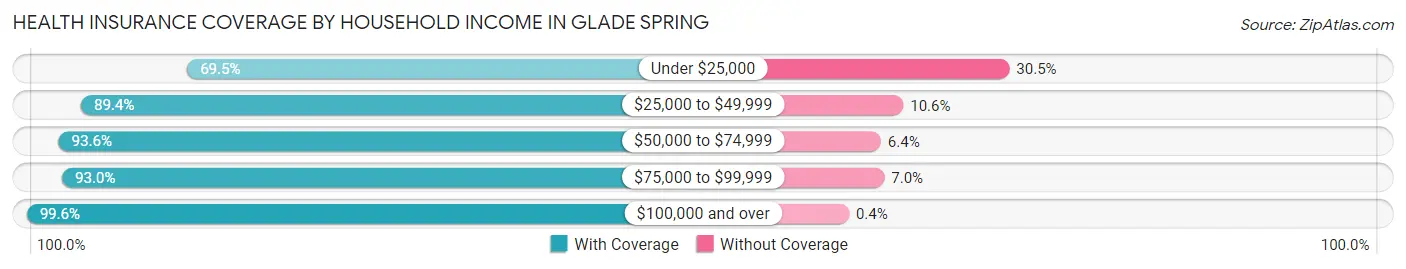
| Household Income | With Coverage | Without Coverage |
| Under $25,000 | 178 (69.5%) | 78 (30.5%) |
| $25,000 to $49,999 | 321 (89.4%) | 38 (10.6%) |
| $50,000 to $74,999 | 205 (93.6%) | 14 (6.4%) |
| $75,000 to $99,999 | 397 (93.0%) | 30 (7.0%) |
| $100,000 and over | 984 (99.6%) | 4 (0.4%) |
Public vs Private Health Insurance Coverage by Age in Glade Spring
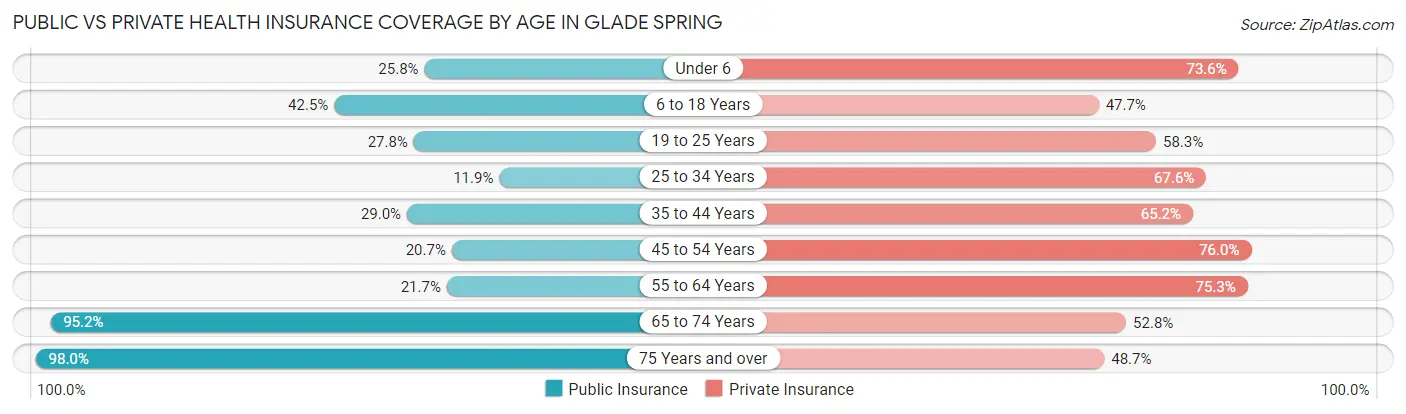
| Age Bracket | Public Insurance | Private Insurance |
| Under 6 | 90 (25.8%) | 257 (73.6%) |
| 6 to 18 Years | 174 (42.5%) | 195 (47.7%) |
| 19 to 25 Years | 40 (27.8%) | 84 (58.3%) |
| 25 to 34 Years | 25 (11.9%) | 142 (67.6%) |
| 35 to 44 Years | 45 (29.0%) | 101 (65.2%) |
| 45 to 54 Years | 63 (20.7%) | 231 (76.0%) |
| 55 to 64 Years | 50 (21.6%) | 174 (75.3%) |
| 65 to 74 Years | 240 (95.2%) | 133 (52.8%) |
| 75 Years and over | 191 (98.0%) | 95 (48.7%) |
| Total | 918 (40.8%) | 1,412 (62.8%) |
Disability Status by Sex by Age in Glade Spring
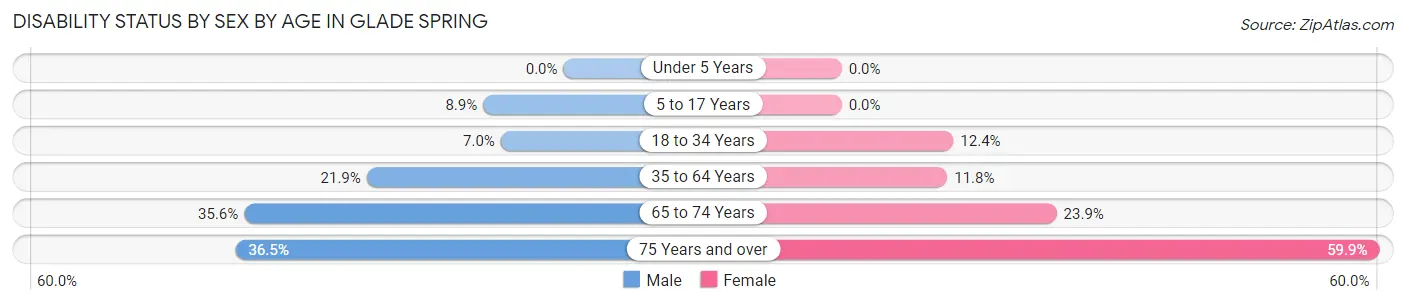
| Age Bracket | Male | Female |
| Under 5 Years | 0 (0.0%) | 0 (0.0%) |
| 5 to 17 Years | 16 (8.9%) | 0 (0.0%) |
| 18 to 34 Years | 15 (7.0%) | 21 (12.4%) |
| 35 to 64 Years | 71 (21.9%) | 43 (11.7%) |
| 65 to 74 Years | 48 (35.6%) | 28 (23.9%) |
| 75 Years and over | 23 (36.5%) | 79 (59.9%) |
Disability Class by Sex by Age in Glade Spring
Disability Class: Hearing Difficulty
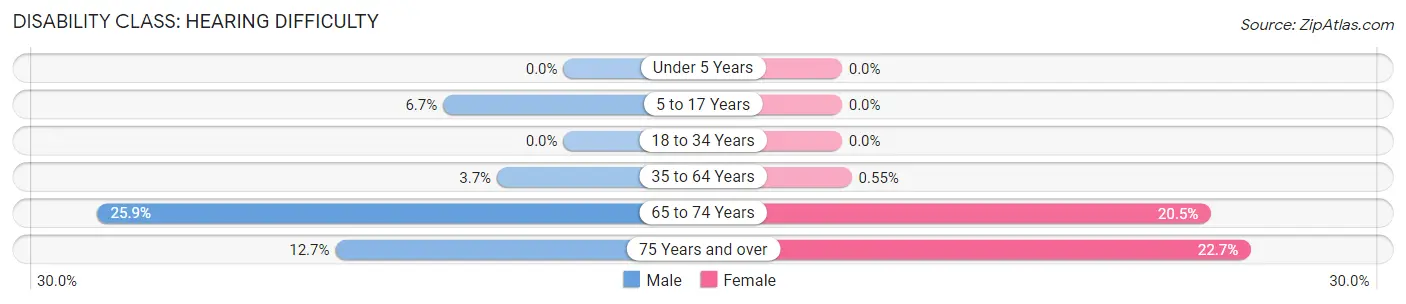
| Age Bracket | Male | Female |
| Under 5 Years | 0 (0.0%) | 0 (0.0%) |
| 5 to 17 Years | 12 (6.7%) | 0 (0.0%) |
| 18 to 34 Years | 0 (0.0%) | 0 (0.0%) |
| 35 to 64 Years | 12 (3.7%) | 2 (0.5%) |
| 65 to 74 Years | 35 (25.9%) | 24 (20.5%) |
| 75 Years and over | 8 (12.7%) | 30 (22.7%) |
Disability Class: Vision Difficulty
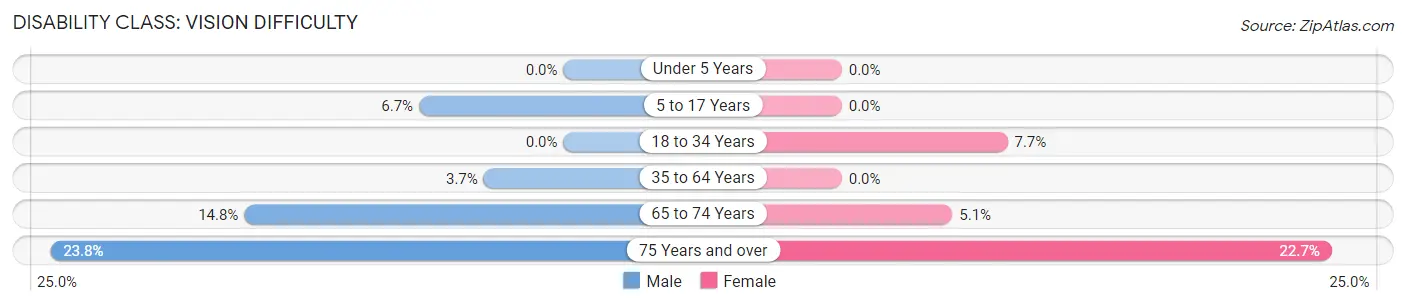
| Age Bracket | Male | Female |
| Under 5 Years | 0 (0.0%) | 0 (0.0%) |
| 5 to 17 Years | 12 (6.7%) | 0 (0.0%) |
| 18 to 34 Years | 0 (0.0%) | 13 (7.7%) |
| 35 to 64 Years | 12 (3.7%) | 0 (0.0%) |
| 65 to 74 Years | 20 (14.8%) | 6 (5.1%) |
| 75 Years and over | 15 (23.8%) | 30 (22.7%) |
Disability Class: Cognitive Difficulty
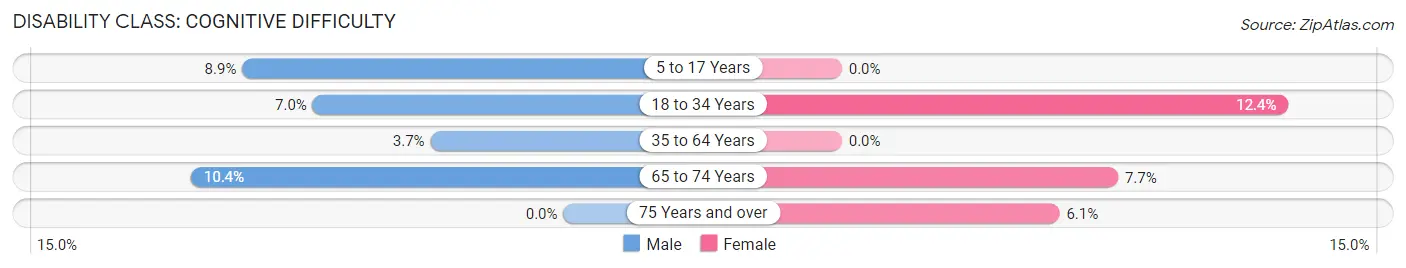
| Age Bracket | Male | Female |
| 5 to 17 Years | 16 (8.9%) | 0 (0.0%) |
| 18 to 34 Years | 15 (7.0%) | 21 (12.4%) |
| 35 to 64 Years | 12 (3.7%) | 0 (0.0%) |
| 65 to 74 Years | 14 (10.4%) | 9 (7.7%) |
| 75 Years and over | 0 (0.0%) | 8 (6.1%) |
Disability Class: Ambulatory Difficulty
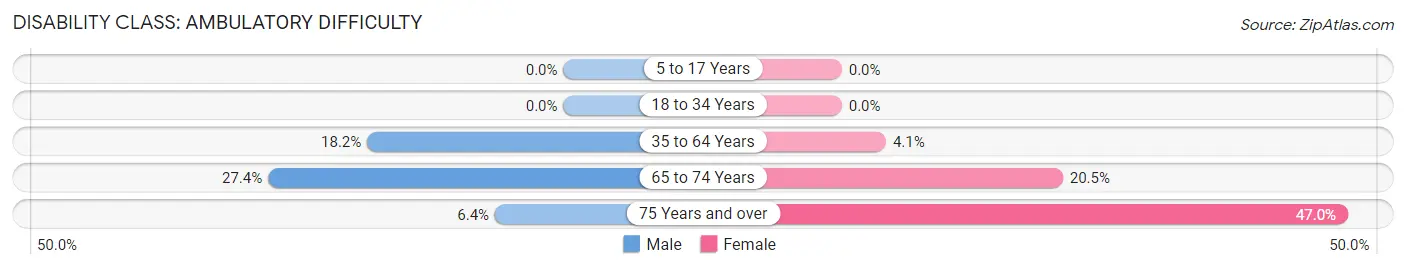
| Age Bracket | Male | Female |
| 5 to 17 Years | 0 (0.0%) | 0 (0.0%) |
| 18 to 34 Years | 0 (0.0%) | 0 (0.0%) |
| 35 to 64 Years | 59 (18.2%) | 15 (4.1%) |
| 65 to 74 Years | 37 (27.4%) | 24 (20.5%) |
| 75 Years and over | 4 (6.4%) | 62 (47.0%) |
Disability Class: Self-Care Difficulty
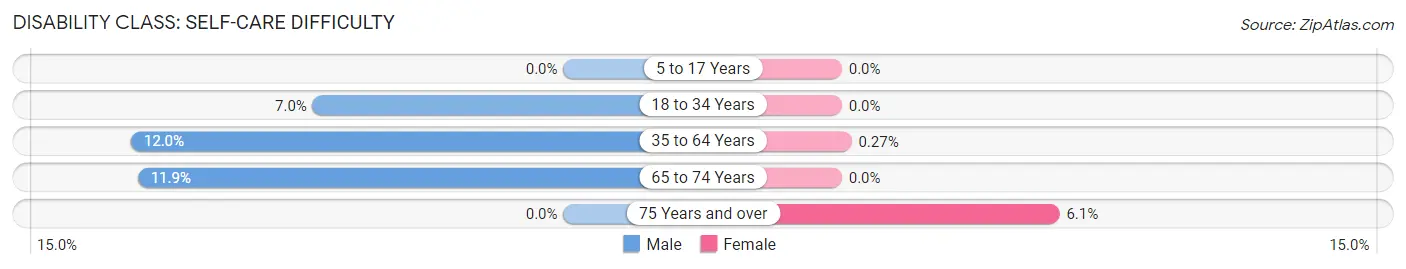
| Age Bracket | Male | Female |
| 5 to 17 Years | 0 (0.0%) | 0 (0.0%) |
| 18 to 34 Years | 15 (7.0%) | 0 (0.0%) |
| 35 to 64 Years | 39 (12.0%) | 1 (0.3%) |
| 65 to 74 Years | 16 (11.8%) | 0 (0.0%) |
| 75 Years and over | 0 (0.0%) | 8 (6.1%) |
Technology Access in Glade Spring
Computing Device Access in Glade Spring
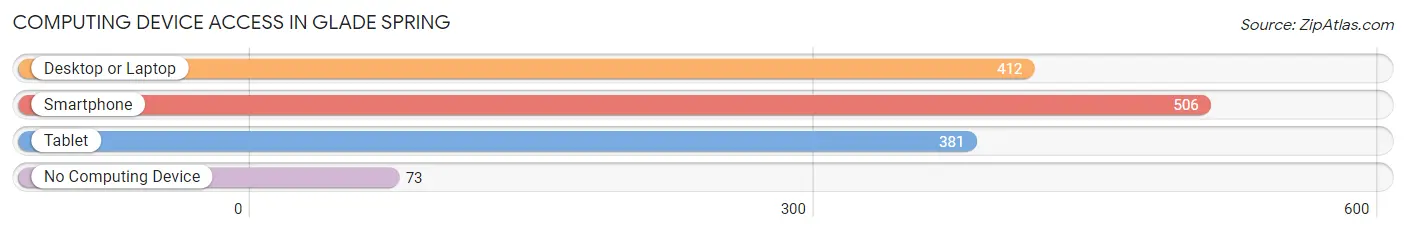
| Device Type | # Households | % Households |
| Desktop or Laptop | 412 | 63.0% |
| Smartphone | 506 | 77.4% |
| Tablet | 381 | 58.3% |
| No Computing Device | 73 | 11.2% |
| Total | 654 | 100.0% |
Internet Access in Glade Spring
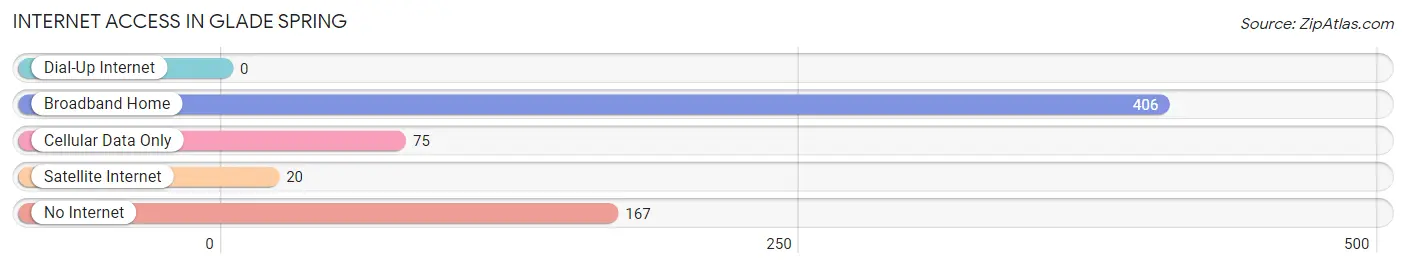
| Internet Type | # Households | % Households |
| Dial-Up Internet | 0 | 0.0% |
| Broadband Home | 406 | 62.1% |
| Cellular Data Only | 75 | 11.5% |
| Satellite Internet | 20 | 3.1% |
| No Internet | 167 | 25.5% |
| Total | 654 | 100.0% |
Glade Spring Summary
Glade Spring is a small town located in Washington County, Virginia. It is situated in the Appalachian Mountains, and is part of the Appalachian Plateau. The town is located in the southwestern corner of the state, and is bordered by the towns of Abingdon, Damascus, and Meadowview. The population of Glade Spring was 1,717 at the 2010 census.
Geography
Glade Spring is located at 36°45'45" North, 81°45'45" West (36.7625, -81.7625). The town is situated in the Appalachian Mountains, and is part of the Appalachian Plateau. The town is located in the southwestern corner of the state, and is bordered by the towns of Abingdon, Damascus, and Meadowview. The town is located in the valley of the North Fork of the Holston River. The town is located at an elevation of 1,845 feet (562 m).
The town is located in a temperate climate, with four distinct seasons. Summers are hot and humid, with temperatures reaching into the 90s (Fahrenheit). Winters are cold, with temperatures dropping into the teens (Fahrenheit). The average annual precipitation is 43.5 inches (110 cm).
History
Glade Spring was first settled in 1772 by a group of settlers from Pennsylvania. The town was originally known as Gladeville, and was later renamed Glade Spring. The town was incorporated in 1832.
The town was an important stop on the stagecoach route between Abingdon and Damascus. The town was also an important stop on the Virginia and Tennessee Railroad, which ran from Abingdon to Bristol. The railroad was completed in 1856, and was an important factor in the growth of the town.
The town was also an important stop on the Virginia Creeper Trail, a popular hiking and biking trail. The trail was completed in 1977, and has become a popular tourist attraction.
Economy
The economy of Glade Spring is largely based on agriculture and tourism. The town is home to several farms, which produce a variety of crops, including corn, soybeans, wheat, and hay. The town is also home to several wineries, which produce a variety of wines.
The town is also home to several tourist attractions, including the Virginia Creeper Trail, the Glade Spring Historic District, and the Glade Spring Museum. The town is also home to several restaurants, shops, and other businesses.
Demographics
As of the 2010 census, the population of Glade Spring was 1,717. The racial makeup of the town was 95.3% White, 1.2% African American, 0.3% Native American, 0.3% Asian, 0.1% Pacific Islander, 0.7% from other races, and 2.1% from two or more races. Hispanic or Latino of any race were 1.7% of the population.
The median household income in Glade Spring was $35,938, and the median family income was $41,250. The per capita income for the town was $17,845. About 15.3% of the population was below the poverty line.
Common Questions
What is Per Capita Income in Glade Spring?
Per Capita income in Glade Spring is $23,995.
What is the Median Family Income in Glade Spring?
Median Family Income in Glade Spring is $78,125.
What is the Median Household income in Glade Spring?
Median Household Income in Glade Spring is $70,000.
What is Income or Wage Gap in Glade Spring?
Income or Wage Gap in Glade Spring is 1.1%.
Women in Glade Spring earn 98.9 cents for every dollar earned by a man.
What is Inequality or Gini Index in Glade Spring?
Inequality or Gini Index in Glade Spring is 0.38.
What is the Total Population of Glade Spring?
Total Population of Glade Spring is 2,249.
What is the Total Male Population of Glade Spring?
Total Male Population of Glade Spring is 956.
What is the Total Female Population of Glade Spring?
Total Female Population of Glade Spring is 1,293.
What is the Ratio of Males per 100 Females in Glade Spring?
There are 73.94 Males per 100 Females in Glade Spring.
What is the Ratio of Females per 100 Males in Glade Spring?
There are 135.25 Females per 100 Males in Glade Spring.
What is the Median Population Age in Glade Spring?
Median Population Age in Glade Spring is 35.7 Years.
What is the Average Family Size in Glade Spring
Average Family Size in Glade Spring is 4.1 People.
What is the Average Household Size in Glade Spring
Average Household Size in Glade Spring is 3.4 People.
How Large is the Labor Force in Glade Spring?
There are 867 People in the Labor Forcein in Glade Spring.
What is the Percentage of People in the Labor Force in Glade Spring?
55.6% of People are in the Labor Force in Glade Spring.
What is the Unemployment Rate in Glade Spring?
Unemployment Rate in Glade Spring is 2.4%.