Centreville, VA Map & Demographics
Centreville Map
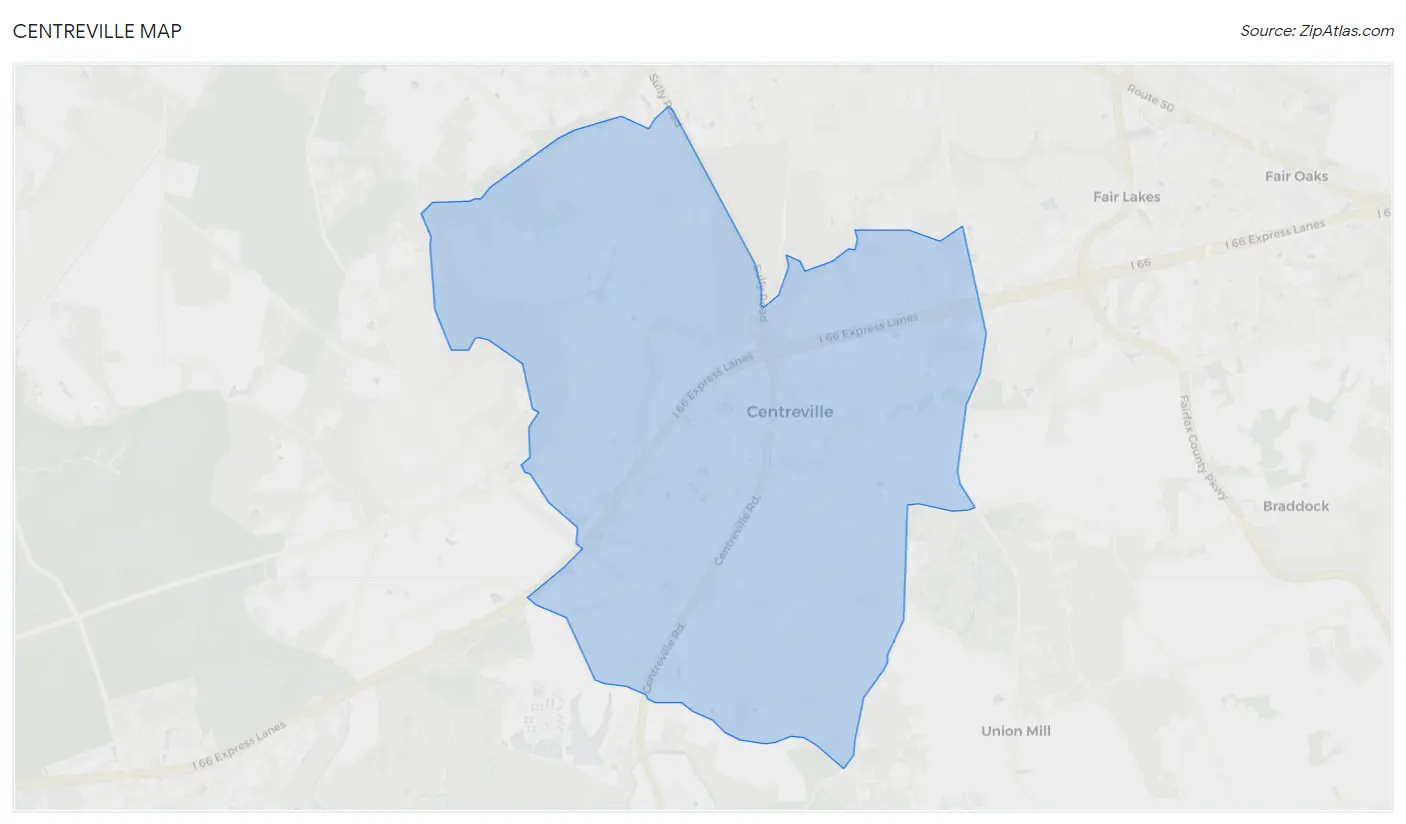
Centreville Overview
$56,834
PER CAPITA INCOME
$152,885
AVG FAMILY INCOME
$136,679
AVG HOUSEHOLD INCOME
22.1%
WAGE / INCOME GAP [ % ]
77.9¢/ $1
WAGE / INCOME GAP [ $ ]
$11,680
FAMILY INCOME DEFICIT
0.38
INEQUALITY / GINI INDEX
72,680
TOTAL POPULATION
36,612
MALE POPULATION
36,068
FEMALE POPULATION
101.51
MALES / 100 FEMALES
98.51
FEMALES / 100 MALES
37.3
MEDIAN AGE
3.4
AVG FAMILY SIZE
2.9
AVG HOUSEHOLD SIZE
43,613
LABOR FORCE [ PEOPLE ]
75.5%
PERCENT IN LABOR FORCE
4.4%
UNEMPLOYMENT RATE
Income in Centreville
Income Overview in Centreville
Per Capita Income in Centreville is $56,834, while median incomes of families and households are $152,885 and $136,679 respectively.
| Characteristic | Number | Measure |
| Per Capita Income | 72,680 | $56,834 |
| Median Family Income | 18,810 | $152,885 |
| Mean Family Income | 18,810 | $176,373 |
| Median Household Income | 24,950 | $136,679 |
| Mean Household Income | 24,950 | $161,665 |
| Income Deficit | 18,810 | $11,680 |
| Wage / Income Gap (%) | 72,680 | 22.07% |
| Wage / Income Gap ($) | 72,680 | 77.93¢ per $1 |
| Gini / Inequality Index | 72,680 | 0.38 |
Earnings by Sex in Centreville
Average Earnings in Centreville are $64,240, $72,458 for men and $56,469 for women, a difference of 22.1%.
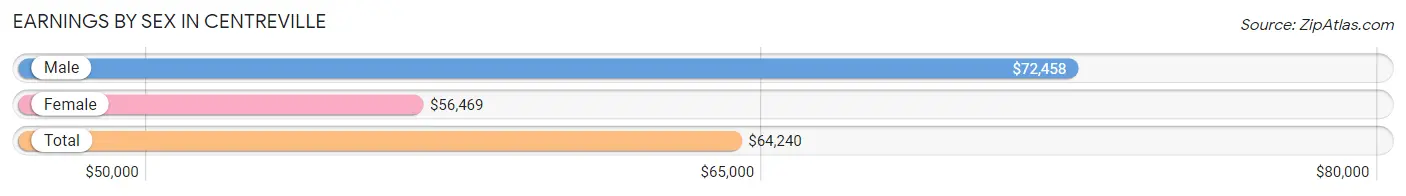
| Sex | Number | Average Earnings |
| Male | 23,990 (53.7%) | $72,458 |
| Female | 20,684 (46.3%) | $56,469 |
| Total | 44,674 (100.0%) | $64,240 |
Earnings by Sex by Income Bracket in Centreville
The most common earnings brackets in Centreville are $100,000+ for men (8,665 | 36.1%) and $100,000+ for women (4,676 | 22.6%).
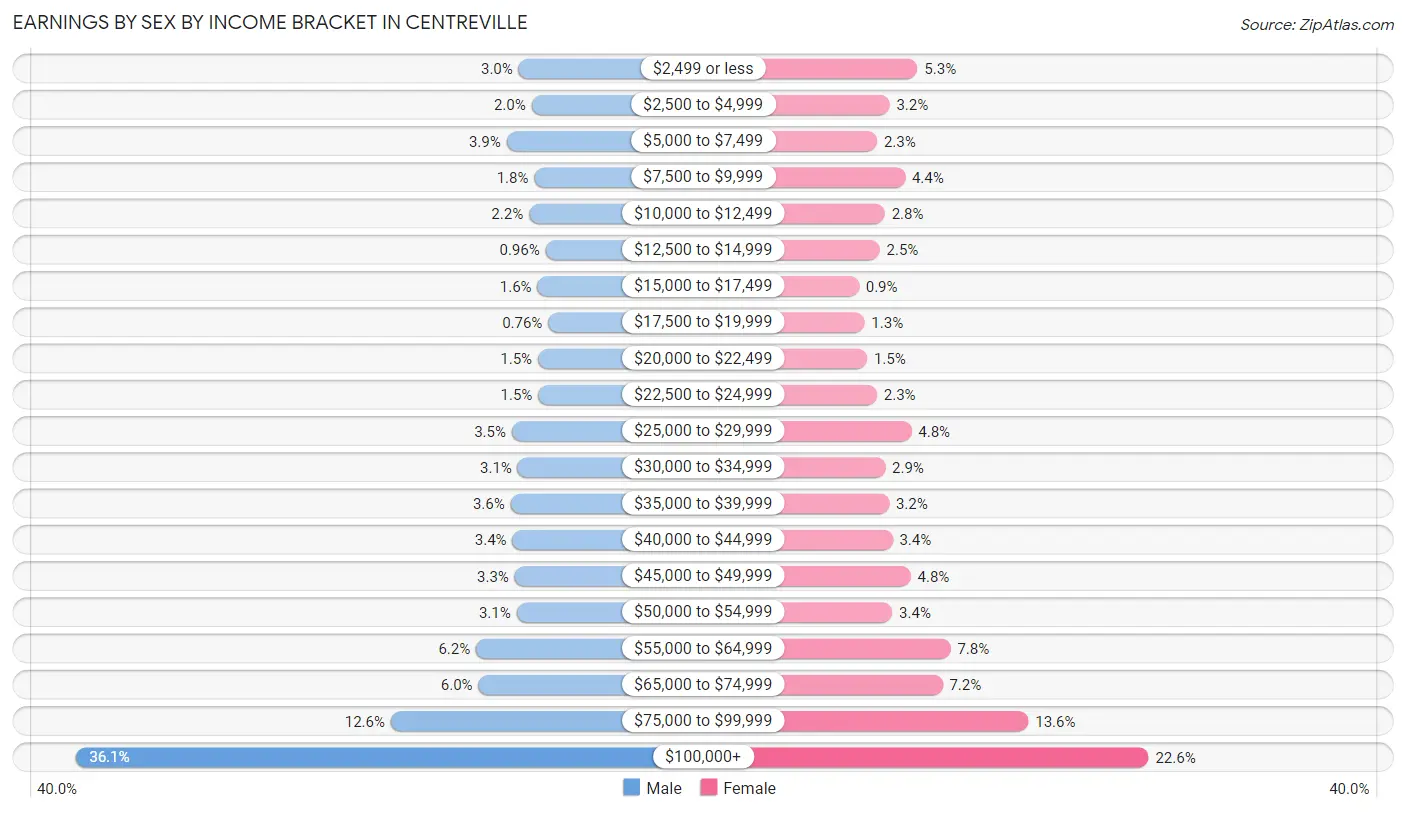
| Income | Male | Female |
| $2,499 or less | 715 (3.0%) | 1,095 (5.3%) |
| $2,500 to $4,999 | 481 (2.0%) | 661 (3.2%) |
| $5,000 to $7,499 | 932 (3.9%) | 467 (2.3%) |
| $7,500 to $9,999 | 433 (1.8%) | 902 (4.4%) |
| $10,000 to $12,499 | 527 (2.2%) | 587 (2.8%) |
| $12,500 to $14,999 | 231 (1.0%) | 509 (2.5%) |
| $15,000 to $17,499 | 376 (1.6%) | 186 (0.9%) |
| $17,500 to $19,999 | 182 (0.8%) | 272 (1.3%) |
| $20,000 to $22,499 | 367 (1.5%) | 312 (1.5%) |
| $22,500 to $24,999 | 362 (1.5%) | 465 (2.2%) |
| $25,000 to $29,999 | 837 (3.5%) | 1,001 (4.8%) |
| $30,000 to $34,999 | 732 (3.0%) | 594 (2.9%) |
| $35,000 to $39,999 | 860 (3.6%) | 654 (3.2%) |
| $40,000 to $44,999 | 825 (3.4%) | 707 (3.4%) |
| $45,000 to $49,999 | 785 (3.3%) | 988 (4.8%) |
| $50,000 to $54,999 | 752 (3.1%) | 704 (3.4%) |
| $55,000 to $64,999 | 1,479 (6.2%) | 1,608 (7.8%) |
| $65,000 to $74,999 | 1,436 (6.0%) | 1,484 (7.2%) |
| $75,000 to $99,999 | 3,013 (12.6%) | 2,812 (13.6%) |
| $100,000+ | 8,665 (36.1%) | 4,676 (22.6%) |
| Total | 23,990 (100.0%) | 20,684 (100.0%) |
Earnings by Sex by Educational Attainment in Centreville
Average earnings in Centreville are $83,162 for men and $63,117 for women, a difference of 24.1%. Men with an educational attainment of graduate degree enjoy the highest average annual earnings of $136,787, while those with less than high school education earn the least with $38,465. Women with an educational attainment of graduate degree earn the most with the average annual earnings of $84,761, while those with high school diploma education have the smallest earnings of $30,975.
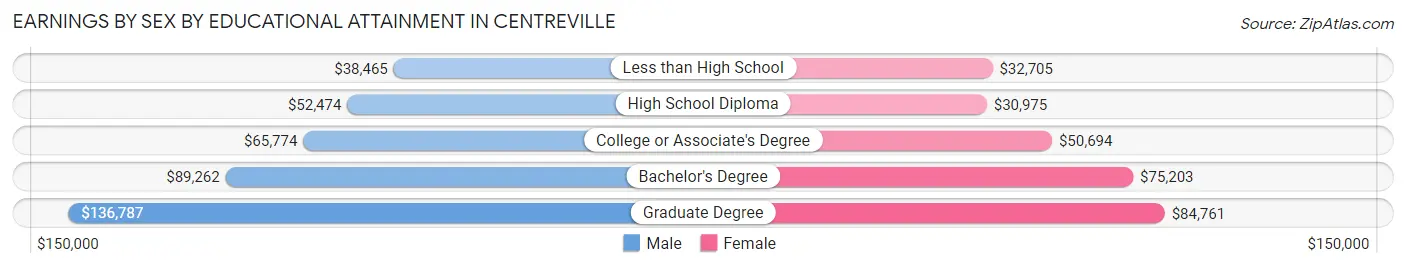
| Educational Attainment | Male Income | Female Income |
| Less than High School | $38,465 | $32,705 |
| High School Diploma | $52,474 | $30,975 |
| College or Associate's Degree | $65,774 | $50,694 |
| Bachelor's Degree | $89,262 | $75,203 |
| Graduate Degree | $136,787 | $84,761 |
| Total | $83,162 | $63,117 |
Family Income in Centreville
Family Income Brackets in Centreville
According to the Centreville family income data, there are 6,546 families falling into the $200,000+ income range, which is the most common income bracket and makes up 34.8% of all families. Conversely, the $10,000 to $14,999 income bracket is the least frequent group with only 263 families (1.4%) belonging to this category.
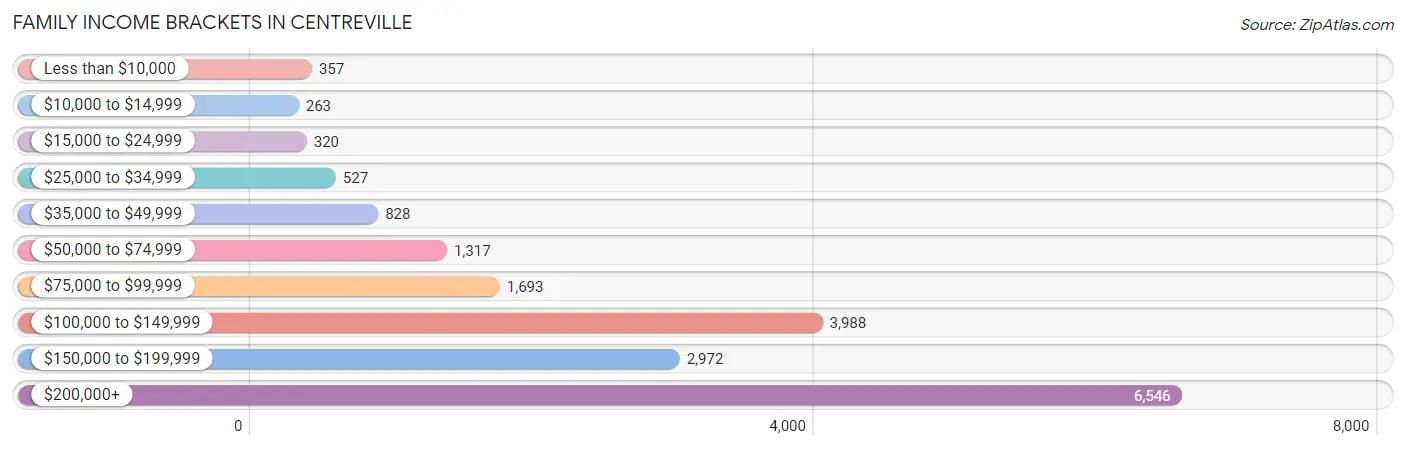
| Income Bracket | # Families | % Families |
| Less than $10,000 | 357 | 1.9% |
| $10,000 to $14,999 | 263 | 1.4% |
| $15,000 to $24,999 | 320 | 1.7% |
| $25,000 to $34,999 | 527 | 2.8% |
| $35,000 to $49,999 | 828 | 4.4% |
| $50,000 to $74,999 | 1,317 | 7.0% |
| $75,000 to $99,999 | 1,693 | 9.0% |
| $100,000 to $149,999 | 3,988 | 21.2% |
| $150,000 to $199,999 | 2,972 | 15.8% |
| $200,000+ | 6,546 | 34.8% |
Family Income by Famaliy Size in Centreville
6-person families (443 | 2.4%) account for the highest median family income in Centreville with $195,197 per family, while 2-person families (6,670 | 35.5%) have the highest median income of $63,514 per family member.
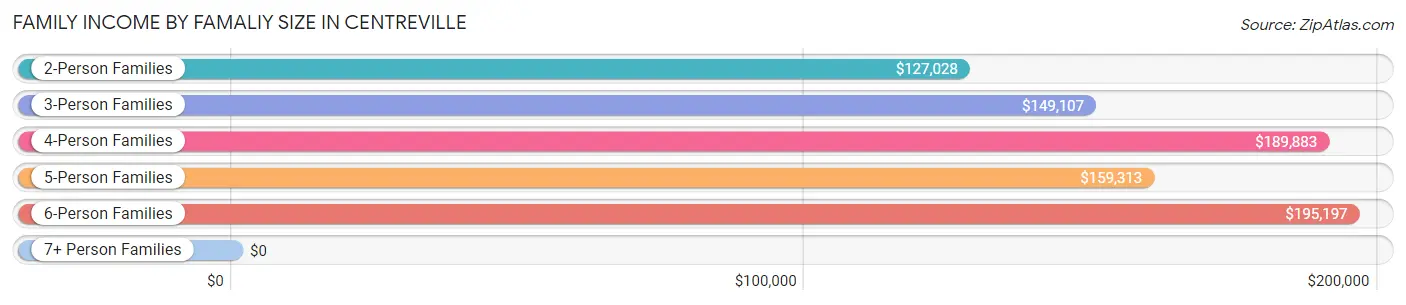
| Income Bracket | # Families | Median Income |
| 2-Person Families | 6,670 (35.5%) | $127,028 |
| 3-Person Families | 4,904 (26.1%) | $149,107 |
| 4-Person Families | 4,682 (24.9%) | $189,883 |
| 5-Person Families | 1,804 (9.6%) | $159,313 |
| 6-Person Families | 443 (2.4%) | $195,197 |
| 7+ Person Families | 307 (1.6%) | $0 |
| Total | 18,810 (100.0%) | $152,885 |
Family Income by Number of Earners in Centreville
The median family income in Centreville is $152,885, with families comprising 3+ earners (3,566) having the highest median family income of $202,273, while families with no earners (1,252) have the lowest median family income of $43,882, accounting for 19.0% and 6.7% of families, respectively.
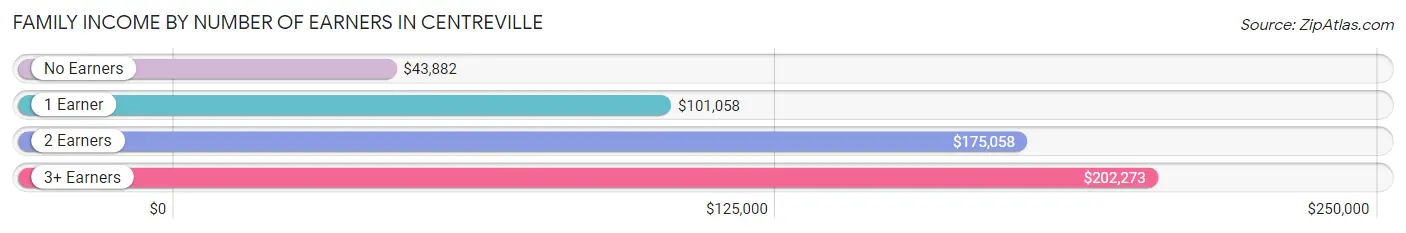
| Number of Earners | # Families | Median Income |
| No Earners | 1,252 (6.7%) | $43,882 |
| 1 Earner | 4,640 (24.7%) | $101,058 |
| 2 Earners | 9,352 (49.7%) | $175,058 |
| 3+ Earners | 3,566 (19.0%) | $202,273 |
| Total | 18,810 (100.0%) | $152,885 |
Household Income in Centreville
Household Income Brackets in Centreville
With 7,285 households falling in the category, the $200,000+ income range is the most frequent in Centreville, accounting for 29.2% of all households. In contrast, only 374 households (1.5%) fall into the $10,000 to $14,999 income bracket, making it the least populous group.
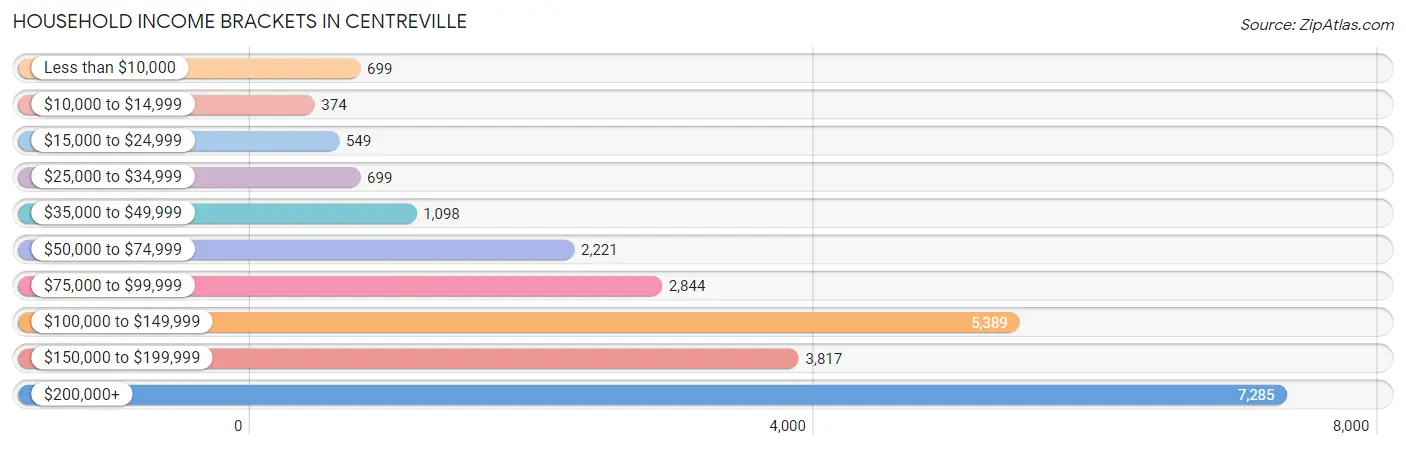
| Income Bracket | # Households | % Households |
| Less than $10,000 | 699 | 2.8% |
| $10,000 to $14,999 | 374 | 1.5% |
| $15,000 to $24,999 | 549 | 2.2% |
| $25,000 to $34,999 | 699 | 2.8% |
| $35,000 to $49,999 | 1,098 | 4.4% |
| $50,000 to $74,999 | 2,221 | 8.9% |
| $75,000 to $99,999 | 2,844 | 11.4% |
| $100,000 to $149,999 | 5,389 | 21.6% |
| $150,000 to $199,999 | 3,817 | 15.3% |
| $200,000+ | 7,285 | 29.2% |
Household Income by Householder Age in Centreville
The median household income in Centreville is $136,679, with the highest median household income of $158,699 found in the 45 to 64 years age bracket for the primary householder. A total of 11,073 households (44.4%) fall into this category. Meanwhile, the 15 to 24 years age bracket for the primary householder has the lowest median household income of $59,474, with 568 households (2.3%) in this group.
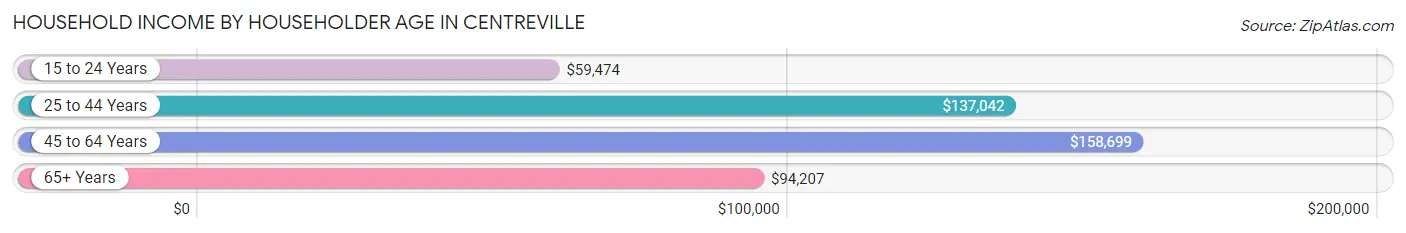
| Income Bracket | # Households | Median Income |
| 15 to 24 Years | 568 (2.3%) | $59,474 |
| 25 to 44 Years | 9,412 (37.7%) | $137,042 |
| 45 to 64 Years | 11,073 (44.4%) | $158,699 |
| 65+ Years | 3,897 (15.6%) | $94,207 |
| Total | 24,950 (100.0%) | $136,679 |
Poverty in Centreville
Income Below Poverty by Sex and Age in Centreville
With 6.1% poverty level for males and 7.6% for females among the residents of Centreville, 6 to 11 year old males and 5 year old females are the most vulnerable to poverty, with 546 males (18.3%) and 147 females (23.6%) in their respective age groups living below the poverty level.
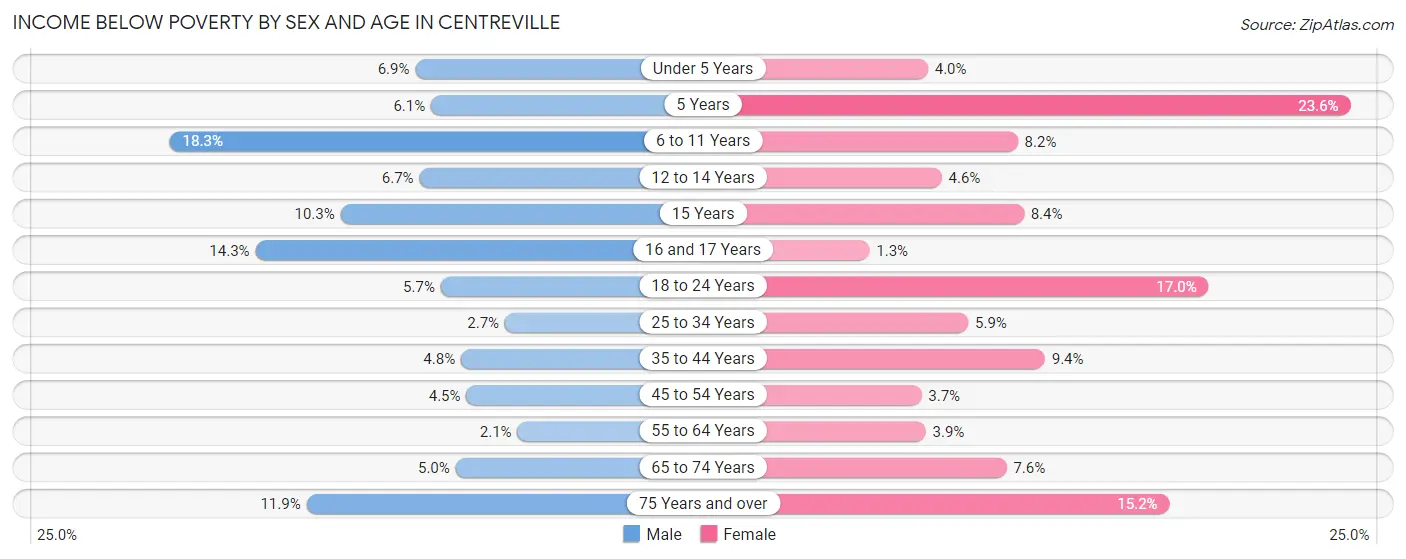
| Age Bracket | Male | Female |
| Under 5 Years | 148 (6.9%) | 64 (4.0%) |
| 5 Years | 36 (6.1%) | 147 (23.6%) |
| 6 to 11 Years | 546 (18.3%) | 239 (8.2%) |
| 12 to 14 Years | 85 (6.7%) | 67 (4.6%) |
| 15 Years | 66 (10.3%) | 48 (8.4%) |
| 16 and 17 Years | 144 (14.3%) | 11 (1.3%) |
| 18 to 24 Years | 199 (5.7%) | 559 (17.0%) |
| 25 to 34 Years | 148 (2.7%) | 283 (5.9%) |
| 35 to 44 Years | 265 (4.8%) | 537 (9.4%) |
| 45 to 54 Years | 232 (4.5%) | 199 (3.7%) |
| 55 to 64 Years | 98 (2.1%) | 182 (3.9%) |
| 65 to 74 Years | 119 (5.0%) | 217 (7.6%) |
| 75 Years and over | 145 (11.9%) | 194 (15.2%) |
| Total | 2,231 (6.1%) | 2,747 (7.6%) |
Income Above Poverty by Sex and Age in Centreville
According to the poverty statistics in Centreville, males aged 55 to 64 years and females aged 16 and 17 years are the age groups that are most secure financially, with 97.9% of males and 98.7% of females in these age groups living above the poverty line.
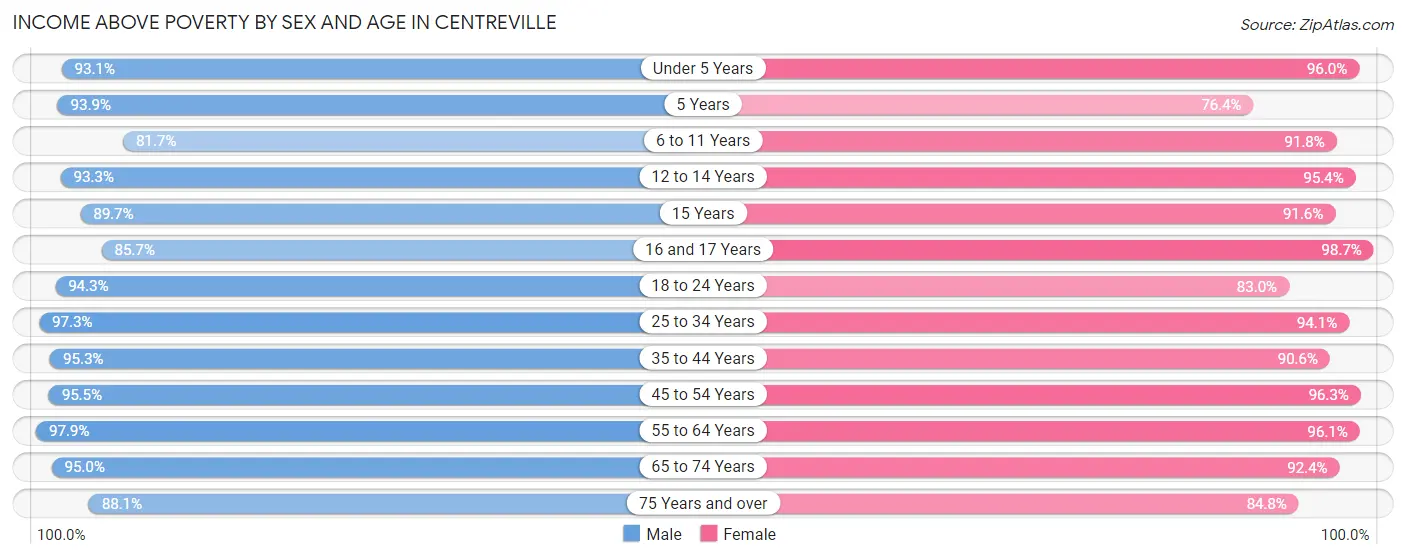
| Age Bracket | Male | Female |
| Under 5 Years | 2,007 (93.1%) | 1,539 (96.0%) |
| 5 Years | 550 (93.9%) | 476 (76.4%) |
| 6 to 11 Years | 2,442 (81.7%) | 2,689 (91.8%) |
| 12 to 14 Years | 1,188 (93.3%) | 1,381 (95.4%) |
| 15 Years | 572 (89.7%) | 521 (91.6%) |
| 16 and 17 Years | 864 (85.7%) | 850 (98.7%) |
| 18 to 24 Years | 3,297 (94.3%) | 2,725 (83.0%) |
| 25 to 34 Years | 5,311 (97.3%) | 4,548 (94.1%) |
| 35 to 44 Years | 5,309 (95.3%) | 5,164 (90.6%) |
| 45 to 54 Years | 4,928 (95.5%) | 5,197 (96.3%) |
| 55 to 64 Years | 4,505 (97.9%) | 4,497 (96.1%) |
| 65 to 74 Years | 2,260 (95.0%) | 2,623 (92.4%) |
| 75 Years and over | 1,071 (88.1%) | 1,082 (84.8%) |
| Total | 34,304 (93.9%) | 33,292 (92.4%) |
Income Below Poverty Among Married-Couple Families in Centreville
The poverty statistics for married-couple families in Centreville show that 4.0% or 605 of the total 15,328 families live below the poverty line. Families with 5 or more children have the highest poverty rate of 84.6%, comprising of 44 families. On the other hand, families with 1 or 2 children have the lowest poverty rate of 2.6%, which includes 167 families.
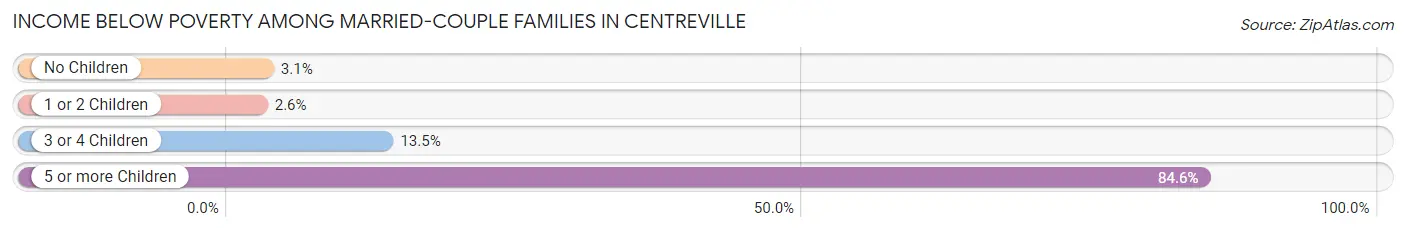
| Children | Above Poverty | Below Poverty |
| No Children | 7,433 (96.9%) | 239 (3.1%) |
| 1 or 2 Children | 6,291 (97.4%) | 167 (2.6%) |
| 3 or 4 Children | 991 (86.5%) | 155 (13.5%) |
| 5 or more Children | 8 (15.4%) | 44 (84.6%) |
| Total | 14,723 (96.1%) | 605 (4.0%) |
Income Below Poverty Among Single-Parent Households in Centreville
According to the poverty data in Centreville, 1.4% or 15 single-father households and 14.6% or 356 single-mother households are living below the poverty line. Among single-father households, those with 5 or more children have the highest poverty rate, with 2 households (10.0%) experiencing poverty. Likewise, among single-mother households, those with 3 or 4 children have the highest poverty rate, with 73 households (62.4%) falling below the poverty line.
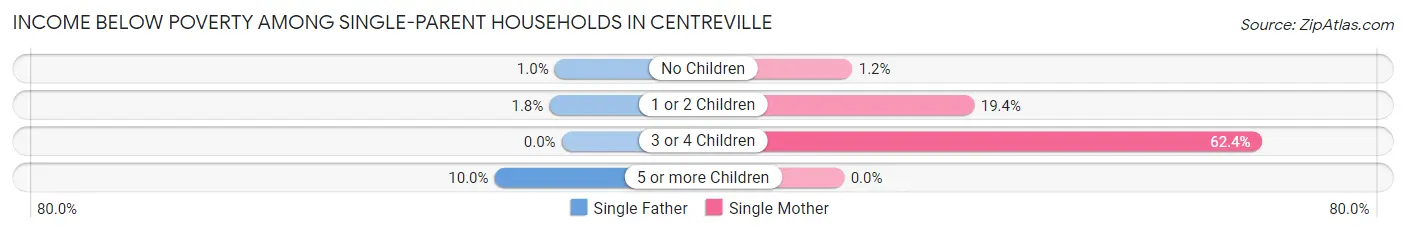
| Children | Single Father | Single Mother |
| No Children | 7 (1.0%) | 11 (1.2%) |
| 1 or 2 Children | 6 (1.8%) | 272 (19.4%) |
| 3 or 4 Children | 0 (0.0%) | 73 (62.4%) |
| 5 or more Children | 2 (10.0%) | 0 (0.0%) |
| Total | 15 (1.4%) | 356 (14.6%) |
Income Below Poverty Among Married-Couple vs Single-Parent Households in Centreville
The poverty data for Centreville shows that 605 of the married-couple family households (4.0%) and 371 of the single-parent households (10.6%) are living below the poverty level. Within the married-couple family households, those with 5 or more children have the highest poverty rate, with 44 households (84.6%) falling below the poverty line. Among the single-parent households, those with 3 or 4 children have the highest poverty rate, with 73 household (51.0%) living below poverty.
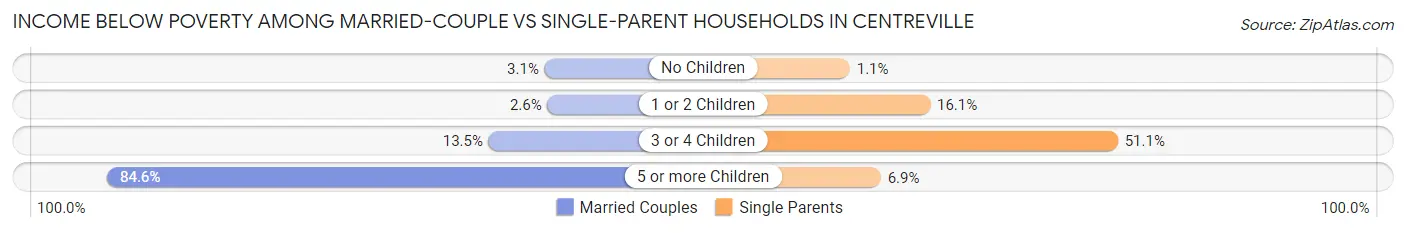
| Children | Married-Couple Families | Single-Parent Households |
| No Children | 239 (3.1%) | 18 (1.1%) |
| 1 or 2 Children | 167 (2.6%) | 278 (16.1%) |
| 3 or 4 Children | 155 (13.5%) | 73 (51.0%) |
| 5 or more Children | 44 (84.6%) | 2 (6.9%) |
| Total | 605 (4.0%) | 371 (10.6%) |
Race in Centreville
The most populous races in Centreville are White / Caucasian (34,511 | 47.5%), Asian (21,310 | 29.3%), and Hispanic or Latino (12,009 | 16.5%).
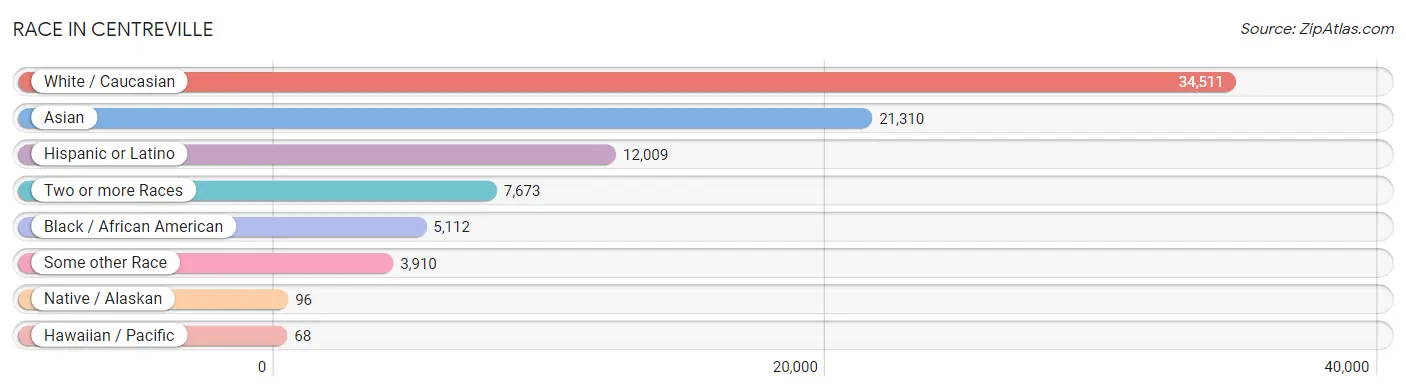
| Race | # Population | % Population |
| Asian | 21,310 | 29.3% |
| Black / African American | 5,112 | 7.0% |
| Hawaiian / Pacific | 68 | 0.1% |
| Hispanic or Latino | 12,009 | 16.5% |
| Native / Alaskan | 96 | 0.1% |
| White / Caucasian | 34,511 | 47.5% |
| Two or more Races | 7,673 | 10.6% |
| Some other Race | 3,910 | 5.4% |
| Total | 72,680 | 100.0% |
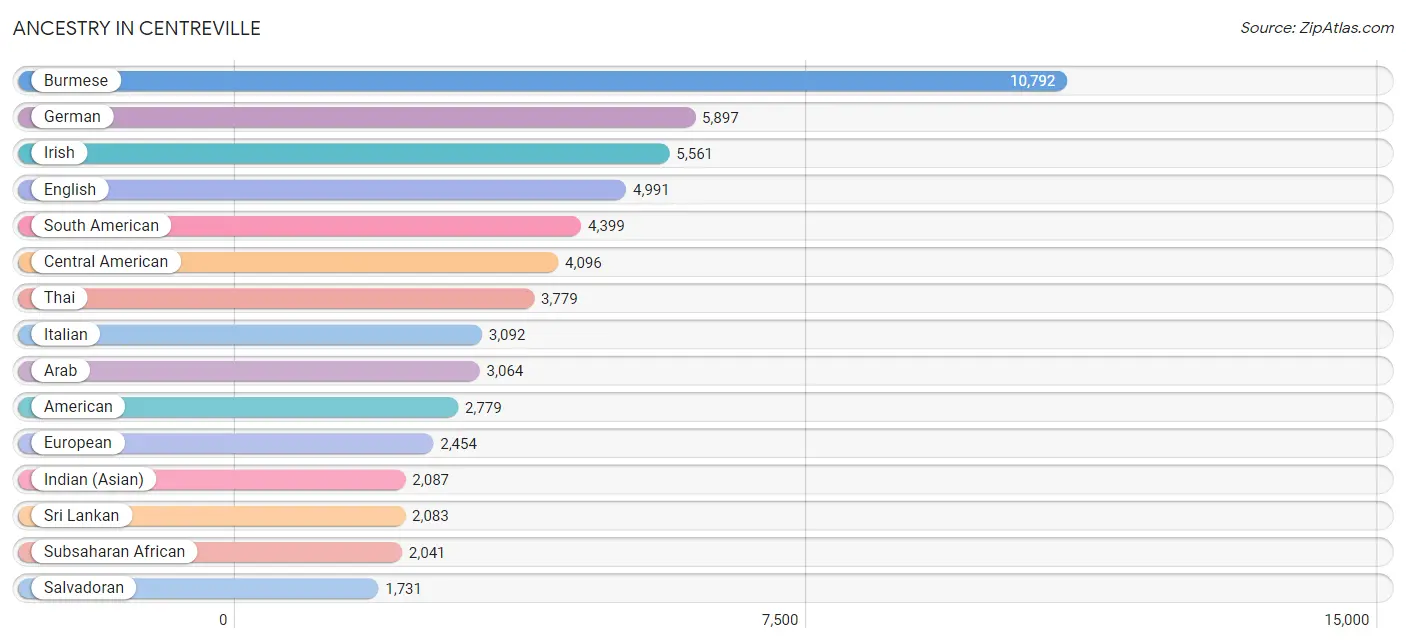
Ancestry in Centreville
The most populous ancestries reported in Centreville are Burmese (10,792 | 14.8%), German (5,897 | 8.1%), Irish (5,561 | 7.6%), English (4,991 | 6.9%), and South American (4,399 | 6.0%), together accounting for 43.5% of all Centreville residents.
| Ancestry | # Population | % Population |
| Afghan | 779 | 1.1% |
| African | 658 | 0.9% |
| Alsatian | 16 | 0.0% |
| American | 2,779 | 3.8% |
| Arab | 3,064 | 4.2% |
| Argentinean | 117 | 0.2% |
| Armenian | 83 | 0.1% |
| Australian | 15 | 0.0% |
| Austrian | 198 | 0.3% |
| Belgian | 42 | 0.1% |
| Bhutanese | 284 | 0.4% |
| Blackfeet | 7 | 0.0% |
| Bolivian | 1,304 | 1.8% |
| Brazilian | 106 | 0.2% |
| British | 402 | 0.5% |
| British West Indian | 10 | 0.0% |
| Bulgarian | 7 | 0.0% |
| Burmese | 10,792 | 14.8% |
| Cambodian | 124 | 0.2% |
| Canadian | 26 | 0.0% |
| Carpatho Rusyn | 9 | 0.0% |
| Celtic | 12 | 0.0% |
| Central American | 4,096 | 5.6% |
| Central American Indian | 139 | 0.2% |
| Cherokee | 76 | 0.1% |
| Chilean | 180 | 0.3% |
| Chinese | 12 | 0.0% |
| Chippewa | 50 | 0.1% |
| Colombian | 681 | 0.9% |
| Costa Rican | 91 | 0.1% |
| Creek | 5 | 0.0% |
| Croatian | 79 | 0.1% |
| Cuban | 252 | 0.4% |
| Czech | 118 | 0.2% |
| Czechoslovakian | 44 | 0.1% |
| Danish | 142 | 0.2% |
| Dominican | 217 | 0.3% |
| Dutch | 363 | 0.5% |
| Eastern European | 270 | 0.4% |
| Ecuadorian | 555 | 0.8% |
| Egyptian | 1,231 | 1.7% |
| English | 4,991 | 6.9% |
| Estonian | 9 | 0.0% |
| Ethiopian | 311 | 0.4% |
| European | 2,454 | 3.4% |
| Filipino | 131 | 0.2% |
| Finnish | 128 | 0.2% |
| French | 1,052 | 1.5% |
| French Canadian | 206 | 0.3% |
| German | 5,897 | 8.1% |
| German Russian | 6 | 0.0% |
| Ghanaian | 335 | 0.5% |
| Greek | 256 | 0.4% |
| Guamanian / Chamorro | 32 | 0.0% |
| Guatemalan | 1,327 | 1.8% |
| Guyanese | 9 | 0.0% |
| Haitian | 70 | 0.1% |
| Honduran | 580 | 0.8% |
| Hopi | 4 | 0.0% |
| Hungarian | 230 | 0.3% |
| Icelander | 18 | 0.0% |
| Indian (Asian) | 2,087 | 2.9% |
| Indonesian | 12 | 0.0% |
| Iranian | 387 | 0.5% |
| Iraqi | 227 | 0.3% |
| Irish | 5,561 | 7.6% |
| Iroquois | 37 | 0.1% |
| Israeli | 16 | 0.0% |
| Italian | 3,092 | 4.3% |
| Jamaican | 56 | 0.1% |
| Japanese | 135 | 0.2% |
| Jordanian | 15 | 0.0% |
| Kenyan | 22 | 0.0% |
| Korean | 1,507 | 2.1% |
| Laotian | 70 | 0.1% |
| Latvian | 7 | 0.0% |
| Lebanese | 348 | 0.5% |
| Liberian | 99 | 0.1% |
| Lithuanian | 100 | 0.1% |
| Malaysian | 202 | 0.3% |
| Mexican | 685 | 0.9% |
| Mongolian | 48 | 0.1% |
| Moroccan | 670 | 0.9% |
| Native Hawaiian | 17 | 0.0% |
| Nicaraguan | 349 | 0.5% |
| Nigerian | 22 | 0.0% |
| Northern European | 165 | 0.2% |
| Norwegian | 197 | 0.3% |
| Pakistani | 230 | 0.3% |
| Palestinian | 131 | 0.2% |
| Panamanian | 18 | 0.0% |
| Pennsylvania German | 7 | 0.0% |
| Peruvian | 1,327 | 1.8% |
| Polish | 1,499 | 2.1% |
| Portuguese | 76 | 0.1% |
| Pueblo | 8 | 0.0% |
| Puerto Rican | 1,064 | 1.5% |
| Romanian | 67 | 0.1% |
| Russian | 334 | 0.5% |
| Salvadoran | 1,731 | 2.4% |
| Samoan | 15 | 0.0% |
| Scandinavian | 188 | 0.3% |
| Scotch-Irish | 480 | 0.7% |
| Scottish | 1,006 | 1.4% |
| Serbian | 64 | 0.1% |
| Sierra Leonean | 115 | 0.2% |
| Sioux | 2 | 0.0% |
| Slavic | 14 | 0.0% |
| Slovak | 143 | 0.2% |
| Somali | 261 | 0.4% |
| South African | 59 | 0.1% |
| South American | 4,399 | 6.0% |
| South American Indian | 27 | 0.0% |
| Spaniard | 145 | 0.2% |
| Spanish | 210 | 0.3% |
| Sri Lankan | 2,083 | 2.9% |
| Subsaharan African | 2,041 | 2.8% |
| Sudanese | 139 | 0.2% |
| Swedish | 377 | 0.5% |
| Swiss | 141 | 0.2% |
| Syrian | 67 | 0.1% |
| Thai | 3,779 | 5.2% |
| Trinidadian and Tobagonian | 39 | 0.1% |
| Turkish | 192 | 0.3% |
| Ukrainian | 156 | 0.2% |
| Uruguayan | 6 | 0.0% |
| Venezuelan | 211 | 0.3% |
| Vietnamese | 676 | 0.9% |
| Welsh | 548 | 0.7% |
| West Indian | 15 | 0.0% |
| Yugoslavian | 42 | 0.1% | View All 131 Rows |
Immigrants in Centreville
The most numerous immigrant groups reported in Centreville came from Asia (16,003 | 22.0%), Eastern Asia (8,229 | 11.3%), Korea (7,025 | 9.7%), Latin America (6,116 | 8.4%), and South Central Asia (4,175 | 5.7%), together accounting for 57.2% of all Centreville residents.
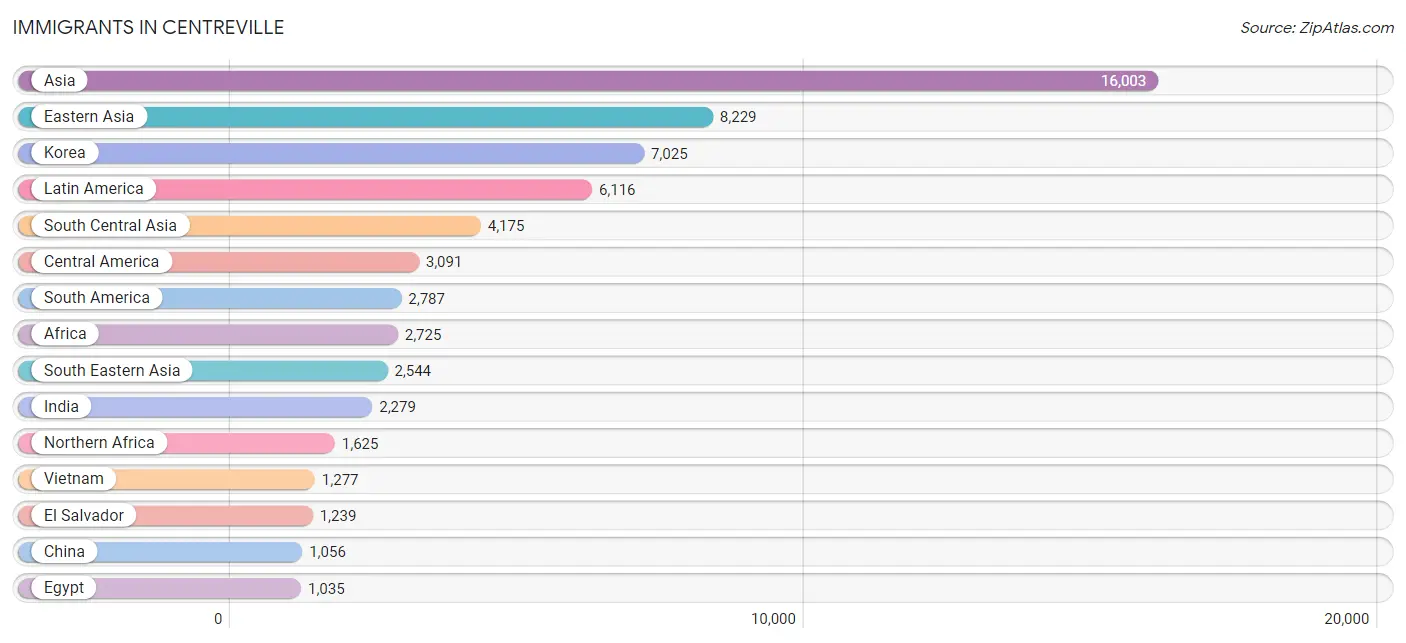
| Immigration Origin | # Population | % Population |
| Afghanistan | 678 | 0.9% |
| Africa | 2,725 | 3.7% |
| Argentina | 19 | 0.0% |
| Asia | 16,003 | 22.0% |
| Bangladesh | 304 | 0.4% |
| Belgium | 16 | 0.0% |
| Bolivia | 639 | 0.9% |
| Brazil | 7 | 0.0% |
| Cambodia | 75 | 0.1% |
| Cameroon | 12 | 0.0% |
| Canada | 108 | 0.2% |
| Caribbean | 238 | 0.3% |
| Central America | 3,091 | 4.3% |
| Chile | 119 | 0.2% |
| China | 1,056 | 1.5% |
| Colombia | 490 | 0.7% |
| Cuba | 74 | 0.1% |
| Czechoslovakia | 8 | 0.0% |
| Dominican Republic | 73 | 0.1% |
| Eastern Africa | 372 | 0.5% |
| Eastern Asia | 8,229 | 11.3% |
| Eastern Europe | 180 | 0.3% |
| Ecuador | 274 | 0.4% |
| Egypt | 1,035 | 1.4% |
| El Salvador | 1,239 | 1.7% |
| England | 41 | 0.1% |
| Ethiopia | 183 | 0.3% |
| Europe | 750 | 1.0% |
| Fiji | 13 | 0.0% |
| France | 99 | 0.1% |
| Germany | 111 | 0.2% |
| Ghana | 295 | 0.4% |
| Greece | 48 | 0.1% |
| Grenada | 21 | 0.0% |
| Guatemala | 979 | 1.3% |
| Guyana | 69 | 0.1% |
| Haiti | 34 | 0.1% |
| Honduras | 387 | 0.5% |
| Hong Kong | 31 | 0.0% |
| Hungary | 7 | 0.0% |
| India | 2,279 | 3.1% |
| Indonesia | 76 | 0.1% |
| Iran | 261 | 0.4% |
| Iraq | 485 | 0.7% |
| Israel | 37 | 0.1% |
| Italy | 38 | 0.1% |
| Jamaica | 14 | 0.0% |
| Japan | 106 | 0.2% |
| Kenya | 28 | 0.0% |
| Korea | 7,025 | 9.7% |
| Kuwait | 22 | 0.0% |
| Laos | 45 | 0.1% |
| Latin America | 6,116 | 8.4% |
| Lebanon | 85 | 0.1% |
| Liberia | 42 | 0.1% |
| Malaysia | 49 | 0.1% |
| Mexico | 188 | 0.3% |
| Middle Africa | 103 | 0.1% |
| Morocco | 499 | 0.7% |
| Nepal | 379 | 0.5% |
| Netherlands | 120 | 0.2% |
| Nicaragua | 292 | 0.4% |
| Nigeria | 11 | 0.0% |
| Northern Africa | 1,625 | 2.2% |
| Northern Europe | 89 | 0.1% |
| Oceania | 15 | 0.0% |
| Pakistan | 244 | 0.3% |
| Panama | 6 | 0.0% |
| Peru | 1,023 | 1.4% |
| Philippines | 762 | 1.1% |
| Romania | 27 | 0.0% |
| Russia | 72 | 0.1% |
| Saudi Arabia | 139 | 0.2% |
| Sierra Leone | 166 | 0.2% |
| Somalia | 142 | 0.2% |
| South Africa | 56 | 0.1% |
| South America | 2,787 | 3.8% |
| South Central Asia | 4,175 | 5.7% |
| South Eastern Asia | 2,544 | 3.5% |
| Southern Europe | 135 | 0.2% |
| Spain | 49 | 0.1% |
| Sudan | 70 | 0.1% |
| Syria | 51 | 0.1% |
| Taiwan | 208 | 0.3% |
| Thailand | 248 | 0.3% |
| Trinidad and Tobago | 13 | 0.0% |
| Turkey | 124 | 0.2% |
| Ukraine | 57 | 0.1% |
| Uruguay | 6 | 0.0% |
| Uzbekistan | 30 | 0.0% |
| Venezuela | 141 | 0.2% |
| Vietnam | 1,277 | 1.8% |
| Western Africa | 528 | 0.7% |
| Western Asia | 1,007 | 1.4% |
| Western Europe | 346 | 0.5% |
| Yemen | 17 | 0.0% |
| Zaire | 91 | 0.1% | View All 97 Rows |
Sex and Age in Centreville
Sex and Age in Centreville
The most populous age groups in Centreville are 35 to 39 Years (2,943 | 8.0%) for men and 40 to 44 Years (2,969 | 8.2%) for women.
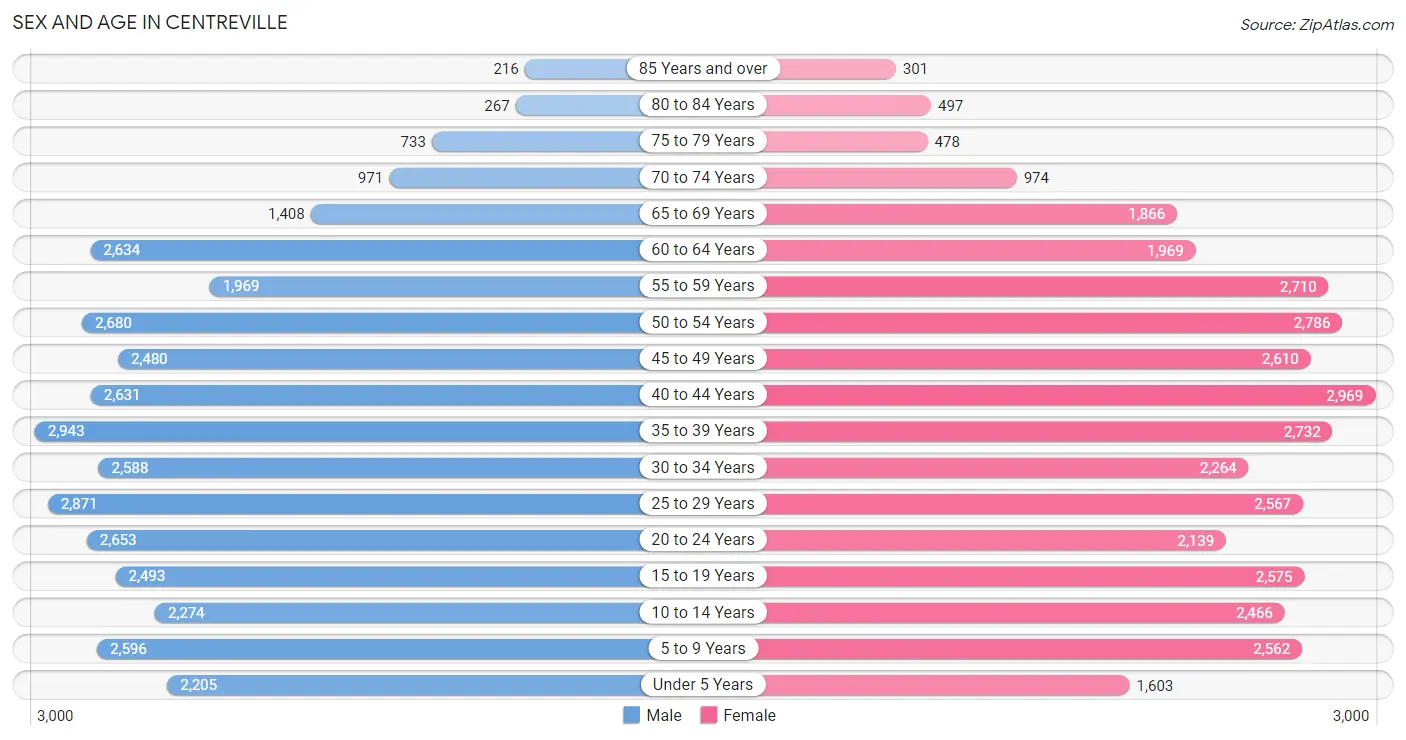
| Age Bracket | Male | Female |
| Under 5 Years | 2,205 (6.0%) | 1,603 (4.4%) |
| 5 to 9 Years | 2,596 (7.1%) | 2,562 (7.1%) |
| 10 to 14 Years | 2,274 (6.2%) | 2,466 (6.8%) |
| 15 to 19 Years | 2,493 (6.8%) | 2,575 (7.1%) |
| 20 to 24 Years | 2,653 (7.2%) | 2,139 (5.9%) |
| 25 to 29 Years | 2,871 (7.8%) | 2,567 (7.1%) |
| 30 to 34 Years | 2,588 (7.1%) | 2,264 (6.3%) |
| 35 to 39 Years | 2,943 (8.0%) | 2,732 (7.6%) |
| 40 to 44 Years | 2,631 (7.2%) | 2,969 (8.2%) |
| 45 to 49 Years | 2,480 (6.8%) | 2,610 (7.2%) |
| 50 to 54 Years | 2,680 (7.3%) | 2,786 (7.7%) |
| 55 to 59 Years | 1,969 (5.4%) | 2,710 (7.5%) |
| 60 to 64 Years | 2,634 (7.2%) | 1,969 (5.5%) |
| 65 to 69 Years | 1,408 (3.8%) | 1,866 (5.2%) |
| 70 to 74 Years | 971 (2.6%) | 974 (2.7%) |
| 75 to 79 Years | 733 (2.0%) | 478 (1.3%) |
| 80 to 84 Years | 267 (0.7%) | 497 (1.4%) |
| 85 Years and over | 216 (0.6%) | 301 (0.8%) |
| Total | 36,612 (100.0%) | 36,068 (100.0%) |
Families and Households in Centreville
Median Family Size in Centreville
The median family size in Centreville is 3.37 persons per family, with married-couple families (15,328 | 81.5%) accounting for the largest median family size of 3.42 persons per family. On the other hand, single male/father families (1,045 | 5.6%) represent the smallest median family size with 3.10 persons per family.
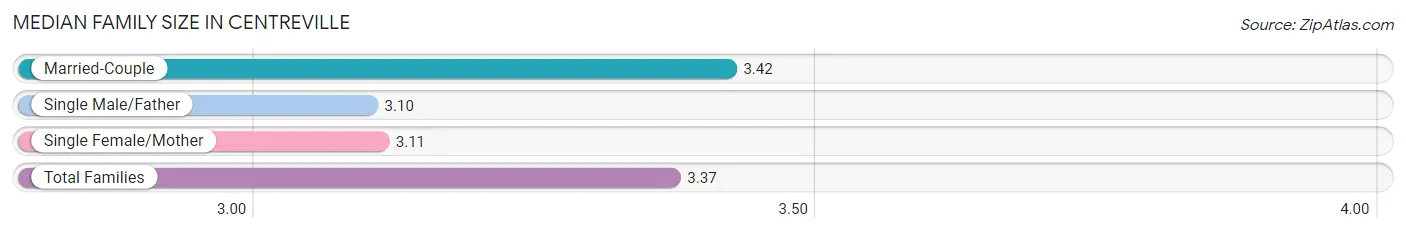
| Family Type | # Families | Family Size |
| Married-Couple | 15,328 (81.5%) | 3.42 |
| Single Male/Father | 1,045 (5.6%) | 3.10 |
| Single Female/Mother | 2,437 (13.0%) | 3.11 |
| Total Families | 18,810 (100.0%) | 3.37 |
Median Household Size in Centreville
The median household size in Centreville is 2.91 persons per household, with married-couple households (15,328 | 61.4%) accounting for the largest median household size of 3.45 persons per household. non-family households (6,140 | 24.6%) represent the smallest median household size with 1.36 persons per household.
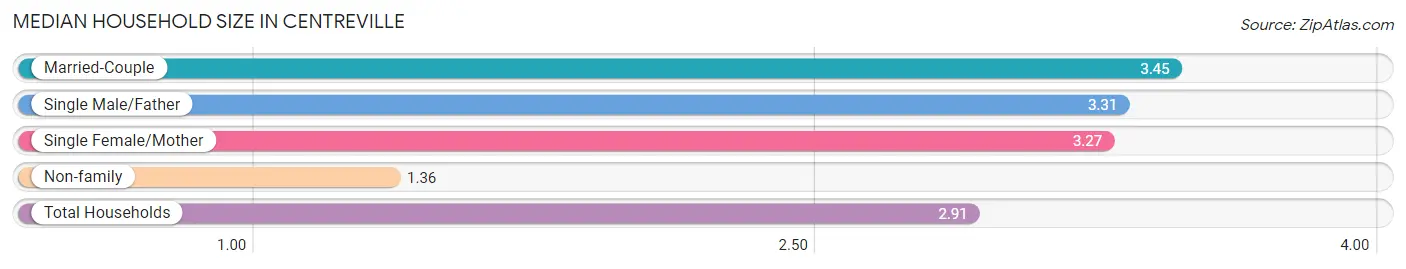
| Household Type | # Households | Household Size |
| Married-Couple | 15,328 (61.4%) | 3.45 |
| Single Male/Father | 1,045 (4.2%) | 3.31 |
| Single Female/Mother | 2,437 (9.8%) | 3.27 |
| Non-family | 6,140 (24.6%) | 1.36 |
| Total Households | 24,950 (100.0%) | 2.91 |
Household Size by Marriage Status in Centreville
Out of a total of 24,950 households in Centreville, 18,810 (75.4%) are family households, while 6,140 (24.6%) are nonfamily households. The most numerous type of family households are 2-person households, comprising 6,383, and the most common type of nonfamily households are 1-person households, comprising 4,661.
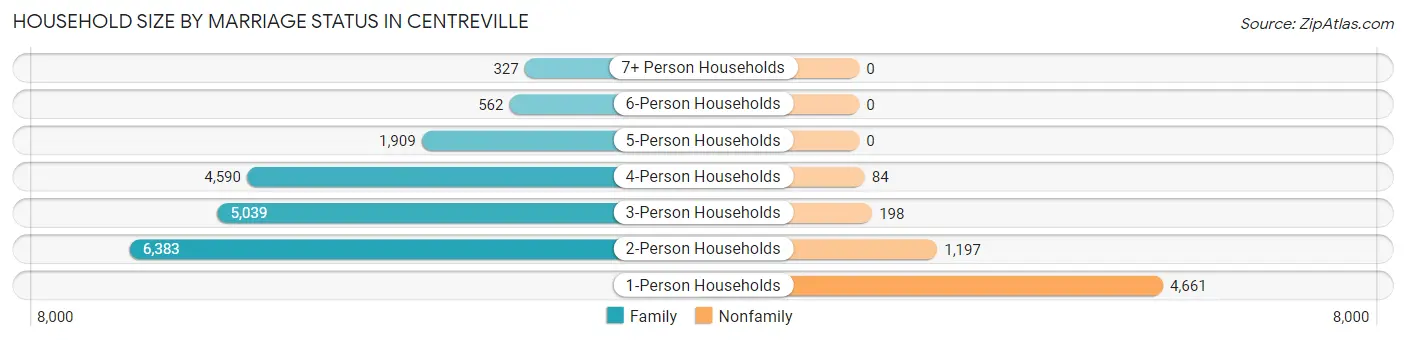
| Household Size | Family Households | Nonfamily Households |
| 1-Person Households | - | 4,661 (18.7%) |
| 2-Person Households | 6,383 (25.6%) | 1,197 (4.8%) |
| 3-Person Households | 5,039 (20.2%) | 198 (0.8%) |
| 4-Person Households | 4,590 (18.4%) | 84 (0.3%) |
| 5-Person Households | 1,909 (7.6%) | 0 (0.0%) |
| 6-Person Households | 562 (2.2%) | 0 (0.0%) |
| 7+ Person Households | 327 (1.3%) | 0 (0.0%) |
| Total | 18,810 (75.4%) | 6,140 (24.6%) |
Female Fertility in Centreville
Fertility by Age in Centreville
Average fertility rate in Centreville is 49.0 births per 1,000 women. Women in the age bracket of 20 to 34 years have the highest fertility rate with 60.0 births per 1,000 women. Women in the age bracket of 35 to 50 years acount for 53.1% of all women with births.
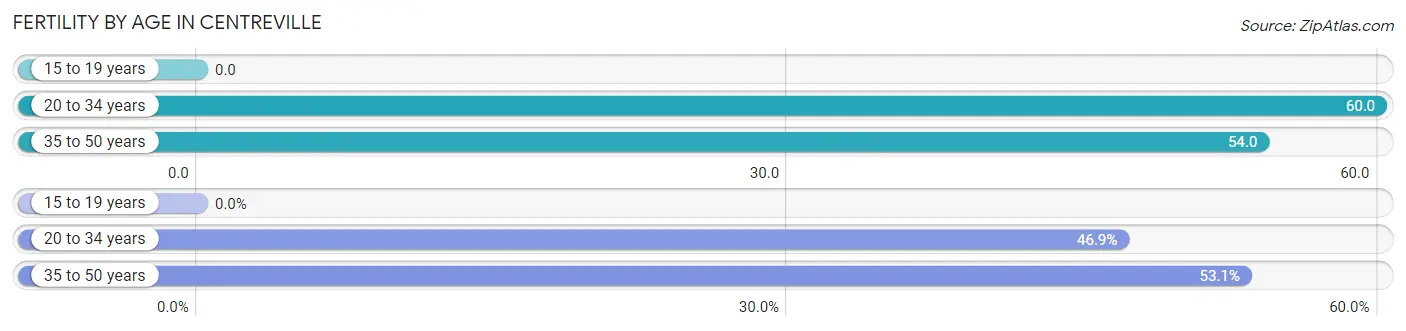
| Age Bracket | Women with Births | Births / 1,000 Women |
| 15 to 19 years | 0 (0.0%) | 0.0 |
| 20 to 34 years | 421 (46.9%) | 60.0 |
| 35 to 50 years | 477 (53.1%) | 54.0 |
| Total | 898 (100.0%) | 49.0 |
Fertility by Age by Marriage Status in Centreville
88.3% of women with births (898) in Centreville are married. The highest percentage of unmarried women with births falls into 20 to 34 years age bracket with 14.5% of them unmarried at the time of birth, while the lowest percentage of unmarried women with births belong to 35 to 50 years age bracket with 9.2% of them unmarried.
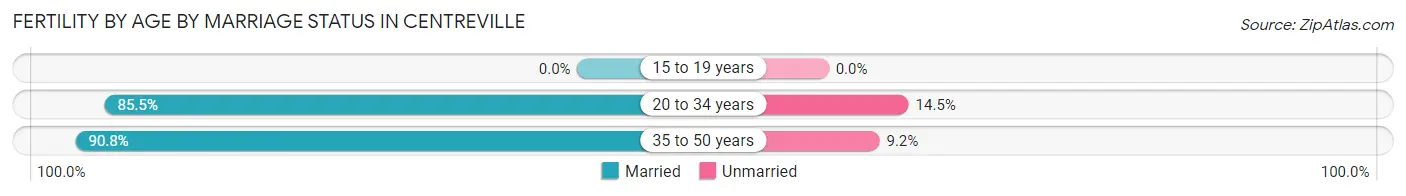
| Age Bracket | Married | Unmarried |
| 15 to 19 years | 0 (0.0%) | 0 (0.0%) |
| 20 to 34 years | 360 (85.5%) | 61 (14.5%) |
| 35 to 50 years | 433 (90.8%) | 44 (9.2%) |
| Total | 793 (88.3%) | 105 (11.7%) |
Fertility by Education in Centreville
Average fertility rate in Centreville is 49.0 births per 1,000 women. Women with the education attainment of bachelor's degree have the highest fertility rate of 63.0 births per 1,000 women, while women with the education attainment of high school diploma have the lowest fertility at 11.0 births per 1,000 women. Women with the education attainment of bachelor's degree represent 38.6% of all women with births.
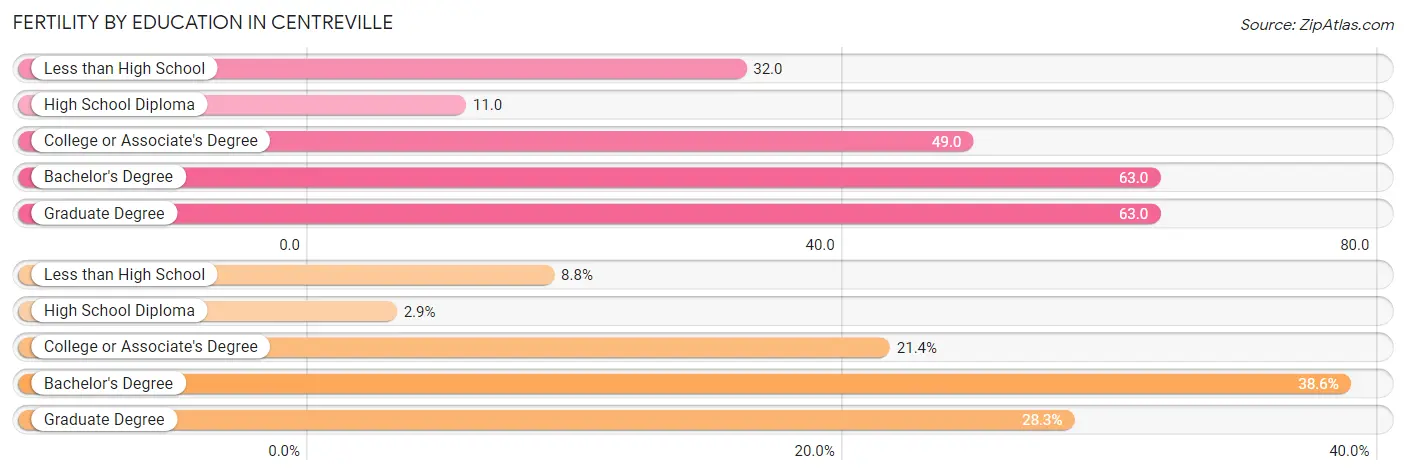
| Educational Attainment | Women with Births | Births / 1,000 Women |
| Less than High School | 79 (8.8%) | 32.0 |
| High School Diploma | 26 (2.9%) | 11.0 |
| College or Associate's Degree | 192 (21.4%) | 49.0 |
| Bachelor's Degree | 347 (38.6%) | 63.0 |
| Graduate Degree | 254 (28.3%) | 63.0 |
| Total | 898 (100.0%) | 49.0 |
Fertility by Education by Marriage Status in Centreville
11.7% of women with births in Centreville are unmarried. Women with the educational attainment of less than high school are most likely to be married with 100.0% of them married at childbirth, while women with the educational attainment of high school diploma are least likely to be married with 53.8% of them unmarried at childbirth.
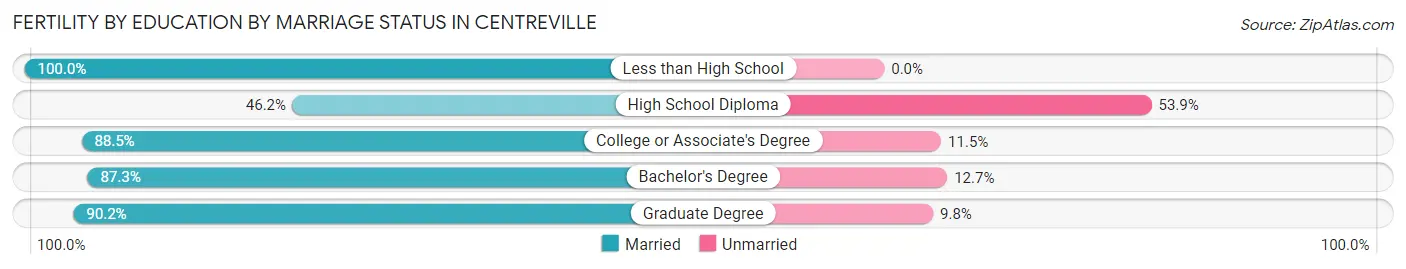
| Educational Attainment | Married | Unmarried |
| Less than High School | 79 (100.0%) | 0 (0.0%) |
| High School Diploma | 12 (46.2%) | 14 (53.8%) |
| College or Associate's Degree | 170 (88.5%) | 22 (11.5%) |
| Bachelor's Degree | 303 (87.3%) | 44 (12.7%) |
| Graduate Degree | 229 (90.2%) | 25 (9.8%) |
| Total | 793 (88.3%) | 105 (11.7%) |
Employment Characteristics in Centreville
Employment by Class of Employer in Centreville
Among the 40,860 employed individuals in Centreville, private company employees (25,871 | 63.3%), federal government employees (3,985 | 9.8%), and local government employees (3,841 | 9.4%) make up the most common classes of employment.
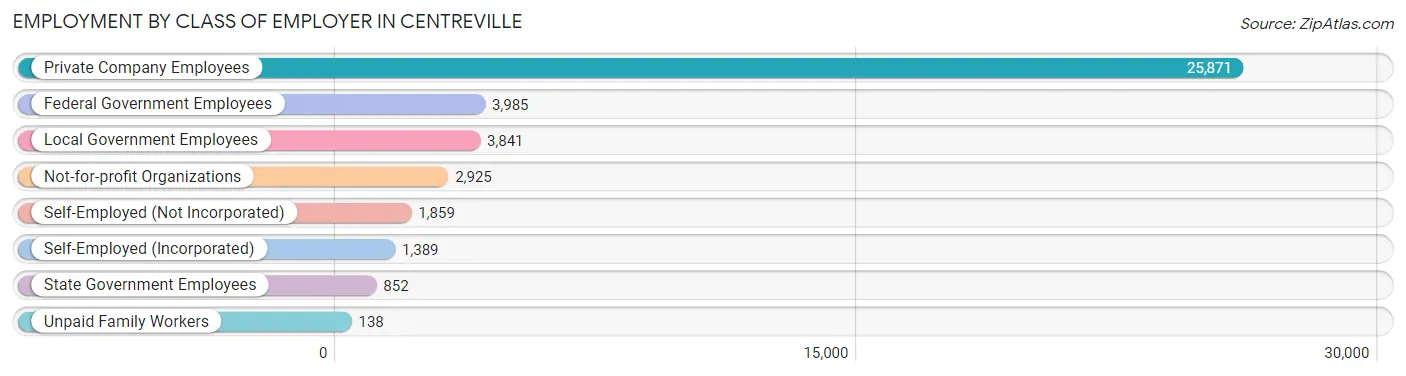
| Employer Class | # Employees | % Employees |
| Private Company Employees | 25,871 | 63.3% |
| Self-Employed (Incorporated) | 1,389 | 3.4% |
| Self-Employed (Not Incorporated) | 1,859 | 4.5% |
| Not-for-profit Organizations | 2,925 | 7.2% |
| Local Government Employees | 3,841 | 9.4% |
| State Government Employees | 852 | 2.1% |
| Federal Government Employees | 3,985 | 9.8% |
| Unpaid Family Workers | 138 | 0.3% |
| Total | 40,860 | 100.0% |
Employment Status by Age in Centreville
According to the labor force statistics for Centreville, out of the total population over 16 years of age (57,766), 75.5% or 43,613 individuals are in the labor force, with 4.4% or 1,919 of them unemployed. The age group with the highest labor force participation rate is 45 to 54 years, with 89.7% or 9,469 individuals in the labor force. Within the labor force, the 16 to 19 years age range has the highest percentage of unemployed individuals, with 30.3% or 455 of them being unemployed.
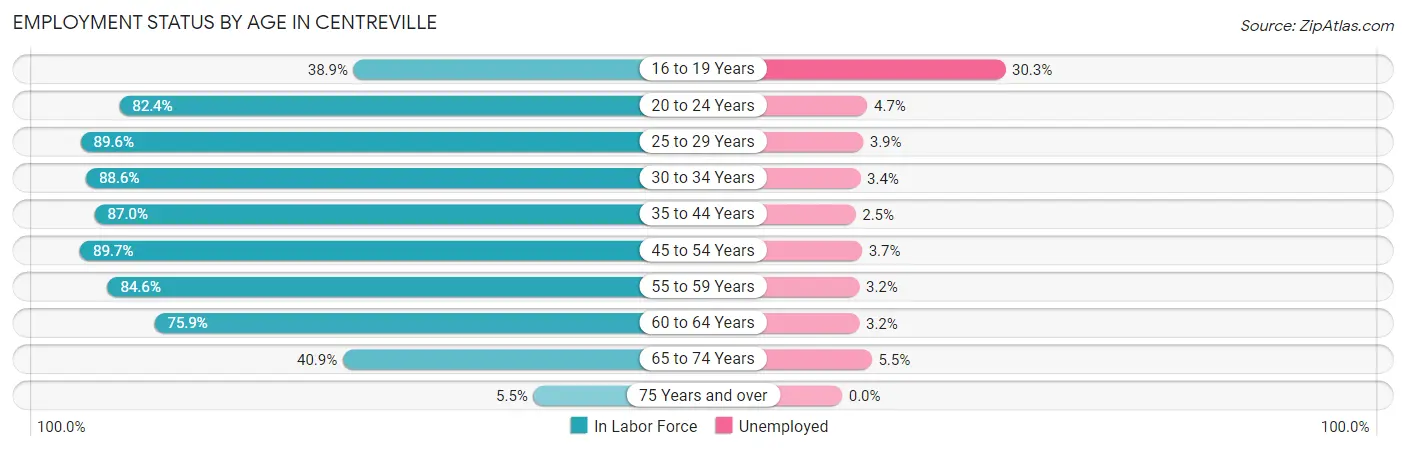
| Age Bracket | In Labor Force | Unemployed |
| 16 to 19 Years | 1,502 (38.9%) | 455 (30.3%) |
| 20 to 24 Years | 3,949 (82.4%) | 186 (4.7%) |
| 25 to 29 Years | 4,872 (89.6%) | 190 (3.9%) |
| 30 to 34 Years | 4,299 (88.6%) | 146 (3.4%) |
| 35 to 44 Years | 9,809 (87.0%) | 245 (2.5%) |
| 45 to 54 Years | 9,469 (89.7%) | 350 (3.7%) |
| 55 to 59 Years | 3,958 (84.6%) | 127 (3.2%) |
| 60 to 64 Years | 3,494 (75.9%) | 112 (3.2%) |
| 65 to 74 Years | 2,135 (40.9%) | 117 (5.5%) |
| 75 Years and over | 137 (5.5%) | 0 (0.0%) |
| Total | 43,613 (75.5%) | 1,919 (4.4%) |
Employment Status by Educational Attainment in Centreville
According to labor force statistics for Centreville, 86.7% of individuals (35,896) out of the total population between 25 and 64 years of age (41,403) are in the labor force, with 3.3% or 1,185 of them being unemployed. The group with the highest labor force participation rate are those with the educational attainment of bachelor's degree or higher, with 89.7% or 22,458 individuals in the labor force. Within the labor force, individuals with high school diploma education have the highest percentage of unemployment, with 6.9% or 319 of them being unemployed.
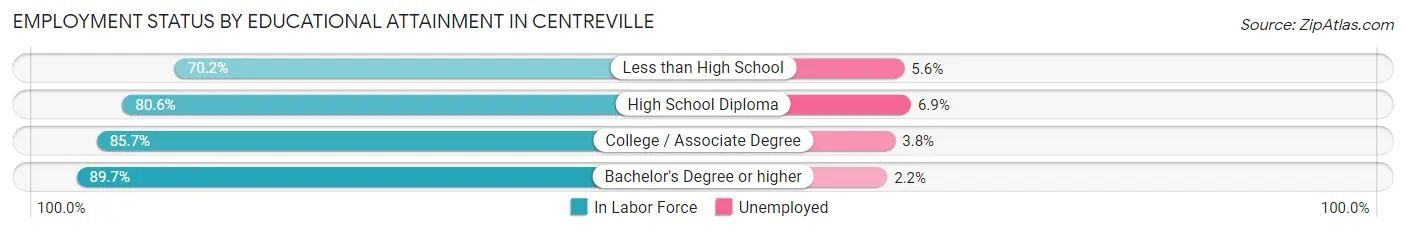
| Educational Attainment | In Labor Force | Unemployed |
| Less than High School | 1,352 (70.2%) | 108 (5.6%) |
| High School Diploma | 4,628 (80.6%) | 396 (6.9%) |
| College / Associate Degree | 7,454 (85.7%) | 331 (3.8%) |
| Bachelor's Degree or higher | 22,458 (89.7%) | 551 (2.2%) |
| Total | 35,896 (86.7%) | 1,366 (3.3%) |
Employment Occupations by Sex in Centreville
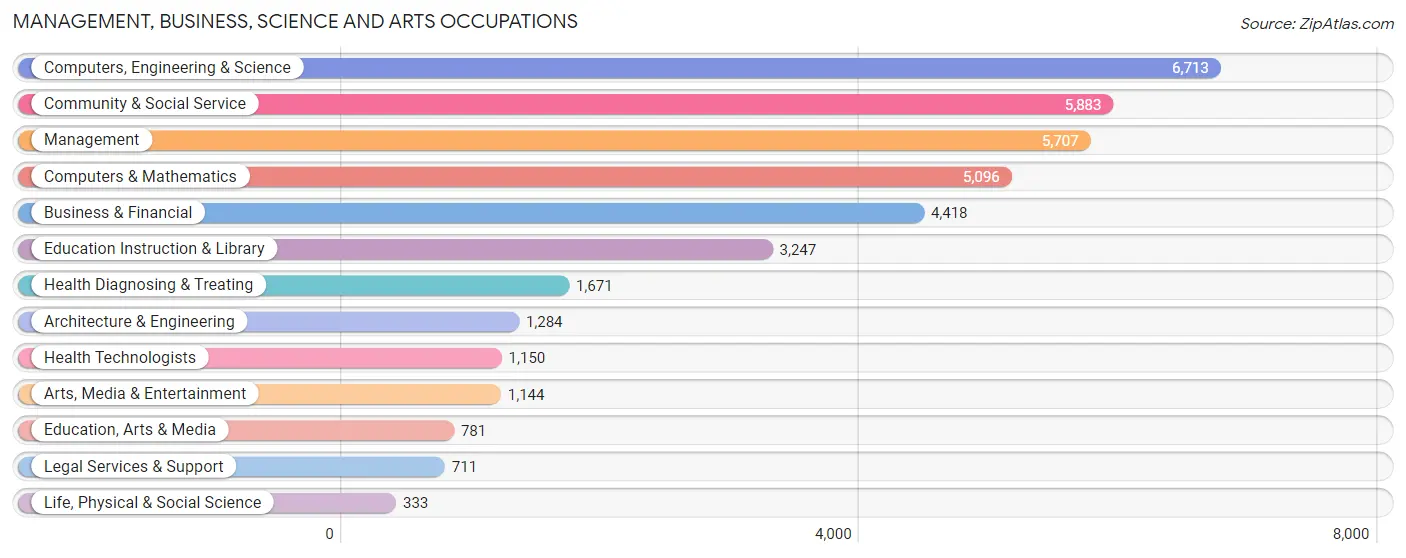
Management, Business, Science and Arts Occupations
The most common Management, Business, Science and Arts occupations in Centreville are Computers, Engineering & Science (6,713 | 16.2%), Community & Social Service (5,883 | 14.2%), Management (5,707 | 13.8%), Computers & Mathematics (5,096 | 12.3%), and Business & Financial (4,418 | 10.6%).
Management, Business, Science and Arts Occupations by Sex
Within the Management, Business, Science and Arts occupations in Centreville, the most male-oriented occupations are Architecture & Engineering (79.7%), Computers, Engineering & Science (73.8%), and Computers & Mathematics (73.5%), while the most female-oriented occupations are Health Technologists (82.3%), Health Diagnosing & Treating (79.6%), and Education Instruction & Library (65.4%).
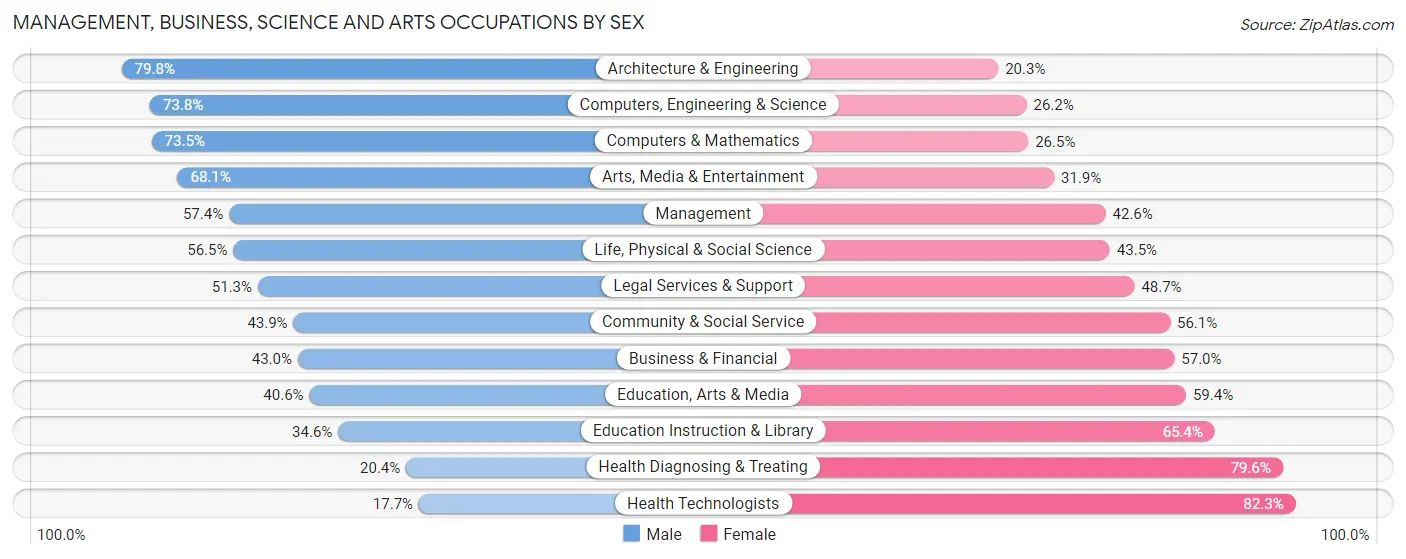
| Occupation | Male | Female |
| Management | 3,274 (57.4%) | 2,433 (42.6%) |
| Business & Financial | 1,900 (43.0%) | 2,518 (57.0%) |
| Computers, Engineering & Science | 4,957 (73.8%) | 1,756 (26.2%) |
| Computers & Mathematics | 3,745 (73.5%) | 1,351 (26.5%) |
| Architecture & Engineering | 1,024 (79.7%) | 260 (20.3%) |
| Life, Physical & Social Science | 188 (56.5%) | 145 (43.5%) |
| Community & Social Service | 2,584 (43.9%) | 3,299 (56.1%) |
| Education, Arts & Media | 317 (40.6%) | 464 (59.4%) |
| Legal Services & Support | 365 (51.3%) | 346 (48.7%) |
| Education Instruction & Library | 1,123 (34.6%) | 2,124 (65.4%) |
| Arts, Media & Entertainment | 779 (68.1%) | 365 (31.9%) |
| Health Diagnosing & Treating | 341 (20.4%) | 1,330 (79.6%) |
| Health Technologists | 204 (17.7%) | 946 (82.3%) |
| Total (Category) | 13,056 (53.5%) | 11,336 (46.5%) |
| Total (Overall) | 22,392 (54.0%) | 19,097 (46.0%) |
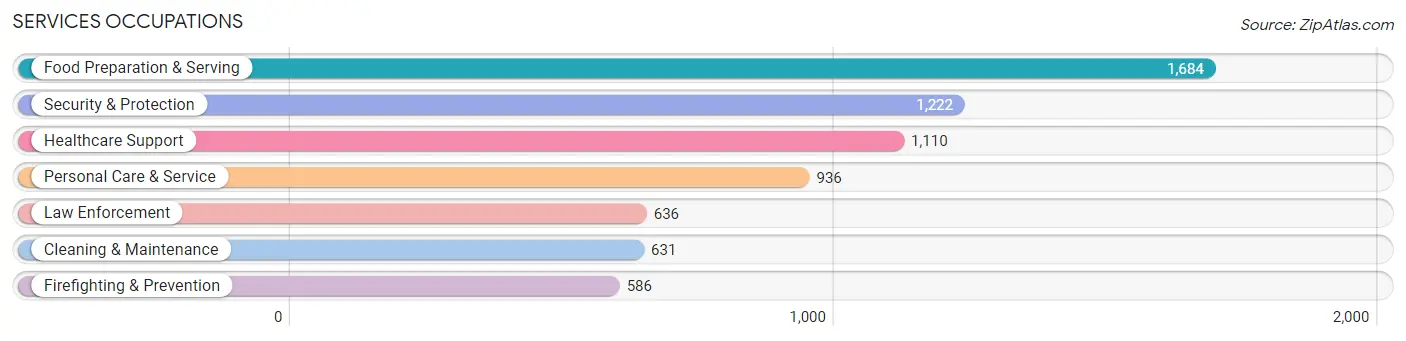
Services Occupations
The most common Services occupations in Centreville are Food Preparation & Serving (1,684 | 4.1%), Security & Protection (1,222 | 2.9%), Healthcare Support (1,110 | 2.7%), Personal Care & Service (936 | 2.3%), and Law Enforcement (636 | 1.5%).
Services Occupations by Sex
Within the Services occupations in Centreville, the most male-oriented occupations are Firefighting & Prevention (72.7%), Security & Protection (72.4%), and Law Enforcement (72.2%), while the most female-oriented occupations are Personal Care & Service (75.6%), Healthcare Support (73.5%), and Cleaning & Maintenance (53.4%).
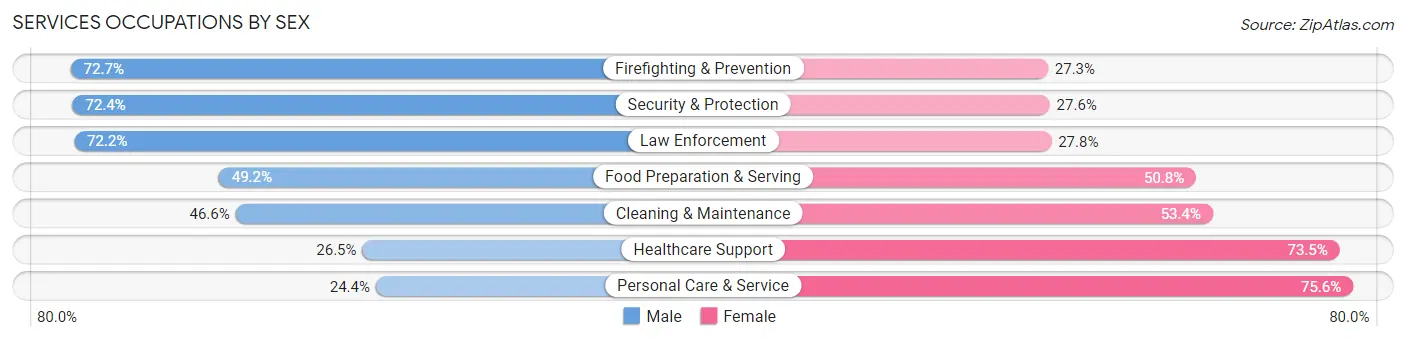
| Occupation | Male | Female |
| Healthcare Support | 294 (26.5%) | 816 (73.5%) |
| Security & Protection | 885 (72.4%) | 337 (27.6%) |
| Firefighting & Prevention | 426 (72.7%) | 160 (27.3%) |
| Law Enforcement | 459 (72.2%) | 177 (27.8%) |
| Food Preparation & Serving | 829 (49.2%) | 855 (50.8%) |
| Cleaning & Maintenance | 294 (46.6%) | 337 (53.4%) |
| Personal Care & Service | 228 (24.4%) | 708 (75.6%) |
| Total (Category) | 2,530 (45.3%) | 3,053 (54.7%) |
| Total (Overall) | 22,392 (54.0%) | 19,097 (46.0%) |
Sales and Office Occupations
The most common Sales and Office occupations in Centreville are Office & Administration (3,702 | 8.9%), and Sales & Related (3,494 | 8.4%).

Sales and Office Occupations by Sex
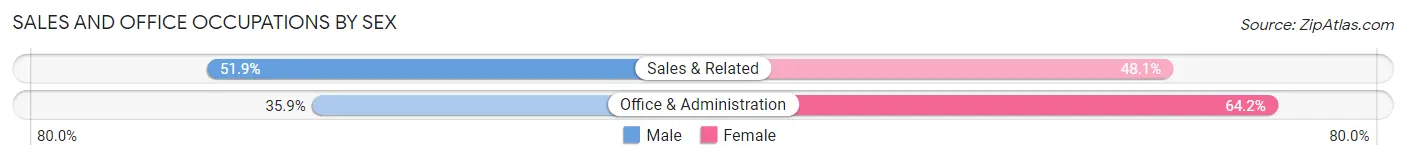
| Occupation | Male | Female |
| Sales & Related | 1,814 (51.9%) | 1,680 (48.1%) |
| Office & Administration | 1,327 (35.8%) | 2,375 (64.1%) |
| Total (Category) | 3,141 (43.6%) | 4,055 (56.4%) |
| Total (Overall) | 22,392 (54.0%) | 19,097 (46.0%) |
Natural Resources, Construction and Maintenance Occupations
The most common Natural Resources, Construction and Maintenance occupations in Centreville are Construction & Extraction (1,246 | 3.0%), and Installation, Maintenance & Repair (555 | 1.3%).

Natural Resources, Construction and Maintenance Occupations by Sex
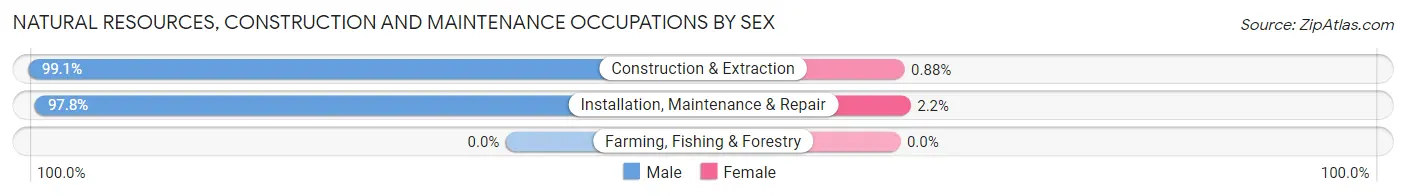
| Occupation | Male | Female |
| Farming, Fishing & Forestry | 0 (0.0%) | 0 (0.0%) |
| Construction & Extraction | 1,235 (99.1%) | 11 (0.9%) |
| Installation, Maintenance & Repair | 543 (97.8%) | 12 (2.2%) |
| Total (Category) | 1,778 (98.7%) | 23 (1.3%) |
| Total (Overall) | 22,392 (54.0%) | 19,097 (46.0%) |
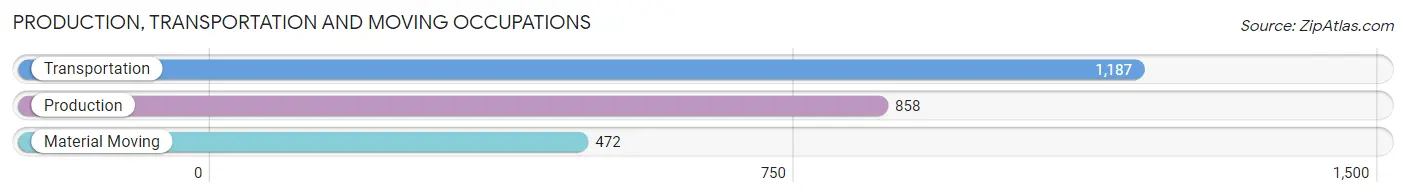
Production, Transportation and Moving Occupations
The most common Production, Transportation and Moving occupations in Centreville are Transportation (1,187 | 2.9%), Production (858 | 2.1%), and Material Moving (472 | 1.1%).
Production, Transportation and Moving Occupations by Sex
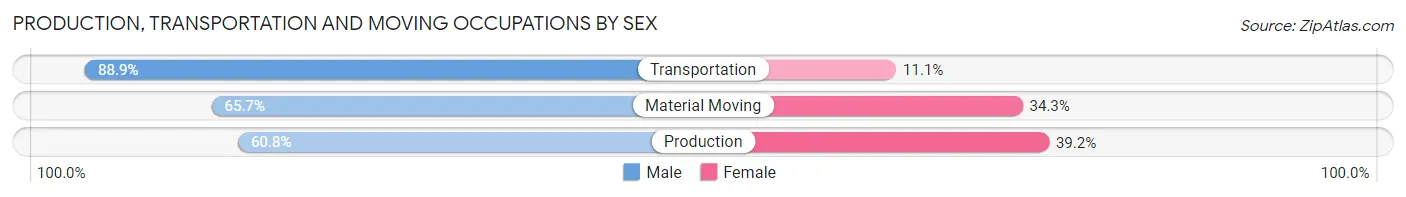
| Occupation | Male | Female |
| Production | 522 (60.8%) | 336 (39.2%) |
| Transportation | 1,055 (88.9%) | 132 (11.1%) |
| Material Moving | 310 (65.7%) | 162 (34.3%) |
| Total (Category) | 1,887 (75.0%) | 630 (25.0%) |
| Total (Overall) | 22,392 (54.0%) | 19,097 (46.0%) |
Employment Industries by Sex in Centreville
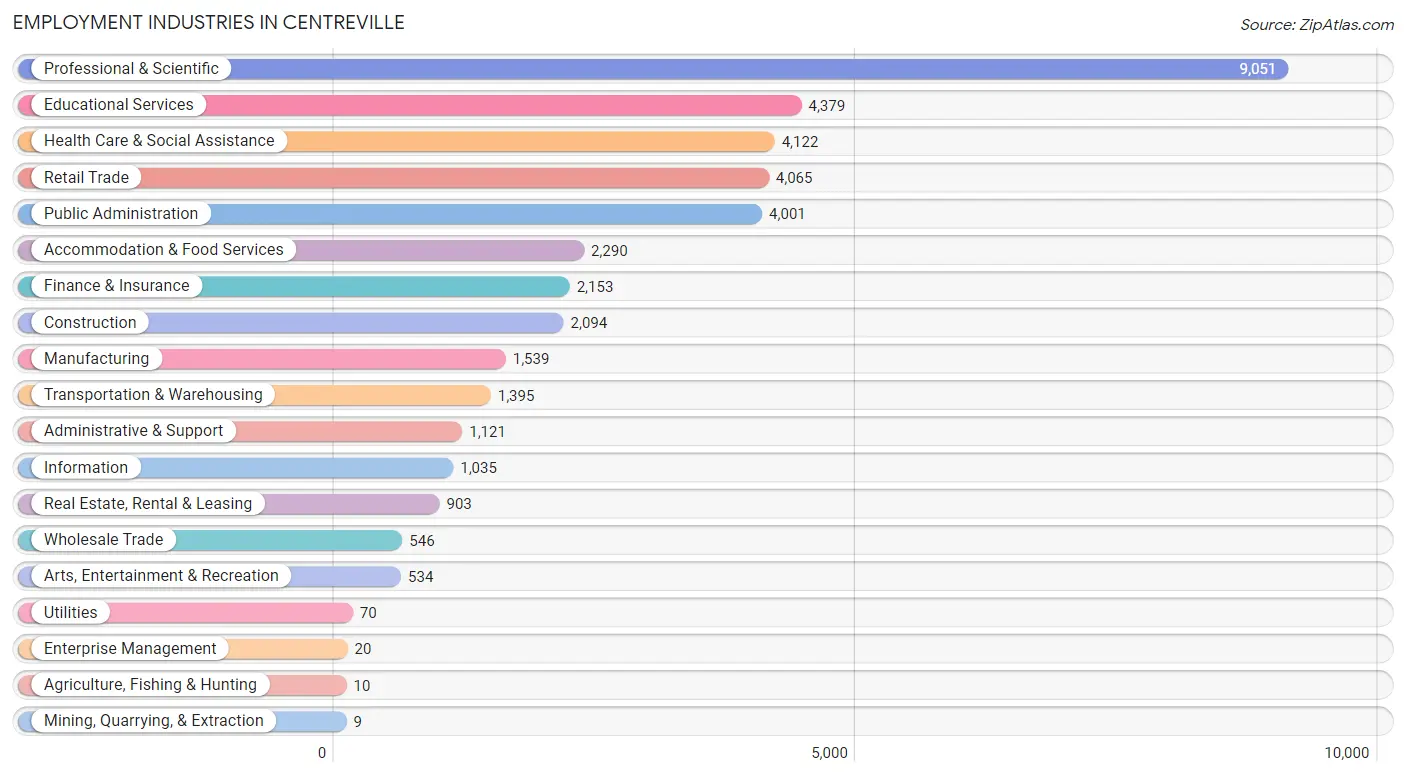
Employment Industries in Centreville
The major employment industries in Centreville include Professional & Scientific (9,051 | 21.8%), Educational Services (4,379 | 10.5%), Health Care & Social Assistance (4,122 | 9.9%), Retail Trade (4,065 | 9.8%), and Public Administration (4,001 | 9.6%).
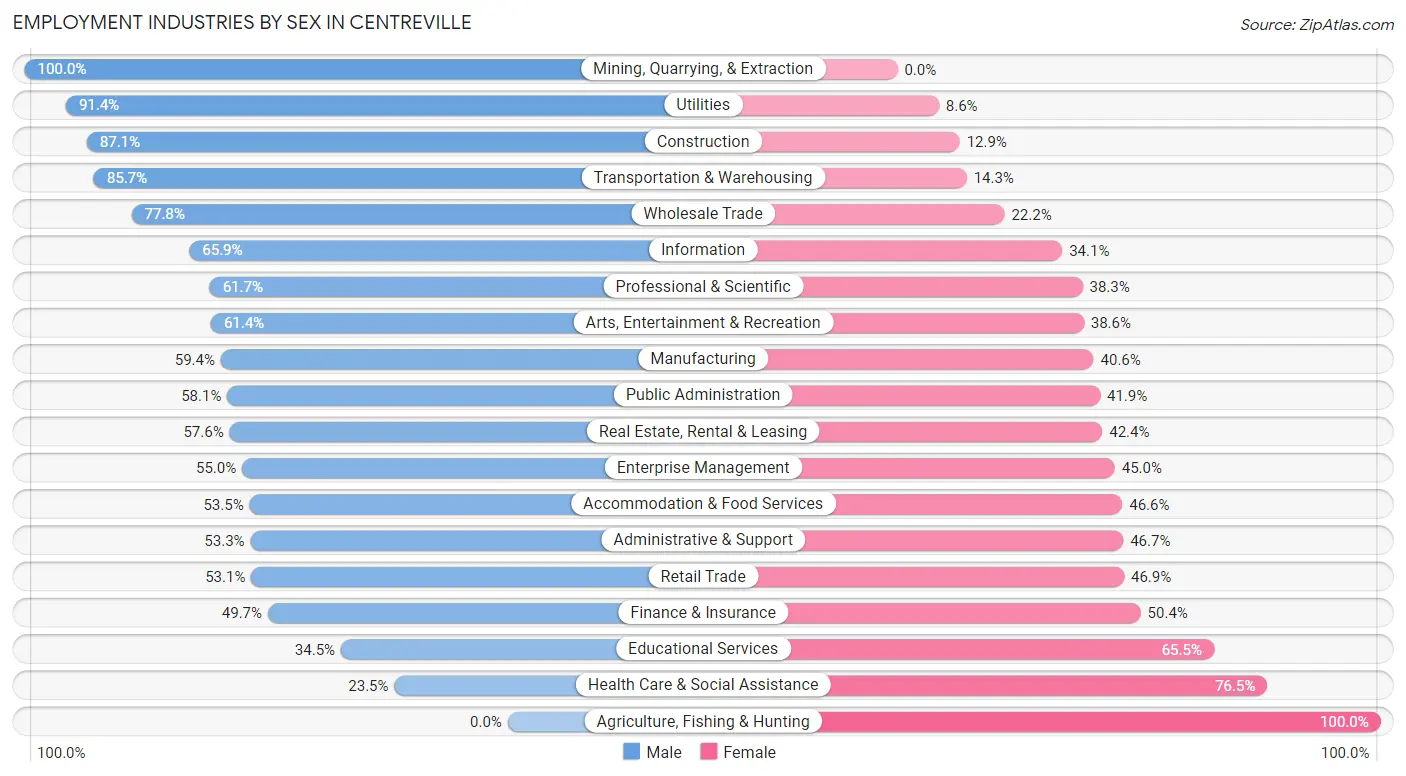
Employment Industries by Sex in Centreville
The Centreville industries that see more men than women are Mining, Quarrying, & Extraction (100.0%), Utilities (91.4%), and Construction (87.1%), whereas the industries that tend to have a higher number of women are Agriculture, Fishing & Hunting (100.0%), Health Care & Social Assistance (76.5%), and Educational Services (65.5%).
| Industry | Male | Female |
| Agriculture, Fishing & Hunting | 0 (0.0%) | 10 (100.0%) |
| Mining, Quarrying, & Extraction | 9 (100.0%) | 0 (0.0%) |
| Construction | 1,824 (87.1%) | 270 (12.9%) |
| Manufacturing | 914 (59.4%) | 625 (40.6%) |
| Wholesale Trade | 425 (77.8%) | 121 (22.2%) |
| Retail Trade | 2,158 (53.1%) | 1,907 (46.9%) |
| Transportation & Warehousing | 1,195 (85.7%) | 200 (14.3%) |
| Utilities | 64 (91.4%) | 6 (8.6%) |
| Information | 682 (65.9%) | 353 (34.1%) |
| Finance & Insurance | 1,069 (49.6%) | 1,084 (50.3%) |
| Real Estate, Rental & Leasing | 520 (57.6%) | 383 (42.4%) |
| Professional & Scientific | 5,583 (61.7%) | 3,468 (38.3%) |
| Enterprise Management | 11 (55.0%) | 9 (45.0%) |
| Administrative & Support | 597 (53.3%) | 524 (46.7%) |
| Educational Services | 1,512 (34.5%) | 2,867 (65.5%) |
| Health Care & Social Assistance | 967 (23.5%) | 3,155 (76.5%) |
| Arts, Entertainment & Recreation | 328 (61.4%) | 206 (38.6%) |
| Accommodation & Food Services | 1,224 (53.4%) | 1,066 (46.6%) |
| Public Administration | 2,323 (58.1%) | 1,678 (41.9%) |
| Total | 22,392 (54.0%) | 19,097 (46.0%) |
Education in Centreville
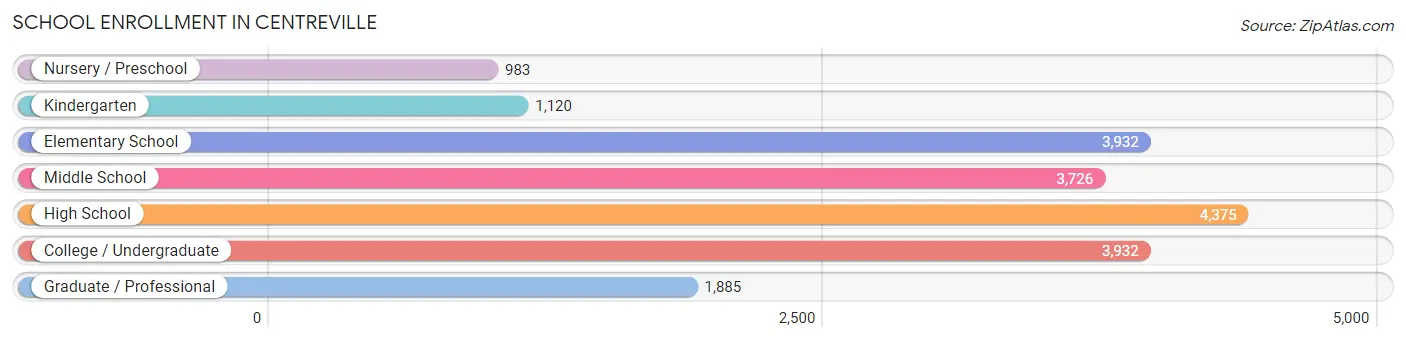
School Enrollment in Centreville
The most common levels of schooling among the 19,953 students in Centreville are high school (4,375 | 21.9%), elementary school (3,932 | 19.7%), and college / undergraduate (3,932 | 19.7%).
| School Level | # Students | % Students |
| Nursery / Preschool | 983 | 4.9% |
| Kindergarten | 1,120 | 5.6% |
| Elementary School | 3,932 | 19.7% |
| Middle School | 3,726 | 18.7% |
| High School | 4,375 | 21.9% |
| College / Undergraduate | 3,932 | 19.7% |
| Graduate / Professional | 1,885 | 9.5% |
| Total | 19,953 | 100.0% |
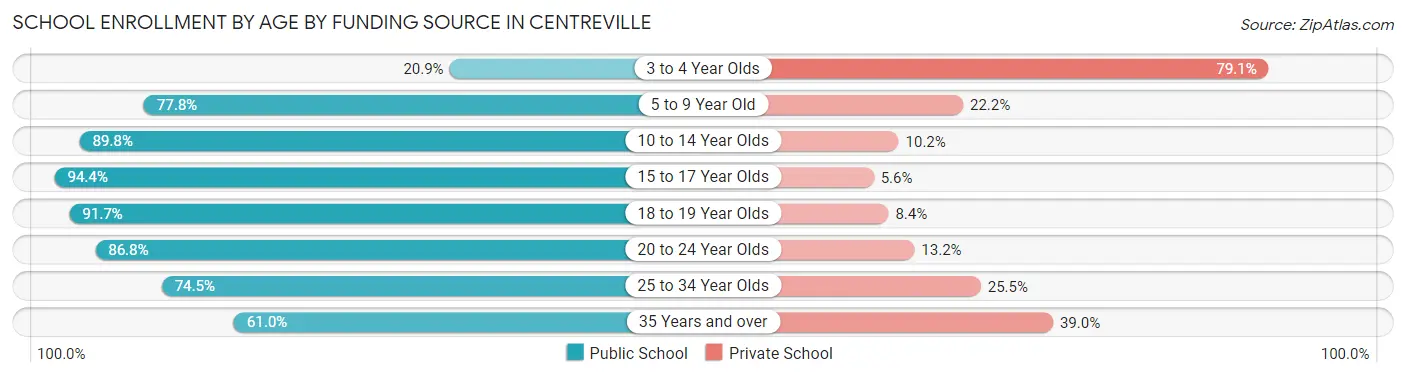
School Enrollment by Age by Funding Source in Centreville
Out of a total of 19,953 students who are enrolled in schools in Centreville, 3,552 (17.8%) attend a private institution, while the remaining 16,401 (82.2%) are enrolled in public schools. The age group of 3 to 4 year olds has the highest likelihood of being enrolled in private schools, with 527 (79.1% in the age bracket) enrolled. Conversely, the age group of 15 to 17 year olds has the lowest likelihood of being enrolled in a private school, with 2,820 (94.4% in the age bracket) attending a public institution.
| Age Bracket | Public School | Private School |
| 3 to 4 Year Olds | 139 (20.9%) | 527 (79.1%) |
| 5 to 9 Year Old | 3,750 (77.8%) | 1,072 (22.2%) |
| 10 to 14 Year Olds | 4,204 (89.8%) | 479 (10.2%) |
| 15 to 17 Year Olds | 2,820 (94.4%) | 167 (5.6%) |
| 18 to 19 Year Olds | 1,536 (91.6%) | 140 (8.4%) |
| 20 to 24 Year Olds | 1,976 (86.8%) | 300 (13.2%) |
| 25 to 34 Year Olds | 1,353 (74.5%) | 464 (25.5%) |
| 35 Years and over | 626 (61.0%) | 400 (39.0%) |
| Total | 16,401 (82.2%) | 3,552 (17.8%) |
Educational Attainment by Field of Study in Centreville
Business (6,078 | 19.7%), engineering (3,408 | 11.1%), social sciences (3,305 | 10.7%), computers & mathematics (3,103 | 10.1%), and science & technology (2,163 | 7.0%) are the most common fields of study among 30,789 individuals in Centreville who have obtained a bachelor's degree or higher.
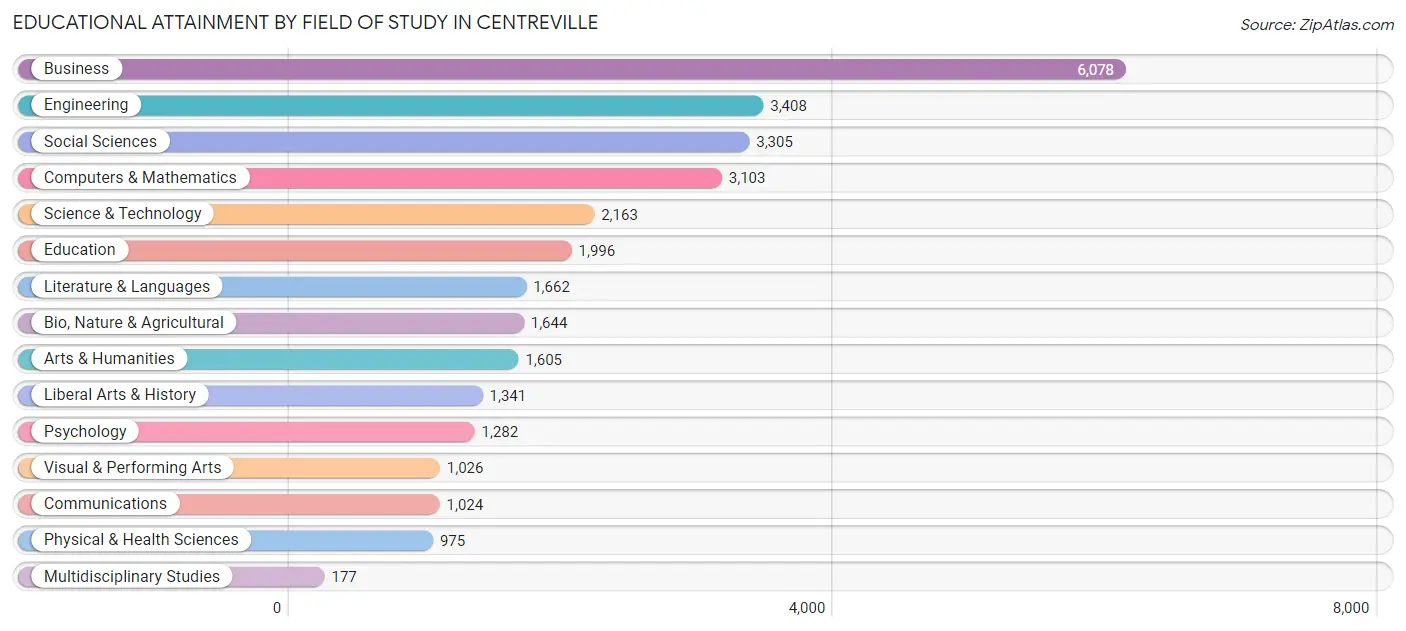
| Field of Study | # Graduates | % Graduates |
| Computers & Mathematics | 3,103 | 10.1% |
| Bio, Nature & Agricultural | 1,644 | 5.3% |
| Physical & Health Sciences | 975 | 3.2% |
| Psychology | 1,282 | 4.2% |
| Social Sciences | 3,305 | 10.7% |
| Engineering | 3,408 | 11.1% |
| Multidisciplinary Studies | 177 | 0.6% |
| Science & Technology | 2,163 | 7.0% |
| Business | 6,078 | 19.7% |
| Education | 1,996 | 6.5% |
| Literature & Languages | 1,662 | 5.4% |
| Liberal Arts & History | 1,341 | 4.4% |
| Visual & Performing Arts | 1,026 | 3.3% |
| Communications | 1,024 | 3.3% |
| Arts & Humanities | 1,605 | 5.2% |
| Total | 30,789 | 100.0% |
Transportation & Commute in Centreville
Vehicle Availability by Sex in Centreville
The most prevalent vehicle ownership categories in Centreville are males with 2 vehicles (10,676, accounting for 48.2%) and females with 2 vehicles (8,833, making up 57.1%).
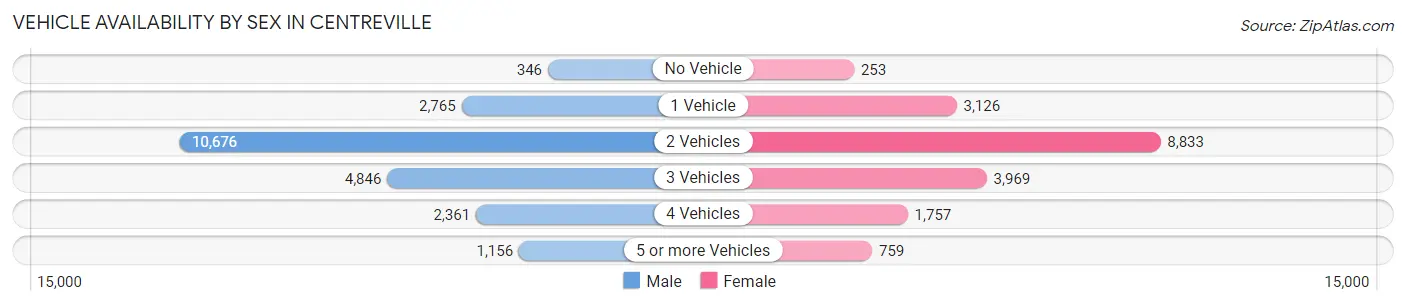
| Vehicles Available | Male | Female |
| No Vehicle | 346 (1.6%) | 253 (1.3%) |
| 1 Vehicle | 2,765 (12.5%) | 3,126 (16.7%) |
| 2 Vehicles | 10,676 (48.2%) | 8,833 (47.2%) |
| 3 Vehicles | 4,846 (21.9%) | 3,969 (21.2%) |
| 4 Vehicles | 2,361 (10.7%) | 1,757 (9.4%) |
| 5 or more Vehicles | 1,156 (5.2%) | 759 (4.1%) |
| Total | 22,150 (100.0%) | 18,697 (100.0%) |
Commute Time in Centreville
The most frequently occuring commute durations in Centreville are 30 to 34 minutes (5,608 commuters, 16.6%), 15 to 19 minutes (5,061 commuters, 15.0%), and 20 to 24 minutes (4,694 commuters, 13.9%).
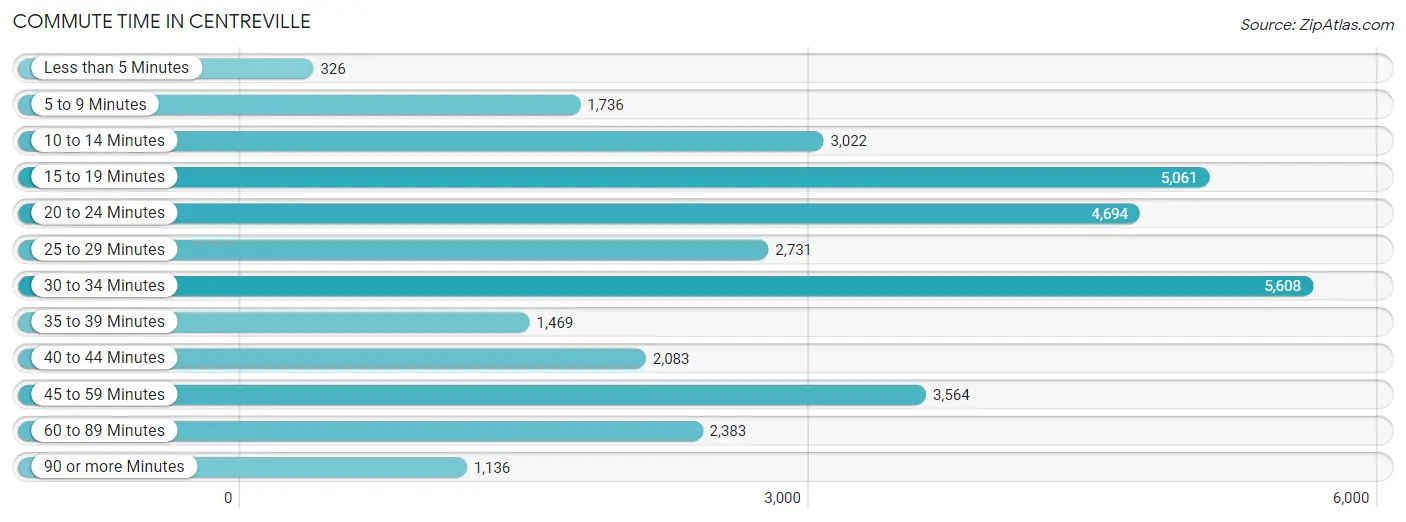
| Commute Time | # Commuters | % Commuters |
| Less than 5 Minutes | 326 | 1.0% |
| 5 to 9 Minutes | 1,736 | 5.1% |
| 10 to 14 Minutes | 3,022 | 8.9% |
| 15 to 19 Minutes | 5,061 | 15.0% |
| 20 to 24 Minutes | 4,694 | 13.9% |
| 25 to 29 Minutes | 2,731 | 8.1% |
| 30 to 34 Minutes | 5,608 | 16.6% |
| 35 to 39 Minutes | 1,469 | 4.3% |
| 40 to 44 Minutes | 2,083 | 6.2% |
| 45 to 59 Minutes | 3,564 | 10.5% |
| 60 to 89 Minutes | 2,383 | 7.0% |
| 90 or more Minutes | 1,136 | 3.4% |
Commute Time by Sex in Centreville
The most common commute times in Centreville are 30 to 34 minutes (3,317 commuters, 18.1%) for males and 15 to 19 minutes (2,678 commuters, 17.3%) for females.
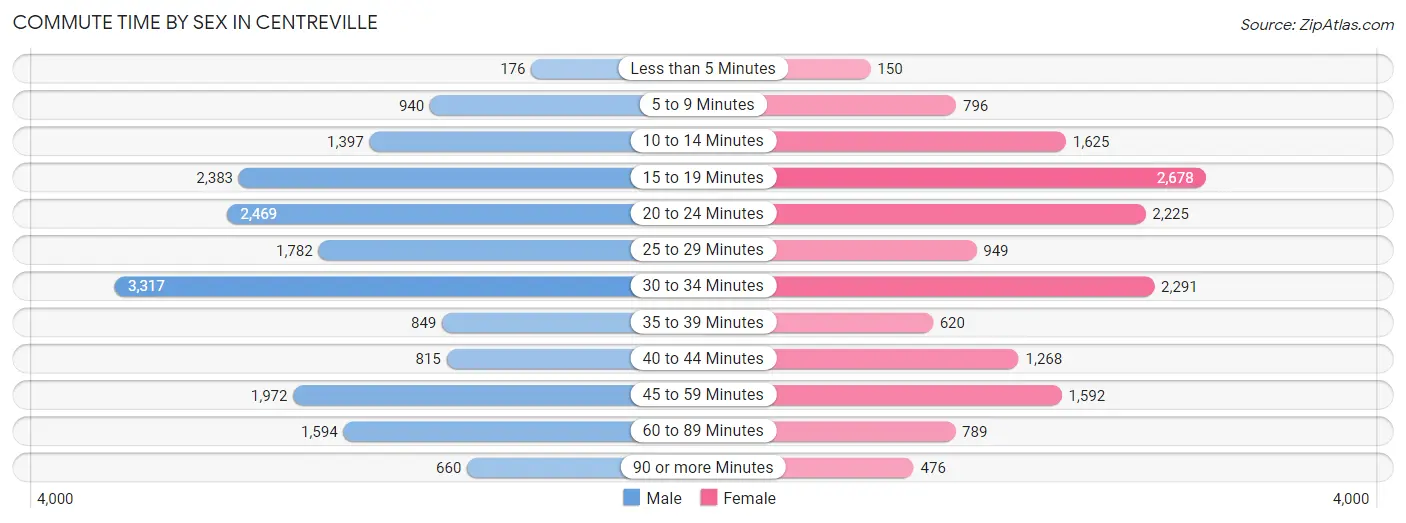
| Commute Time | Male | Female |
| Less than 5 Minutes | 176 (1.0%) | 150 (1.0%) |
| 5 to 9 Minutes | 940 (5.1%) | 796 (5.1%) |
| 10 to 14 Minutes | 1,397 (7.6%) | 1,625 (10.5%) |
| 15 to 19 Minutes | 2,383 (13.0%) | 2,678 (17.3%) |
| 20 to 24 Minutes | 2,469 (13.5%) | 2,225 (14.4%) |
| 25 to 29 Minutes | 1,782 (9.7%) | 949 (6.1%) |
| 30 to 34 Minutes | 3,317 (18.1%) | 2,291 (14.8%) |
| 35 to 39 Minutes | 849 (4.6%) | 620 (4.0%) |
| 40 to 44 Minutes | 815 (4.4%) | 1,268 (8.2%) |
| 45 to 59 Minutes | 1,972 (10.7%) | 1,592 (10.3%) |
| 60 to 89 Minutes | 1,594 (8.7%) | 789 (5.1%) |
| 90 or more Minutes | 660 (3.6%) | 476 (3.1%) |
Time of Departure to Work by Sex in Centreville
The most frequent times of departure to work in Centreville are 7:00 AM to 7:29 AM (2,485, 13.5%) for males and 9:00 AM to 9:59 AM (2,019, 13.1%) for females.
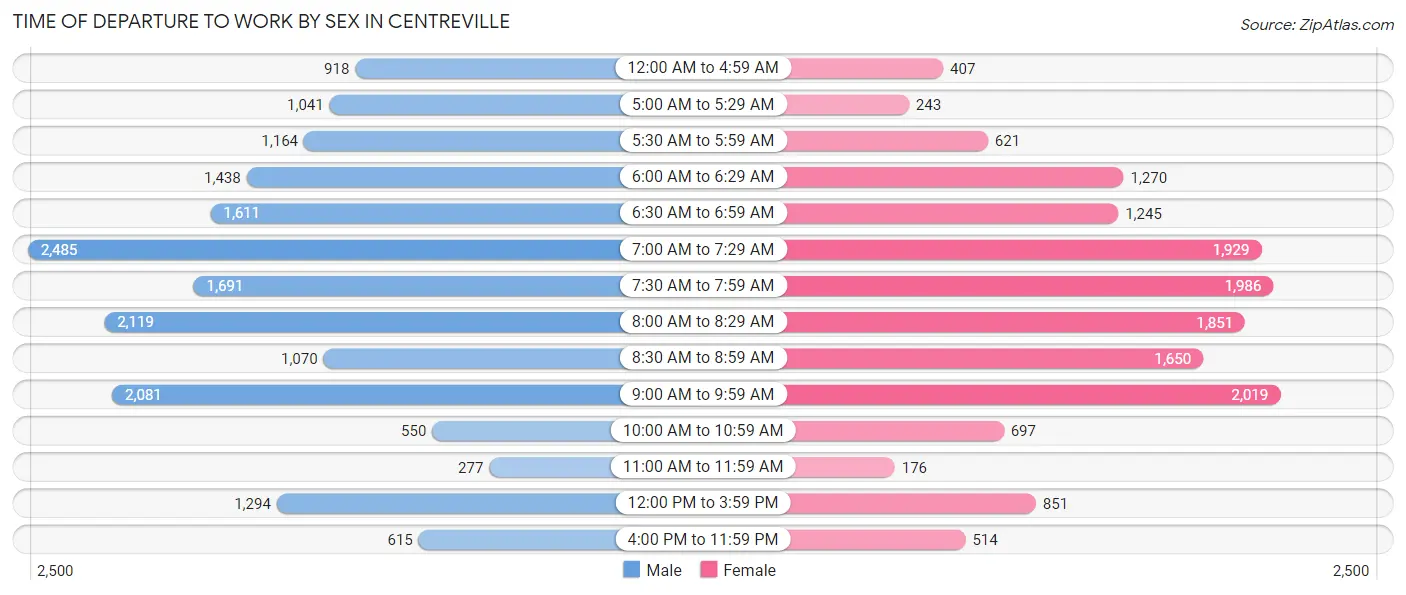
| Time of Departure | Male | Female |
| 12:00 AM to 4:59 AM | 918 (5.0%) | 407 (2.6%) |
| 5:00 AM to 5:29 AM | 1,041 (5.7%) | 243 (1.6%) |
| 5:30 AM to 5:59 AM | 1,164 (6.3%) | 621 (4.0%) |
| 6:00 AM to 6:29 AM | 1,438 (7.8%) | 1,270 (8.2%) |
| 6:30 AM to 6:59 AM | 1,611 (8.8%) | 1,245 (8.1%) |
| 7:00 AM to 7:29 AM | 2,485 (13.5%) | 1,929 (12.5%) |
| 7:30 AM to 7:59 AM | 1,691 (9.2%) | 1,986 (12.9%) |
| 8:00 AM to 8:29 AM | 2,119 (11.6%) | 1,851 (12.0%) |
| 8:30 AM to 8:59 AM | 1,070 (5.8%) | 1,650 (10.7%) |
| 9:00 AM to 9:59 AM | 2,081 (11.3%) | 2,019 (13.1%) |
| 10:00 AM to 10:59 AM | 550 (3.0%) | 697 (4.5%) |
| 11:00 AM to 11:59 AM | 277 (1.5%) | 176 (1.1%) |
| 12:00 PM to 3:59 PM | 1,294 (7.0%) | 851 (5.5%) |
| 4:00 PM to 11:59 PM | 615 (3.4%) | 514 (3.3%) |
| Total | 18,354 (100.0%) | 15,459 (100.0%) |
Housing Occupancy in Centreville
Occupancy by Ownership in Centreville
Of the total 24,950 dwellings in Centreville, owner-occupied units account for 18,364 (73.6%), while renter-occupied units make up 6,586 (26.4%).
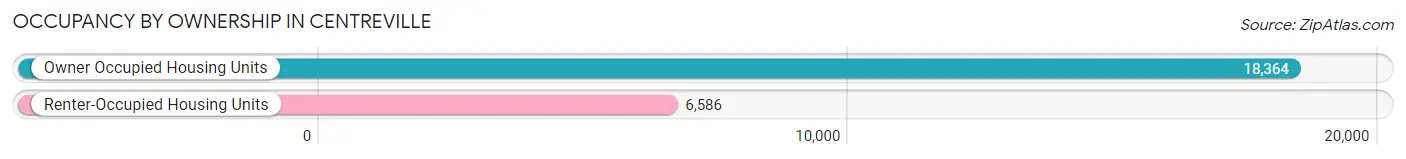
| Occupancy | # Housing Units | % Housing Units |
| Owner Occupied Housing Units | 18,364 | 73.6% |
| Renter-Occupied Housing Units | 6,586 | 26.4% |
| Total Occupied Housing Units | 24,950 | 100.0% |
Occupancy by Household Size in Centreville
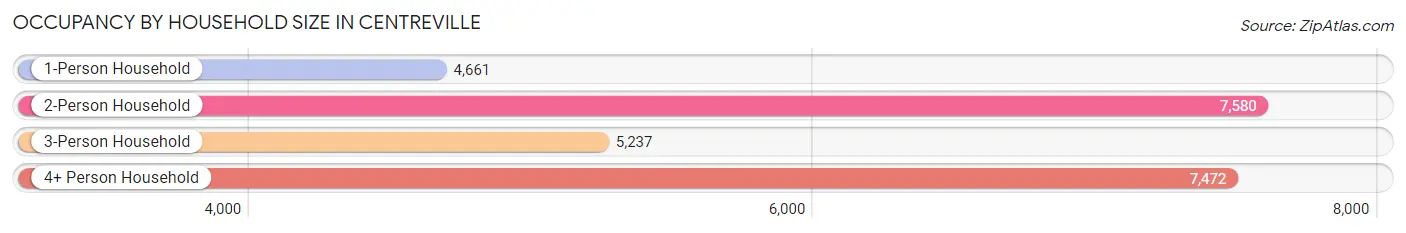
| Household Size | # Housing Units | % Housing Units |
| 1-Person Household | 4,661 | 18.7% |
| 2-Person Household | 7,580 | 30.4% |
| 3-Person Household | 5,237 | 21.0% |
| 4+ Person Household | 7,472 | 29.9% |
| Total Housing Units | 24,950 | 100.0% |
Occupancy by Ownership by Household Size in Centreville
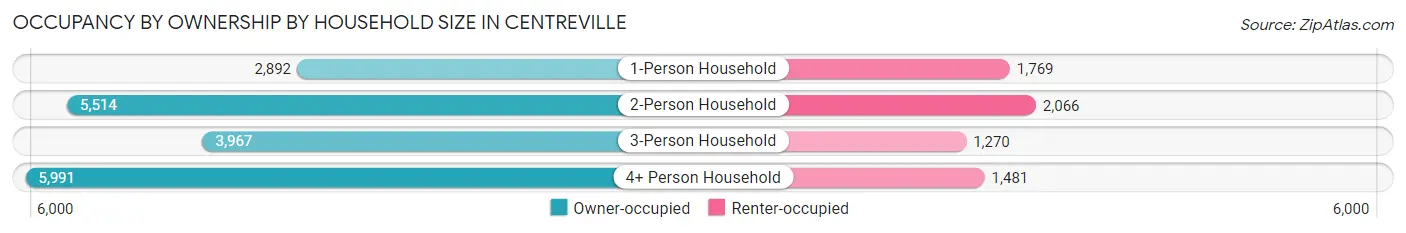
| Household Size | Owner-occupied | Renter-occupied |
| 1-Person Household | 2,892 (62.1%) | 1,769 (38.0%) |
| 2-Person Household | 5,514 (72.7%) | 2,066 (27.3%) |
| 3-Person Household | 3,967 (75.7%) | 1,270 (24.2%) |
| 4+ Person Household | 5,991 (80.2%) | 1,481 (19.8%) |
| Total Housing Units | 18,364 (73.6%) | 6,586 (26.4%) |
Occupancy by Educational Attainment in Centreville
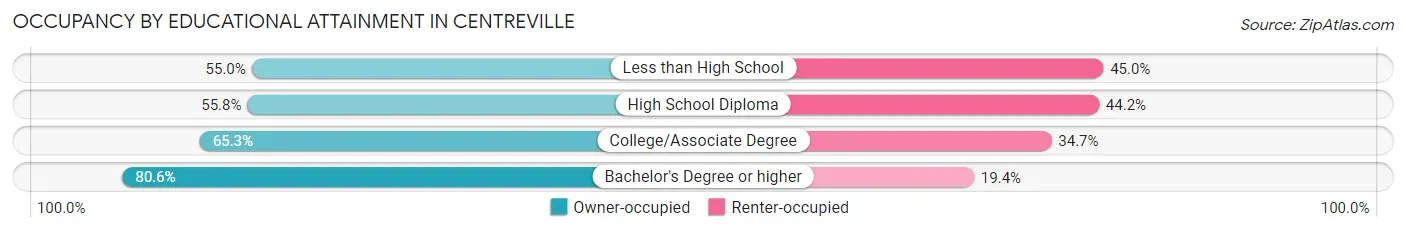
| Household Size | Owner-occupied | Renter-occupied |
| Less than High School | 452 (55.0%) | 370 (45.0%) |
| High School Diploma | 1,746 (55.8%) | 1,381 (44.2%) |
| College/Associate Degree | 3,249 (65.3%) | 1,729 (34.7%) |
| Bachelor's Degree or higher | 12,917 (80.6%) | 3,106 (19.4%) |
Occupancy by Age of Householder in Centreville
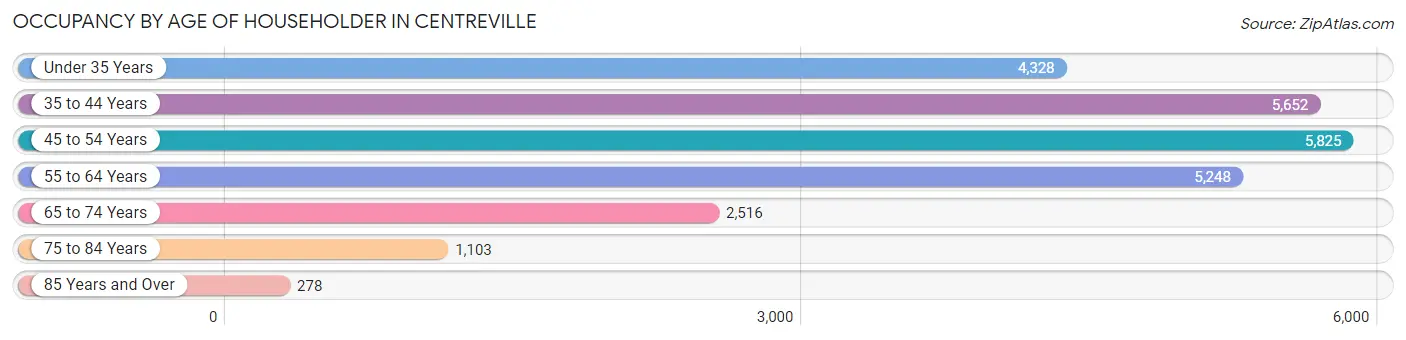
| Age Bracket | # Households | % Households |
| Under 35 Years | 4,328 | 17.3% |
| 35 to 44 Years | 5,652 | 22.7% |
| 45 to 54 Years | 5,825 | 23.4% |
| 55 to 64 Years | 5,248 | 21.0% |
| 65 to 74 Years | 2,516 | 10.1% |
| 75 to 84 Years | 1,103 | 4.4% |
| 85 Years and Over | 278 | 1.1% |
| Total | 24,950 | 100.0% |
Housing Finances in Centreville
Median Income by Occupancy in Centreville
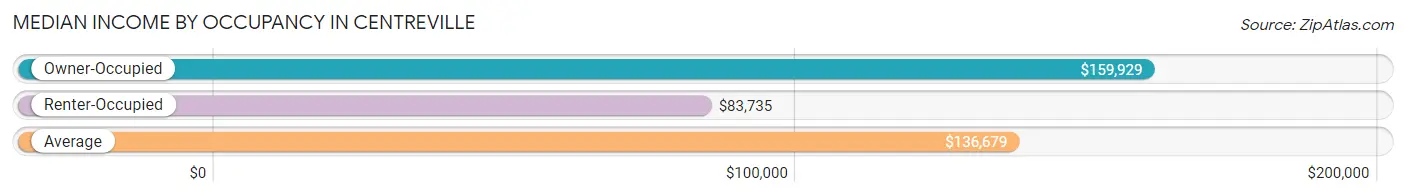
| Occupancy Type | # Households | Median Income |
| Owner-Occupied | 18,364 (73.6%) | $159,929 |
| Renter-Occupied | 6,586 (26.4%) | $83,735 |
| Average | 24,950 (100.0%) | $136,679 |
Occupancy by Householder Income Bracket in Centreville
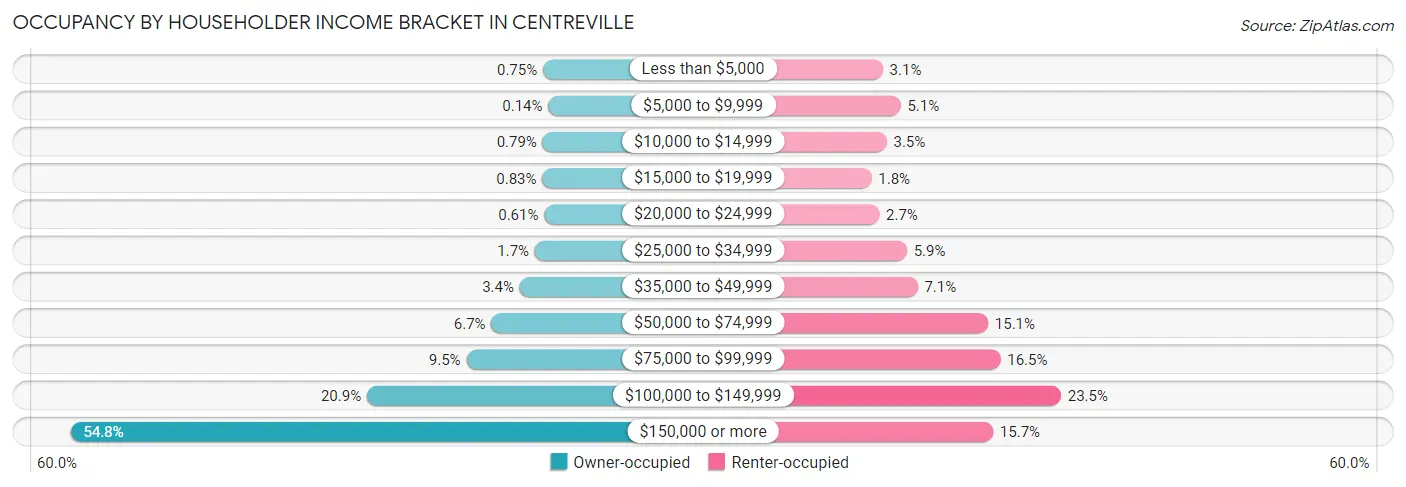
| Income Bracket | Owner-occupied | Renter-occupied |
| Less than $5,000 | 137 (0.7%) | 204 (3.1%) |
| $5,000 to $9,999 | 25 (0.1%) | 338 (5.1%) |
| $10,000 to $14,999 | 145 (0.8%) | 233 (3.5%) |
| $15,000 to $19,999 | 153 (0.8%) | 119 (1.8%) |
| $20,000 to $24,999 | 112 (0.6%) | 177 (2.7%) |
| $25,000 to $34,999 | 308 (1.7%) | 385 (5.9%) |
| $35,000 to $49,999 | 626 (3.4%) | 466 (7.1%) |
| $50,000 to $74,999 | 1,222 (6.7%) | 996 (15.1%) |
| $75,000 to $99,999 | 1,745 (9.5%) | 1,089 (16.5%) |
| $100,000 to $149,999 | 3,833 (20.9%) | 1,545 (23.5%) |
| $150,000 or more | 10,058 (54.8%) | 1,034 (15.7%) |
| Total | 18,364 (100.0%) | 6,586 (100.0%) |
Monthly Housing Cost Tiers in Centreville
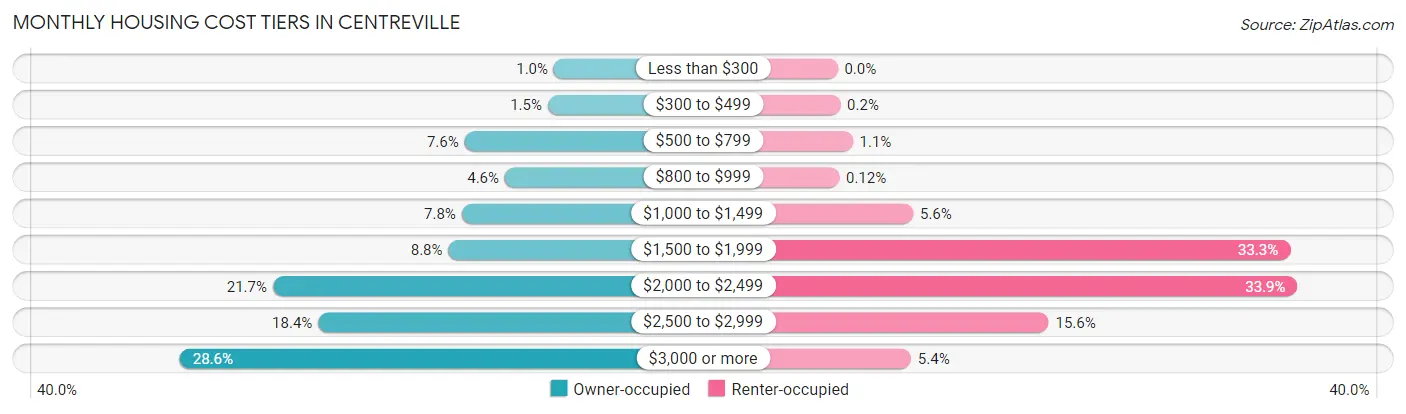
| Monthly Cost | Owner-occupied | Renter-occupied |
| Less than $300 | 188 (1.0%) | 0 (0.0%) |
| $300 to $499 | 270 (1.5%) | 13 (0.2%) |
| $500 to $799 | 1,396 (7.6%) | 74 (1.1%) |
| $800 to $999 | 850 (4.6%) | 8 (0.1%) |
| $1,000 to $1,499 | 1,434 (7.8%) | 367 (5.6%) |
| $1,500 to $1,999 | 1,615 (8.8%) | 2,195 (33.3%) |
| $2,000 to $2,499 | 3,988 (21.7%) | 2,231 (33.9%) |
| $2,500 to $2,999 | 3,376 (18.4%) | 1,024 (15.5%) |
| $3,000 or more | 5,247 (28.6%) | 356 (5.4%) |
| Total | 18,364 (100.0%) | 6,586 (100.0%) |
Physical Housing Characteristics in Centreville
Housing Structures in Centreville
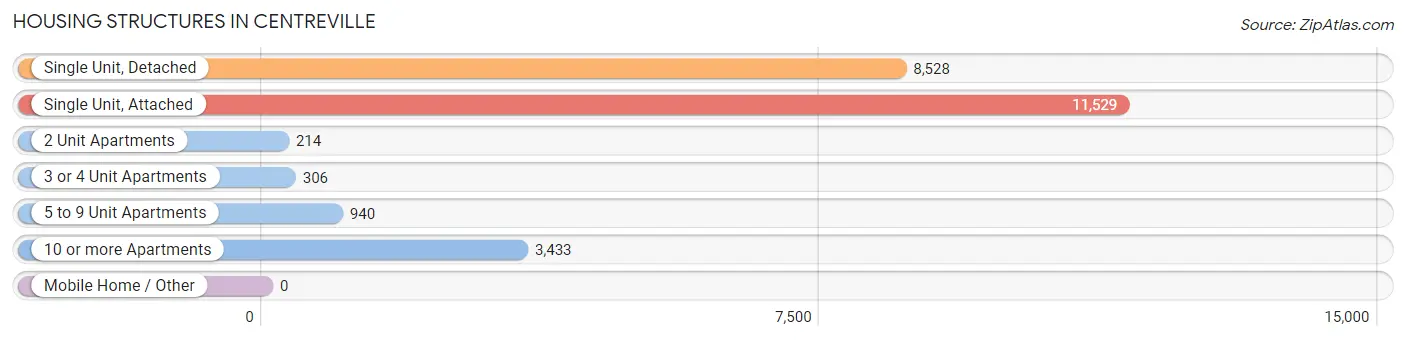
| Structure Type | # Housing Units | % Housing Units |
| Single Unit, Detached | 8,528 | 34.2% |
| Single Unit, Attached | 11,529 | 46.2% |
| 2 Unit Apartments | 214 | 0.9% |
| 3 or 4 Unit Apartments | 306 | 1.2% |
| 5 to 9 Unit Apartments | 940 | 3.8% |
| 10 or more Apartments | 3,433 | 13.8% |
| Mobile Home / Other | 0 | 0.0% |
| Total | 24,950 | 100.0% |
Housing Structures by Occupancy in Centreville
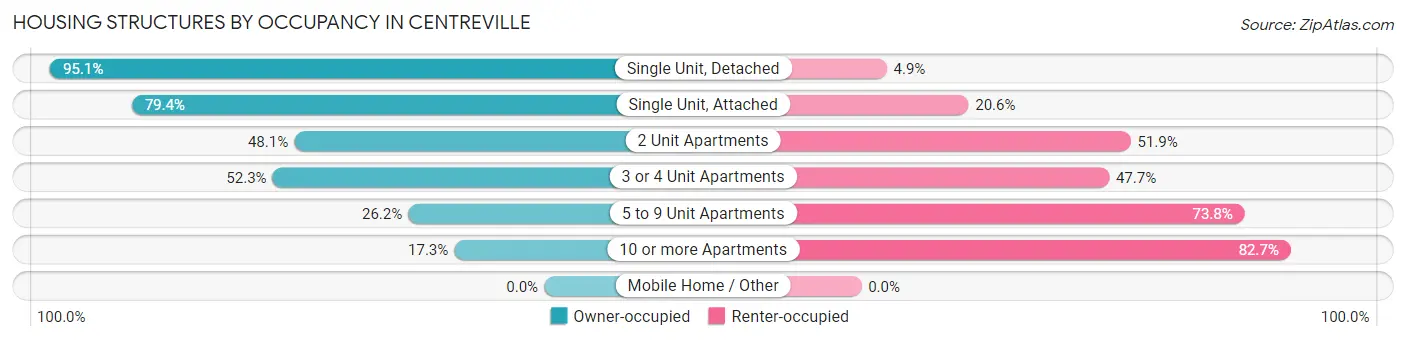
| Structure Type | Owner-occupied | Renter-occupied |
| Single Unit, Detached | 8,111 (95.1%) | 417 (4.9%) |
| Single Unit, Attached | 9,150 (79.4%) | 2,379 (20.6%) |
| 2 Unit Apartments | 103 (48.1%) | 111 (51.9%) |
| 3 or 4 Unit Apartments | 160 (52.3%) | 146 (47.7%) |
| 5 to 9 Unit Apartments | 246 (26.2%) | 694 (73.8%) |
| 10 or more Apartments | 594 (17.3%) | 2,839 (82.7%) |
| Mobile Home / Other | 0 (0.0%) | 0 (0.0%) |
| Total | 18,364 (73.6%) | 6,586 (26.4%) |
Housing Structures by Number of Rooms in Centreville
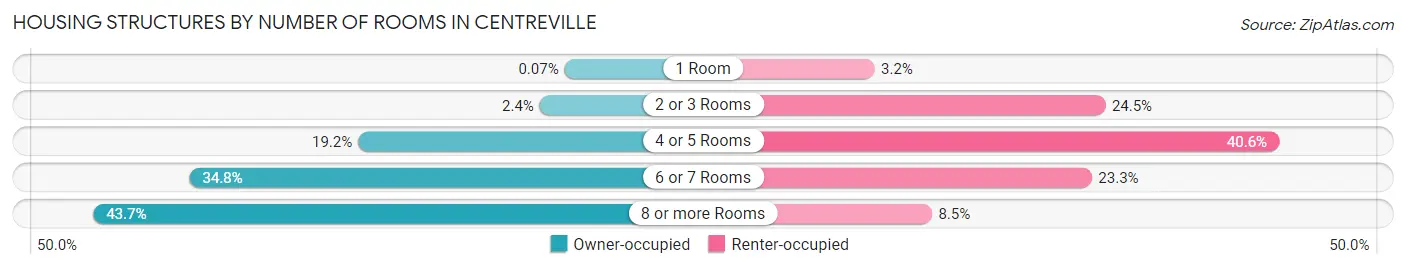
| Number of Rooms | Owner-occupied | Renter-occupied |
| 1 Room | 13 (0.1%) | 208 (3.2%) |
| 2 or 3 Rooms | 434 (2.4%) | 1,614 (24.5%) |
| 4 or 5 Rooms | 3,518 (19.2%) | 2,674 (40.6%) |
| 6 or 7 Rooms | 6,383 (34.8%) | 1,532 (23.3%) |
| 8 or more Rooms | 8,016 (43.6%) | 558 (8.5%) |
| Total | 18,364 (100.0%) | 6,586 (100.0%) |
Housing Structure by Heating Type in Centreville
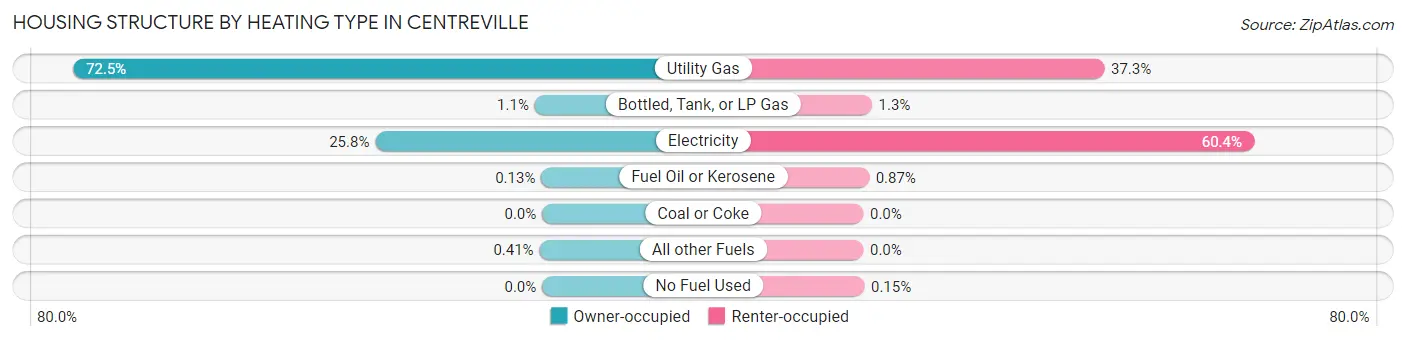
| Heating Type | Owner-occupied | Renter-occupied |
| Utility Gas | 13,318 (72.5%) | 2,454 (37.3%) |
| Bottled, Tank, or LP Gas | 210 (1.1%) | 87 (1.3%) |
| Electricity | 4,737 (25.8%) | 3,978 (60.4%) |
| Fuel Oil or Kerosene | 24 (0.1%) | 57 (0.9%) |
| Coal or Coke | 0 (0.0%) | 0 (0.0%) |
| All other Fuels | 75 (0.4%) | 0 (0.0%) |
| No Fuel Used | 0 (0.0%) | 10 (0.2%) |
| Total | 18,364 (100.0%) | 6,586 (100.0%) |
Household Vehicle Usage in Centreville
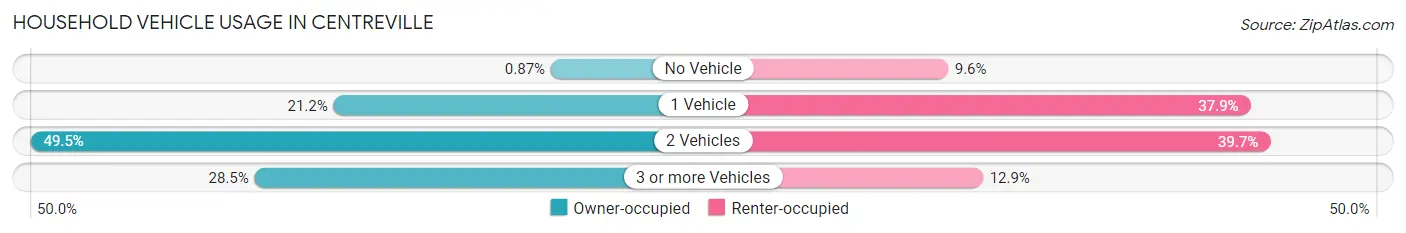
| Vehicles per Household | Owner-occupied | Renter-occupied |
| No Vehicle | 159 (0.9%) | 632 (9.6%) |
| 1 Vehicle | 3,885 (21.2%) | 2,493 (37.9%) |
| 2 Vehicles | 9,081 (49.4%) | 2,614 (39.7%) |
| 3 or more Vehicles | 5,239 (28.5%) | 847 (12.9%) |
| Total | 18,364 (100.0%) | 6,586 (100.0%) |
Real Estate & Mortgages in Centreville
Real Estate and Mortgage Overview in Centreville
| Characteristic | Without Mortgage | With Mortgage |
| Housing Units | 3,520 | 14,844 |
| Median Property Value | $492,600 | $539,000 |
| Median Household Income | $128,589 | $8,534 |
| Monthly Housing Costs | $795 | $5,247 |
| Real Estate Taxes | $5,774 | $461 |
Property Value by Mortgage Status in Centreville
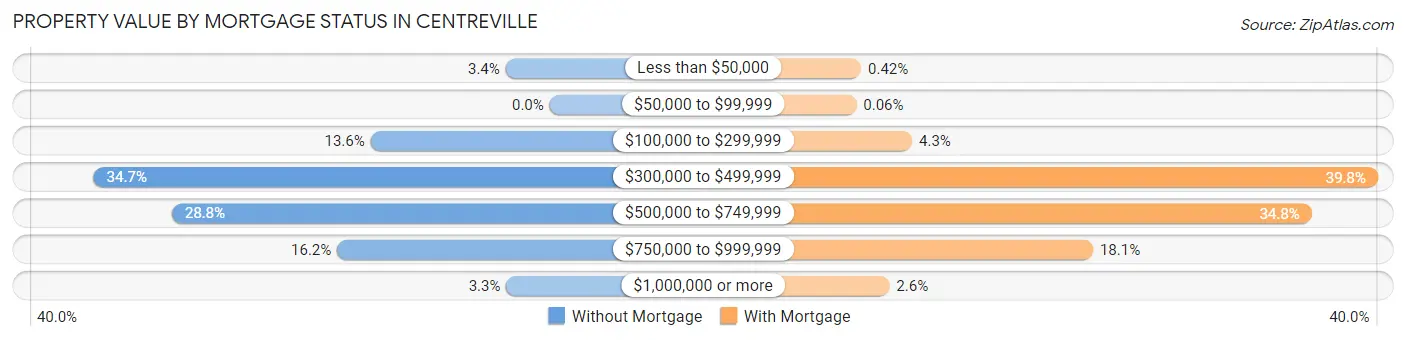
| Property Value | Without Mortgage | With Mortgage |
| Less than $50,000 | 118 (3.4%) | 62 (0.4%) |
| $50,000 to $99,999 | 0 (0.0%) | 9 (0.1%) |
| $100,000 to $299,999 | 480 (13.6%) | 640 (4.3%) |
| $300,000 to $499,999 | 1,223 (34.7%) | 5,907 (39.8%) |
| $500,000 to $749,999 | 1,013 (28.8%) | 5,158 (34.7%) |
| $750,000 to $999,999 | 570 (16.2%) | 2,685 (18.1%) |
| $1,000,000 or more | 116 (3.3%) | 383 (2.6%) |
| Total | 3,520 (100.0%) | 14,844 (100.0%) |
Household Income by Mortgage Status in Centreville
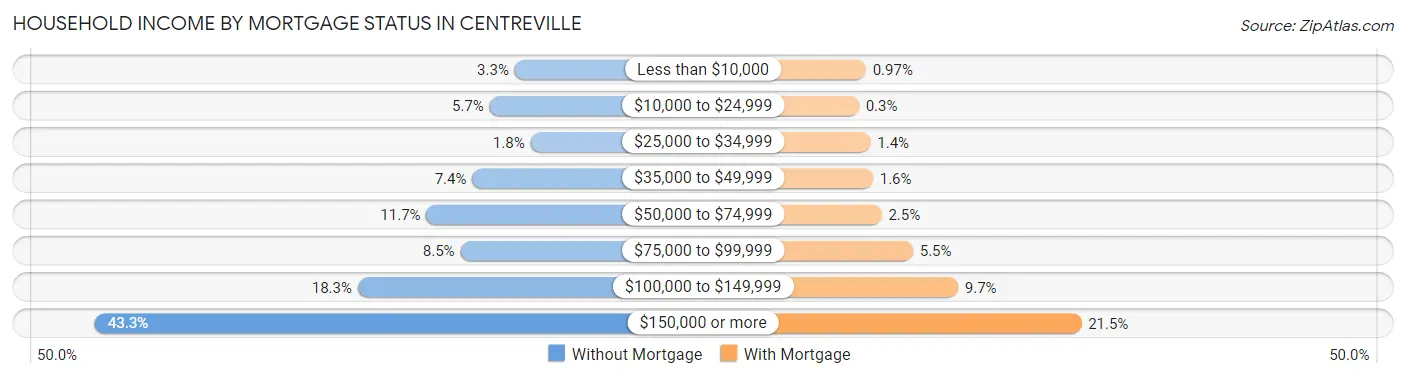
| Household Income | Without Mortgage | With Mortgage |
| Less than $10,000 | 117 (3.3%) | 144 (1.0%) |
| $10,000 to $24,999 | 201 (5.7%) | 45 (0.3%) |
| $25,000 to $34,999 | 64 (1.8%) | 209 (1.4%) |
| $35,000 to $49,999 | 259 (7.4%) | 244 (1.6%) |
| $50,000 to $74,999 | 413 (11.7%) | 367 (2.5%) |
| $75,000 to $99,999 | 299 (8.5%) | 809 (5.4%) |
| $100,000 to $149,999 | 643 (18.3%) | 1,446 (9.7%) |
| $150,000 or more | 1,524 (43.3%) | 3,190 (21.5%) |
| Total | 3,520 (100.0%) | 14,844 (100.0%) |
Property Value to Household Income Ratio in Centreville
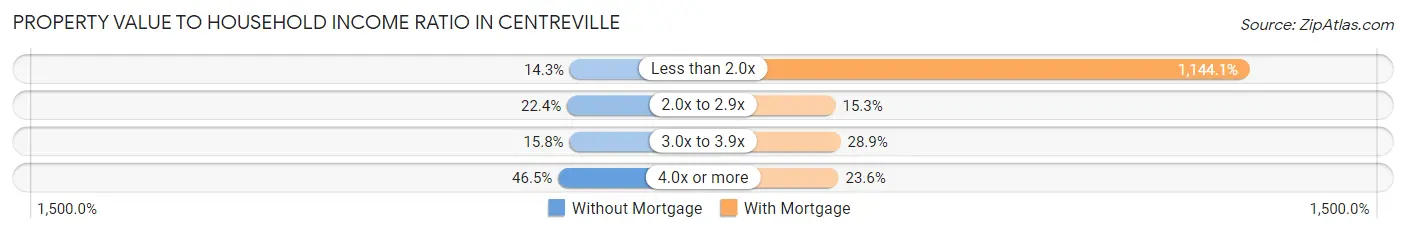
| Value-to-Income Ratio | Without Mortgage | With Mortgage |
| Less than 2.0x | 504 (14.3%) | 169,830 (1,144.1%) |
| 2.0x to 2.9x | 788 (22.4%) | 2,273 (15.3%) |
| 3.0x to 3.9x | 555 (15.8%) | 4,295 (28.9%) |
| 4.0x or more | 1,635 (46.5%) | 3,500 (23.6%) |
| Total | 3,520 (100.0%) | 14,844 (100.0%) |
Real Estate Taxes by Mortgage Status in Centreville

| Property Taxes | Without Mortgage | With Mortgage |
| Less than $800 | 13 (0.4%) | 1 (0.0%) |
| $800 to $1,499 | 63 (1.8%) | 320 (2.2%) |
| $800 to $1,499 | 3,183 (90.4%) | 256 (1.7%) |
| Total | 3,520 (100.0%) | 14,844 (100.0%) |
Health & Disability in Centreville
Health Insurance Coverage by Age in Centreville
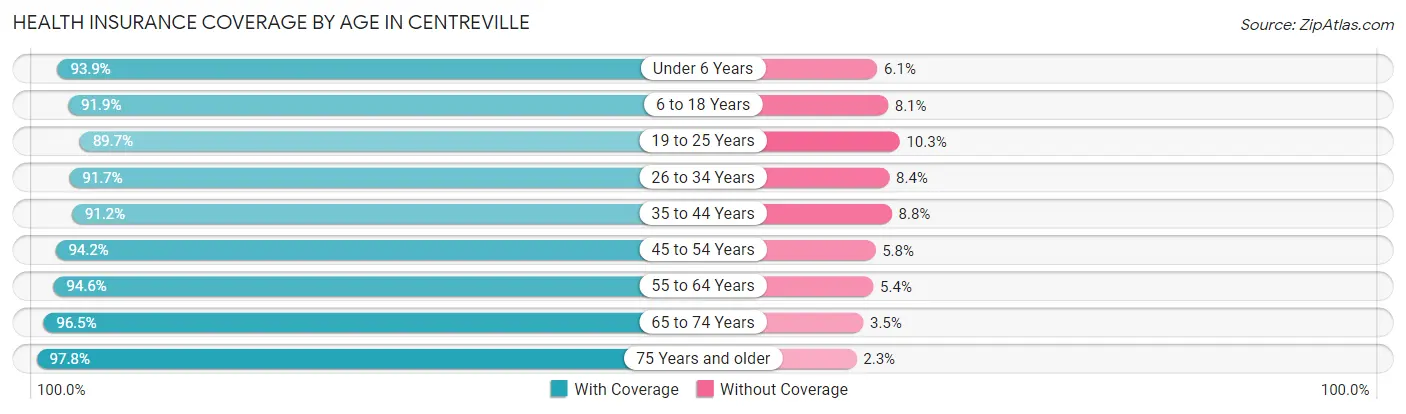
| Age Bracket | With Coverage | Without Coverage |
| Under 6 Years | 4,716 (93.9%) | 308 (6.1%) |
| 6 to 18 Years | 12,015 (91.9%) | 1,060 (8.1%) |
| 19 to 25 Years | 5,841 (89.7%) | 670 (10.3%) |
| 26 to 34 Years | 8,390 (91.6%) | 764 (8.4%) |
| 35 to 44 Years | 10,219 (91.2%) | 989 (8.8%) |
| 45 to 54 Years | 9,907 (94.2%) | 605 (5.8%) |
| 55 to 64 Years | 8,777 (94.6%) | 499 (5.4%) |
| 65 to 74 Years | 5,037 (96.5%) | 182 (3.5%) |
| 75 Years and older | 2,436 (97.8%) | 56 (2.2%) |
| Total | 67,338 (92.9%) | 5,133 (7.1%) |
Health Insurance Coverage by Citizenship Status in Centreville

| Citizenship Status | With Coverage | Without Coverage |
| Native Born | 4,716 (93.9%) | 308 (6.1%) |
| Foreign Born, Citizen | 12,015 (91.9%) | 1,060 (8.1%) |
| Foreign Born, not a Citizen | 5,841 (89.7%) | 670 (10.3%) |
Health Insurance Coverage by Household Income in Centreville
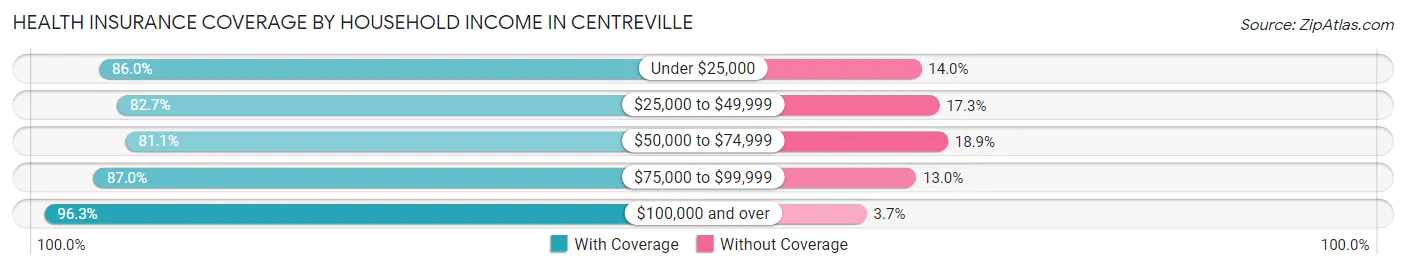
| Household Income | With Coverage | Without Coverage |
| Under $25,000 | 3,030 (86.0%) | 492 (14.0%) |
| $25,000 to $49,999 | 3,495 (82.7%) | 732 (17.3%) |
| $50,000 to $74,999 | 4,463 (81.1%) | 1,042 (18.9%) |
| $75,000 to $99,999 | 6,244 (87.0%) | 931 (13.0%) |
| $100,000 and over | 50,088 (96.3%) | 1,936 (3.7%) |
Public vs Private Health Insurance Coverage by Age in Centreville
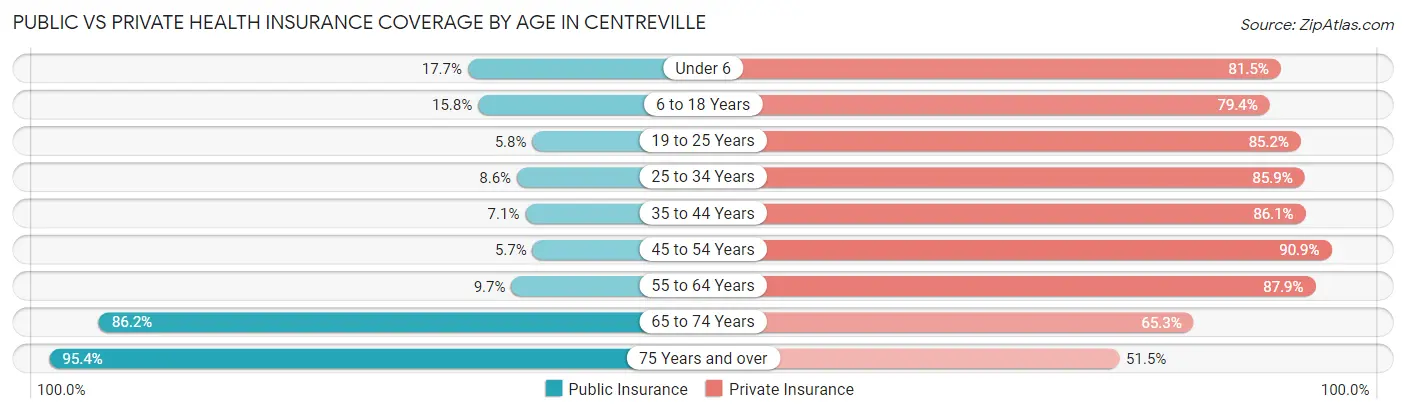
| Age Bracket | Public Insurance | Private Insurance |
| Under 6 | 891 (17.7%) | 4,092 (81.5%) |
| 6 to 18 Years | 2,071 (15.8%) | 10,382 (79.4%) |
| 19 to 25 Years | 376 (5.8%) | 5,546 (85.2%) |
| 25 to 34 Years | 789 (8.6%) | 7,862 (85.9%) |
| 35 to 44 Years | 792 (7.1%) | 9,644 (86.1%) |
| 45 to 54 Years | 601 (5.7%) | 9,550 (90.8%) |
| 55 to 64 Years | 896 (9.7%) | 8,153 (87.9%) |
| 65 to 74 Years | 4,499 (86.2%) | 3,407 (65.3%) |
| 75 Years and over | 2,377 (95.4%) | 1,283 (51.5%) |
| Total | 13,292 (18.3%) | 59,919 (82.7%) |
Disability Status by Sex by Age in Centreville
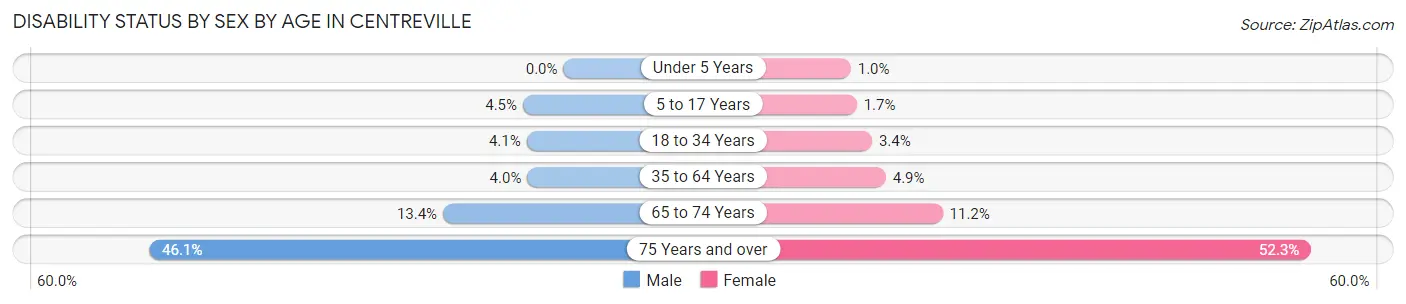
| Age Bracket | Male | Female |
| Under 5 Years | 0 (0.0%) | 16 (1.0%) |
| 5 to 17 Years | 294 (4.5%) | 107 (1.7%) |
| 18 to 34 Years | 364 (4.1%) | 272 (3.4%) |
| 35 to 64 Years | 614 (4.0%) | 771 (4.9%) |
| 65 to 74 Years | 319 (13.4%) | 319 (11.2%) |
| 75 Years and over | 561 (46.1%) | 667 (52.3%) |
Disability Class by Sex by Age in Centreville
Disability Class: Hearing Difficulty
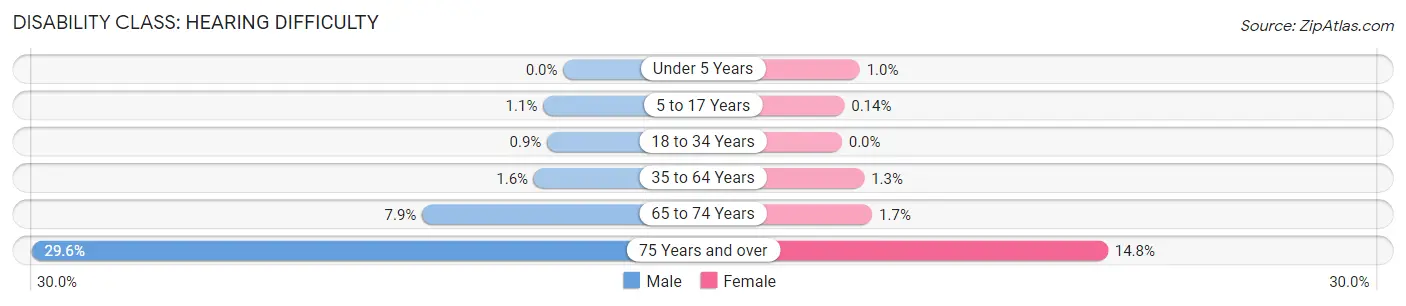
| Age Bracket | Male | Female |
| Under 5 Years | 0 (0.0%) | 16 (1.0%) |
| 5 to 17 Years | 73 (1.1%) | 9 (0.1%) |
| 18 to 34 Years | 80 (0.9%) | 0 (0.0%) |
| 35 to 64 Years | 250 (1.6%) | 197 (1.3%) |
| 65 to 74 Years | 187 (7.9%) | 48 (1.7%) |
| 75 Years and over | 360 (29.6%) | 189 (14.8%) |
Disability Class: Vision Difficulty
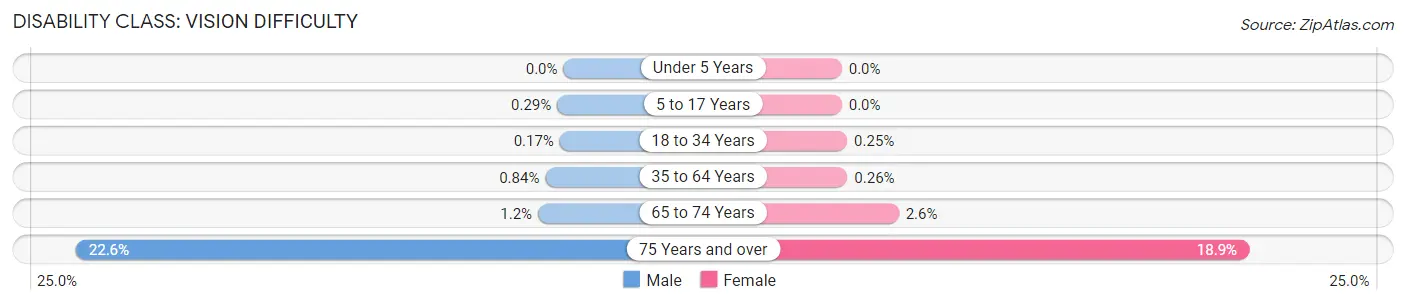
| Age Bracket | Male | Female |
| Under 5 Years | 0 (0.0%) | 0 (0.0%) |
| 5 to 17 Years | 19 (0.3%) | 0 (0.0%) |
| 18 to 34 Years | 15 (0.2%) | 20 (0.3%) |
| 35 to 64 Years | 129 (0.8%) | 41 (0.3%) |
| 65 to 74 Years | 28 (1.2%) | 75 (2.6%) |
| 75 Years and over | 275 (22.6%) | 241 (18.9%) |
Disability Class: Cognitive Difficulty
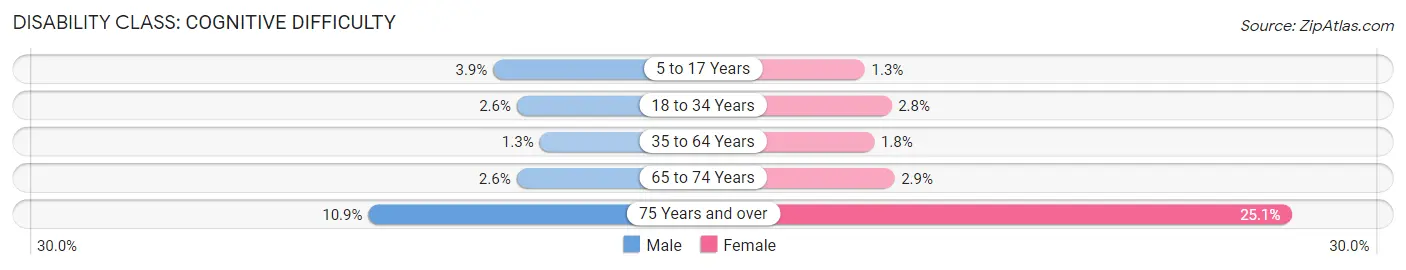
| Age Bracket | Male | Female |
| 5 to 17 Years | 255 (3.9%) | 82 (1.3%) |
| 18 to 34 Years | 230 (2.6%) | 223 (2.8%) |
| 35 to 64 Years | 203 (1.3%) | 281 (1.8%) |
| 65 to 74 Years | 62 (2.6%) | 83 (2.9%) |
| 75 Years and over | 132 (10.9%) | 320 (25.1%) |
Disability Class: Ambulatory Difficulty
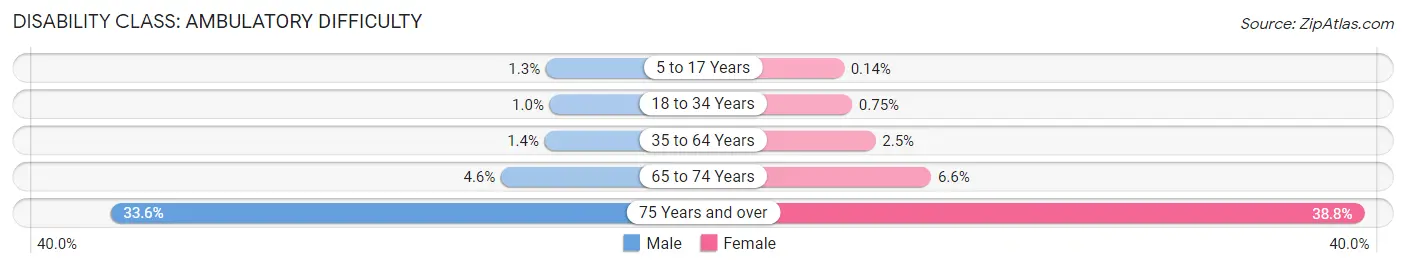
| Age Bracket | Male | Female |
| 5 to 17 Years | 84 (1.3%) | 9 (0.1%) |
| 18 to 34 Years | 90 (1.0%) | 61 (0.7%) |
| 35 to 64 Years | 211 (1.4%) | 391 (2.5%) |
| 65 to 74 Years | 110 (4.6%) | 188 (6.6%) |
| 75 Years and over | 409 (33.6%) | 495 (38.8%) |
Disability Class: Self-Care Difficulty
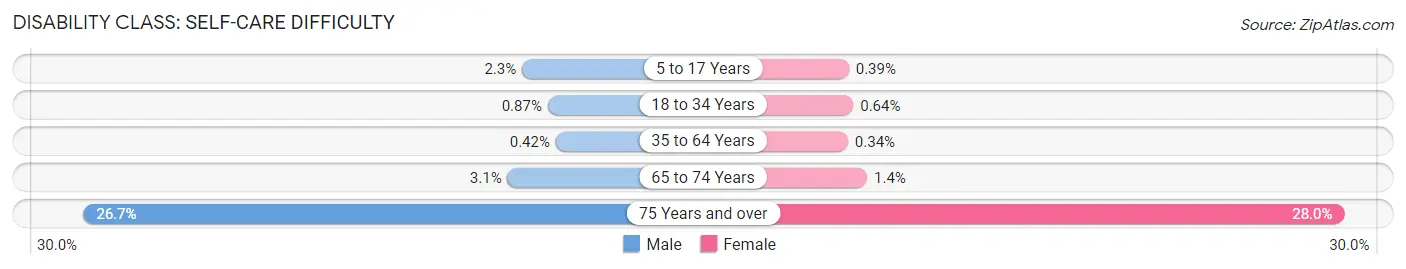
| Age Bracket | Male | Female |
| 5 to 17 Years | 150 (2.3%) | 25 (0.4%) |
| 18 to 34 Years | 77 (0.9%) | 52 (0.6%) |
| 35 to 64 Years | 64 (0.4%) | 54 (0.3%) |
| 65 to 74 Years | 74 (3.1%) | 40 (1.4%) |
| 75 Years and over | 325 (26.7%) | 357 (28.0%) |
Technology Access in Centreville
Computing Device Access in Centreville
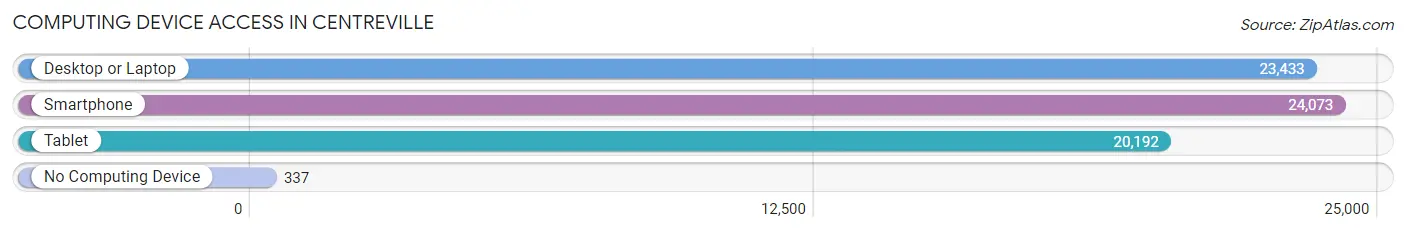
| Device Type | # Households | % Households |
| Desktop or Laptop | 23,433 | 93.9% |
| Smartphone | 24,073 | 96.5% |
| Tablet | 20,192 | 80.9% |
| No Computing Device | 337 | 1.3% |
| Total | 24,950 | 100.0% |
Internet Access in Centreville
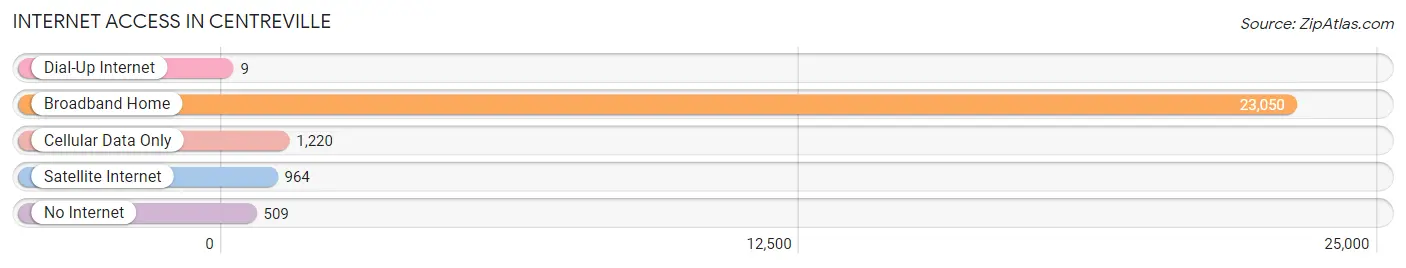
| Internet Type | # Households | % Households |
| Dial-Up Internet | 9 | 0.0% |
| Broadband Home | 23,050 | 92.4% |
| Cellular Data Only | 1,220 | 4.9% |
| Satellite Internet | 964 | 3.9% |
| No Internet | 509 | 2.0% |
| Total | 24,950 | 100.0% |
Centreville Summary
Centreville, Virginia is a census-designated place (CDP) located in Fairfax County, Virginia. It is a suburb of Washington, D.C. and is part of the Washington metropolitan area. The population of Centreville was 71,135 as of the 2010 census.
History
Centreville was first settled in the early 1700s by English colonists. The town was originally known as Newgate due to the presence of a nearby prison. The prison was eventually destroyed during the Civil War. In 1835, the town was renamed Centreville due to its location at the geographic center of Fairfax County.
Centreville was a major stop on the Orange and Alexandria Railroad, which connected Washington, D.C. to the Shenandoah Valley. The railroad was a major factor in the growth of Centreville, as it allowed for the transportation of goods and people.
Geography
Centreville is located in northern Fairfax County, Virginia. It is situated at the intersection of Interstate 66 and U.S. Route 29. The town is bordered by Chantilly to the north, Clifton to the east, Manassas to the south, and Fairfax to the west.
The terrain of Centreville is mostly hilly, with some flat areas. The town is located in the Piedmont region of Virginia, which is characterized by rolling hills and valleys. The town is located in the watershed of the Potomac River.
Economy
Centreville is a major suburb of Washington, D.C. and is home to many businesses and employers. The largest employers in Centreville are the U.S. government, Fairfax County Public Schools, and the Fairfax County government.
Centreville is also home to many technology companies, including Lockheed Martin, Northrop Grumman, and General Dynamics. The town is also home to several retail stores, restaurants, and other businesses.
Demographics
As of the 2010 census, the population of Centreville was 71,135. The racial makeup of the town was 68.3% White, 15.2% Asian, 8.3% African American, and 6.2% Hispanic or Latino.
The median household income in Centreville was $107,817 in 2019. The median home value was $521,000 in 2019. The town has a high rate of homeownership, with 73.3% of residents owning their homes.
Conclusion
Centreville, Virginia is a census-designated place located in Fairfax County, Virginia. It is a suburb of Washington, D.C. and is part of the Washington metropolitan area. The town was first settled in the early 1700s and was originally known as Newgate. Centreville was a major stop on the Orange and Alexandria Railroad, which connected Washington, D.C. to the Shenandoah Valley. The population of Centreville was 71,135 as of the 2010 census. The town is home to many businesses and employers, including the U.S. government, Fairfax County Public Schools, and the Fairfax County government. The racial makeup of the town was 68.3% White, 15.2% Asian, 8.3% African American, and 6.2% Hispanic or Latino. The median household income in Centreville was $107,817 in 2019. The median home value was $521,000 in 2019.
Common Questions
What is Per Capita Income in Centreville?
Per Capita income in Centreville is $56,834.
What is the Median Family Income in Centreville?
Median Family Income in Centreville is $152,885.
What is the Median Household income in Centreville?
Median Household Income in Centreville is $136,679.
What is Income or Wage Gap in Centreville?
Income or Wage Gap in Centreville is 22.1%.
Women in Centreville earn 77.9 cents for every dollar earned by a man.
What is Family Income Deficit in Centreville?
Family Income Deficit in Centreville is $11,680.
Families that are below poverty line in Centreville earn $11,680 less on average than the poverty threshold level.
What is Inequality or Gini Index in Centreville?
Inequality or Gini Index in Centreville is 0.38.
What is the Total Population of Centreville?
Total Population of Centreville is 72,680.
What is the Total Male Population of Centreville?
Total Male Population of Centreville is 36,612.
What is the Total Female Population of Centreville?
Total Female Population of Centreville is 36,068.
What is the Ratio of Males per 100 Females in Centreville?
There are 101.51 Males per 100 Females in Centreville.
What is the Ratio of Females per 100 Males in Centreville?
There are 98.51 Females per 100 Males in Centreville.
What is the Median Population Age in Centreville?
Median Population Age in Centreville is 37.3 Years.
What is the Average Family Size in Centreville
Average Family Size in Centreville is 3.4 People.
What is the Average Household Size in Centreville
Average Household Size in Centreville is 2.9 People.
How Large is the Labor Force in Centreville?
There are 43,613 People in the Labor Forcein in Centreville.
What is the Percentage of People in the Labor Force in Centreville?
75.5% of People are in the Labor Force in Centreville.
What is the Unemployment Rate in Centreville?
Unemployment Rate in Centreville is 4.4%.