Nassawadox, VA Map & Demographics
Nassawadox Map
Nassawadox Overview
$23,629
PER CAPITA INCOME
$53,357
AVG FAMILY INCOME
$47,222
AVG HOUSEHOLD INCOME
31.4%
WAGE / INCOME GAP [ % ]
68.6¢/ $1
WAGE / INCOME GAP [ $ ]
$14,780
FAMILY INCOME DEFICIT
0.44
INEQUALITY / GINI INDEX
742
TOTAL POPULATION
276
MALE POPULATION
466
FEMALE POPULATION
59.23
MALES / 100 FEMALES
168.84
FEMALES / 100 MALES
38.2
MEDIAN AGE
2.8
AVG FAMILY SIZE
2.3
AVG HOUSEHOLD SIZE
231
LABOR FORCE [ PEOPLE ]
40.6%
PERCENT IN LABOR FORCE
3.9%
UNEMPLOYMENT RATE
Nassawadox Zip Codes
Nassawadox Area Codes
Income in Nassawadox
Income Overview in Nassawadox
Per Capita Income in Nassawadox is $23,629, while median incomes of families and households are $53,357 and $47,222 respectively.
| Characteristic | Number | Measure |
| Per Capita Income | 742 | $23,629 |
| Median Family Income | 158 | $53,357 |
| Mean Family Income | 158 | $71,268 |
| Median Household Income | 256 | $47,222 |
| Mean Household Income | 256 | $61,656 |
| Income Deficit | 158 | $14,780 |
| Wage / Income Gap (%) | 742 | 31.36% |
| Wage / Income Gap ($) | 742 | 68.64¢ per $1 |
| Gini / Inequality Index | 742 | 0.44 |
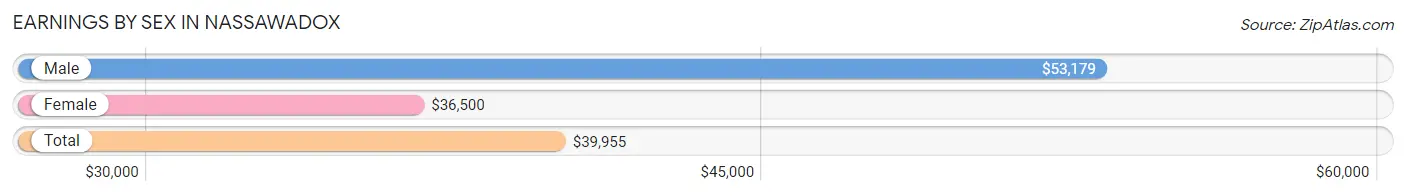
Earnings by Sex in Nassawadox
Average Earnings in Nassawadox are $39,955, $53,179 for men and $36,500 for women, a difference of 31.4%.
| Sex | Number | Average Earnings |
| Male | 117 (46.3%) | $53,179 |
| Female | 136 (53.7%) | $36,500 |
| Total | 253 (100.0%) | $39,955 |
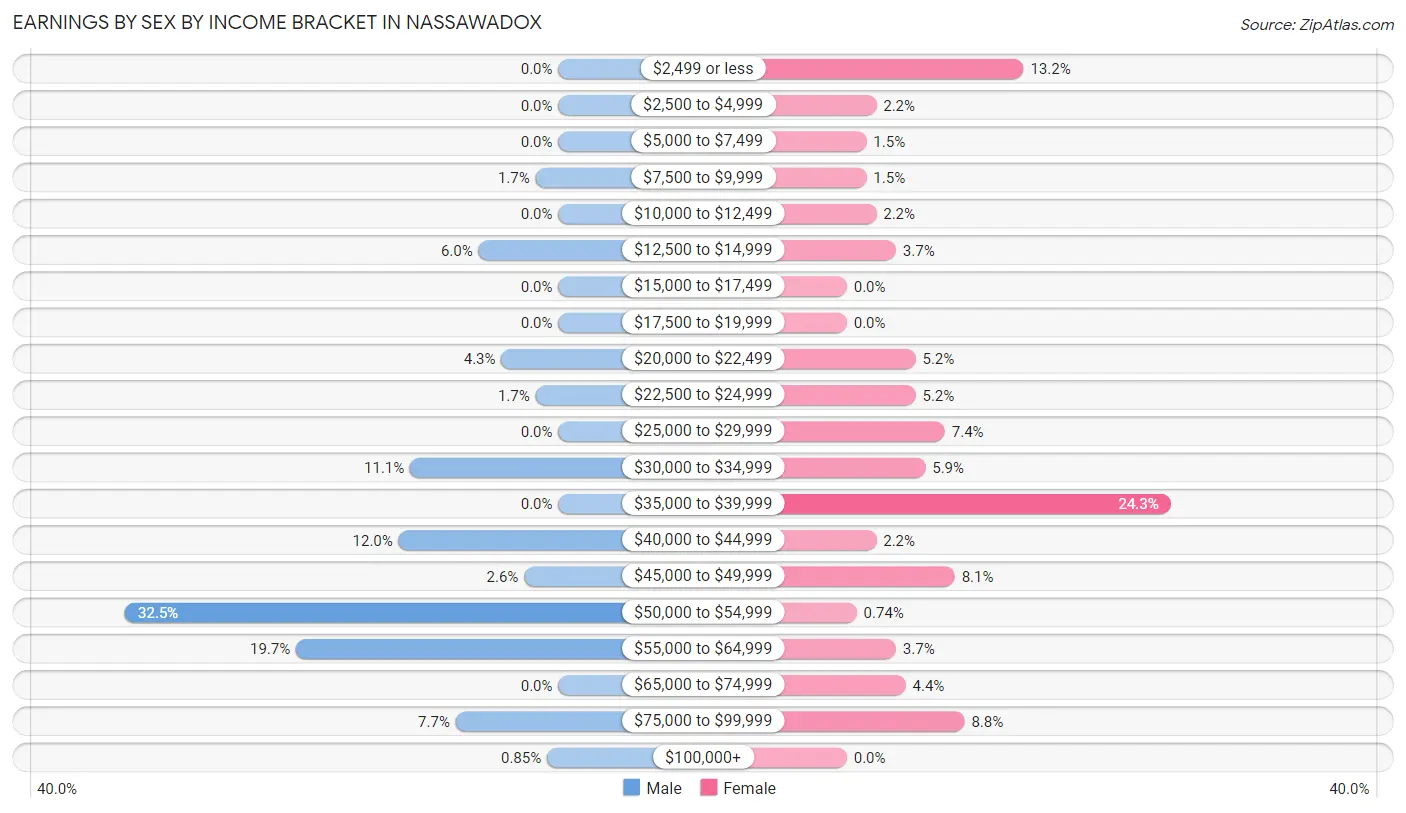
Earnings by Sex by Income Bracket in Nassawadox
The most common earnings brackets in Nassawadox are $50,000 to $54,999 for men (38 | 32.5%) and $35,000 to $39,999 for women (33 | 24.3%).
| Income | Male | Female |
| $2,499 or less | 0 (0.0%) | 18 (13.2%) |
| $2,500 to $4,999 | 0 (0.0%) | 3 (2.2%) |
| $5,000 to $7,499 | 0 (0.0%) | 2 (1.5%) |
| $7,500 to $9,999 | 2 (1.7%) | 2 (1.5%) |
| $10,000 to $12,499 | 0 (0.0%) | 3 (2.2%) |
| $12,500 to $14,999 | 7 (6.0%) | 5 (3.7%) |
| $15,000 to $17,499 | 0 (0.0%) | 0 (0.0%) |
| $17,500 to $19,999 | 0 (0.0%) | 0 (0.0%) |
| $20,000 to $22,499 | 5 (4.3%) | 7 (5.1%) |
| $22,500 to $24,999 | 2 (1.7%) | 7 (5.1%) |
| $25,000 to $29,999 | 0 (0.0%) | 10 (7.3%) |
| $30,000 to $34,999 | 13 (11.1%) | 8 (5.9%) |
| $35,000 to $39,999 | 0 (0.0%) | 33 (24.3%) |
| $40,000 to $44,999 | 14 (12.0%) | 3 (2.2%) |
| $45,000 to $49,999 | 3 (2.6%) | 11 (8.1%) |
| $50,000 to $54,999 | 38 (32.5%) | 1 (0.7%) |
| $55,000 to $64,999 | 23 (19.7%) | 5 (3.7%) |
| $65,000 to $74,999 | 0 (0.0%) | 6 (4.4%) |
| $75,000 to $99,999 | 9 (7.7%) | 12 (8.8%) |
| $100,000+ | 1 (0.9%) | 0 (0.0%) |
| Total | 117 (100.0%) | 136 (100.0%) |
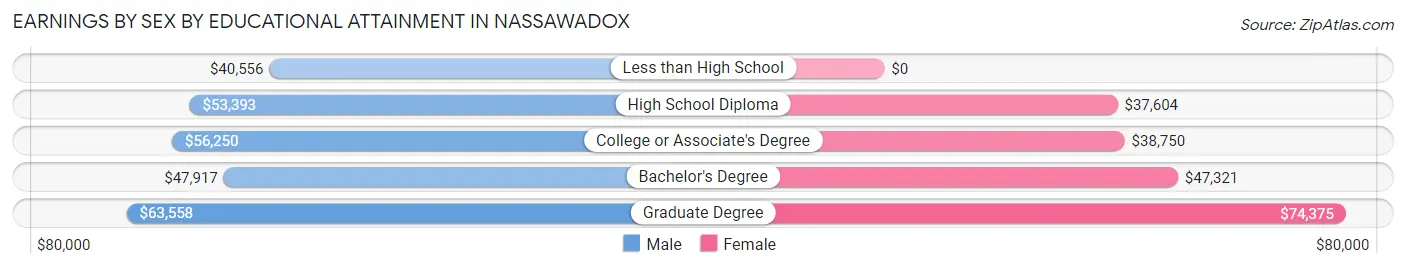
Earnings by Sex by Educational Attainment in Nassawadox
Average earnings in Nassawadox are $53,321 for men and $38,527 for women, a difference of 27.8%. Men with an educational attainment of graduate degree enjoy the highest average annual earnings of $63,558, while those with less than high school education earn the least with $40,556. Women with an educational attainment of graduate degree earn the most with the average annual earnings of $74,375, while those with high school diploma education have the smallest earnings of $37,604.
| Educational Attainment | Male Income | Female Income |
| Less than High School | $40,556 | $0 |
| High School Diploma | $53,393 | $37,604 |
| College or Associate's Degree | $56,250 | $38,750 |
| Bachelor's Degree | $47,917 | $47,321 |
| Graduate Degree | $63,558 | $74,375 |
| Total | $53,321 | $38,527 |
Family Income in Nassawadox
Family Income Brackets in Nassawadox
According to the Nassawadox family income data, there are 43 families falling into the $50,000 to $74,999 income range, which is the most common income bracket and makes up 27.2% of all families.
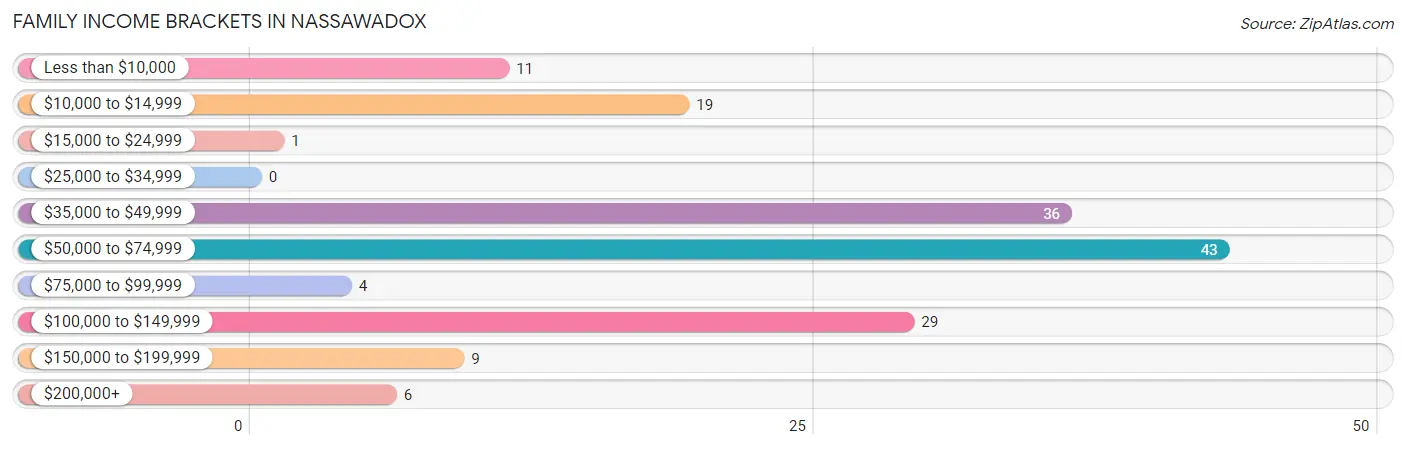
| Income Bracket | # Families | % Families |
| Less than $10,000 | 11 | 7.0% |
| $10,000 to $14,999 | 19 | 12.0% |
| $15,000 to $24,999 | 1 | 0.6% |
| $25,000 to $34,999 | 0 | 0.0% |
| $35,000 to $49,999 | 36 | 22.8% |
| $50,000 to $74,999 | 43 | 27.2% |
| $75,000 to $99,999 | 4 | 2.5% |
| $100,000 to $149,999 | 29 | 18.4% |
| $150,000 to $199,999 | 9 | 5.7% |
| $200,000+ | 6 | 3.8% |
Family Income by Famaliy Size in Nassawadox
3-person families (70 | 44.3%) account for the highest median family income in Nassawadox with $53,357 per family, while 3-person families (70 | 44.3%) have the highest median income of $17,786 per family member.
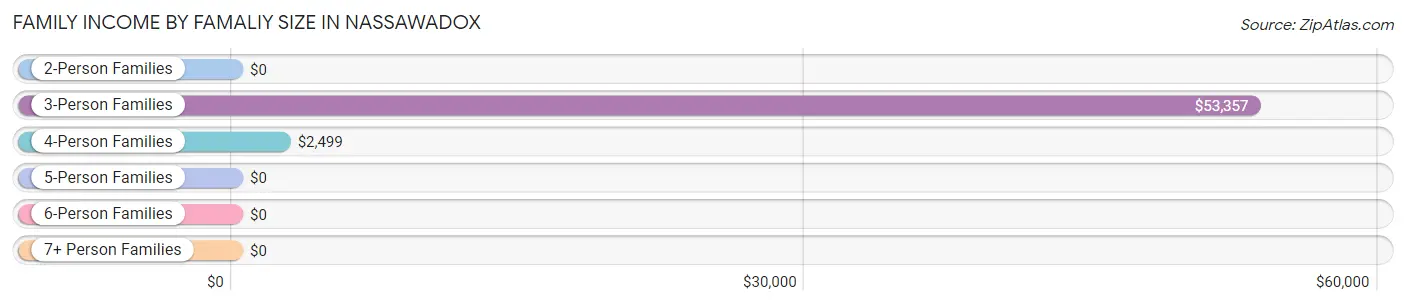
| Income Bracket | # Families | Median Income |
| 2-Person Families | 60 (38.0%) | $0 |
| 3-Person Families | 70 (44.3%) | $53,357 |
| 4-Person Families | 21 (13.3%) | $2,499 |
| 5-Person Families | 0 (0.0%) | $0 |
| 6-Person Families | 6 (3.8%) | $0 |
| 7+ Person Families | 1 (0.6%) | $0 |
| Total | 158 (100.0%) | $53,357 |
Family Income by Number of Earners in Nassawadox
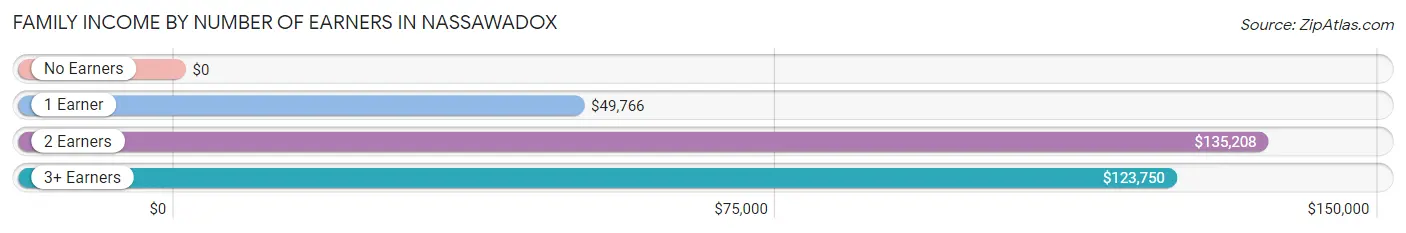
| Number of Earners | # Families | Median Income |
| No Earners | 39 (24.7%) | $0 |
| 1 Earner | 73 (46.2%) | $49,766 |
| 2 Earners | 33 (20.9%) | $135,208 |
| 3+ Earners | 13 (8.2%) | $123,750 |
| Total | 158 (100.0%) | $53,357 |
Household Income in Nassawadox
Household Income Brackets in Nassawadox
With 64 households falling in the category, the $75,000 to $99,999 income range is the most frequent in Nassawadox, accounting for 25.0% of all households. In contrast, only 2 households (0.8%) fall into the $25,000 to $34,999 income bracket, making it the least populous group.
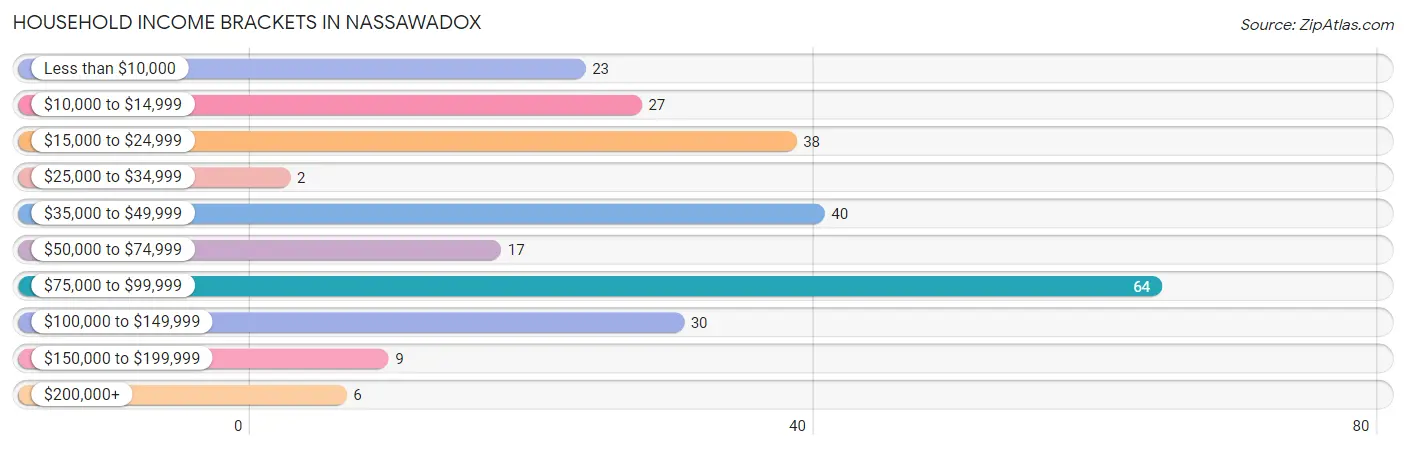
| Income Bracket | # Households | % Households |
| Less than $10,000 | 23 | 9.0% |
| $10,000 to $14,999 | 27 | 10.5% |
| $15,000 to $24,999 | 38 | 14.8% |
| $25,000 to $34,999 | 2 | 0.8% |
| $35,000 to $49,999 | 40 | 15.6% |
| $50,000 to $74,999 | 17 | 6.6% |
| $75,000 to $99,999 | 64 | 25.0% |
| $100,000 to $149,999 | 30 | 11.7% |
| $150,000 to $199,999 | 9 | 3.5% |
| $200,000+ | 6 | 2.3% |
Household Income by Householder Age in Nassawadox
The median household income in Nassawadox is $47,222, with the highest median household income of $78,643 found in the 25 to 44 years age bracket for the primary householder. A total of 110 households (43.0%) fall into this category. Meanwhile, the 15 to 24 years age bracket for the primary householder has the lowest median household income of $0, with 2 households (0.8%) in this group.
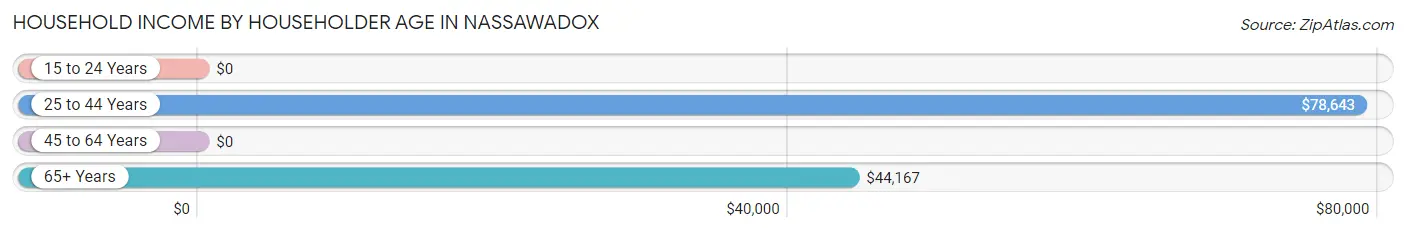
| Income Bracket | # Households | Median Income |
| 15 to 24 Years | 2 (0.8%) | $0 |
| 25 to 44 Years | 110 (43.0%) | $78,643 |
| 45 to 64 Years | 74 (28.9%) | $0 |
| 65+ Years | 70 (27.3%) | $44,167 |
| Total | 256 (100.0%) | $47,222 |
Poverty in Nassawadox
Income Below Poverty by Sex and Age in Nassawadox
With 8.2% poverty level for males and 32.8% for females among the residents of Nassawadox, 5 year old males and 5 year old females are the most vulnerable to poverty, with 1 males (100.0%) and 5 females (100.0%) in their respective age groups living below the poverty level.
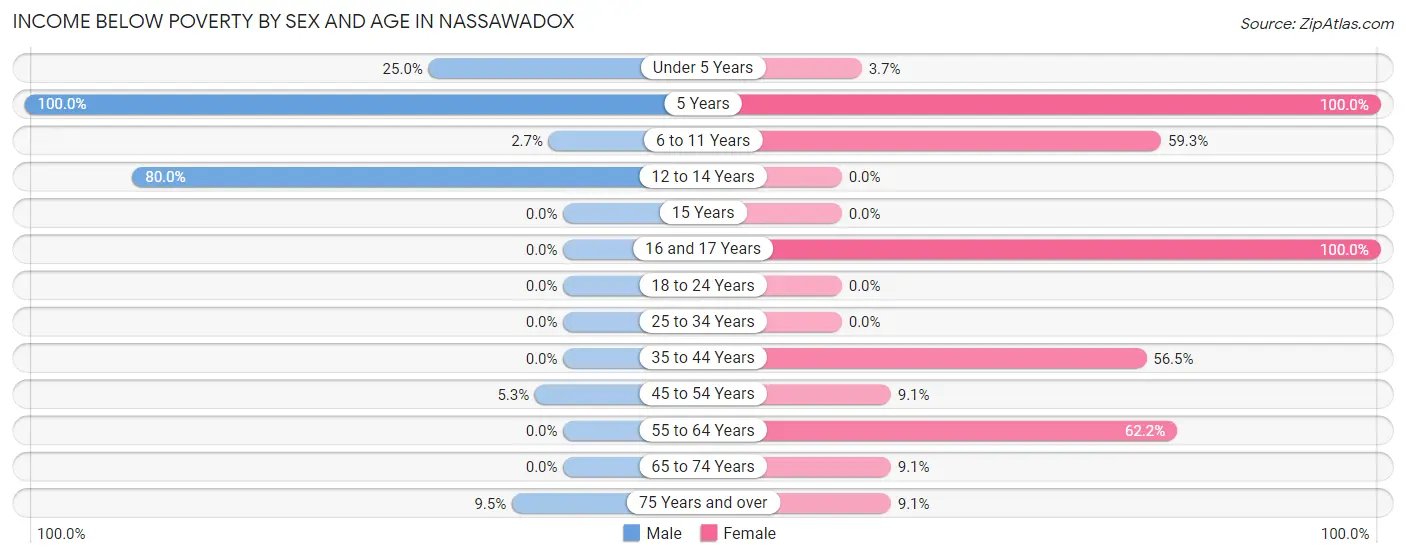
| Age Bracket | Male | Female |
| Under 5 Years | 2 (25.0%) | 1 (3.7%) |
| 5 Years | 1 (100.0%) | 5 (100.0%) |
| 6 to 11 Years | 1 (2.7%) | 32 (59.3%) |
| 12 to 14 Years | 12 (80.0%) | 0 (0.0%) |
| 15 Years | 0 (0.0%) | 0 (0.0%) |
| 16 and 17 Years | 0 (0.0%) | 23 (100.0%) |
| 18 to 24 Years | 0 (0.0%) | 0 (0.0%) |
| 25 to 34 Years | 0 (0.0%) | 0 (0.0%) |
| 35 to 44 Years | 0 (0.0%) | 13 (56.5%) |
| 45 to 54 Years | 1 (5.3%) | 2 (9.1%) |
| 55 to 64 Years | 0 (0.0%) | 28 (62.2%) |
| 65 to 74 Years | 0 (0.0%) | 2 (9.1%) |
| 75 Years and over | 2 (9.5%) | 3 (9.1%) |
| Total | 19 (8.2%) | 109 (32.8%) |
Income Above Poverty by Sex and Age in Nassawadox
According to the poverty statistics in Nassawadox, males aged 16 and 17 years and females aged 12 to 14 years are the age groups that are most secure financially, with 100.0% of males and 100.0% of females in these age groups living above the poverty line.
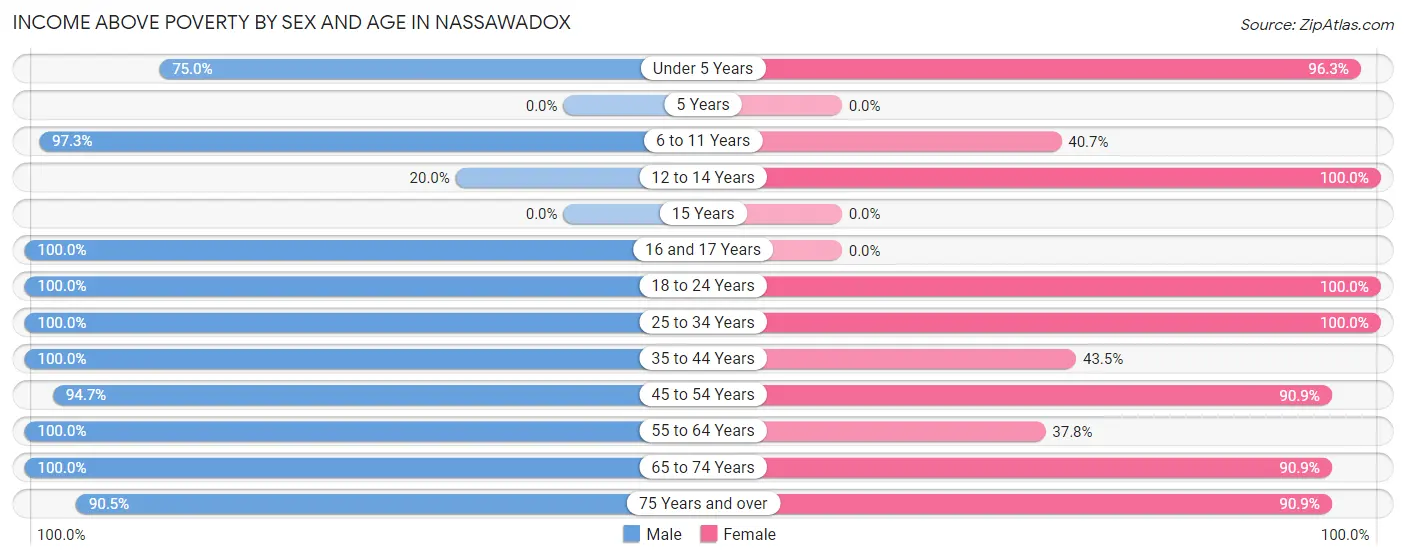
| Age Bracket | Male | Female |
| Under 5 Years | 6 (75.0%) | 26 (96.3%) |
| 5 Years | 0 (0.0%) | 0 (0.0%) |
| 6 to 11 Years | 36 (97.3%) | 22 (40.7%) |
| 12 to 14 Years | 3 (20.0%) | 3 (100.0%) |
| 15 Years | 0 (0.0%) | 0 (0.0%) |
| 16 and 17 Years | 2 (100.0%) | 0 (0.0%) |
| 18 to 24 Years | 4 (100.0%) | 15 (100.0%) |
| 25 to 34 Years | 69 (100.0%) | 60 (100.0%) |
| 35 to 44 Years | 21 (100.0%) | 10 (43.5%) |
| 45 to 54 Years | 18 (94.7%) | 20 (90.9%) |
| 55 to 64 Years | 15 (100.0%) | 17 (37.8%) |
| 65 to 74 Years | 21 (100.0%) | 20 (90.9%) |
| 75 Years and over | 19 (90.5%) | 30 (90.9%) |
| Total | 214 (91.8%) | 223 (67.2%) |
Income Below Poverty Among Married-Couple Families in Nassawadox
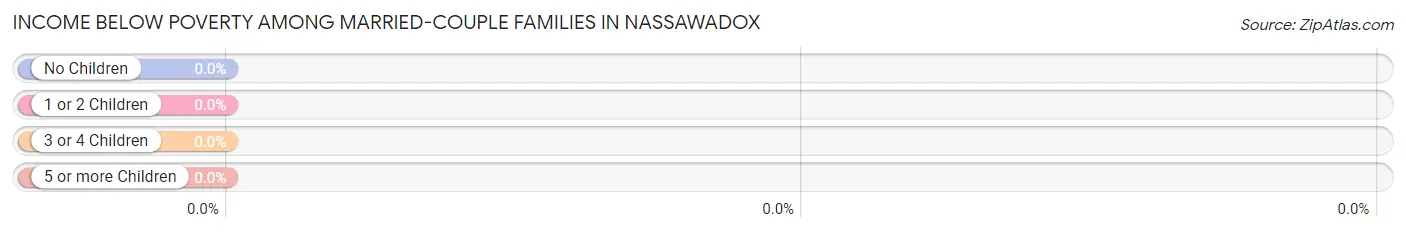
| Children | Above Poverty | Below Poverty |
| No Children | 42 (100.0%) | 0 (0.0%) |
| 1 or 2 Children | 16 (100.0%) | 0 (0.0%) |
| 3 or 4 Children | 1 (100.0%) | 0 (0.0%) |
| 5 or more Children | 0 (0.0%) | 0 (0.0%) |
| Total | 59 (100.0%) | 0 (0.0%) |
Income Below Poverty Among Single-Parent Households in Nassawadox
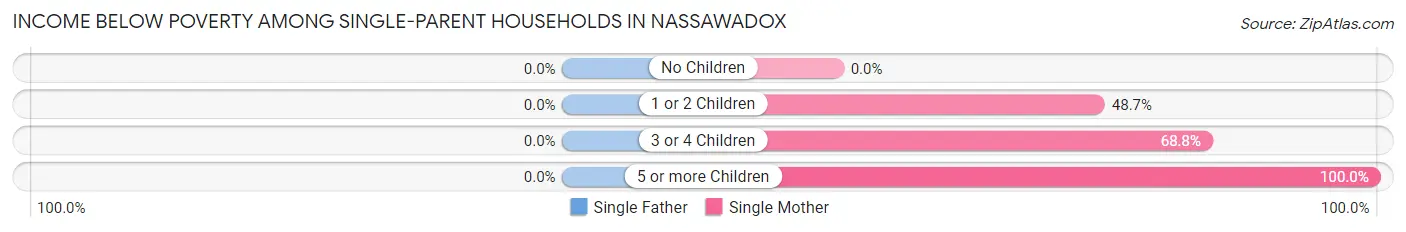
| Children | Single Father | Single Mother |
| No Children | 0 (0.0%) | 0 (0.0%) |
| 1 or 2 Children | 0 (0.0%) | 18 (48.6%) |
| 3 or 4 Children | 0 (0.0%) | 11 (68.8%) |
| 5 or more Children | 0 (0.0%) | 1 (100.0%) |
| Total | 0 (0.0%) | 30 (49.2%) |
Income Below Poverty Among Married-Couple vs Single-Parent Households in Nassawadox
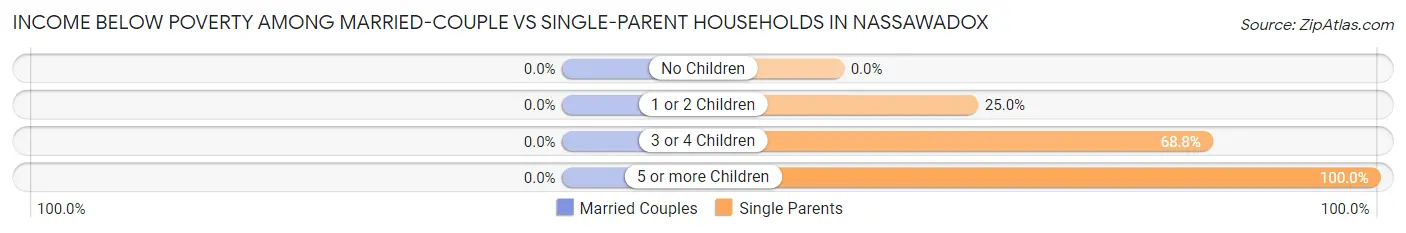
| Children | Married-Couple Families | Single-Parent Households |
| No Children | 0 (0.0%) | 0 (0.0%) |
| 1 or 2 Children | 0 (0.0%) | 18 (25.0%) |
| 3 or 4 Children | 0 (0.0%) | 11 (68.8%) |
| 5 or more Children | 0 (0.0%) | 1 (100.0%) |
| Total | 0 (0.0%) | 30 (30.3%) |
Race in Nassawadox
The most populous races in Nassawadox are White / Caucasian (326 | 43.9%), Black / African American (240 | 32.4%), and Two or more Races (172 | 23.2%).
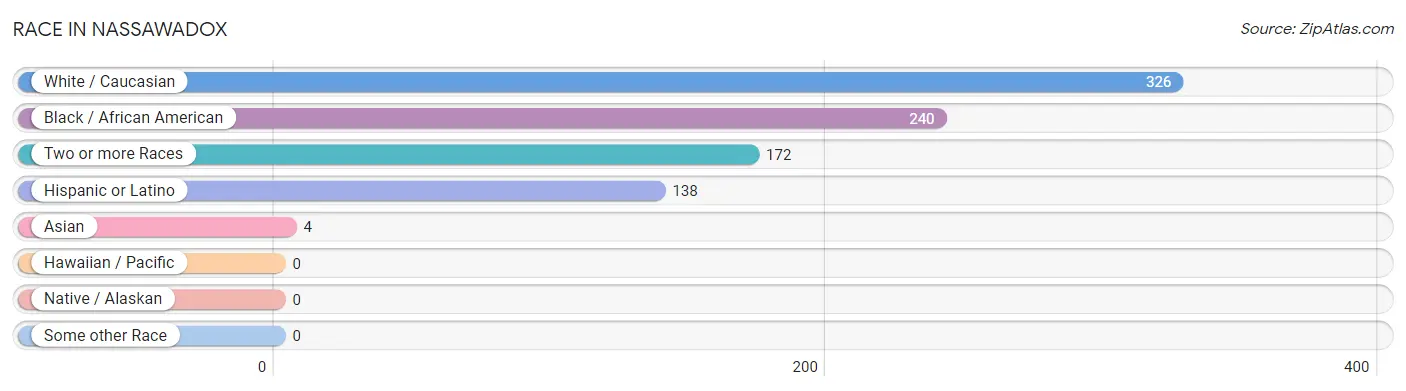
| Race | # Population | % Population |
| Asian | 4 | 0.5% |
| Black / African American | 240 | 32.4% |
| Hawaiian / Pacific | 0 | 0.0% |
| Hispanic or Latino | 138 | 18.6% |
| Native / Alaskan | 0 | 0.0% |
| White / Caucasian | 326 | 43.9% |
| Two or more Races | 172 | 23.2% |
| Some other Race | 0 | 0.0% |
| Total | 742 | 100.0% |
Ancestry in Nassawadox
The most populous ancestries reported in Nassawadox are American (420 | 56.6%), Mexican (102 | 13.8%), German (61 | 8.2%), English (46 | 6.2%), and Irish (35 | 4.7%), together accounting for 89.5% of all Nassawadox residents.
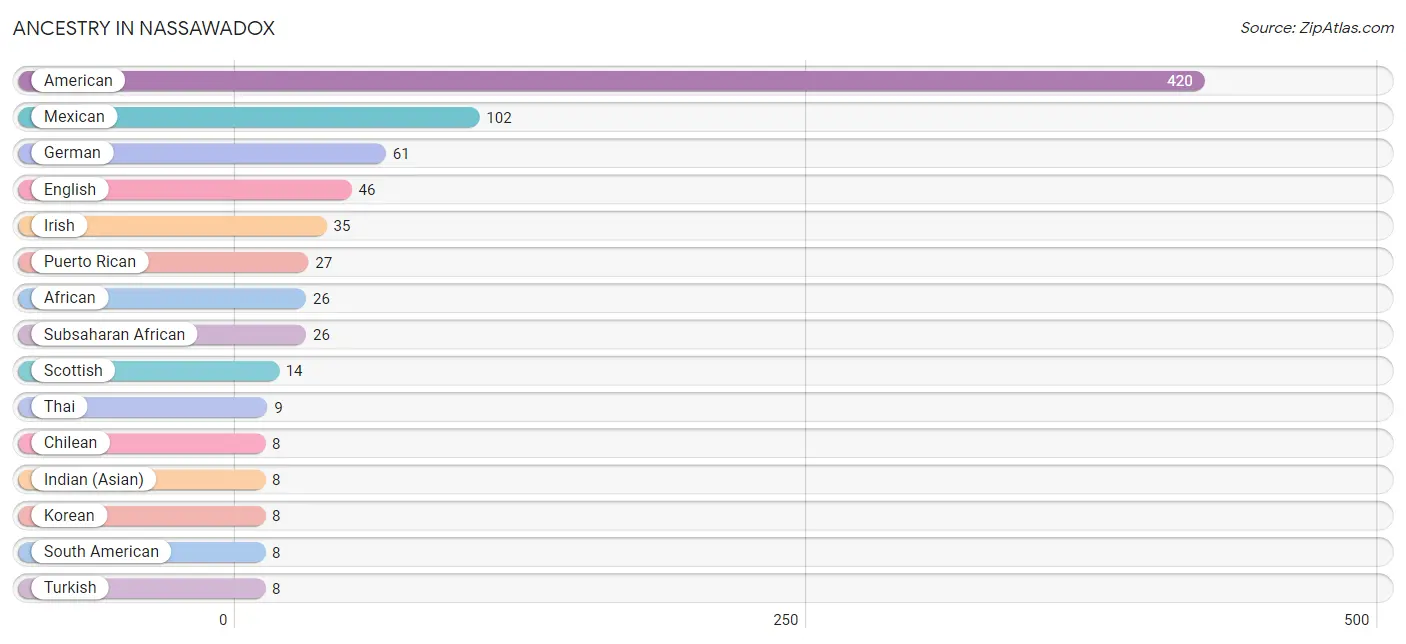
| Ancestry | # Population | % Population |
| African | 26 | 3.5% |
| American | 420 | 56.6% |
| Armenian | 1 | 0.1% |
| Bhutanese | 1 | 0.1% |
| Burmese | 2 | 0.3% |
| Canadian | 6 | 0.8% |
| Chilean | 8 | 1.1% |
| Dutch | 3 | 0.4% |
| Eastern European | 2 | 0.3% |
| English | 46 | 6.2% |
| German | 61 | 8.2% |
| Indian (Asian) | 8 | 1.1% |
| Irish | 35 | 4.7% |
| Italian | 3 | 0.4% |
| Korean | 8 | 1.1% |
| Mexican | 102 | 13.8% |
| Polish | 3 | 0.4% |
| Puerto Rican | 27 | 3.6% |
| Scotch-Irish | 5 | 0.7% |
| Scottish | 14 | 1.9% |
| South American | 8 | 1.1% |
| Subsaharan African | 26 | 3.5% |
| Thai | 9 | 1.2% |
| Turkish | 8 | 1.1% | View All 24 Rows |
Immigrants in Nassawadox
The most numerous immigrant groups reported in Nassawadox came from Latin America (49 | 6.6%), Central America (41 | 5.5%), Mexico (41 | 5.5%), Chile (8 | 1.1%), and South America (8 | 1.1%), together accounting for 19.8% of all Nassawadox residents.
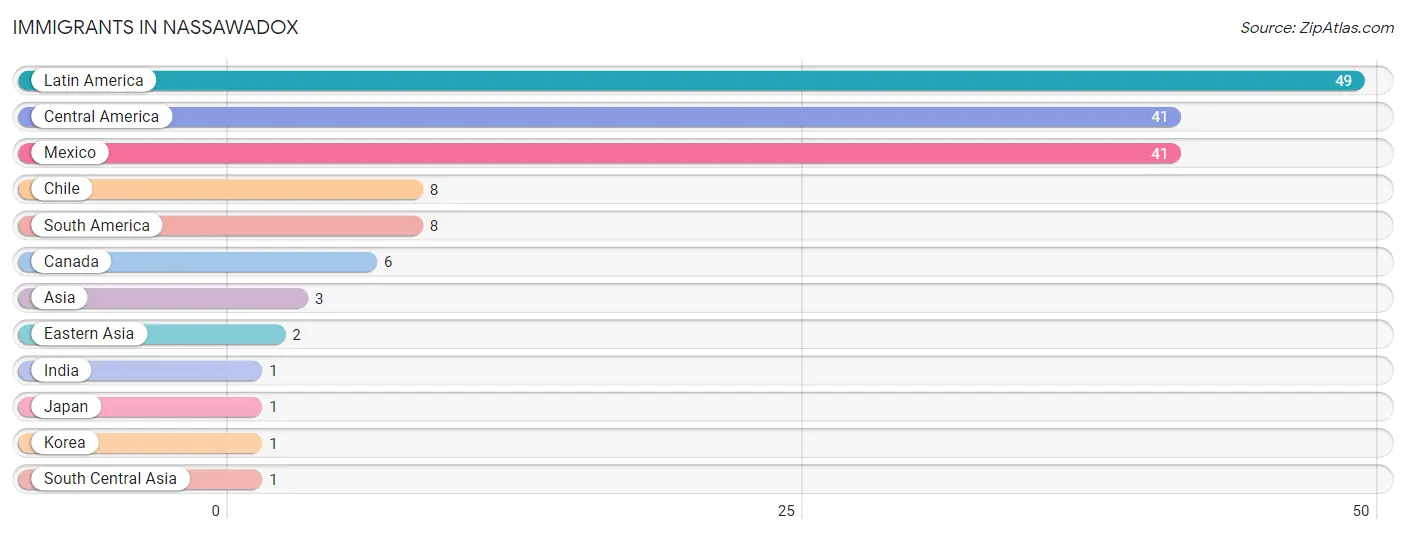
| Immigration Origin | # Population | % Population |
| Asia | 3 | 0.4% |
| Canada | 6 | 0.8% |
| Central America | 41 | 5.5% |
| Chile | 8 | 1.1% |
| Eastern Asia | 2 | 0.3% |
| India | 1 | 0.1% |
| Japan | 1 | 0.1% |
| Korea | 1 | 0.1% |
| Latin America | 49 | 6.6% |
| Mexico | 41 | 5.5% |
| South America | 8 | 1.1% |
| South Central Asia | 1 | 0.1% | View All 12 Rows |
Sex and Age in Nassawadox
Sex and Age in Nassawadox
The most populous age groups in Nassawadox are 25 to 29 Years (45 | 16.3%) for men and 5 to 9 Years (50 | 10.7%) for women.
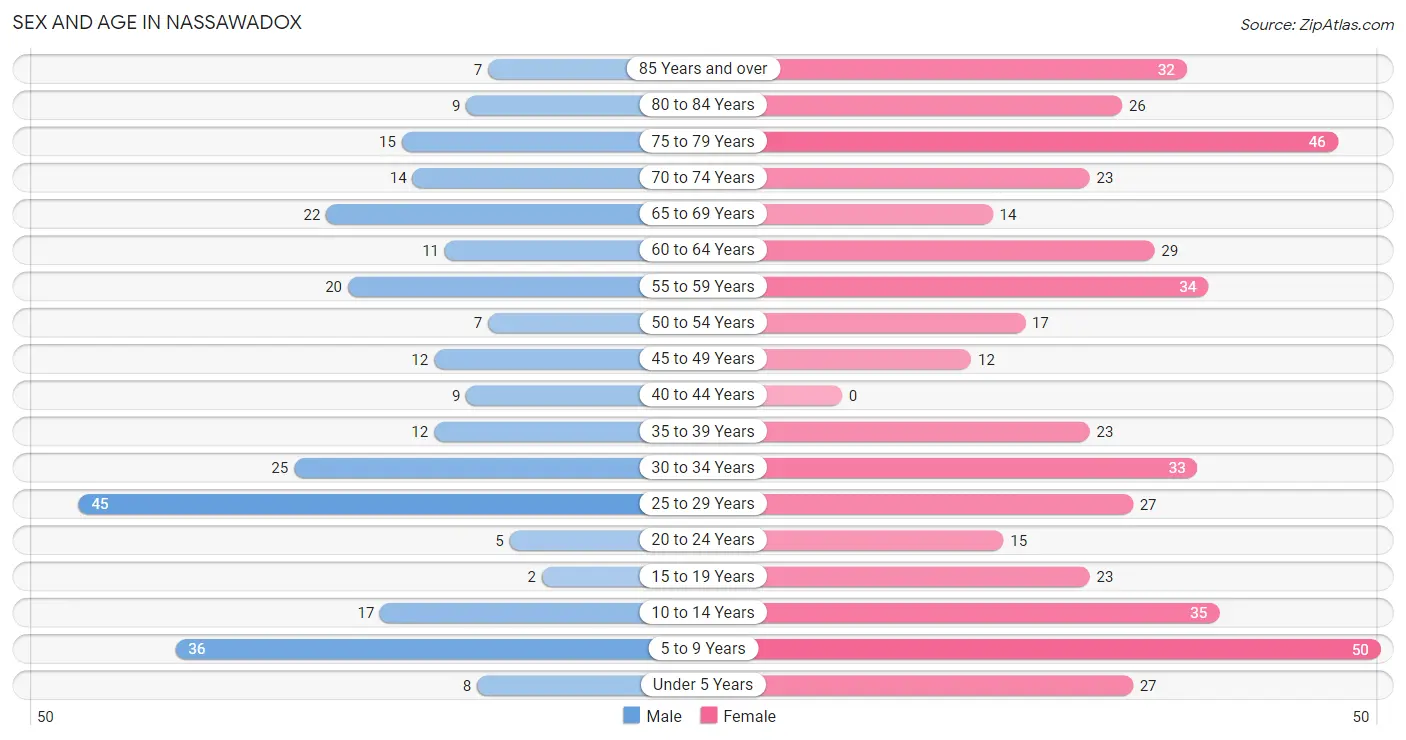
| Age Bracket | Male | Female |
| Under 5 Years | 8 (2.9%) | 27 (5.8%) |
| 5 to 9 Years | 36 (13.0%) | 50 (10.7%) |
| 10 to 14 Years | 17 (6.2%) | 35 (7.5%) |
| 15 to 19 Years | 2 (0.7%) | 23 (4.9%) |
| 20 to 24 Years | 5 (1.8%) | 15 (3.2%) |
| 25 to 29 Years | 45 (16.3%) | 27 (5.8%) |
| 30 to 34 Years | 25 (9.1%) | 33 (7.1%) |
| 35 to 39 Years | 12 (4.3%) | 23 (4.9%) |
| 40 to 44 Years | 9 (3.3%) | 0 (0.0%) |
| 45 to 49 Years | 12 (4.3%) | 12 (2.6%) |
| 50 to 54 Years | 7 (2.5%) | 17 (3.6%) |
| 55 to 59 Years | 20 (7.2%) | 34 (7.3%) |
| 60 to 64 Years | 11 (4.0%) | 29 (6.2%) |
| 65 to 69 Years | 22 (8.0%) | 14 (3.0%) |
| 70 to 74 Years | 14 (5.1%) | 23 (4.9%) |
| 75 to 79 Years | 15 (5.4%) | 46 (9.9%) |
| 80 to 84 Years | 9 (3.3%) | 26 (5.6%) |
| 85 Years and over | 7 (2.5%) | 32 (6.9%) |
| Total | 276 (100.0%) | 466 (100.0%) |
Families and Households in Nassawadox
Median Family Size in Nassawadox
The median family size in Nassawadox is 2.81 persons per family, with single female/mother families (61 | 38.6%) accounting for the largest median family size of 3.25 persons per family. On the other hand, single male/father families (38 | 24.0%) represent the smallest median family size with 1.95 persons per family.
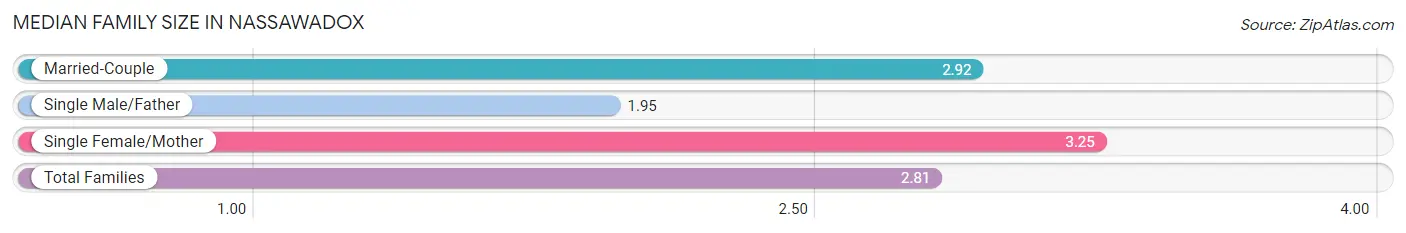
| Family Type | # Families | Family Size |
| Married-Couple | 59 (37.3%) | 2.92 |
| Single Male/Father | 38 (24.0%) | 1.95 |
| Single Female/Mother | 61 (38.6%) | 3.25 |
| Total Families | 158 (100.0%) | 2.81 |
Median Household Size in Nassawadox
The median household size in Nassawadox is 2.30 persons per household, with single female/mother households (61 | 23.8%) accounting for the largest median household size of 3.39 persons per household. non-family households (98 | 38.3%) represent the smallest median household size with 1.08 persons per household.
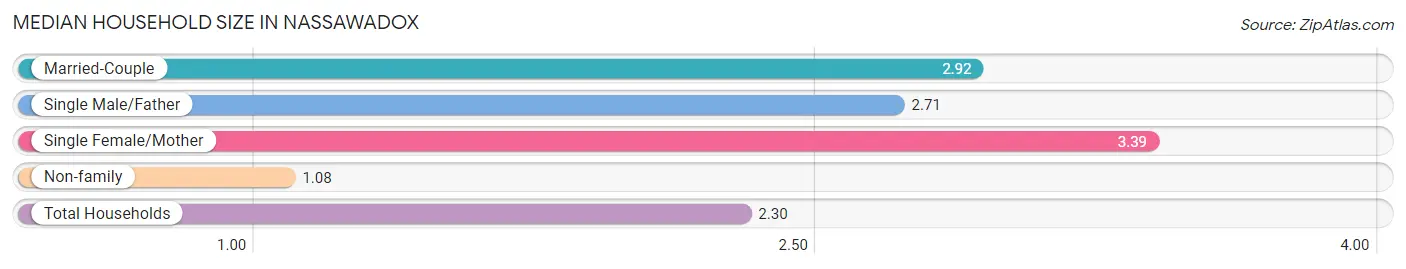
| Household Type | # Households | Household Size |
| Married-Couple | 59 (23.1%) | 2.92 |
| Single Male/Father | 38 (14.8%) | 2.71 |
| Single Female/Mother | 61 (23.8%) | 3.39 |
| Non-family | 98 (38.3%) | 1.08 |
| Total Households | 256 (100.0%) | 2.30 |
Household Size by Marriage Status in Nassawadox
Out of a total of 256 households in Nassawadox, 158 (61.7%) are family households, while 98 (38.3%) are nonfamily households. The most numerous type of family households are 2-person households, comprising 60, and the most common type of nonfamily households are 1-person households, comprising 85.
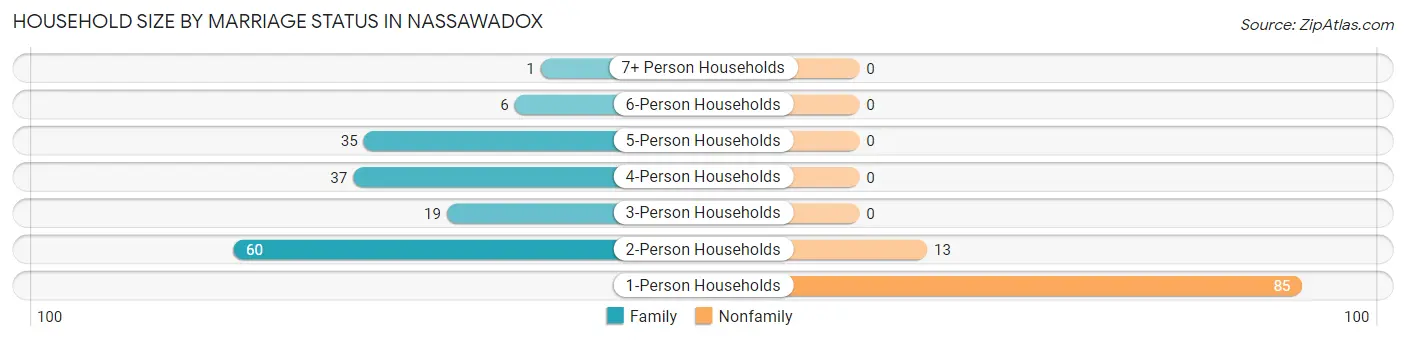
| Household Size | Family Households | Nonfamily Households |
| 1-Person Households | - | 85 (33.2%) |
| 2-Person Households | 60 (23.4%) | 13 (5.1%) |
| 3-Person Households | 19 (7.4%) | 0 (0.0%) |
| 4-Person Households | 37 (14.4%) | 0 (0.0%) |
| 5-Person Households | 35 (13.7%) | 0 (0.0%) |
| 6-Person Households | 6 (2.3%) | 0 (0.0%) |
| 7+ Person Households | 1 (0.4%) | 0 (0.0%) |
| Total | 158 (61.7%) | 98 (38.3%) |
Female Fertility in Nassawadox
Fertility by Age in Nassawadox
Average fertility rate in Nassawadox is 68.0 births per 1,000 women. Women in the age bracket of 20 to 34 years have the highest fertility rate with 120.0 births per 1,000 women. Women in the age bracket of 20 to 34 years acount for 100.0% of all women with births.
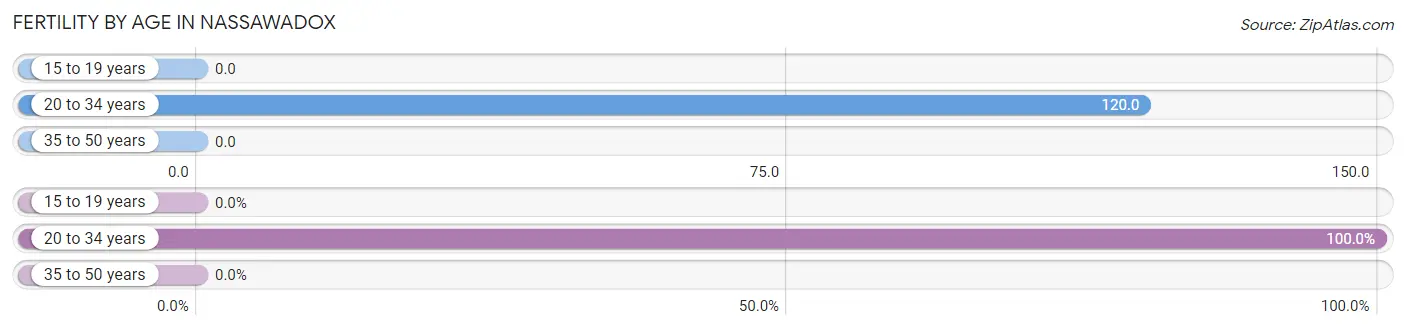
| Age Bracket | Women with Births | Births / 1,000 Women |
| 15 to 19 years | 0 (0.0%) | 0.0 |
| 20 to 34 years | 9 (100.0%) | 120.0 |
| 35 to 50 years | 0 (0.0%) | 0.0 |
| Total | 9 (100.0%) | 68.0 |
Fertility by Age by Marriage Status in Nassawadox
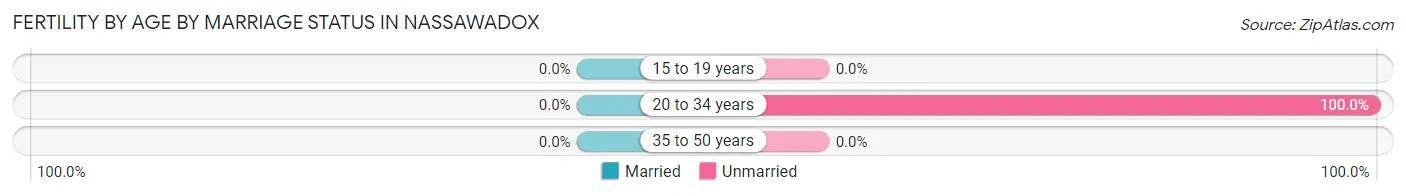
| Age Bracket | Married | Unmarried |
| 15 to 19 years | 0 (0.0%) | 0 (0.0%) |
| 20 to 34 years | 0 (0.0%) | 9 (100.0%) |
| 35 to 50 years | 0 (0.0%) | 0 (0.0%) |
| Total | 0 (0.0%) | 9 (100.0%) |
Fertility by Education in Nassawadox
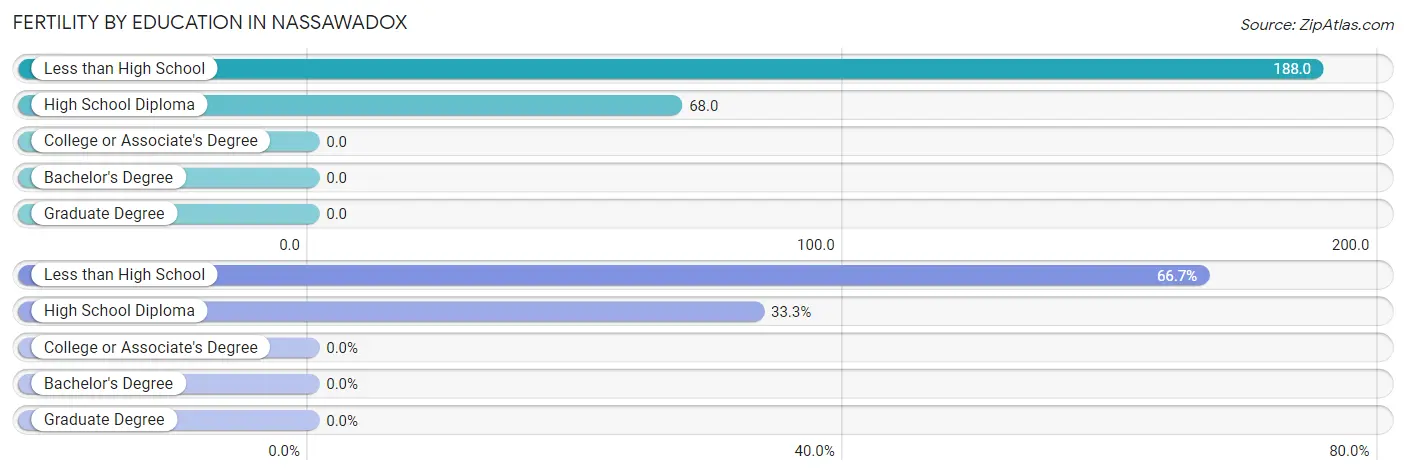
| Educational Attainment | Women with Births | Births / 1,000 Women |
| Less than High School | 6 (66.7%) | 188.0 |
| High School Diploma | 3 (33.3%) | 68.0 |
| College or Associate's Degree | 0 (0.0%) | 0.0 |
| Bachelor's Degree | 0 (0.0%) | 0.0 |
| Graduate Degree | 0 (0.0%) | 0.0 |
| Total | 9 (100.0%) | 68.0 |
Fertility by Education by Marriage Status in Nassawadox
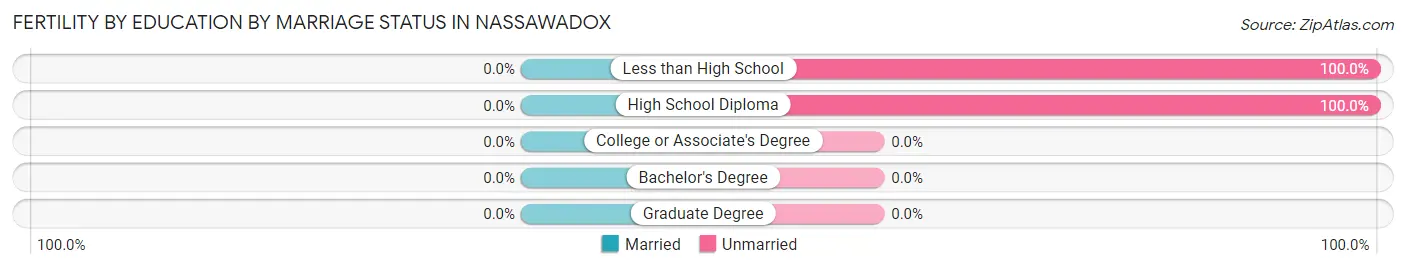
| Educational Attainment | Married | Unmarried |
| Less than High School | 0 (0.0%) | 6 (100.0%) |
| High School Diploma | 0 (0.0%) | 3 (100.0%) |
| College or Associate's Degree | 0 (0.0%) | 0 (0.0%) |
| Bachelor's Degree | 0 (0.0%) | 0 (0.0%) |
| Graduate Degree | 0 (0.0%) | 0 (0.0%) |
| Total | 0 (0.0%) | 9 (100.0%) |
Employment Characteristics in Nassawadox
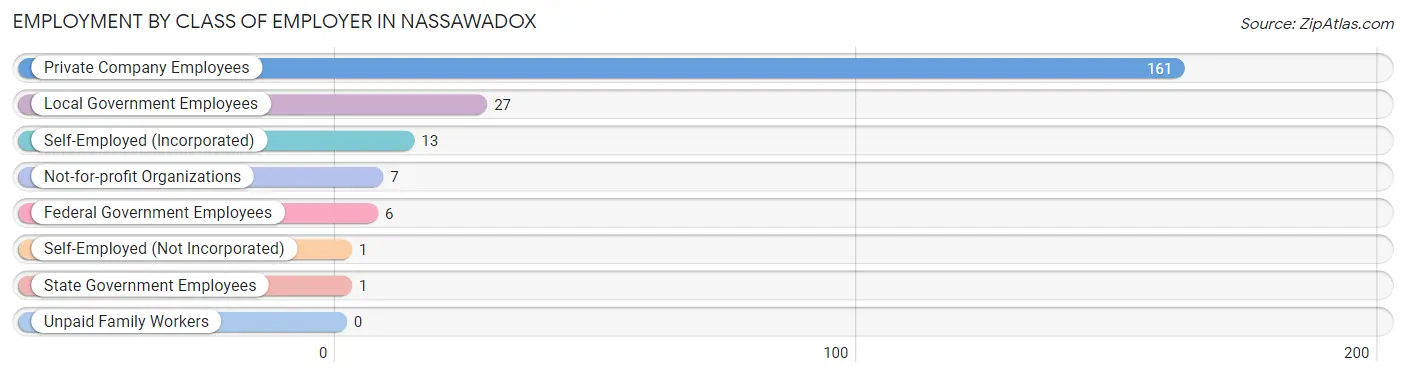
Employment by Class of Employer in Nassawadox
Among the 216 employed individuals in Nassawadox, private company employees (161 | 74.5%), local government employees (27 | 12.5%), and self-employed (incorporated) (13 | 6.0%) make up the most common classes of employment.
| Employer Class | # Employees | % Employees |
| Private Company Employees | 161 | 74.5% |
| Self-Employed (Incorporated) | 13 | 6.0% |
| Self-Employed (Not Incorporated) | 1 | 0.5% |
| Not-for-profit Organizations | 7 | 3.2% |
| Local Government Employees | 27 | 12.5% |
| State Government Employees | 1 | 0.5% |
| Federal Government Employees | 6 | 2.8% |
| Unpaid Family Workers | 0 | 0.0% |
| Total | 216 | 100.0% |
Employment Status by Age in Nassawadox
According to the labor force statistics for Nassawadox, out of the total population over 16 years of age (569), 40.6% or 231 individuals are in the labor force, with 3.9% or 9 of them unemployed. The age group with the highest labor force participation rate is 25 to 29 years, with 91.7% or 66 individuals in the labor force. Within the labor force, the 35 to 44 years age range has the highest percentage of unemployed individuals, with 24.2% or 8 of them being unemployed.
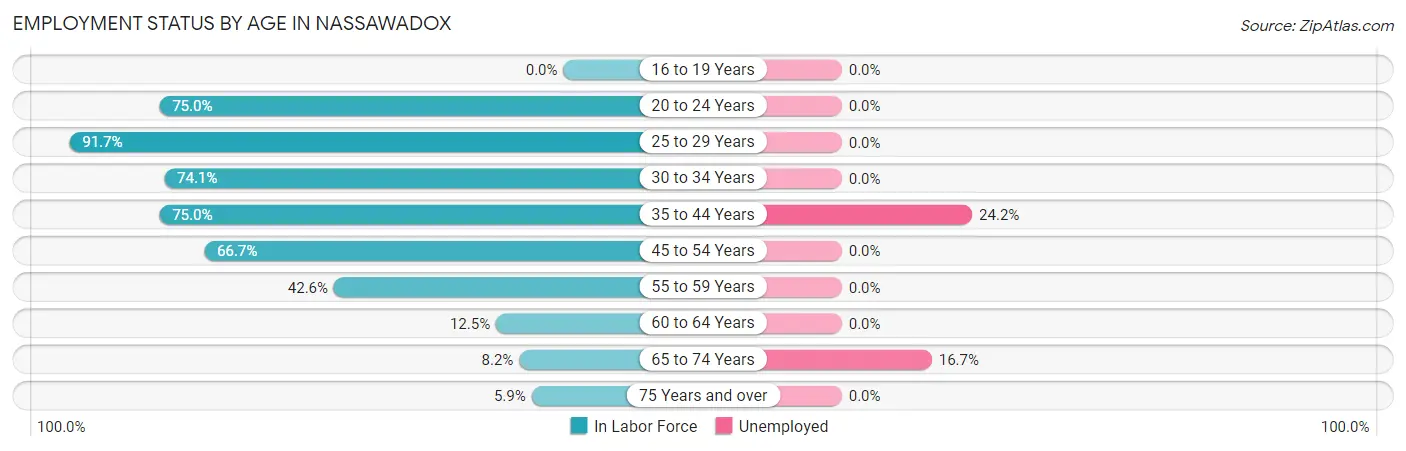
| Age Bracket | In Labor Force | Unemployed |
| 16 to 19 Years | 0 (0.0%) | 0 (0.0%) |
| 20 to 24 Years | 15 (75.0%) | 0 (0.0%) |
| 25 to 29 Years | 66 (91.7%) | 0 (0.0%) |
| 30 to 34 Years | 43 (74.1%) | 0 (0.0%) |
| 35 to 44 Years | 33 (75.0%) | 8 (24.2%) |
| 45 to 54 Years | 32 (66.7%) | 0 (0.0%) |
| 55 to 59 Years | 23 (42.6%) | 0 (0.0%) |
| 60 to 64 Years | 5 (12.5%) | 0 (0.0%) |
| 65 to 74 Years | 6 (8.2%) | 1 (16.7%) |
| 75 Years and over | 8 (5.9%) | 0 (0.0%) |
| Total | 231 (40.6%) | 9 (3.9%) |
Employment Status by Educational Attainment in Nassawadox
According to labor force statistics for Nassawadox, 63.9% of individuals (202) out of the total population between 25 and 64 years of age (316) are in the labor force, with 4.0% or 8 of them being unemployed. The group with the highest labor force participation rate are those with the educational attainment of bachelor's degree or higher, with 90.3% or 56 individuals in the labor force. Within the labor force, individuals with high school diploma education have the highest percentage of unemployment, with 8.2% or 8 of them being unemployed.
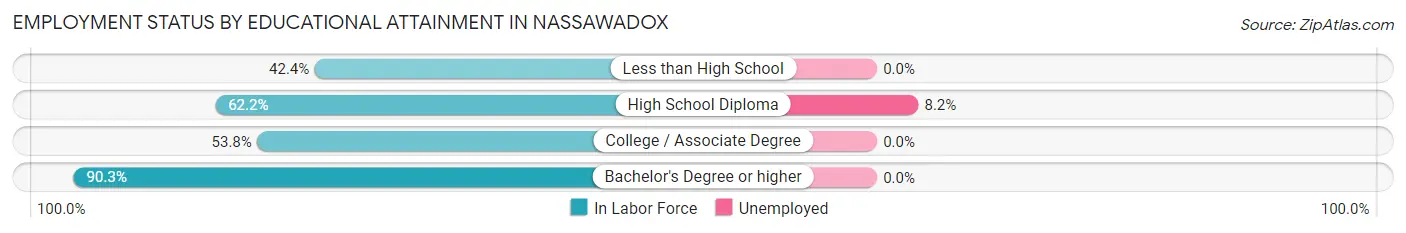
| Educational Attainment | In Labor Force | Unemployed |
| Less than High School | 14 (42.4%) | 0 (0.0%) |
| High School Diploma | 97 (62.2%) | 13 (8.2%) |
| College / Associate Degree | 35 (53.8%) | 0 (0.0%) |
| Bachelor's Degree or higher | 56 (90.3%) | 0 (0.0%) |
| Total | 202 (63.9%) | 13 (4.0%) |
Employment Occupations by Sex in Nassawadox
Management, Business, Science and Arts Occupations
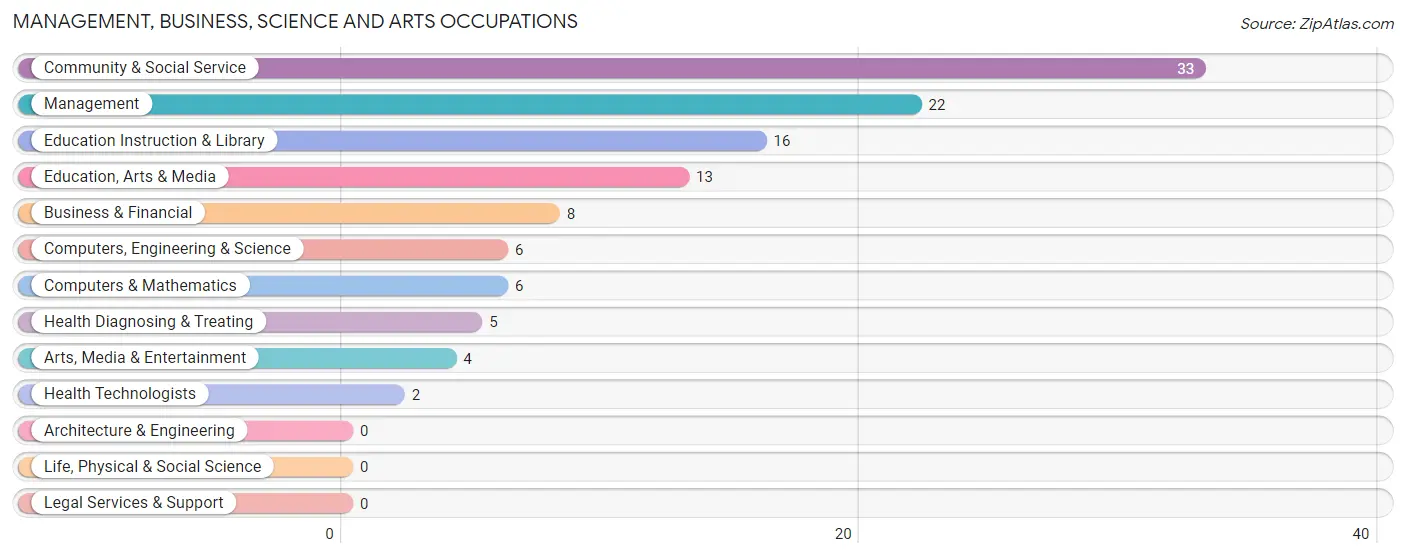
The most common Management, Business, Science and Arts occupations in Nassawadox are Community & Social Service (33 | 14.9%), Management (22 | 9.9%), Education Instruction & Library (16 | 7.2%), Education, Arts & Media (13 | 5.9%), and Business & Financial (8 | 3.6%).
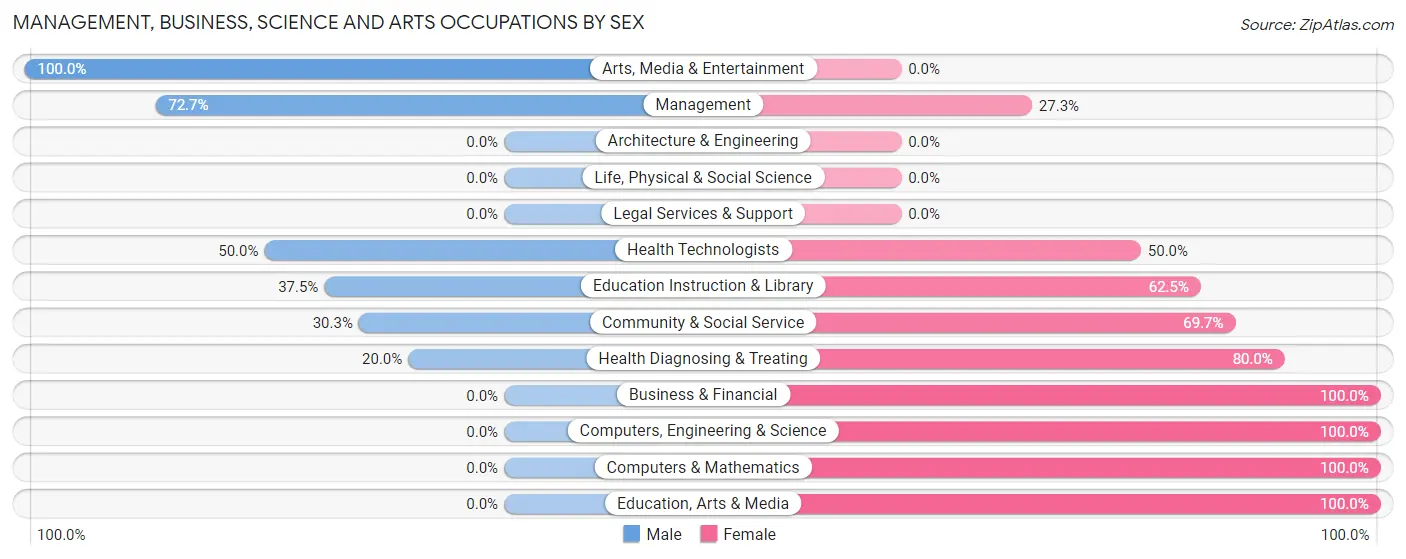
Management, Business, Science and Arts Occupations by Sex
Within the Management, Business, Science and Arts occupations in Nassawadox, the most male-oriented occupations are Arts, Media & Entertainment (100.0%), Management (72.7%), and Health Technologists (50.0%), while the most female-oriented occupations are Business & Financial (100.0%), Computers, Engineering & Science (100.0%), and Computers & Mathematics (100.0%).
| Occupation | Male | Female |
| Management | 16 (72.7%) | 6 (27.3%) |
| Business & Financial | 0 (0.0%) | 8 (100.0%) |
| Computers, Engineering & Science | 0 (0.0%) | 6 (100.0%) |
| Computers & Mathematics | 0 (0.0%) | 6 (100.0%) |
| Architecture & Engineering | 0 (0.0%) | 0 (0.0%) |
| Life, Physical & Social Science | 0 (0.0%) | 0 (0.0%) |
| Community & Social Service | 10 (30.3%) | 23 (69.7%) |
| Education, Arts & Media | 0 (0.0%) | 13 (100.0%) |
| Legal Services & Support | 0 (0.0%) | 0 (0.0%) |
| Education Instruction & Library | 6 (37.5%) | 10 (62.5%) |
| Arts, Media & Entertainment | 4 (100.0%) | 0 (0.0%) |
| Health Diagnosing & Treating | 1 (20.0%) | 4 (80.0%) |
| Health Technologists | 1 (50.0%) | 1 (50.0%) |
| Total (Category) | 27 (36.5%) | 47 (63.5%) |
| Total (Overall) | 113 (50.9%) | 109 (49.1%) |
Services Occupations
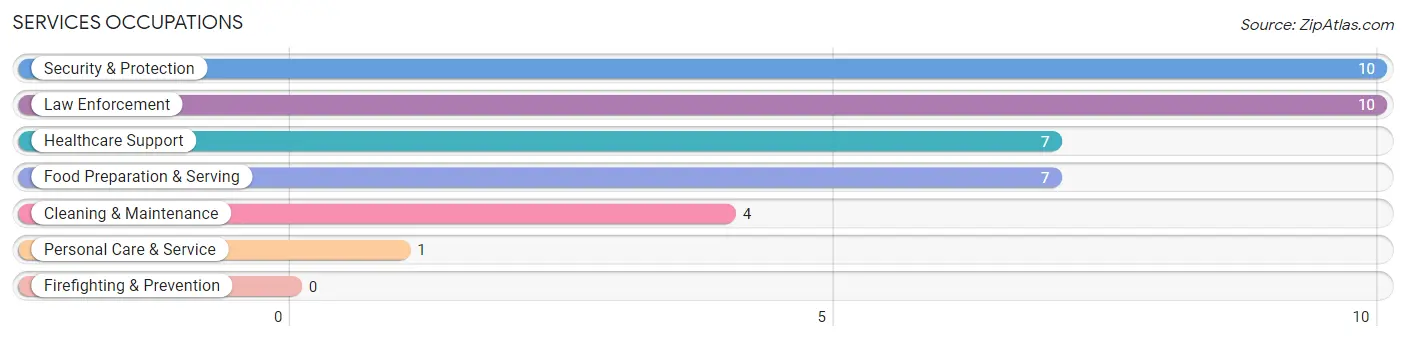
The most common Services occupations in Nassawadox are Security & Protection (10 | 4.5%), Law Enforcement (10 | 4.5%), Healthcare Support (7 | 3.2%), Food Preparation & Serving (7 | 3.2%), and Cleaning & Maintenance (4 | 1.8%).
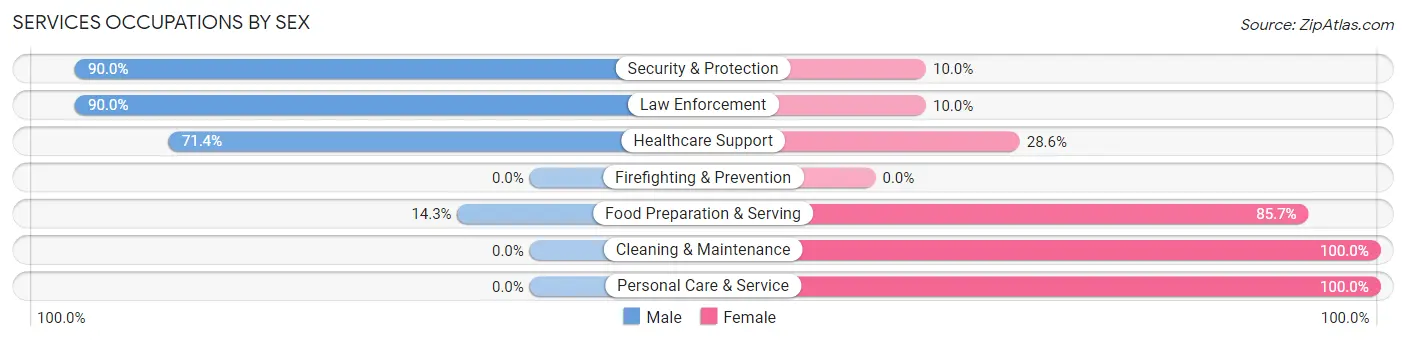
Services Occupations by Sex
Within the Services occupations in Nassawadox, the most male-oriented occupations are Security & Protection (90.0%), Law Enforcement (90.0%), and Healthcare Support (71.4%), while the most female-oriented occupations are Cleaning & Maintenance (100.0%), Personal Care & Service (100.0%), and Food Preparation & Serving (85.7%).
| Occupation | Male | Female |
| Healthcare Support | 5 (71.4%) | 2 (28.6%) |
| Security & Protection | 9 (90.0%) | 1 (10.0%) |
| Firefighting & Prevention | 0 (0.0%) | 0 (0.0%) |
| Law Enforcement | 9 (90.0%) | 1 (10.0%) |
| Food Preparation & Serving | 1 (14.3%) | 6 (85.7%) |
| Cleaning & Maintenance | 0 (0.0%) | 4 (100.0%) |
| Personal Care & Service | 0 (0.0%) | 1 (100.0%) |
| Total (Category) | 15 (51.7%) | 14 (48.3%) |
| Total (Overall) | 113 (50.9%) | 109 (49.1%) |
Sales and Office Occupations
The most common Sales and Office occupations in Nassawadox are Office & Administration (38 | 17.1%), and Sales & Related (22 | 9.9%).
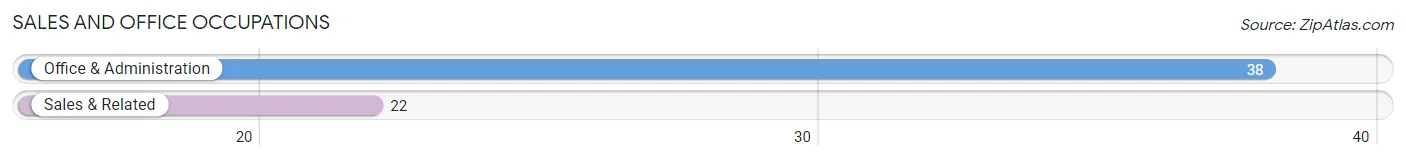
Sales and Office Occupations by Sex
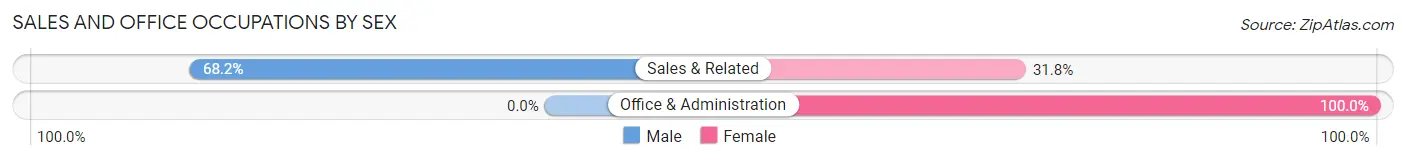
| Occupation | Male | Female |
| Sales & Related | 15 (68.2%) | 7 (31.8%) |
| Office & Administration | 0 (0.0%) | 38 (100.0%) |
| Total (Category) | 15 (25.0%) | 45 (75.0%) |
| Total (Overall) | 113 (50.9%) | 109 (49.1%) |
Natural Resources, Construction and Maintenance Occupations
The most common Natural Resources, Construction and Maintenance occupations in Nassawadox are Installation, Maintenance & Repair (35 | 15.8%), Farming, Fishing & Forestry (15 | 6.8%), and Construction & Extraction (6 | 2.7%).
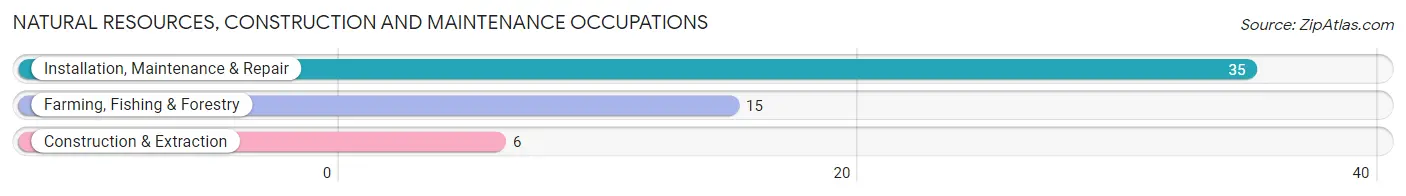
Natural Resources, Construction and Maintenance Occupations by Sex
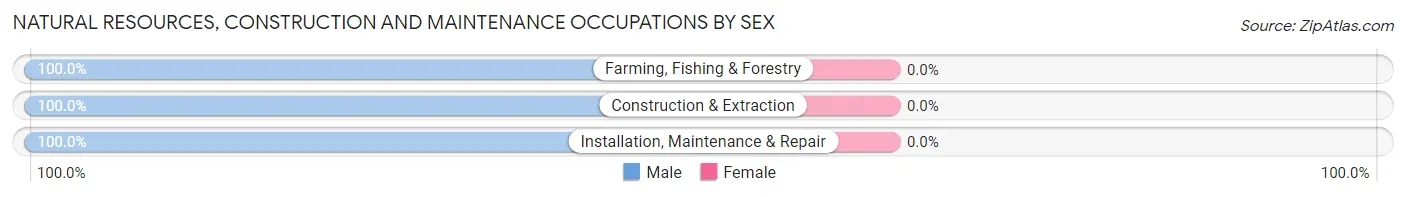
| Occupation | Male | Female |
| Farming, Fishing & Forestry | 15 (100.0%) | 0 (0.0%) |
| Construction & Extraction | 6 (100.0%) | 0 (0.0%) |
| Installation, Maintenance & Repair | 35 (100.0%) | 0 (0.0%) |
| Total (Category) | 56 (100.0%) | 0 (0.0%) |
| Total (Overall) | 113 (50.9%) | 109 (49.1%) |
Production, Transportation and Moving Occupations
The most common Production, Transportation and Moving occupations in Nassawadox are , and Production (3 | 1.3%).
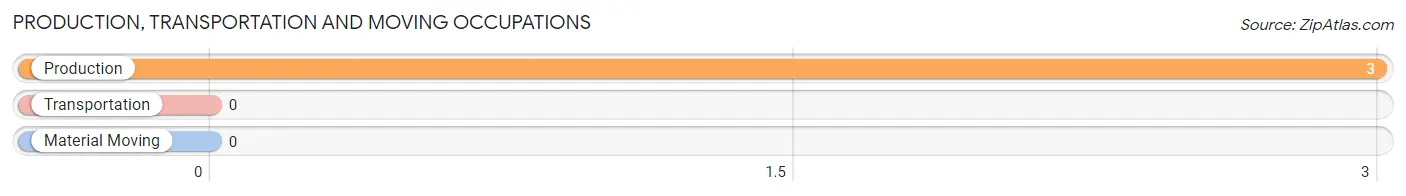
Production, Transportation and Moving Occupations by Sex
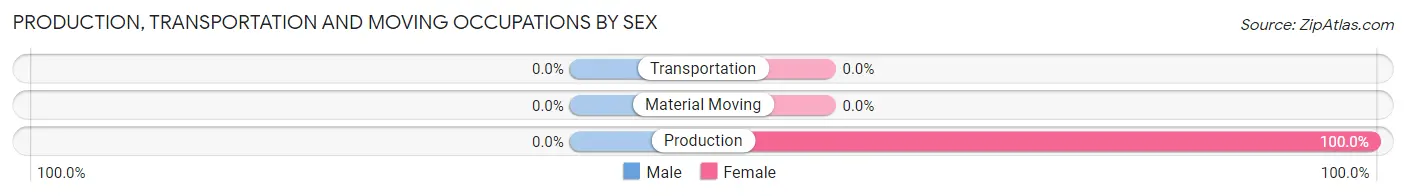
| Occupation | Male | Female |
| Production | 0 (0.0%) | 3 (100.0%) |
| Transportation | 0 (0.0%) | 0 (0.0%) |
| Material Moving | 0 (0.0%) | 0 (0.0%) |
| Total (Category) | 0 (0.0%) | 3 (100.0%) |
| Total (Overall) | 113 (50.9%) | 109 (49.1%) |
Employment Industries by Sex in Nassawadox
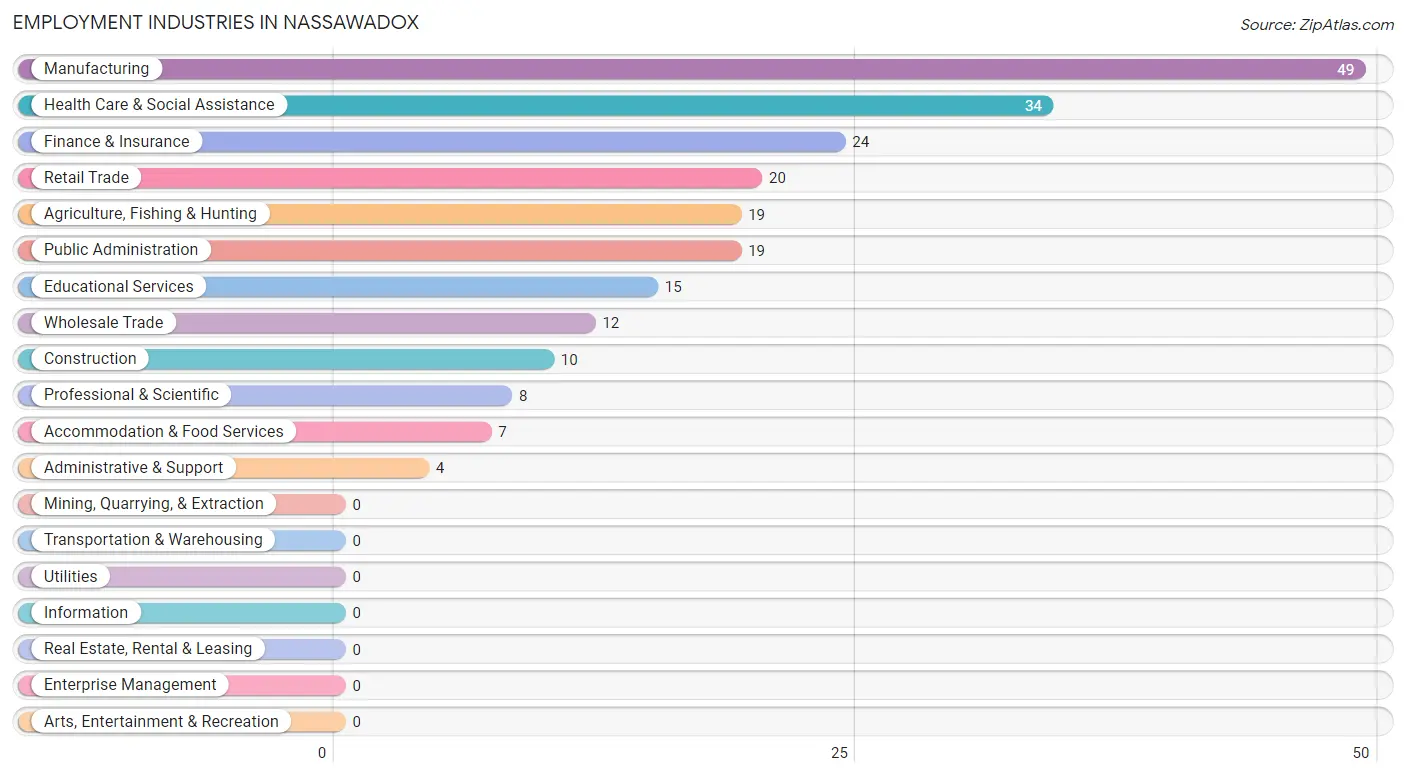
Employment Industries in Nassawadox
The major employment industries in Nassawadox include Manufacturing (49 | 22.1%), Health Care & Social Assistance (34 | 15.3%), Finance & Insurance (24 | 10.8%), Retail Trade (20 | 9.0%), and Agriculture, Fishing & Hunting (19 | 8.6%).
Employment Industries by Sex in Nassawadox
The Nassawadox industries that see more men than women are Agriculture, Fishing & Hunting (100.0%), Construction (100.0%), and Wholesale Trade (100.0%), whereas the industries that tend to have a higher number of women are Finance & Insurance (100.0%), Professional & Scientific (100.0%), and Administrative & Support (100.0%).
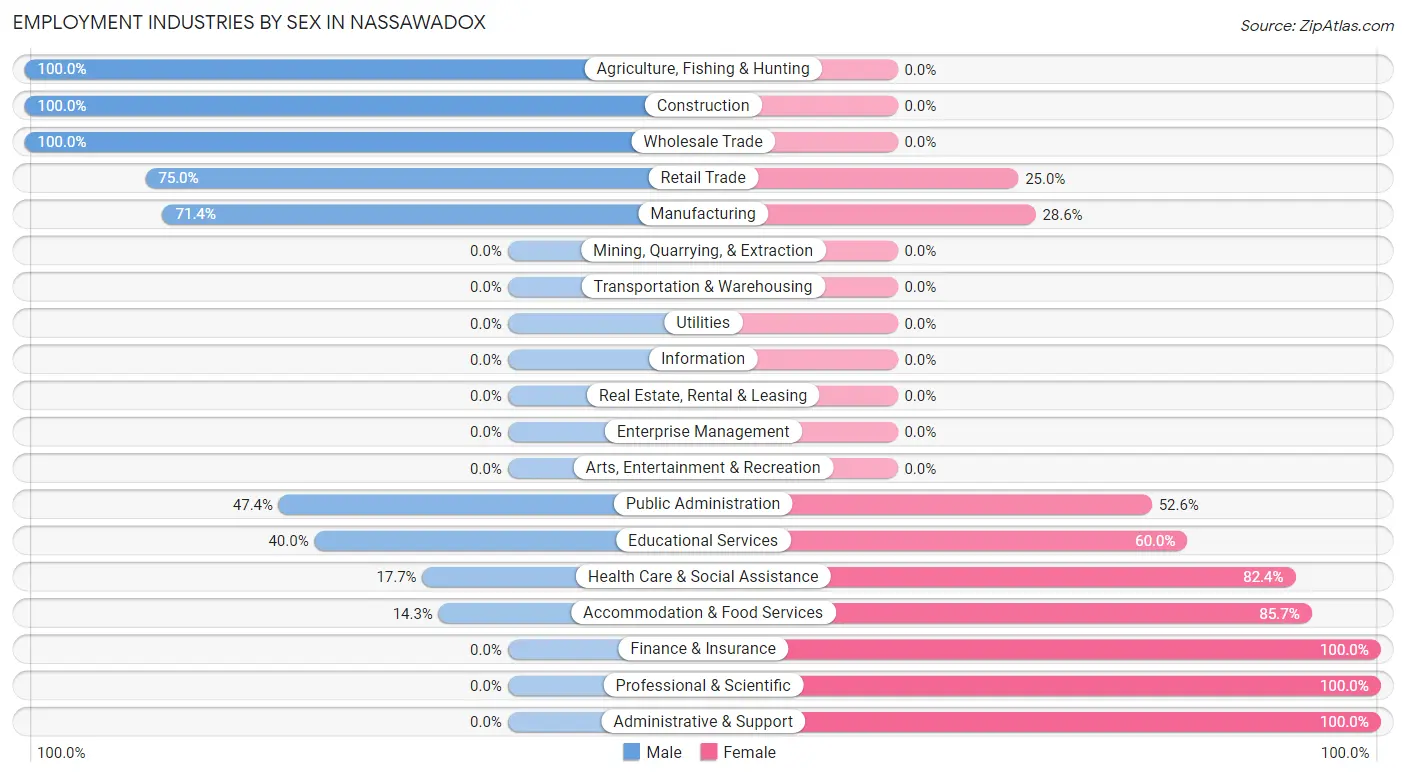
| Industry | Male | Female |
| Agriculture, Fishing & Hunting | 19 (100.0%) | 0 (0.0%) |
| Mining, Quarrying, & Extraction | 0 (0.0%) | 0 (0.0%) |
| Construction | 10 (100.0%) | 0 (0.0%) |
| Manufacturing | 35 (71.4%) | 14 (28.6%) |
| Wholesale Trade | 12 (100.0%) | 0 (0.0%) |
| Retail Trade | 15 (75.0%) | 5 (25.0%) |
| Transportation & Warehousing | 0 (0.0%) | 0 (0.0%) |
| Utilities | 0 (0.0%) | 0 (0.0%) |
| Information | 0 (0.0%) | 0 (0.0%) |
| Finance & Insurance | 0 (0.0%) | 24 (100.0%) |
| Real Estate, Rental & Leasing | 0 (0.0%) | 0 (0.0%) |
| Professional & Scientific | 0 (0.0%) | 8 (100.0%) |
| Enterprise Management | 0 (0.0%) | 0 (0.0%) |
| Administrative & Support | 0 (0.0%) | 4 (100.0%) |
| Educational Services | 6 (40.0%) | 9 (60.0%) |
| Health Care & Social Assistance | 6 (17.6%) | 28 (82.4%) |
| Arts, Entertainment & Recreation | 0 (0.0%) | 0 (0.0%) |
| Accommodation & Food Services | 1 (14.3%) | 6 (85.7%) |
| Public Administration | 9 (47.4%) | 10 (52.6%) |
| Total | 113 (50.9%) | 109 (49.1%) |
Education in Nassawadox
School Enrollment in Nassawadox
The most common levels of schooling among the 190 students in Nassawadox are elementary school (82 | 43.2%), middle school (47 | 24.7%), and high school (26 | 13.7%).
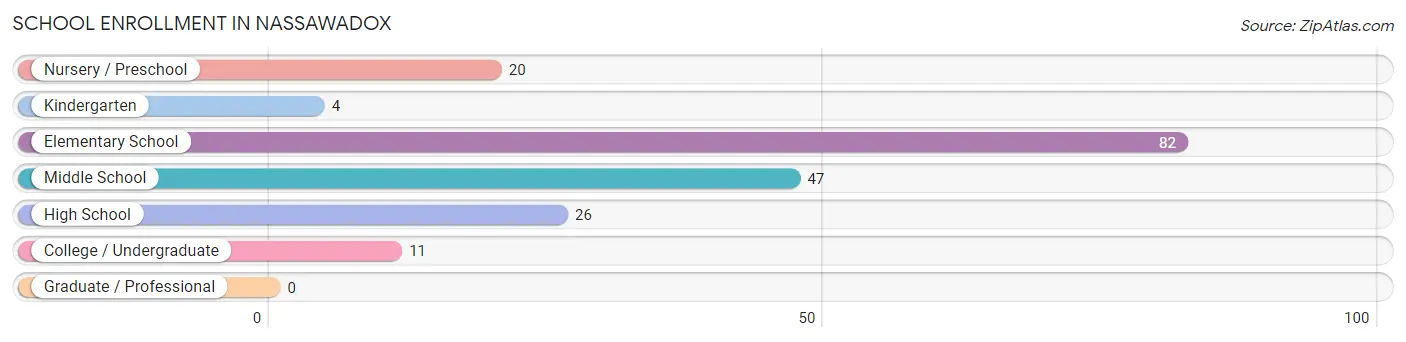
| School Level | # Students | % Students |
| Nursery / Preschool | 20 | 10.5% |
| Kindergarten | 4 | 2.1% |
| Elementary School | 82 | 43.2% |
| Middle School | 47 | 24.7% |
| High School | 26 | 13.7% |
| College / Undergraduate | 11 | 5.8% |
| Graduate / Professional | 0 | 0.0% |
| Total | 190 | 100.0% |
School Enrollment by Age by Funding Source in Nassawadox
Out of a total of 190 students who are enrolled in schools in Nassawadox, 25 (13.2%) attend a private institution, while the remaining 165 (86.8%) are enrolled in public schools. The age group of 25 to 34 year olds has the highest likelihood of being enrolled in private schools, with 11 (100.0% in the age bracket) enrolled. Conversely, the age group of 35 years and over has the lowest likelihood of being enrolled in a private school, with 1 (100.0% in the age bracket) attending a public institution.
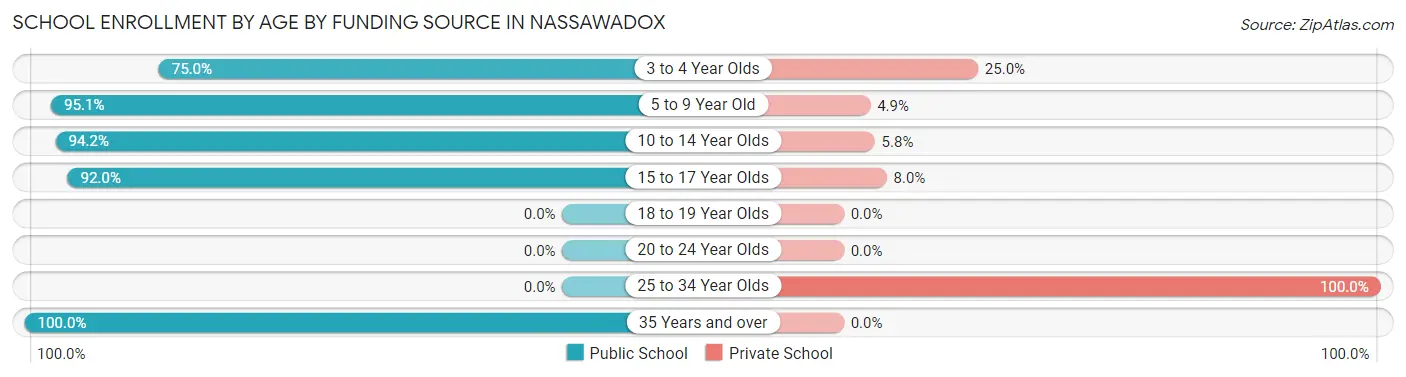
| Age Bracket | Public School | Private School |
| 3 to 4 Year Olds | 15 (75.0%) | 5 (25.0%) |
| 5 to 9 Year Old | 77 (95.1%) | 4 (4.9%) |
| 10 to 14 Year Olds | 49 (94.2%) | 3 (5.8%) |
| 15 to 17 Year Olds | 23 (92.0%) | 2 (8.0%) |
| 18 to 19 Year Olds | 0 (0.0%) | 0 (0.0%) |
| 20 to 24 Year Olds | 0 (0.0%) | 0 (0.0%) |
| 25 to 34 Year Olds | 0 (0.0%) | 11 (100.0%) |
| 35 Years and over | 1 (100.0%) | 0 (0.0%) |
| Total | 165 (86.8%) | 25 (13.2%) |
Educational Attainment by Field of Study in Nassawadox
Education (24 | 23.1%), business (22 | 21.1%), social sciences (10 | 9.6%), liberal arts & history (10 | 9.6%), and arts & humanities (9 | 8.6%) are the most common fields of study among 104 individuals in Nassawadox who have obtained a bachelor's degree or higher.
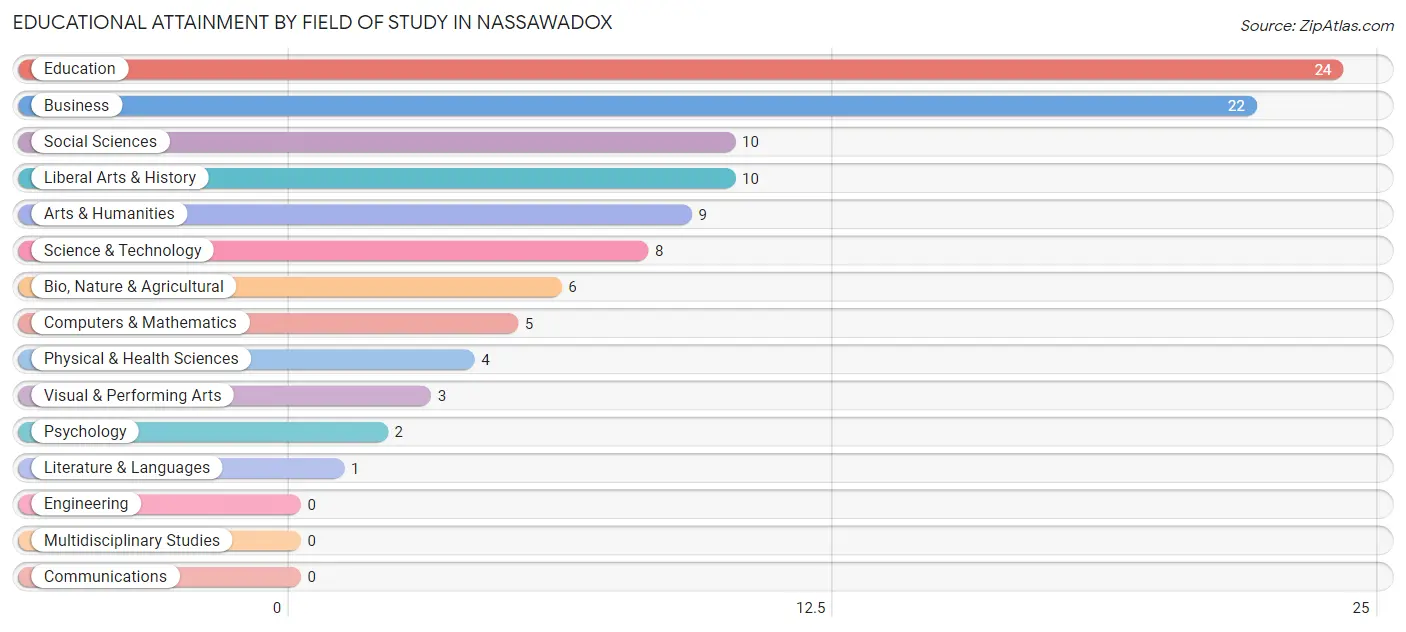
| Field of Study | # Graduates | % Graduates |
| Computers & Mathematics | 5 | 4.8% |
| Bio, Nature & Agricultural | 6 | 5.8% |
| Physical & Health Sciences | 4 | 3.8% |
| Psychology | 2 | 1.9% |
| Social Sciences | 10 | 9.6% |
| Engineering | 0 | 0.0% |
| Multidisciplinary Studies | 0 | 0.0% |
| Science & Technology | 8 | 7.7% |
| Business | 22 | 21.1% |
| Education | 24 | 23.1% |
| Literature & Languages | 1 | 1.0% |
| Liberal Arts & History | 10 | 9.6% |
| Visual & Performing Arts | 3 | 2.9% |
| Communications | 0 | 0.0% |
| Arts & Humanities | 9 | 8.6% |
| Total | 104 | 100.0% |
Transportation & Commute in Nassawadox
Vehicle Availability by Sex in Nassawadox
The most prevalent vehicle ownership categories in Nassawadox are males with 2 vehicles (69, accounting for 61.1%) and females with 2 vehicles (24, making up 67.0%).
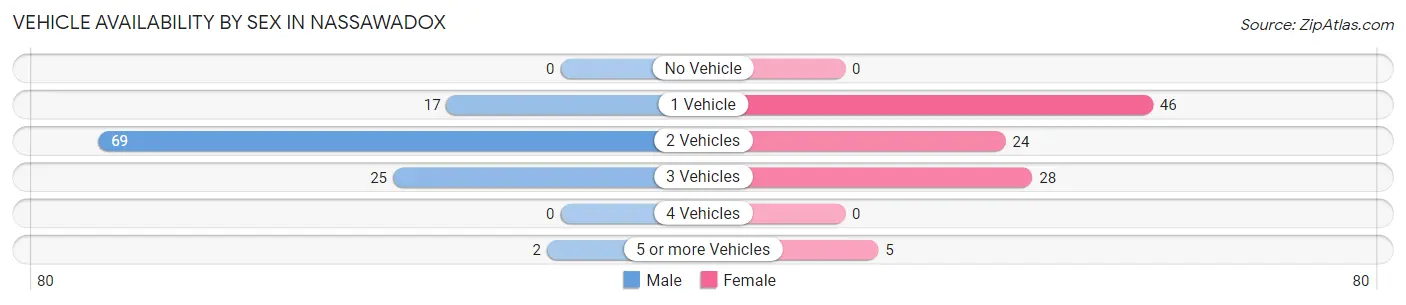
| Vehicles Available | Male | Female |
| No Vehicle | 0 (0.0%) | 0 (0.0%) |
| 1 Vehicle | 17 (15.0%) | 46 (44.7%) |
| 2 Vehicles | 69 (61.1%) | 24 (23.3%) |
| 3 Vehicles | 25 (22.1%) | 28 (27.2%) |
| 4 Vehicles | 0 (0.0%) | 0 (0.0%) |
| 5 or more Vehicles | 2 (1.8%) | 5 (4.9%) |
| Total | 113 (100.0%) | 103 (100.0%) |
Commute Time in Nassawadox
The most frequently occuring commute durations in Nassawadox are 30 to 34 minutes (51 commuters, 24.9%), 25 to 29 minutes (46 commuters, 22.4%), and 20 to 24 minutes (31 commuters, 15.1%).
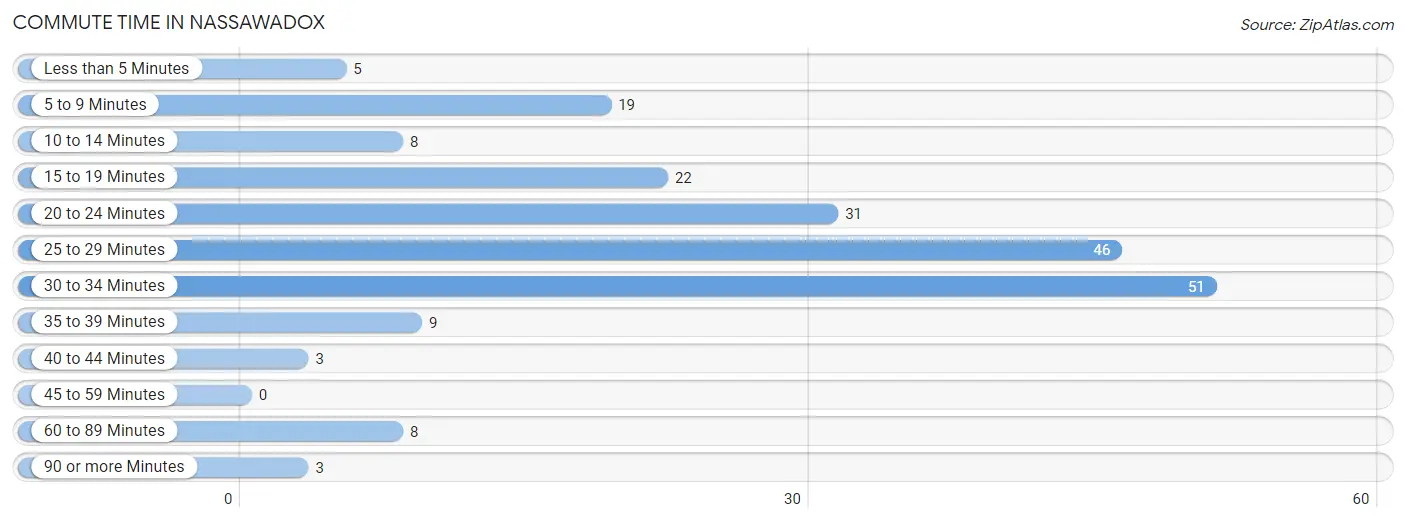
| Commute Time | # Commuters | % Commuters |
| Less than 5 Minutes | 5 | 2.4% |
| 5 to 9 Minutes | 19 | 9.3% |
| 10 to 14 Minutes | 8 | 3.9% |
| 15 to 19 Minutes | 22 | 10.7% |
| 20 to 24 Minutes | 31 | 15.1% |
| 25 to 29 Minutes | 46 | 22.4% |
| 30 to 34 Minutes | 51 | 24.9% |
| 35 to 39 Minutes | 9 | 4.4% |
| 40 to 44 Minutes | 3 | 1.5% |
| 45 to 59 Minutes | 0 | 0.0% |
| 60 to 89 Minutes | 8 | 3.9% |
| 90 or more Minutes | 3 | 1.5% |
Commute Time by Sex in Nassawadox
The most common commute times in Nassawadox are 30 to 34 minutes (41 commuters, 36.3%) for males and 25 to 29 minutes (37 commuters, 40.2%) for females.
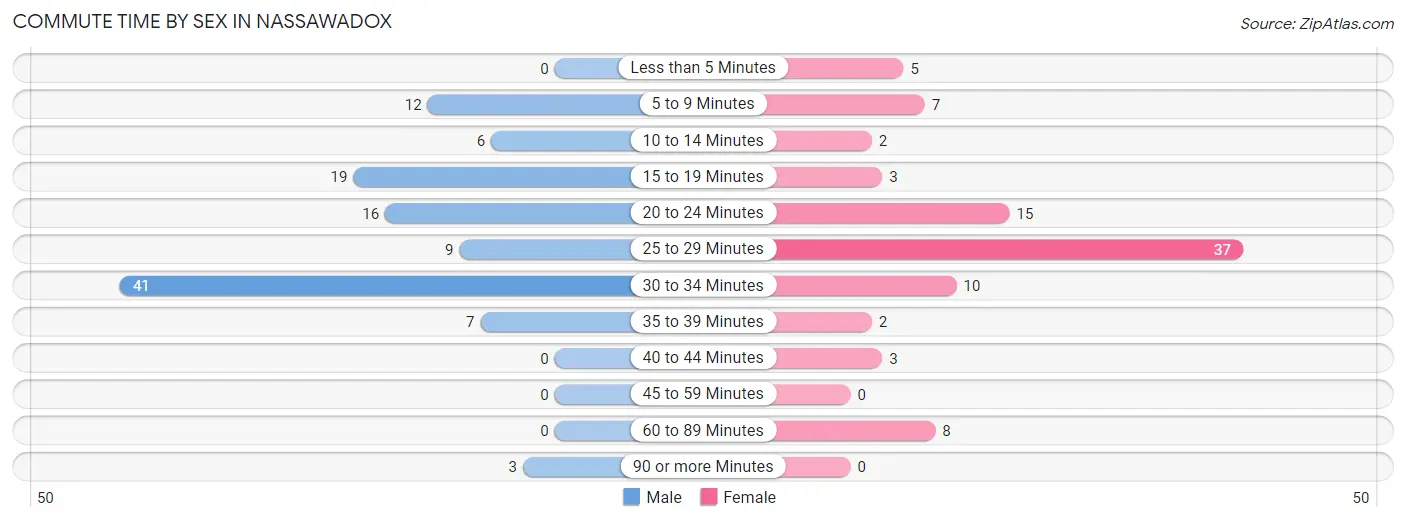
| Commute Time | Male | Female |
| Less than 5 Minutes | 0 (0.0%) | 5 (5.4%) |
| 5 to 9 Minutes | 12 (10.6%) | 7 (7.6%) |
| 10 to 14 Minutes | 6 (5.3%) | 2 (2.2%) |
| 15 to 19 Minutes | 19 (16.8%) | 3 (3.3%) |
| 20 to 24 Minutes | 16 (14.2%) | 15 (16.3%) |
| 25 to 29 Minutes | 9 (8.0%) | 37 (40.2%) |
| 30 to 34 Minutes | 41 (36.3%) | 10 (10.9%) |
| 35 to 39 Minutes | 7 (6.2%) | 2 (2.2%) |
| 40 to 44 Minutes | 0 (0.0%) | 3 (3.3%) |
| 45 to 59 Minutes | 0 (0.0%) | 0 (0.0%) |
| 60 to 89 Minutes | 0 (0.0%) | 8 (8.7%) |
| 90 or more Minutes | 3 (2.6%) | 0 (0.0%) |
Time of Departure to Work by Sex in Nassawadox
The most frequent times of departure to work in Nassawadox are 7:00 AM to 7:29 AM (53, 46.9%) for males and 6:30 AM to 6:59 AM (24, 26.1%) for females.
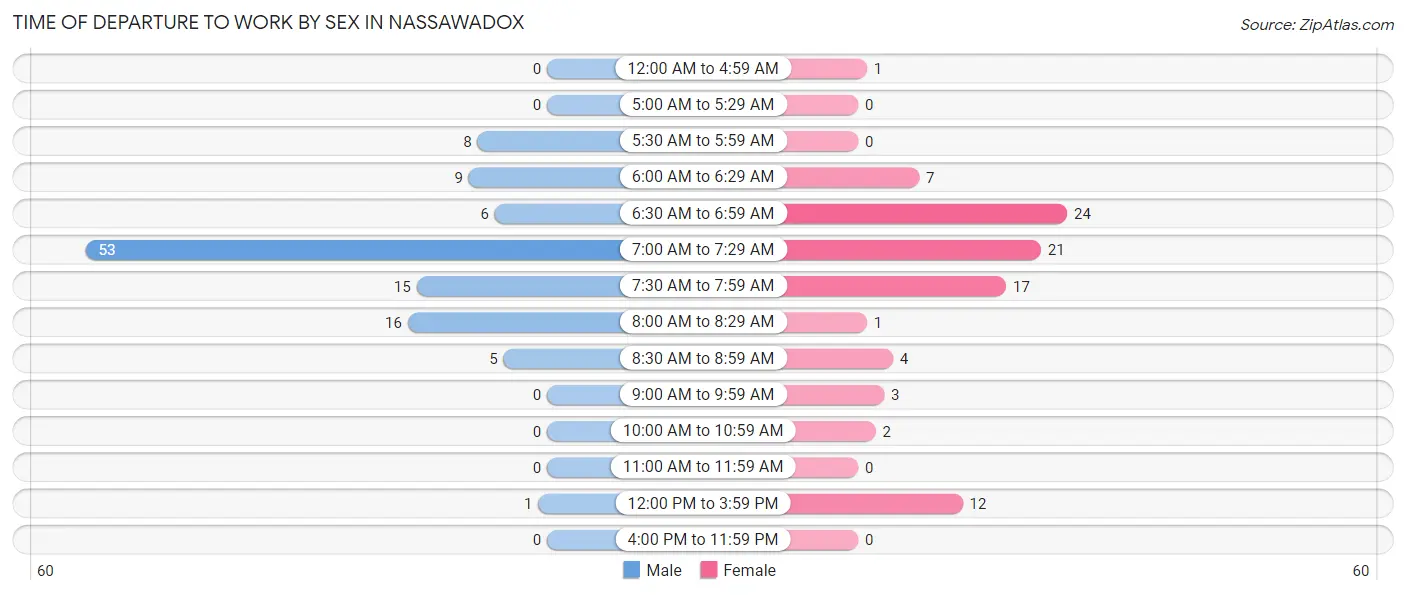
| Time of Departure | Male | Female |
| 12:00 AM to 4:59 AM | 0 (0.0%) | 1 (1.1%) |
| 5:00 AM to 5:29 AM | 0 (0.0%) | 0 (0.0%) |
| 5:30 AM to 5:59 AM | 8 (7.1%) | 0 (0.0%) |
| 6:00 AM to 6:29 AM | 9 (8.0%) | 7 (7.6%) |
| 6:30 AM to 6:59 AM | 6 (5.3%) | 24 (26.1%) |
| 7:00 AM to 7:29 AM | 53 (46.9%) | 21 (22.8%) |
| 7:30 AM to 7:59 AM | 15 (13.3%) | 17 (18.5%) |
| 8:00 AM to 8:29 AM | 16 (14.2%) | 1 (1.1%) |
| 8:30 AM to 8:59 AM | 5 (4.4%) | 4 (4.3%) |
| 9:00 AM to 9:59 AM | 0 (0.0%) | 3 (3.3%) |
| 10:00 AM to 10:59 AM | 0 (0.0%) | 2 (2.2%) |
| 11:00 AM to 11:59 AM | 0 (0.0%) | 0 (0.0%) |
| 12:00 PM to 3:59 PM | 1 (0.9%) | 12 (13.0%) |
| 4:00 PM to 11:59 PM | 0 (0.0%) | 0 (0.0%) |
| Total | 113 (100.0%) | 92 (100.0%) |
Housing Occupancy in Nassawadox
Occupancy by Ownership in Nassawadox
Of the total 256 dwellings in Nassawadox, owner-occupied units account for 160 (62.5%), while renter-occupied units make up 96 (37.5%).
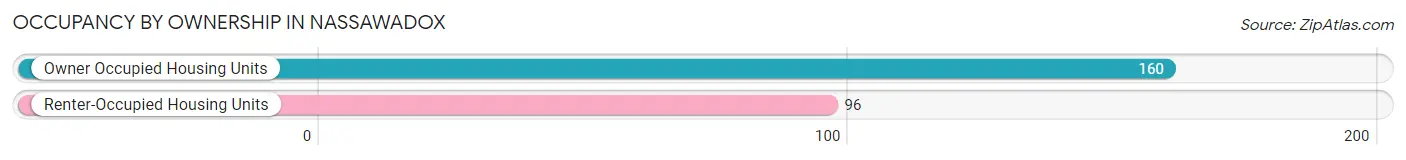
| Occupancy | # Housing Units | % Housing Units |
| Owner Occupied Housing Units | 160 | 62.5% |
| Renter-Occupied Housing Units | 96 | 37.5% |
| Total Occupied Housing Units | 256 | 100.0% |
Occupancy by Household Size in Nassawadox
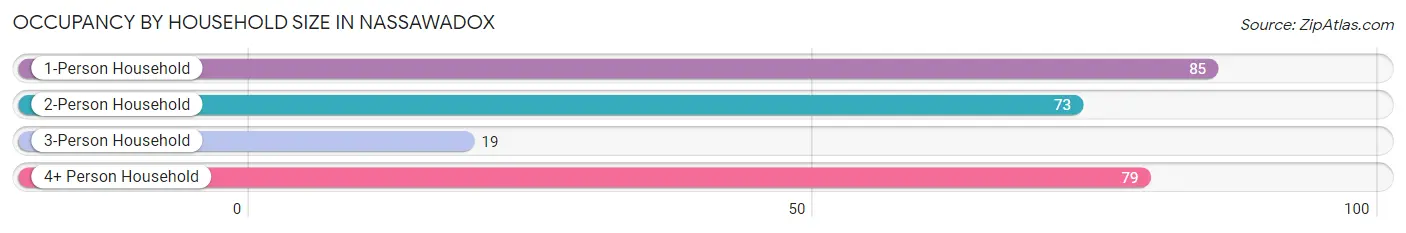
| Household Size | # Housing Units | % Housing Units |
| 1-Person Household | 85 | 33.2% |
| 2-Person Household | 73 | 28.5% |
| 3-Person Household | 19 | 7.4% |
| 4+ Person Household | 79 | 30.9% |
| Total Housing Units | 256 | 100.0% |
Occupancy by Ownership by Household Size in Nassawadox
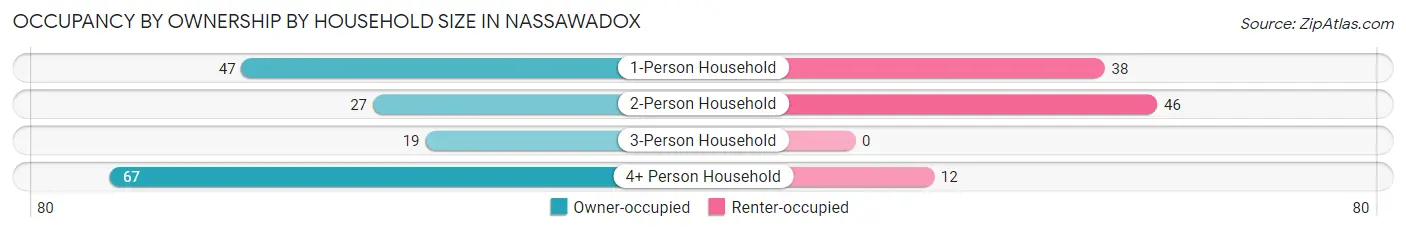
| Household Size | Owner-occupied | Renter-occupied |
| 1-Person Household | 47 (55.3%) | 38 (44.7%) |
| 2-Person Household | 27 (37.0%) | 46 (63.0%) |
| 3-Person Household | 19 (100.0%) | 0 (0.0%) |
| 4+ Person Household | 67 (84.8%) | 12 (15.2%) |
| Total Housing Units | 160 (62.5%) | 96 (37.5%) |
Occupancy by Educational Attainment in Nassawadox
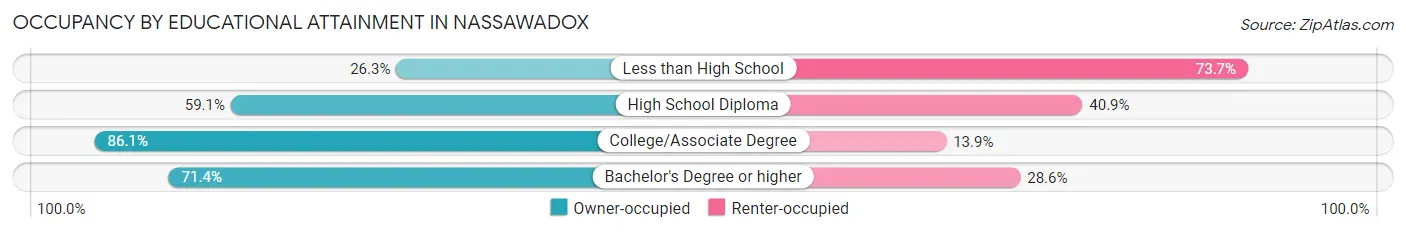
| Household Size | Owner-occupied | Renter-occupied |
| Less than High School | 5 (26.3%) | 14 (73.7%) |
| High School Diploma | 94 (59.1%) | 65 (40.9%) |
| College/Associate Degree | 31 (86.1%) | 5 (13.9%) |
| Bachelor's Degree or higher | 30 (71.4%) | 12 (28.6%) |
Occupancy by Age of Householder in Nassawadox
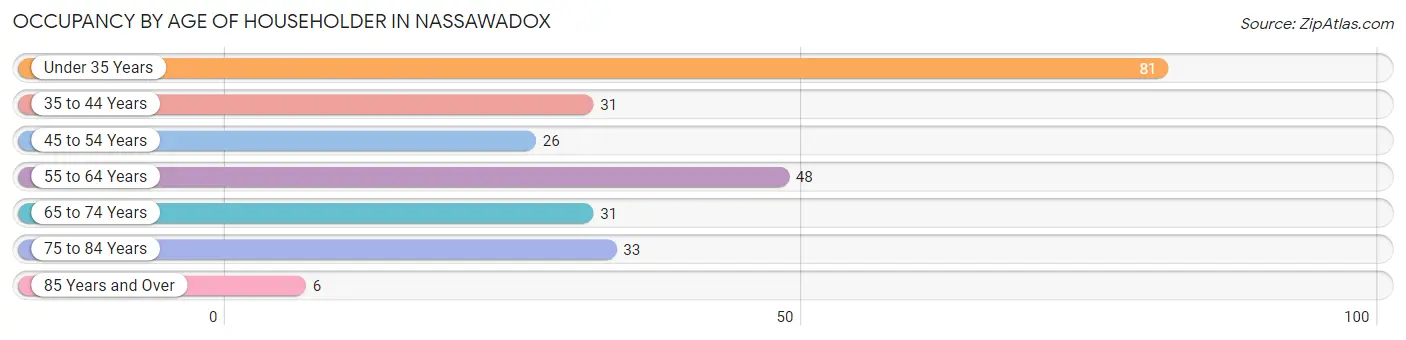
| Age Bracket | # Households | % Households |
| Under 35 Years | 81 | 31.6% |
| 35 to 44 Years | 31 | 12.1% |
| 45 to 54 Years | 26 | 10.2% |
| 55 to 64 Years | 48 | 18.8% |
| 65 to 74 Years | 31 | 12.1% |
| 75 to 84 Years | 33 | 12.9% |
| 85 Years and Over | 6 | 2.3% |
| Total | 256 | 100.0% |
Housing Finances in Nassawadox
Median Income by Occupancy in Nassawadox
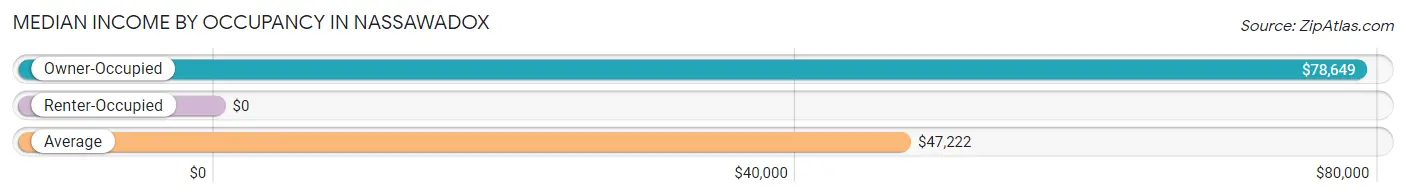
| Occupancy Type | # Households | Median Income |
| Owner-Occupied | 160 (62.5%) | $78,649 |
| Renter-Occupied | 96 (37.5%) | $0 |
| Average | 256 (100.0%) | $47,222 |
Occupancy by Householder Income Bracket in Nassawadox
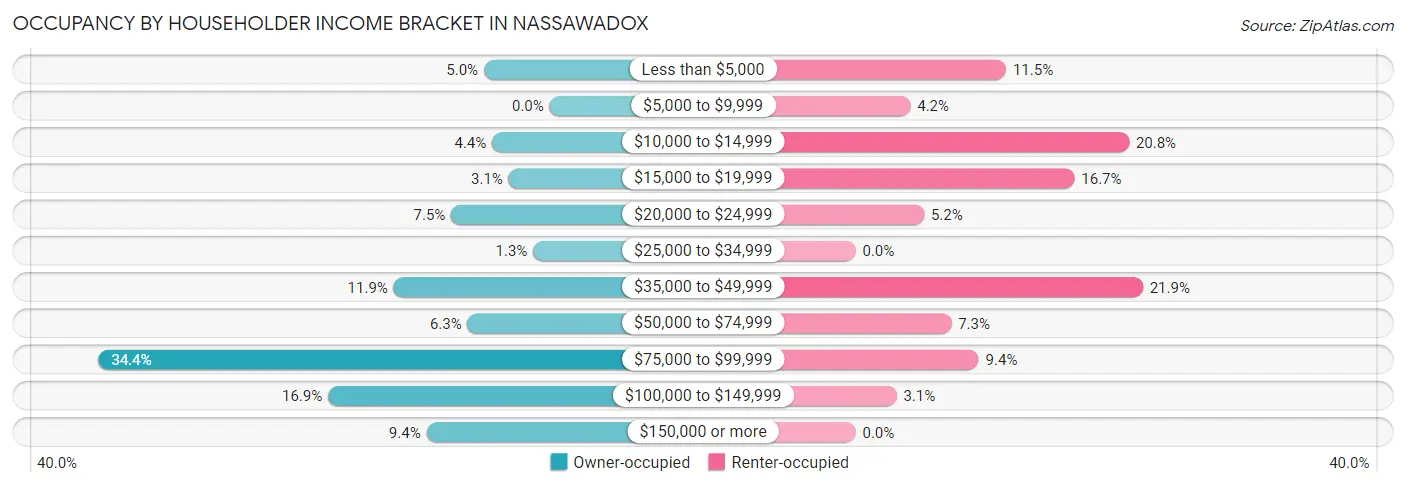
| Income Bracket | Owner-occupied | Renter-occupied |
| Less than $5,000 | 8 (5.0%) | 11 (11.5%) |
| $5,000 to $9,999 | 0 (0.0%) | 4 (4.2%) |
| $10,000 to $14,999 | 7 (4.4%) | 20 (20.8%) |
| $15,000 to $19,999 | 5 (3.1%) | 16 (16.7%) |
| $20,000 to $24,999 | 12 (7.5%) | 5 (5.2%) |
| $25,000 to $34,999 | 2 (1.3%) | 0 (0.0%) |
| $35,000 to $49,999 | 19 (11.9%) | 21 (21.9%) |
| $50,000 to $74,999 | 10 (6.2%) | 7 (7.3%) |
| $75,000 to $99,999 | 55 (34.4%) | 9 (9.4%) |
| $100,000 to $149,999 | 27 (16.9%) | 3 (3.1%) |
| $150,000 or more | 15 (9.4%) | 0 (0.0%) |
| Total | 160 (100.0%) | 96 (100.0%) |
Monthly Housing Cost Tiers in Nassawadox
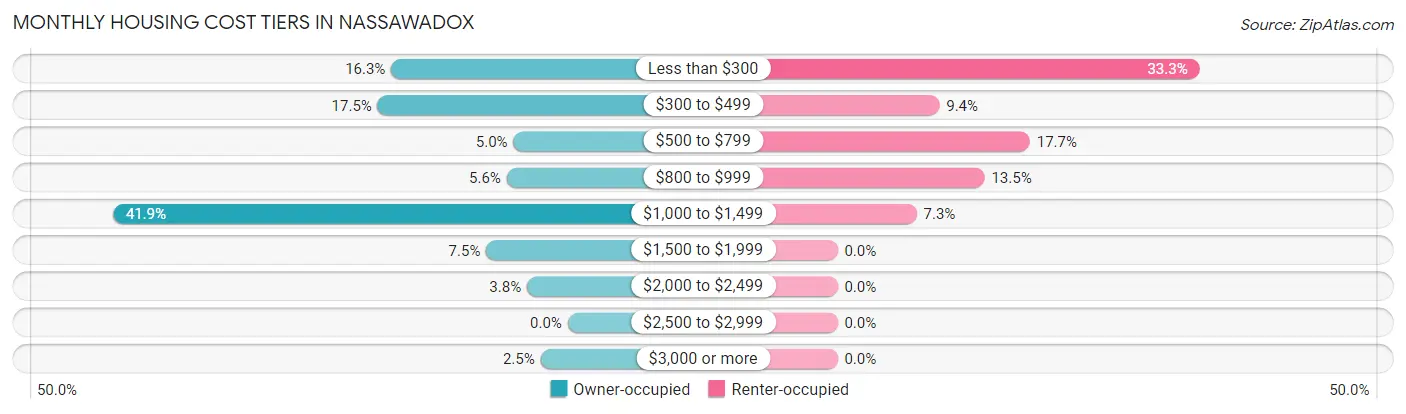
| Monthly Cost | Owner-occupied | Renter-occupied |
| Less than $300 | 26 (16.3%) | 32 (33.3%) |
| $300 to $499 | 28 (17.5%) | 9 (9.4%) |
| $500 to $799 | 8 (5.0%) | 17 (17.7%) |
| $800 to $999 | 9 (5.6%) | 13 (13.5%) |
| $1,000 to $1,499 | 67 (41.9%) | 7 (7.3%) |
| $1,500 to $1,999 | 12 (7.5%) | 0 (0.0%) |
| $2,000 to $2,499 | 6 (3.7%) | 0 (0.0%) |
| $2,500 to $2,999 | 0 (0.0%) | 0 (0.0%) |
| $3,000 or more | 4 (2.5%) | 0 (0.0%) |
| Total | 160 (100.0%) | 96 (100.0%) |
Physical Housing Characteristics in Nassawadox
Housing Structures in Nassawadox
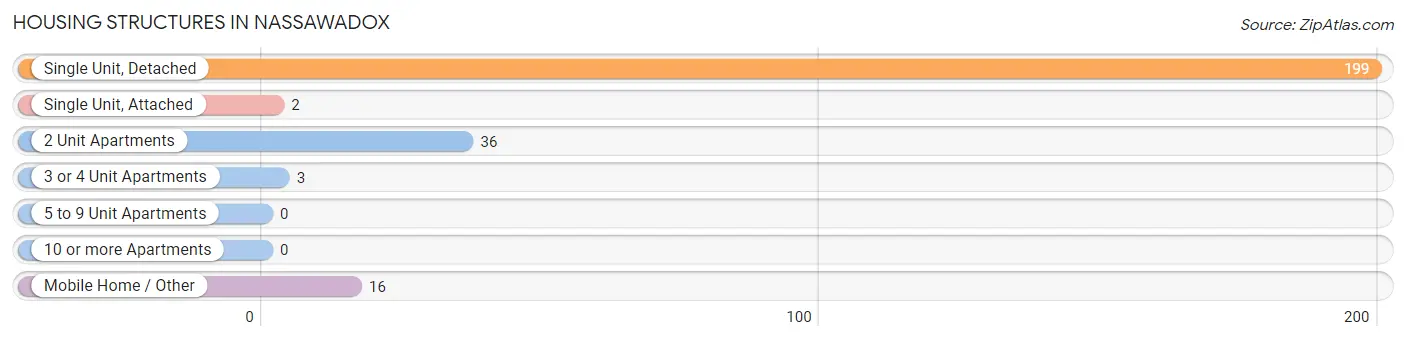
| Structure Type | # Housing Units | % Housing Units |
| Single Unit, Detached | 199 | 77.7% |
| Single Unit, Attached | 2 | 0.8% |
| 2 Unit Apartments | 36 | 14.1% |
| 3 or 4 Unit Apartments | 3 | 1.2% |
| 5 to 9 Unit Apartments | 0 | 0.0% |
| 10 or more Apartments | 0 | 0.0% |
| Mobile Home / Other | 16 | 6.2% |
| Total | 256 | 100.0% |
Housing Structures by Occupancy in Nassawadox
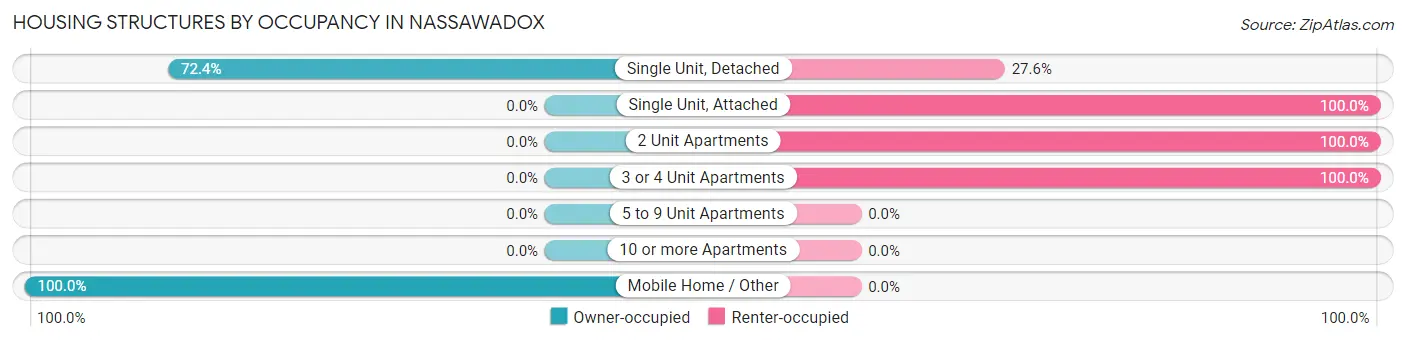
| Structure Type | Owner-occupied | Renter-occupied |
| Single Unit, Detached | 144 (72.4%) | 55 (27.6%) |
| Single Unit, Attached | 0 (0.0%) | 2 (100.0%) |
| 2 Unit Apartments | 0 (0.0%) | 36 (100.0%) |
| 3 or 4 Unit Apartments | 0 (0.0%) | 3 (100.0%) |
| 5 to 9 Unit Apartments | 0 (0.0%) | 0 (0.0%) |
| 10 or more Apartments | 0 (0.0%) | 0 (0.0%) |
| Mobile Home / Other | 16 (100.0%) | 0 (0.0%) |
| Total | 160 (62.5%) | 96 (37.5%) |
Housing Structures by Number of Rooms in Nassawadox
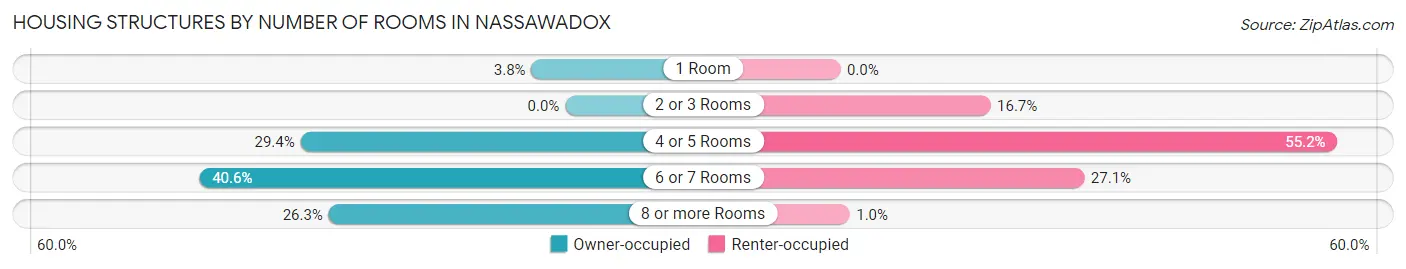
| Number of Rooms | Owner-occupied | Renter-occupied |
| 1 Room | 6 (3.7%) | 0 (0.0%) |
| 2 or 3 Rooms | 0 (0.0%) | 16 (16.7%) |
| 4 or 5 Rooms | 47 (29.4%) | 53 (55.2%) |
| 6 or 7 Rooms | 65 (40.6%) | 26 (27.1%) |
| 8 or more Rooms | 42 (26.3%) | 1 (1.0%) |
| Total | 160 (100.0%) | 96 (100.0%) |
Housing Structure by Heating Type in Nassawadox
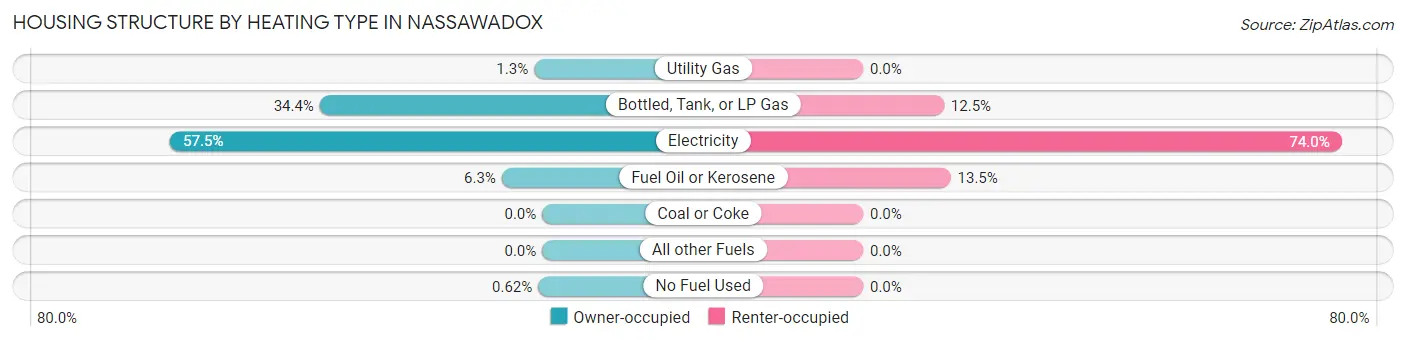
| Heating Type | Owner-occupied | Renter-occupied |
| Utility Gas | 2 (1.3%) | 0 (0.0%) |
| Bottled, Tank, or LP Gas | 55 (34.4%) | 12 (12.5%) |
| Electricity | 92 (57.5%) | 71 (74.0%) |
| Fuel Oil or Kerosene | 10 (6.2%) | 13 (13.5%) |
| Coal or Coke | 0 (0.0%) | 0 (0.0%) |
| All other Fuels | 0 (0.0%) | 0 (0.0%) |
| No Fuel Used | 1 (0.6%) | 0 (0.0%) |
| Total | 160 (100.0%) | 96 (100.0%) |
Household Vehicle Usage in Nassawadox
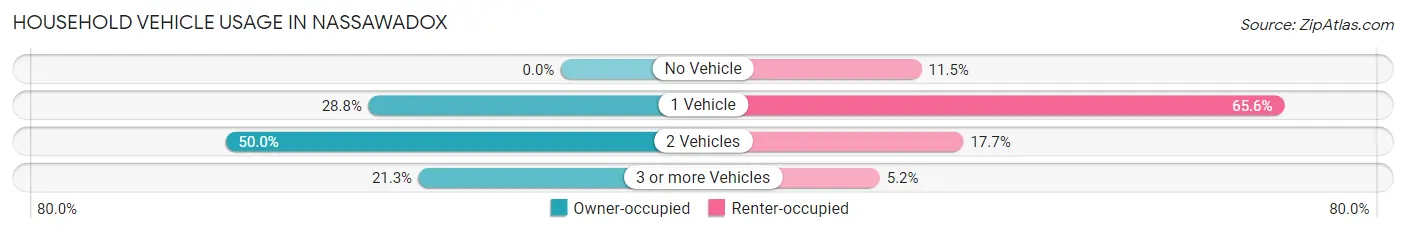
| Vehicles per Household | Owner-occupied | Renter-occupied |
| No Vehicle | 0 (0.0%) | 11 (11.5%) |
| 1 Vehicle | 46 (28.7%) | 63 (65.6%) |
| 2 Vehicles | 80 (50.0%) | 17 (17.7%) |
| 3 or more Vehicles | 34 (21.2%) | 5 (5.2%) |
| Total | 160 (100.0%) | 96 (100.0%) |
Real Estate & Mortgages in Nassawadox
Real Estate and Mortgage Overview in Nassawadox
| Characteristic | Without Mortgage | With Mortgage |
| Housing Units | 55 | 105 |
| Median Property Value | $112,500 | $155,100 |
| Median Household Income | $36,964 | $7 |
| Monthly Housing Costs | $325 | $4 |
| Real Estate Taxes | $929 | $0 |
Property Value by Mortgage Status in Nassawadox
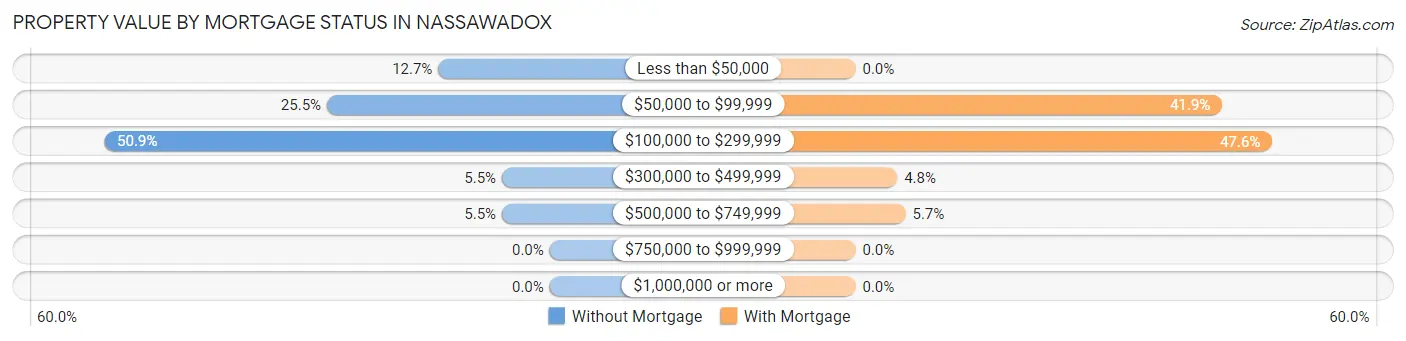
| Property Value | Without Mortgage | With Mortgage |
| Less than $50,000 | 7 (12.7%) | 0 (0.0%) |
| $50,000 to $99,999 | 14 (25.5%) | 44 (41.9%) |
| $100,000 to $299,999 | 28 (50.9%) | 50 (47.6%) |
| $300,000 to $499,999 | 3 (5.4%) | 5 (4.8%) |
| $500,000 to $749,999 | 3 (5.4%) | 6 (5.7%) |
| $750,000 to $999,999 | 0 (0.0%) | 0 (0.0%) |
| $1,000,000 or more | 0 (0.0%) | 0 (0.0%) |
| Total | 55 (100.0%) | 105 (100.0%) |
Household Income by Mortgage Status in Nassawadox
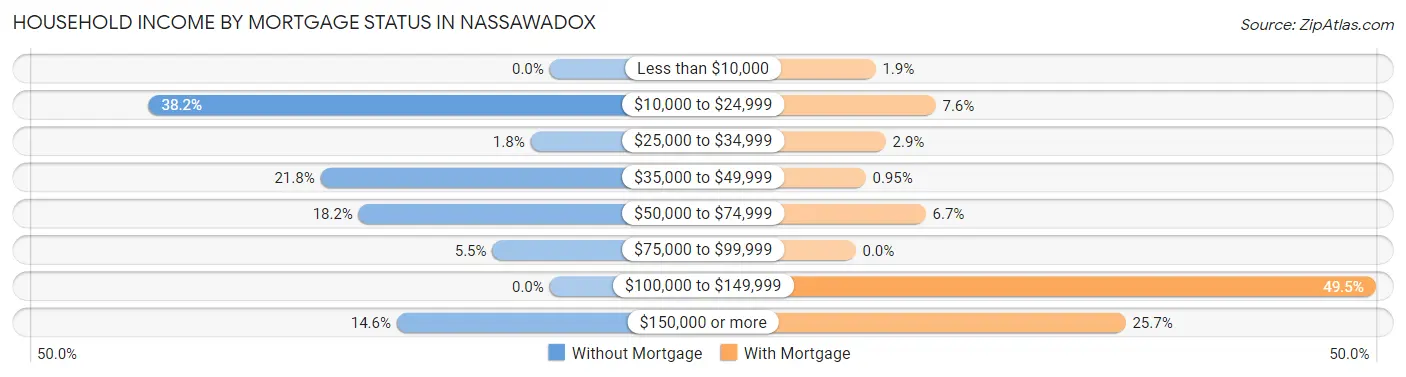
| Household Income | Without Mortgage | With Mortgage |
| Less than $10,000 | 0 (0.0%) | 2 (1.9%) |
| $10,000 to $24,999 | 21 (38.2%) | 8 (7.6%) |
| $25,000 to $34,999 | 1 (1.8%) | 3 (2.9%) |
| $35,000 to $49,999 | 12 (21.8%) | 1 (0.9%) |
| $50,000 to $74,999 | 10 (18.2%) | 7 (6.7%) |
| $75,000 to $99,999 | 3 (5.4%) | 0 (0.0%) |
| $100,000 to $149,999 | 0 (0.0%) | 52 (49.5%) |
| $150,000 or more | 8 (14.5%) | 27 (25.7%) |
| Total | 55 (100.0%) | 105 (100.0%) |
Property Value to Household Income Ratio in Nassawadox
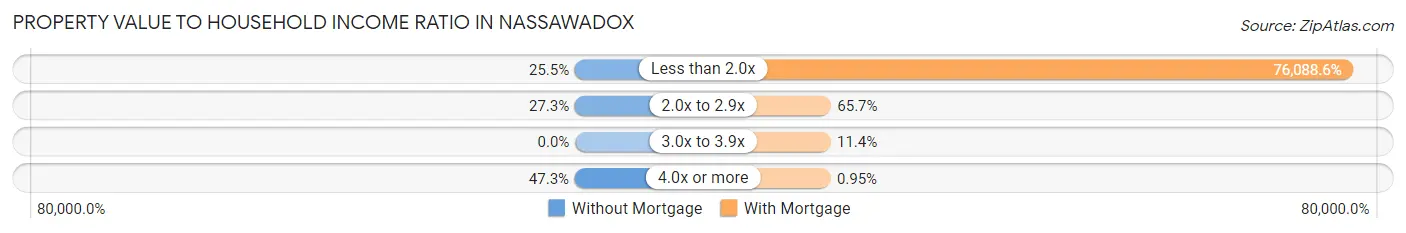
| Value-to-Income Ratio | Without Mortgage | With Mortgage |
| Less than 2.0x | 14 (25.5%) | 79,893 (76,088.6%) |
| 2.0x to 2.9x | 15 (27.3%) | 69 (65.7%) |
| 3.0x to 3.9x | 0 (0.0%) | 12 (11.4%) |
| 4.0x or more | 26 (47.3%) | 1 (0.9%) |
| Total | 55 (100.0%) | 105 (100.0%) |
Real Estate Taxes by Mortgage Status in Nassawadox
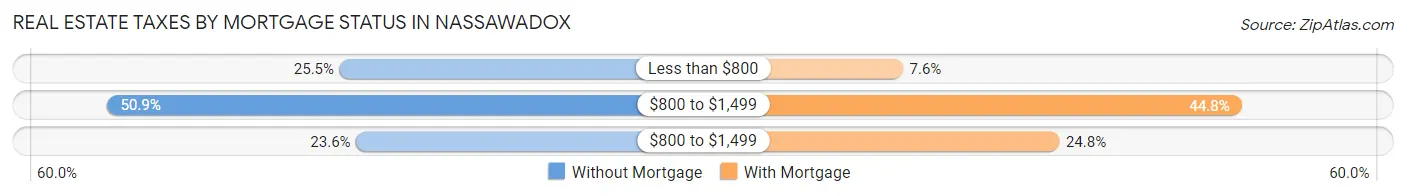
| Property Taxes | Without Mortgage | With Mortgage |
| Less than $800 | 14 (25.5%) | 8 (7.6%) |
| $800 to $1,499 | 28 (50.9%) | 47 (44.8%) |
| $800 to $1,499 | 13 (23.6%) | 26 (24.8%) |
| Total | 55 (100.0%) | 105 (100.0%) |
Health & Disability in Nassawadox
Health Insurance Coverage by Age in Nassawadox
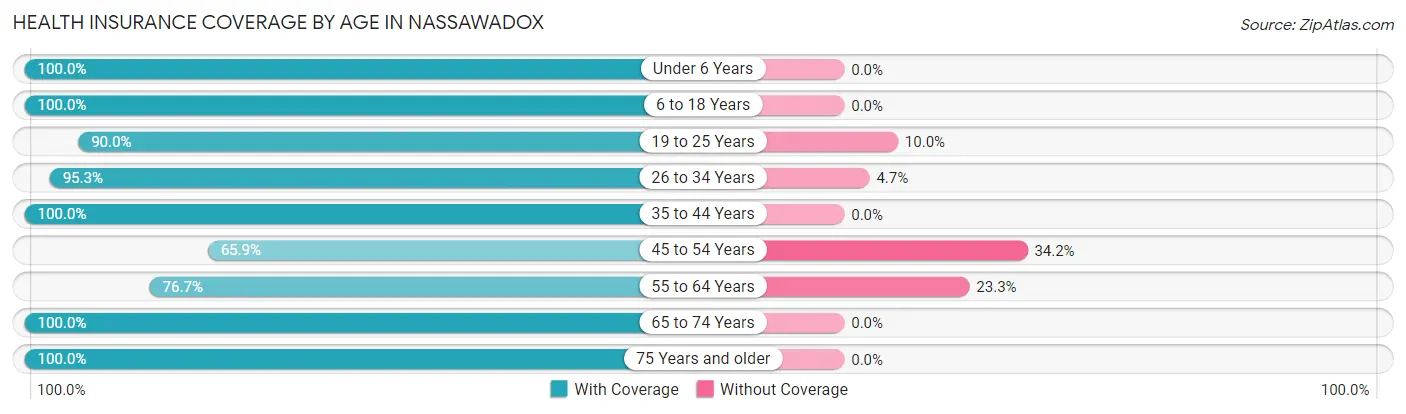
| Age Bracket | With Coverage | Without Coverage |
| Under 6 Years | 41 (100.0%) | 0 (0.0%) |
| 6 to 18 Years | 157 (100.0%) | 0 (0.0%) |
| 19 to 25 Years | 18 (90.0%) | 2 (10.0%) |
| 26 to 34 Years | 122 (95.3%) | 6 (4.7%) |
| 35 to 44 Years | 44 (100.0%) | 0 (0.0%) |
| 45 to 54 Years | 27 (65.8%) | 14 (34.2%) |
| 55 to 64 Years | 46 (76.7%) | 14 (23.3%) |
| 65 to 74 Years | 43 (100.0%) | 0 (0.0%) |
| 75 Years and older | 54 (100.0%) | 0 (0.0%) |
| Total | 552 (93.9%) | 36 (6.1%) |
Health Insurance Coverage by Citizenship Status in Nassawadox
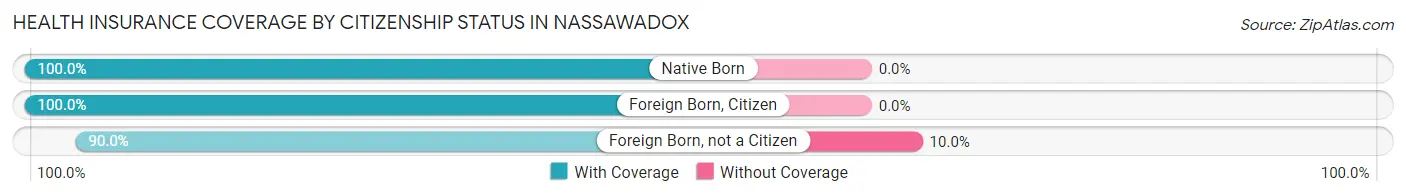
| Citizenship Status | With Coverage | Without Coverage |
| Native Born | 41 (100.0%) | 0 (0.0%) |
| Foreign Born, Citizen | 157 (100.0%) | 0 (0.0%) |
| Foreign Born, not a Citizen | 18 (90.0%) | 2 (10.0%) |
Health Insurance Coverage by Household Income in Nassawadox
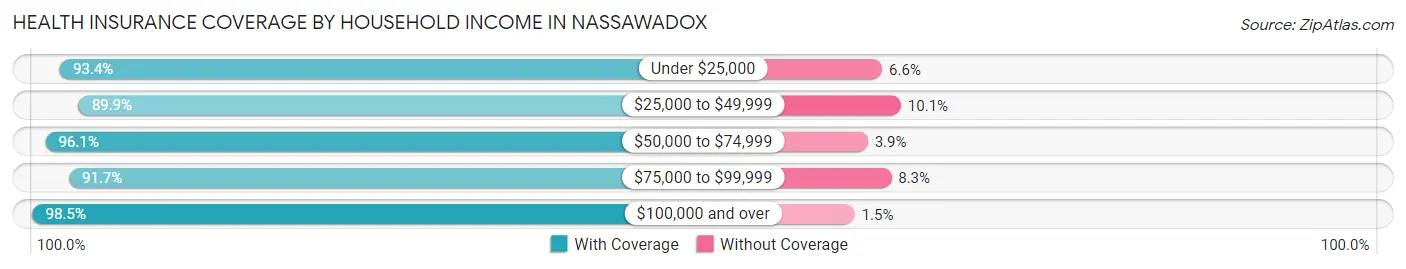
| Household Income | With Coverage | Without Coverage |
| Under $25,000 | 155 (93.4%) | 11 (6.6%) |
| $25,000 to $49,999 | 62 (89.9%) | 7 (10.1%) |
| $50,000 to $74,999 | 49 (96.1%) | 2 (3.9%) |
| $75,000 to $99,999 | 154 (91.7%) | 14 (8.3%) |
| $100,000 and over | 132 (98.5%) | 2 (1.5%) |
Public vs Private Health Insurance Coverage by Age in Nassawadox
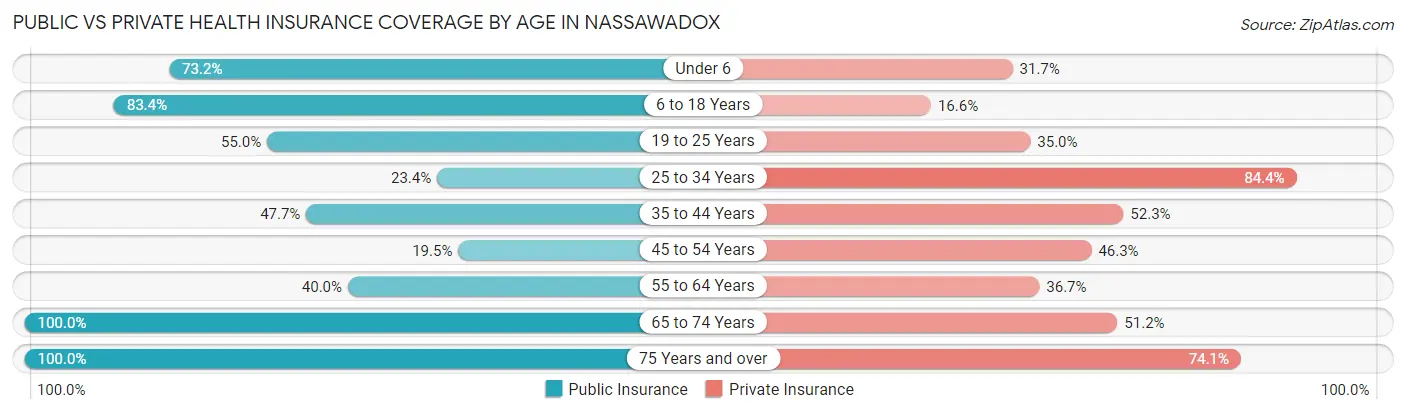
| Age Bracket | Public Insurance | Private Insurance |
| Under 6 | 30 (73.2%) | 13 (31.7%) |
| 6 to 18 Years | 131 (83.4%) | 26 (16.6%) |
| 19 to 25 Years | 11 (55.0%) | 7 (35.0%) |
| 25 to 34 Years | 30 (23.4%) | 108 (84.4%) |
| 35 to 44 Years | 21 (47.7%) | 23 (52.3%) |
| 45 to 54 Years | 8 (19.5%) | 19 (46.3%) |
| 55 to 64 Years | 24 (40.0%) | 22 (36.7%) |
| 65 to 74 Years | 43 (100.0%) | 22 (51.2%) |
| 75 Years and over | 54 (100.0%) | 40 (74.1%) |
| Total | 352 (59.9%) | 280 (47.6%) |
Disability Status by Sex by Age in Nassawadox
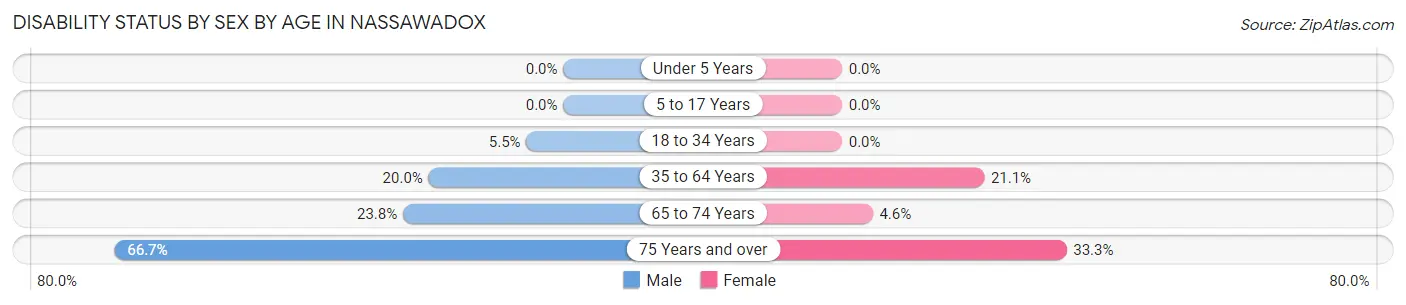
| Age Bracket | Male | Female |
| Under 5 Years | 0 (0.0%) | 0 (0.0%) |
| 5 to 17 Years | 0 (0.0%) | 0 (0.0%) |
| 18 to 34 Years | 4 (5.5%) | 0 (0.0%) |
| 35 to 64 Years | 11 (20.0%) | 19 (21.1%) |
| 65 to 74 Years | 5 (23.8%) | 1 (4.5%) |
| 75 Years and over | 14 (66.7%) | 11 (33.3%) |
Disability Class by Sex by Age in Nassawadox
Disability Class: Hearing Difficulty
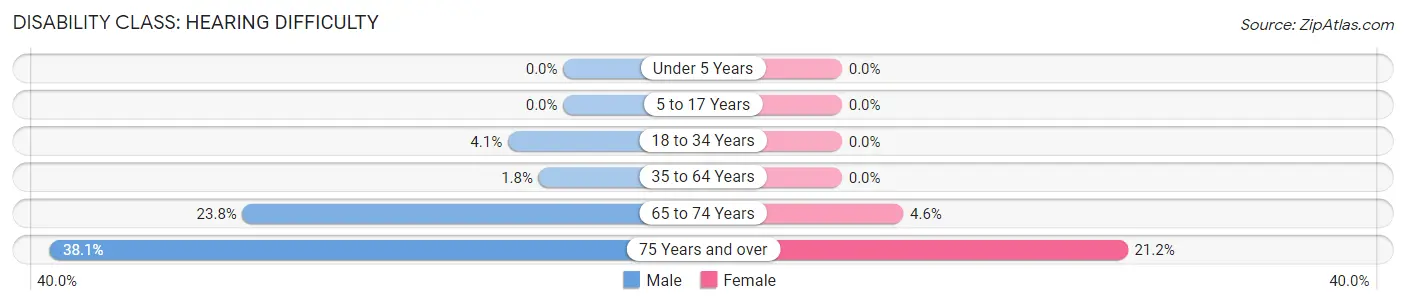
| Age Bracket | Male | Female |
| Under 5 Years | 0 (0.0%) | 0 (0.0%) |
| 5 to 17 Years | 0 (0.0%) | 0 (0.0%) |
| 18 to 34 Years | 3 (4.1%) | 0 (0.0%) |
| 35 to 64 Years | 1 (1.8%) | 0 (0.0%) |
| 65 to 74 Years | 5 (23.8%) | 1 (4.5%) |
| 75 Years and over | 8 (38.1%) | 7 (21.2%) |
Disability Class: Vision Difficulty
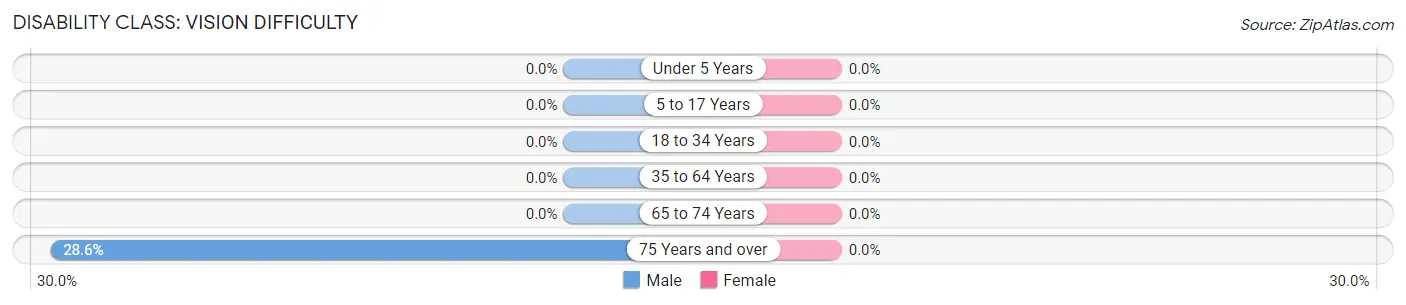
| Age Bracket | Male | Female |
| Under 5 Years | 0 (0.0%) | 0 (0.0%) |
| 5 to 17 Years | 0 (0.0%) | 0 (0.0%) |
| 18 to 34 Years | 0 (0.0%) | 0 (0.0%) |
| 35 to 64 Years | 0 (0.0%) | 0 (0.0%) |
| 65 to 74 Years | 0 (0.0%) | 0 (0.0%) |
| 75 Years and over | 6 (28.6%) | 0 (0.0%) |
Disability Class: Cognitive Difficulty
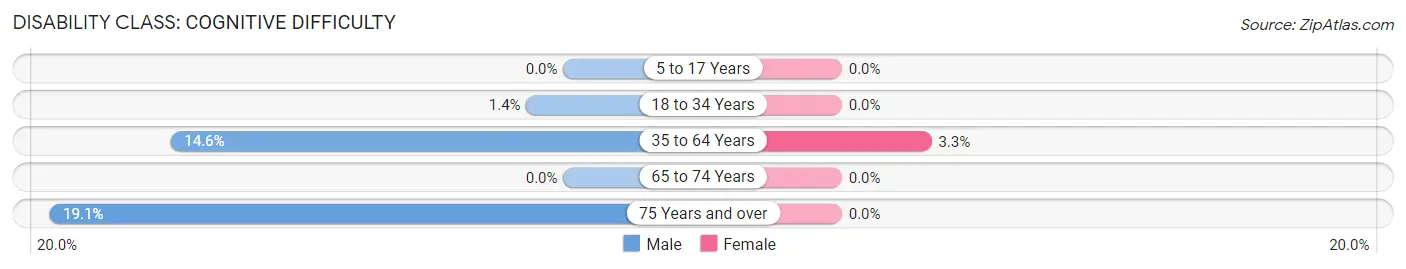
| Age Bracket | Male | Female |
| 5 to 17 Years | 0 (0.0%) | 0 (0.0%) |
| 18 to 34 Years | 1 (1.4%) | 0 (0.0%) |
| 35 to 64 Years | 8 (14.5%) | 3 (3.3%) |
| 65 to 74 Years | 0 (0.0%) | 0 (0.0%) |
| 75 Years and over | 4 (19.1%) | 0 (0.0%) |
Disability Class: Ambulatory Difficulty
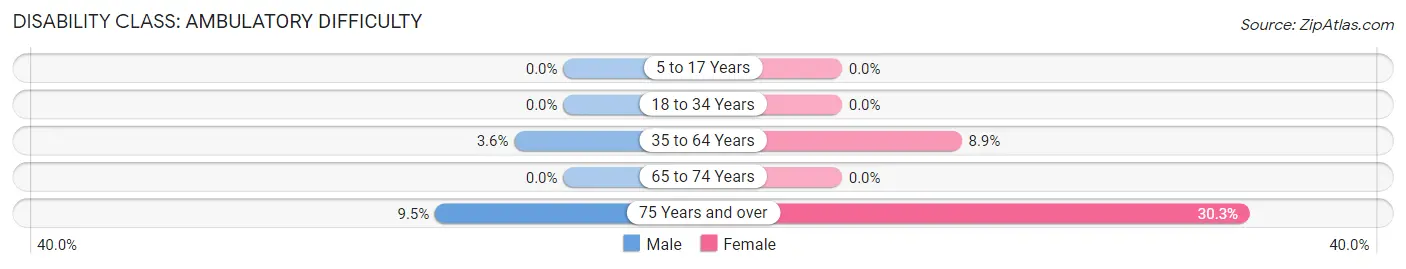
| Age Bracket | Male | Female |
| 5 to 17 Years | 0 (0.0%) | 0 (0.0%) |
| 18 to 34 Years | 0 (0.0%) | 0 (0.0%) |
| 35 to 64 Years | 2 (3.6%) | 8 (8.9%) |
| 65 to 74 Years | 0 (0.0%) | 0 (0.0%) |
| 75 Years and over | 2 (9.5%) | 10 (30.3%) |
Disability Class: Self-Care Difficulty
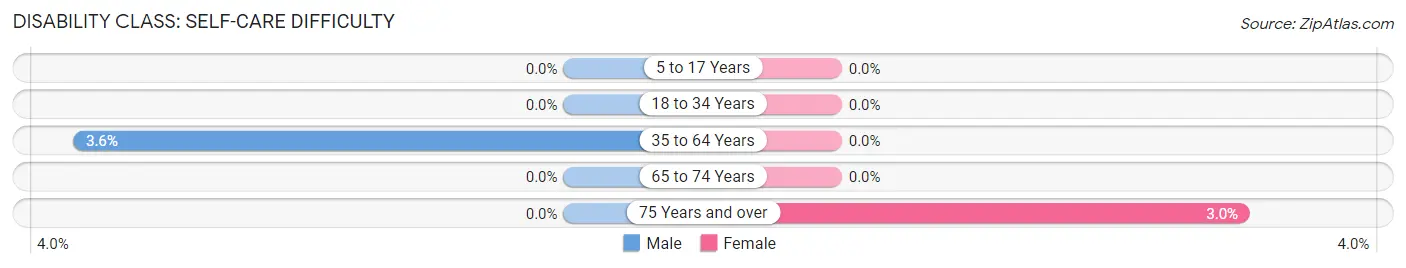
| Age Bracket | Male | Female |
| 5 to 17 Years | 0 (0.0%) | 0 (0.0%) |
| 18 to 34 Years | 0 (0.0%) | 0 (0.0%) |
| 35 to 64 Years | 2 (3.6%) | 0 (0.0%) |
| 65 to 74 Years | 0 (0.0%) | 0 (0.0%) |
| 75 Years and over | 0 (0.0%) | 1 (3.0%) |
Technology Access in Nassawadox
Computing Device Access in Nassawadox
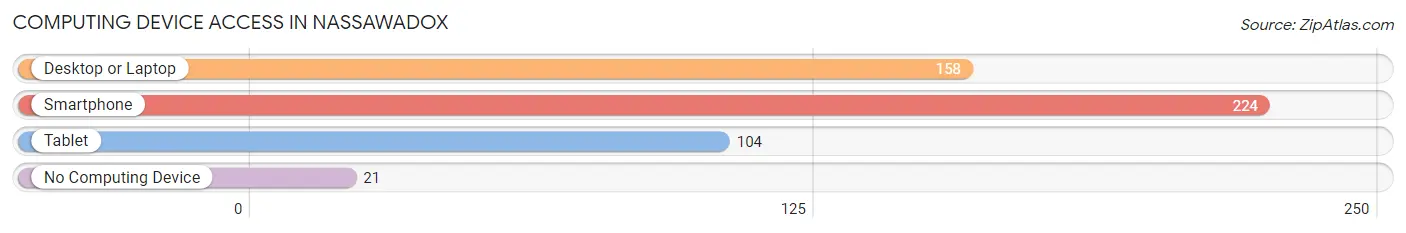
| Device Type | # Households | % Households |
| Desktop or Laptop | 158 | 61.7% |
| Smartphone | 224 | 87.5% |
| Tablet | 104 | 40.6% |
| No Computing Device | 21 | 8.2% |
| Total | 256 | 100.0% |
Internet Access in Nassawadox
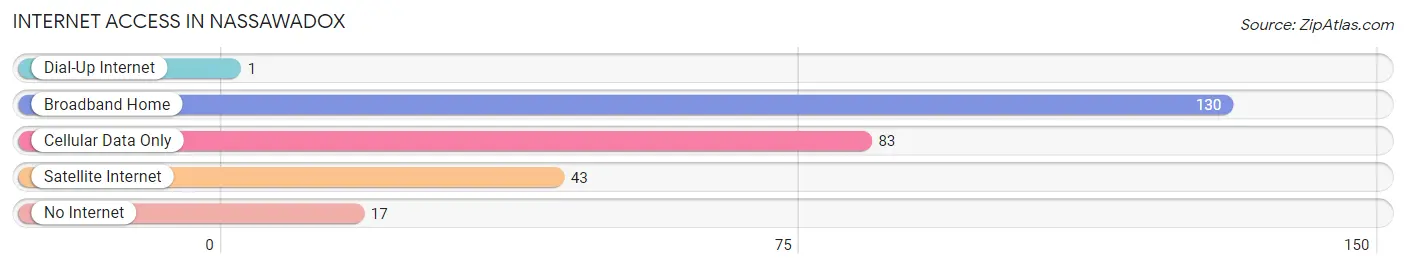
| Internet Type | # Households | % Households |
| Dial-Up Internet | 1 | 0.4% |
| Broadband Home | 130 | 50.8% |
| Cellular Data Only | 83 | 32.4% |
| Satellite Internet | 43 | 16.8% |
| No Internet | 17 | 6.6% |
| Total | 256 | 100.0% |
Nassawadox Summary
Nassawadox is a small unincorporated community located in Northampton County, Virginia. It is situated on the Eastern Shore of the Chesapeake Bay, approximately 30 miles north of the Virginia-Maryland border. The population of Nassawadox was 1,845 as of the 2000 census.
History
Nassawadox was first settled in the early 1700s by English colonists. The town was originally known as Nassawattocks, which was derived from the Native American word for “place of many creeks.” The town was officially incorporated in 1742 and was named after the local Native American tribe, the Nauset.
In the late 1700s, Nassawadox was a thriving port town. It was a major hub for the shipping of tobacco, grain, and other goods. The town was also home to several shipbuilding yards and a large fishing industry.
In the early 1800s, Nassawadox was a popular destination for wealthy planters from the mainland. The town was known for its luxurious hotels and resorts, which attracted many visitors from the mainland.
In the late 1800s, Nassawadox began to decline in popularity as a tourist destination. The town’s economy shifted to focus on agriculture and fishing.
Geography
Nassawadox is located in Northampton County, Virginia. It is situated on the Eastern Shore of the Chesapeake Bay, approximately 30 miles north of the Virginia-Maryland border. The town is bordered by the towns of Exmore, Cheriton, and Eastville.
The town is located on a peninsula, which is surrounded by the Chesapeake Bay to the east and the Atlantic Ocean to the south. The town is located at an elevation of 10 feet above sea level.
Economy
The economy of Nassawadox is largely based on agriculture and fishing. The town is home to several farms, which produce a variety of crops, including corn, soybeans, wheat, and hay. The town is also home to several seafood processing plants, which process and package a variety of seafood products, including oysters, clams, and crabs.
The town is also home to several small businesses, including restaurants, retail stores, and service providers. The town is also home to a small airport, which serves the local area.
Demographics
As of the 2000 census, the population of Nassawadox was 1,845. The racial makeup of the town was 79.3% White, 17.7% African American, 0.5% Native American, 0.3% Asian, 0.1% Pacific Islander, 0.7% from other races, and 1.4% from two or more races. Hispanic or Latino of any race were 1.7% of the population.
The median income for a household in the town was $35,938, and the median income for a family was $41,250. Males had a median income of $30,000 versus $21,250 for females. The per capita income for the town was $17,845. About 11.2% of families and 13.2% of the population were below the poverty line, including 17.2% of those under age 18 and 8.3% of those age 65 or over.
Common Questions
What is Per Capita Income in Nassawadox?
Per Capita income in Nassawadox is $23,629.
What is the Median Family Income in Nassawadox?
Median Family Income in Nassawadox is $53,357.
What is the Median Household income in Nassawadox?
Median Household Income in Nassawadox is $47,222.
What is Income or Wage Gap in Nassawadox?
Income or Wage Gap in Nassawadox is 31.4%.
Women in Nassawadox earn 68.6 cents for every dollar earned by a man.
What is Family Income Deficit in Nassawadox?
Family Income Deficit in Nassawadox is $14,780.
Families that are below poverty line in Nassawadox earn $14,780 less on average than the poverty threshold level.
What is Inequality or Gini Index in Nassawadox?
Inequality or Gini Index in Nassawadox is 0.44.
What is the Total Population of Nassawadox?
Total Population of Nassawadox is 742.
What is the Total Male Population of Nassawadox?
Total Male Population of Nassawadox is 276.
What is the Total Female Population of Nassawadox?
Total Female Population of Nassawadox is 466.
What is the Ratio of Males per 100 Females in Nassawadox?
There are 59.23 Males per 100 Females in Nassawadox.
What is the Ratio of Females per 100 Males in Nassawadox?
There are 168.84 Females per 100 Males in Nassawadox.
What is the Median Population Age in Nassawadox?
Median Population Age in Nassawadox is 38.2 Years.
What is the Average Family Size in Nassawadox
Average Family Size in Nassawadox is 2.8 People.
What is the Average Household Size in Nassawadox
Average Household Size in Nassawadox is 2.3 People.
How Large is the Labor Force in Nassawadox?
There are 231 People in the Labor Forcein in Nassawadox.
What is the Percentage of People in the Labor Force in Nassawadox?
40.6% of People are in the Labor Force in Nassawadox.
What is the Unemployment Rate in Nassawadox?
Unemployment Rate in Nassawadox is 3.9%.