Fair Lakes, VA Map & Demographics
Fair Lakes Map
Fair Lakes Overview
$60,554
PER CAPITA INCOME
$140,921
AVG FAMILY INCOME
$123,387
AVG HOUSEHOLD INCOME
28.5%
WAGE / INCOME GAP [ % ]
71.5¢/ $1
WAGE / INCOME GAP [ $ ]
0.37
INEQUALITY / GINI INDEX
8,918
TOTAL POPULATION
4,501
MALE POPULATION
4,417
FEMALE POPULATION
101.90
MALES / 100 FEMALES
98.13
FEMALES / 100 MALES
38.2
MEDIAN AGE
3.0
AVG FAMILY SIZE
2.5
AVG HOUSEHOLD SIZE
5,613
LABOR FORCE [ PEOPLE ]
74.3%
PERCENT IN LABOR FORCE
2.7%
UNEMPLOYMENT RATE
Income in Fair Lakes
Income Overview in Fair Lakes
Per Capita Income in Fair Lakes is $60,554, while median incomes of families and households are $140,921 and $123,387 respectively.
| Characteristic | Number | Measure |
| Per Capita Income | 8,918 | $60,554 |
| Median Family Income | 2,380 | $140,921 |
| Mean Family Income | 2,380 | $162,306 |
| Median Household Income | 3,621 | $123,387 |
| Mean Household Income | 3,621 | $147,326 |
| Income Deficit | 2,380 | $0 |
| Wage / Income Gap (%) | 8,918 | 28.51% |
| Wage / Income Gap ($) | 8,918 | 71.49¢ per $1 |
| Gini / Inequality Index | 8,918 | 0.37 |
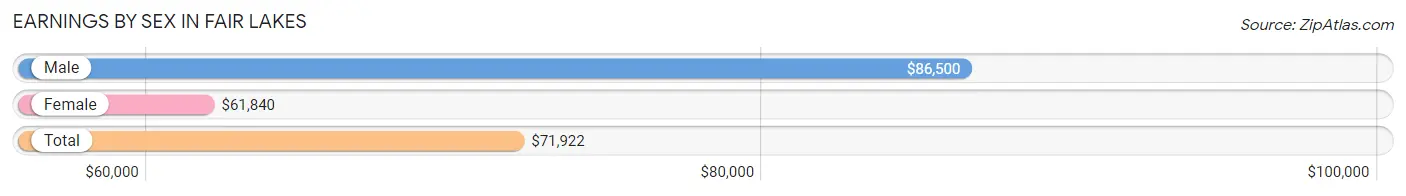
Earnings by Sex in Fair Lakes
Average Earnings in Fair Lakes are $71,922, $86,500 for men and $61,840 for women, a difference of 28.5%.
| Sex | Number | Average Earnings |
| Male | 3,040 (52.4%) | $86,500 |
| Female | 2,759 (47.6%) | $61,840 |
| Total | 5,799 (100.0%) | $71,922 |
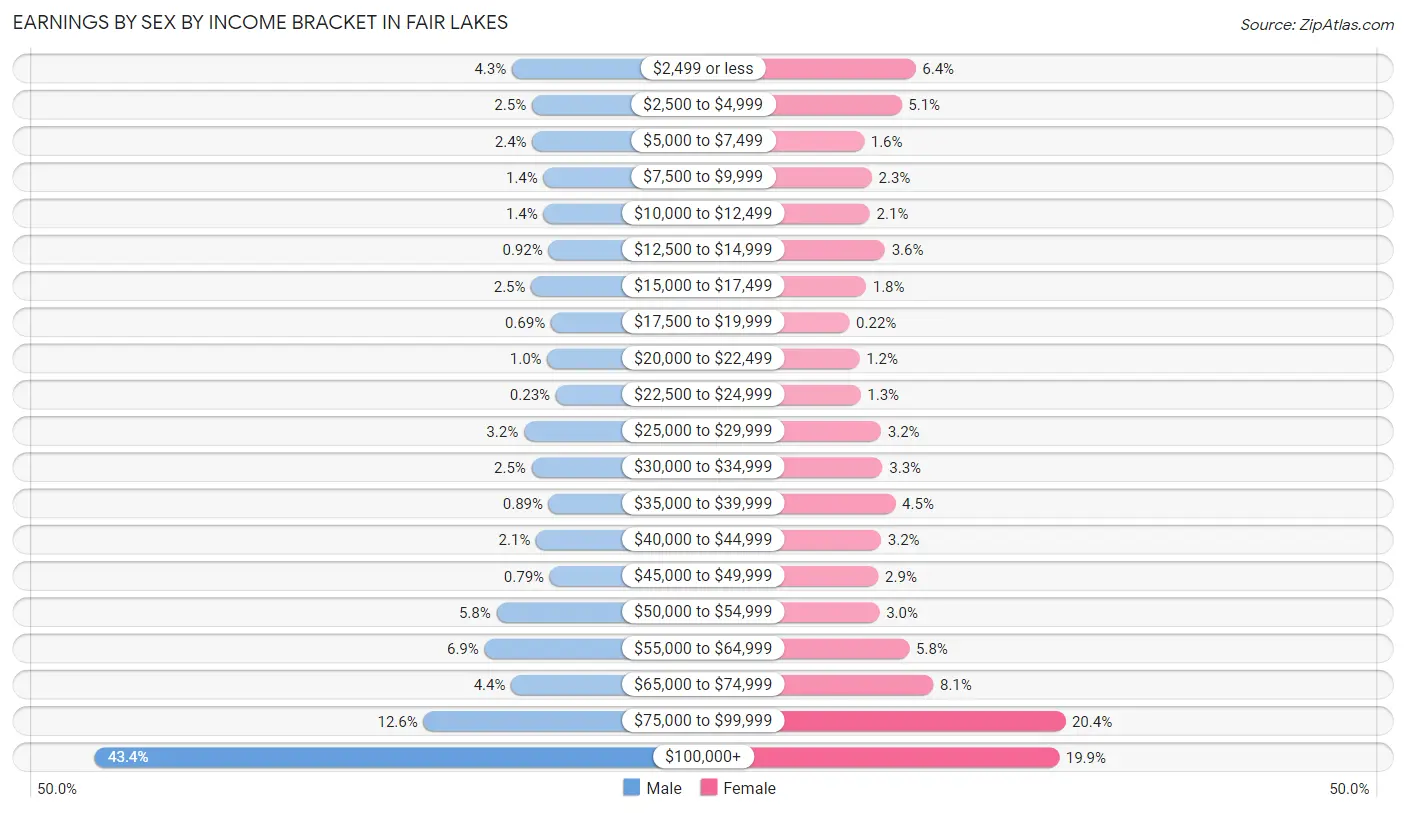
Earnings by Sex by Income Bracket in Fair Lakes
The most common earnings brackets in Fair Lakes are $100,000+ for men (1,319 | 43.4%) and $75,000 to $99,999 for women (564 | 20.4%).
| Income | Male | Female |
| $2,499 or less | 132 (4.3%) | 177 (6.4%) |
| $2,500 to $4,999 | 75 (2.5%) | 141 (5.1%) |
| $5,000 to $7,499 | 74 (2.4%) | 44 (1.6%) |
| $7,500 to $9,999 | 42 (1.4%) | 64 (2.3%) |
| $10,000 to $12,499 | 42 (1.4%) | 59 (2.1%) |
| $12,500 to $14,999 | 28 (0.9%) | 98 (3.5%) |
| $15,000 to $17,499 | 77 (2.5%) | 49 (1.8%) |
| $17,500 to $19,999 | 21 (0.7%) | 6 (0.2%) |
| $20,000 to $22,499 | 31 (1.0%) | 32 (1.2%) |
| $22,500 to $24,999 | 7 (0.2%) | 35 (1.3%) |
| $25,000 to $29,999 | 98 (3.2%) | 88 (3.2%) |
| $30,000 to $34,999 | 76 (2.5%) | 92 (3.3%) |
| $35,000 to $39,999 | 27 (0.9%) | 125 (4.5%) |
| $40,000 to $44,999 | 63 (2.1%) | 88 (3.2%) |
| $45,000 to $49,999 | 24 (0.8%) | 81 (2.9%) |
| $50,000 to $54,999 | 176 (5.8%) | 84 (3.0%) |
| $55,000 to $64,999 | 210 (6.9%) | 161 (5.8%) |
| $65,000 to $74,999 | 134 (4.4%) | 223 (8.1%) |
| $75,000 to $99,999 | 384 (12.6%) | 564 (20.4%) |
| $100,000+ | 1,319 (43.4%) | 548 (19.9%) |
| Total | 3,040 (100.0%) | 2,759 (100.0%) |
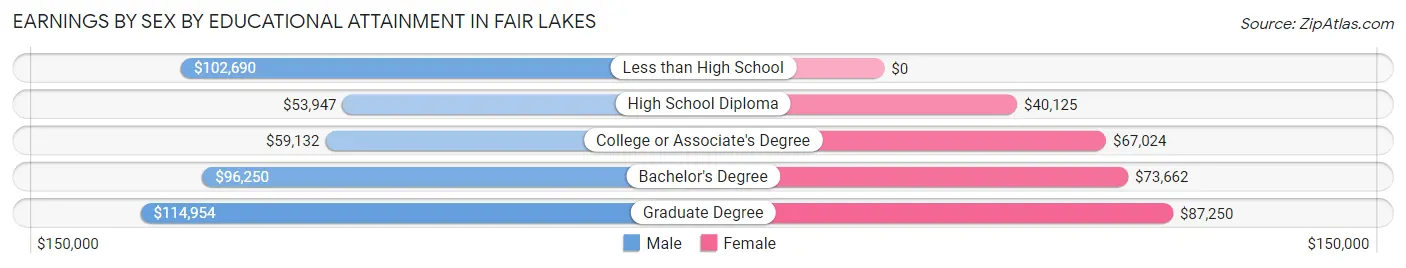
Earnings by Sex by Educational Attainment in Fair Lakes
Average earnings in Fair Lakes are $96,842 for men and $70,108 for women, a difference of 27.6%. Men with an educational attainment of graduate degree enjoy the highest average annual earnings of $114,954, while those with high school diploma education earn the least with $53,947. Women with an educational attainment of graduate degree earn the most with the average annual earnings of $87,250, while those with high school diploma education have the smallest earnings of $40,125.
| Educational Attainment | Male Income | Female Income |
| Less than High School | $102,690 | $0 |
| High School Diploma | $53,947 | $40,125 |
| College or Associate's Degree | $59,132 | $67,024 |
| Bachelor's Degree | $96,250 | $73,662 |
| Graduate Degree | $114,954 | $87,250 |
| Total | $96,842 | $70,108 |
Family Income in Fair Lakes
Family Income Brackets in Fair Lakes
According to the Fair Lakes family income data, there are 638 families falling into the $200,000+ income range, which is the most common income bracket and makes up 26.8% of all families. Conversely, the $25,000 to $34,999 income bracket is the least frequent group with only 10 families (0.4%) belonging to this category.
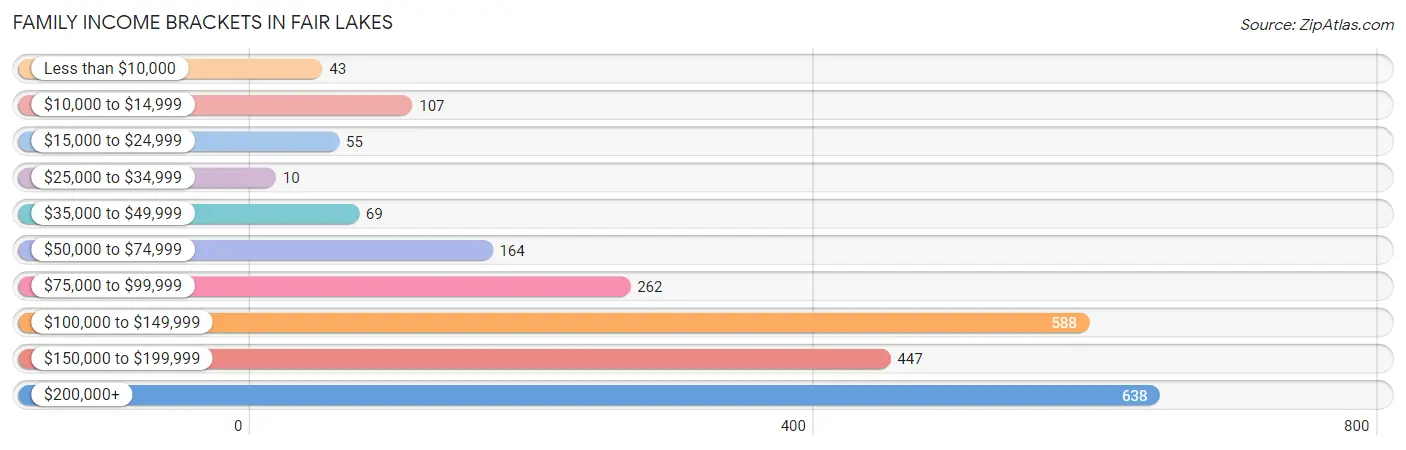
| Income Bracket | # Families | % Families |
| Less than $10,000 | 43 | 1.8% |
| $10,000 to $14,999 | 107 | 4.5% |
| $15,000 to $24,999 | 55 | 2.3% |
| $25,000 to $34,999 | 10 | 0.4% |
| $35,000 to $49,999 | 69 | 2.9% |
| $50,000 to $74,999 | 164 | 6.9% |
| $75,000 to $99,999 | 262 | 11.0% |
| $100,000 to $149,999 | 588 | 24.7% |
| $150,000 to $199,999 | 447 | 18.8% |
| $200,000+ | 638 | 26.8% |
Family Income by Famaliy Size in Fair Lakes
4-person families (507 | 21.3%) account for the highest median family income in Fair Lakes with $174,417 per family, while 2-person families (1,166 | 49.0%) have the highest median income of $54,546 per family member.
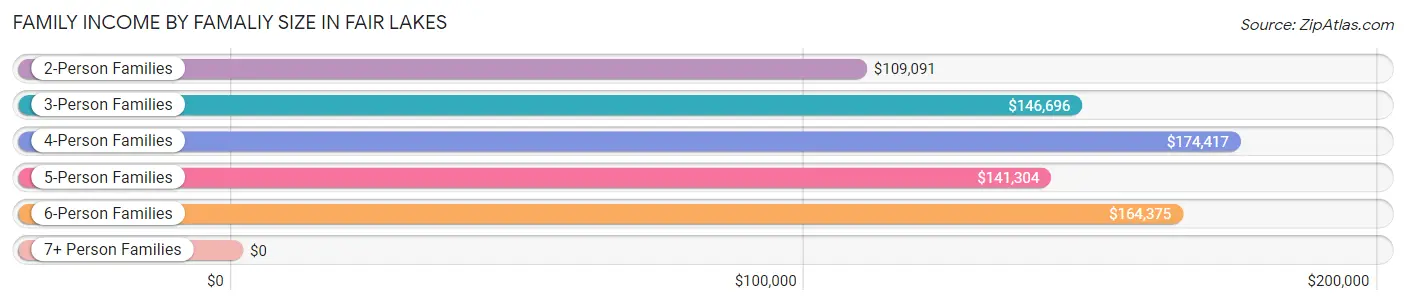
| Income Bracket | # Families | Median Income |
| 2-Person Families | 1,166 (49.0%) | $109,091 |
| 3-Person Families | 482 (20.3%) | $146,696 |
| 4-Person Families | 507 (21.3%) | $174,417 |
| 5-Person Families | 168 (7.1%) | $141,304 |
| 6-Person Families | 44 (1.8%) | $164,375 |
| 7+ Person Families | 13 (0.5%) | $0 |
| Total | 2,380 (100.0%) | $140,921 |
Family Income by Number of Earners in Fair Lakes
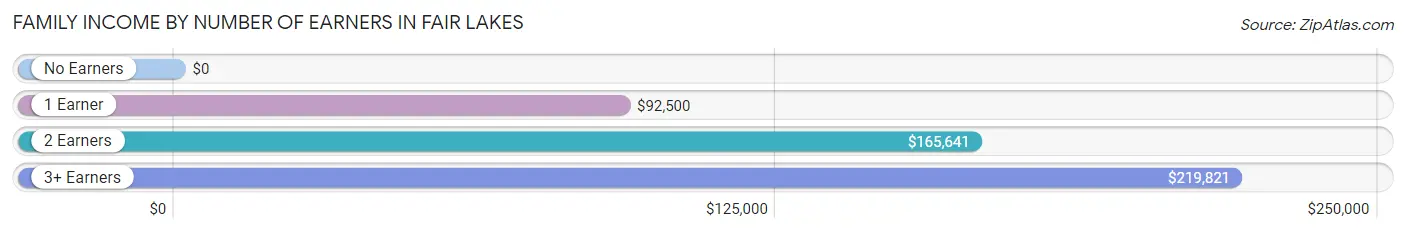
| Number of Earners | # Families | Median Income |
| No Earners | 207 (8.7%) | $0 |
| 1 Earner | 718 (30.2%) | $92,500 |
| 2 Earners | 1,094 (46.0%) | $165,641 |
| 3+ Earners | 361 (15.2%) | $219,821 |
| Total | 2,380 (100.0%) | $140,921 |
Household Income in Fair Lakes
Household Income Brackets in Fair Lakes
With 847 households falling in the category, the $100,000 to $149,999 income range is the most frequent in Fair Lakes, accounting for 23.4% of all households. In contrast, only 33 households (0.9%) fall into the $25,000 to $34,999 income bracket, making it the least populous group.
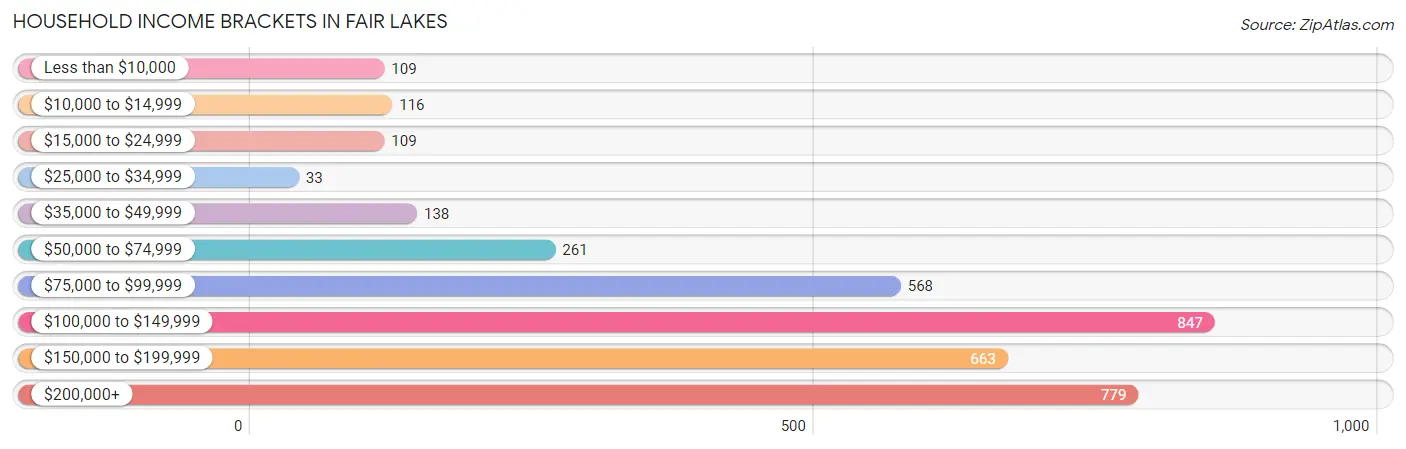
| Income Bracket | # Households | % Households |
| Less than $10,000 | 109 | 3.0% |
| $10,000 to $14,999 | 116 | 3.2% |
| $15,000 to $24,999 | 109 | 3.0% |
| $25,000 to $34,999 | 33 | 0.9% |
| $35,000 to $49,999 | 138 | 3.8% |
| $50,000 to $74,999 | 261 | 7.2% |
| $75,000 to $99,999 | 568 | 15.7% |
| $100,000 to $149,999 | 847 | 23.4% |
| $150,000 to $199,999 | 663 | 18.3% |
| $200,000+ | 779 | 21.5% |
Household Income by Householder Age in Fair Lakes
The median household income in Fair Lakes is $123,387, with the highest median household income of $160,739 found in the 45 to 64 years age bracket for the primary householder. A total of 1,517 households (41.9%) fall into this category. Meanwhile, the 65+ years age bracket for the primary householder has the lowest median household income of $53,355, with 501 households (13.8%) in this group.
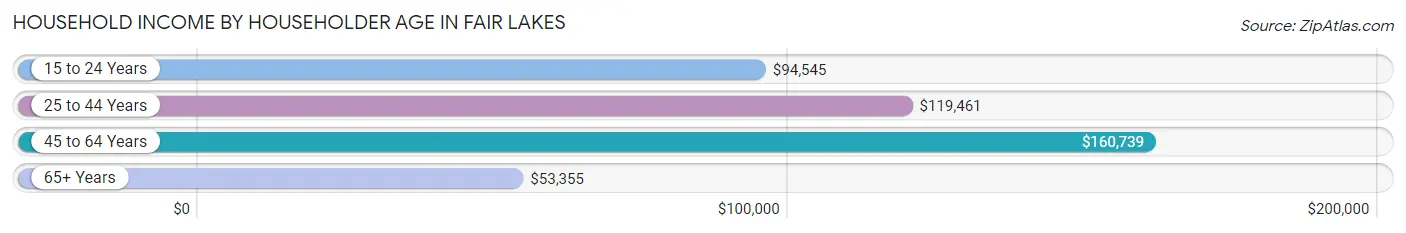
| Income Bracket | # Households | Median Income |
| 15 to 24 Years | 76 (2.1%) | $94,545 |
| 25 to 44 Years | 1,527 (42.2%) | $119,461 |
| 45 to 64 Years | 1,517 (41.9%) | $160,739 |
| 65+ Years | 501 (13.8%) | $53,355 |
| Total | 3,621 (100.0%) | $123,387 |
Poverty in Fair Lakes
Income Below Poverty by Sex and Age in Fair Lakes
With 8.5% poverty level for males and 6.1% for females among the residents of Fair Lakes, 75 year old and over males and 65 to 74 year old females are the most vulnerable to poverty, with 112 males (47.5%) and 80 females (24.9%) in their respective age groups living below the poverty level.
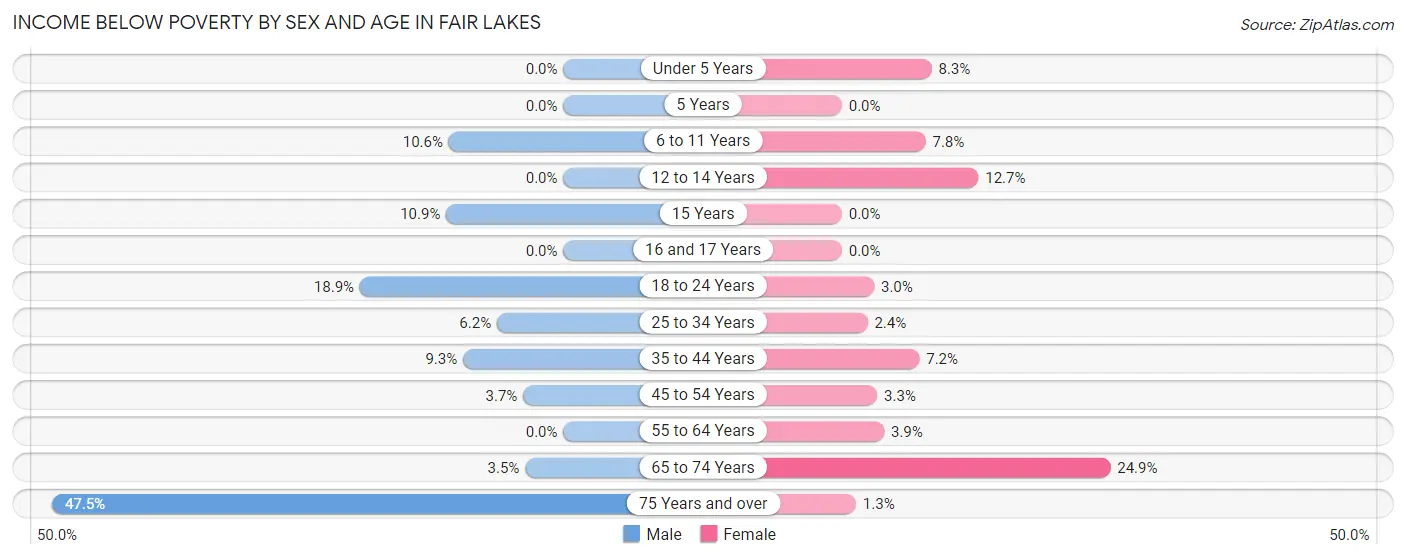
| Age Bracket | Male | Female |
| Under 5 Years | 0 (0.0%) | 14 (8.3%) |
| 5 Years | 0 (0.0%) | 0 (0.0%) |
| 6 to 11 Years | 37 (10.6%) | 16 (7.8%) |
| 12 to 14 Years | 0 (0.0%) | 28 (12.7%) |
| 15 Years | 5 (10.9%) | 0 (0.0%) |
| 16 and 17 Years | 0 (0.0%) | 0 (0.0%) |
| 18 to 24 Years | 81 (18.9%) | 11 (3.0%) |
| 25 to 34 Years | 51 (6.2%) | 19 (2.4%) |
| 35 to 44 Years | 55 (9.3%) | 53 (7.2%) |
| 45 to 54 Years | 29 (3.7%) | 20 (3.3%) |
| 55 to 64 Years | 0 (0.0%) | 24 (3.9%) |
| 65 to 74 Years | 11 (3.5%) | 80 (24.9%) |
| 75 Years and over | 112 (47.5%) | 2 (1.3%) |
| Total | 381 (8.5%) | 267 (6.1%) |
Income Above Poverty by Sex and Age in Fair Lakes
According to the poverty statistics in Fair Lakes, males aged under 5 years and females aged 5 years are the age groups that are most secure financially, with 100.0% of males and 100.0% of females in these age groups living above the poverty line.
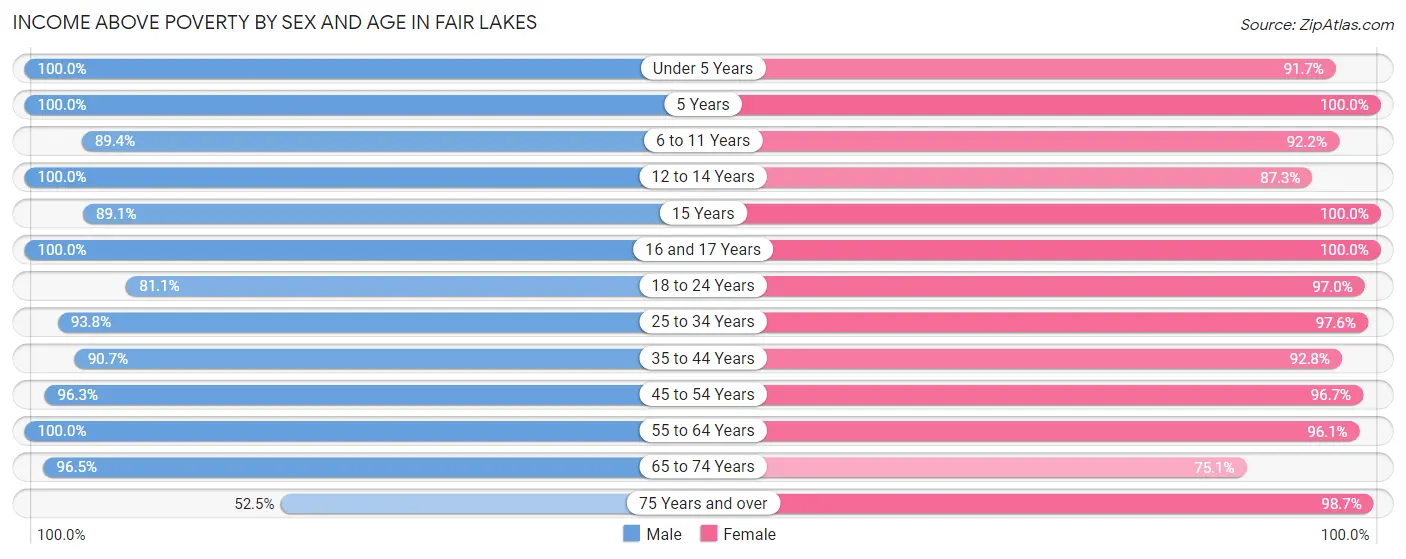
| Age Bracket | Male | Female |
| Under 5 Years | 113 (100.0%) | 154 (91.7%) |
| 5 Years | 25 (100.0%) | 98 (100.0%) |
| 6 to 11 Years | 311 (89.4%) | 190 (92.2%) |
| 12 to 14 Years | 119 (100.0%) | 193 (87.3%) |
| 15 Years | 41 (89.1%) | 19 (100.0%) |
| 16 and 17 Years | 152 (100.0%) | 100 (100.0%) |
| 18 to 24 Years | 348 (81.1%) | 357 (97.0%) |
| 25 to 34 Years | 777 (93.8%) | 778 (97.6%) |
| 35 to 44 Years | 536 (90.7%) | 684 (92.8%) |
| 45 to 54 Years | 749 (96.3%) | 589 (96.7%) |
| 55 to 64 Years | 525 (100.0%) | 588 (96.1%) |
| 65 to 74 Years | 300 (96.5%) | 241 (75.1%) |
| 75 Years and over | 124 (52.5%) | 151 (98.7%) |
| Total | 4,120 (91.5%) | 4,142 (93.9%) |
Income Below Poverty Among Married-Couple Families in Fair Lakes
The poverty statistics for married-couple families in Fair Lakes show that 7.1% or 148 of the total 2,091 families live below the poverty line. Families with no children have the highest poverty rate of 8.2%, comprising of 103 families. On the other hand, families with 3 or 4 children have the lowest poverty rate of 0.0%, which includes 0 families.
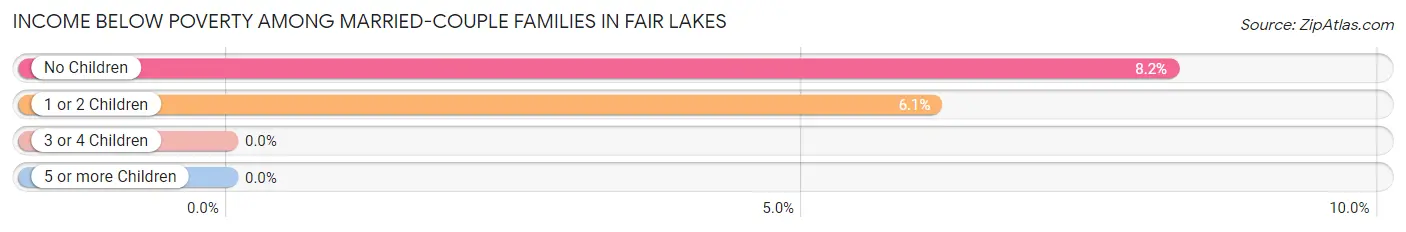
| Children | Above Poverty | Below Poverty |
| No Children | 1,154 (91.8%) | 103 (8.2%) |
| 1 or 2 Children | 689 (93.9%) | 45 (6.1%) |
| 3 or 4 Children | 100 (100.0%) | 0 (0.0%) |
| 5 or more Children | 0 (0.0%) | 0 (0.0%) |
| Total | 1,943 (92.9%) | 148 (7.1%) |
Income Below Poverty Among Single-Parent Households in Fair Lakes
According to the poverty data in Fair Lakes, 55.8% or 29 single-father households and 9.3% or 22 single-mother households are living below the poverty line. Among single-father households, those with 1 or 2 children have the highest poverty rate, with 29 households (74.4%) experiencing poverty. Likewise, among single-mother households, those with no children have the highest poverty rate, with 14 households (18.9%) falling below the poverty line.
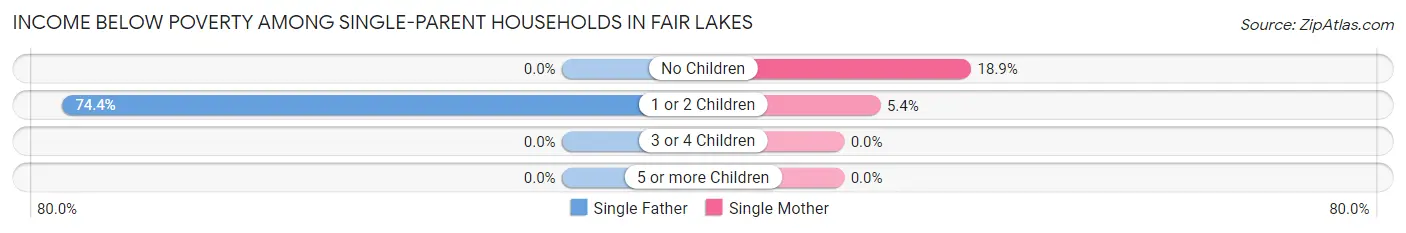
| Children | Single Father | Single Mother |
| No Children | 0 (0.0%) | 14 (18.9%) |
| 1 or 2 Children | 29 (74.4%) | 8 (5.4%) |
| 3 or 4 Children | 0 (0.0%) | 0 (0.0%) |
| 5 or more Children | 0 (0.0%) | 0 (0.0%) |
| Total | 29 (55.8%) | 22 (9.3%) |
Income Below Poverty Among Married-Couple vs Single-Parent Households in Fair Lakes
The poverty data for Fair Lakes shows that 148 of the married-couple family households (7.1%) and 51 of the single-parent households (17.6%) are living below the poverty level. Within the married-couple family households, those with no children have the highest poverty rate, with 103 households (8.2%) falling below the poverty line. Among the single-parent households, those with 1 or 2 children have the highest poverty rate, with 37 household (19.8%) living below poverty.
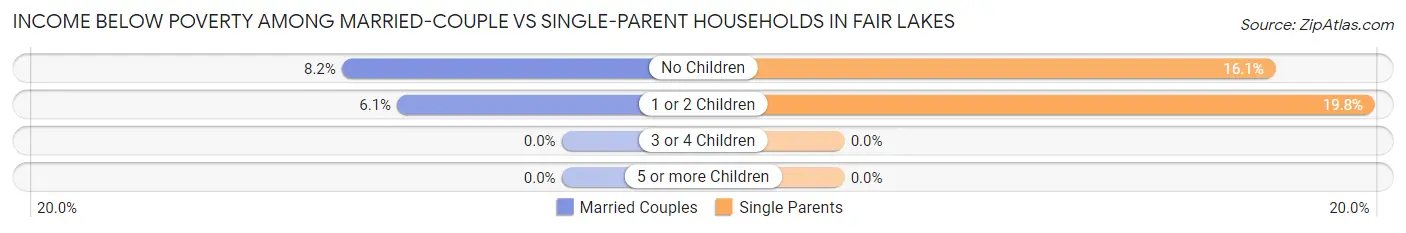
| Children | Married-Couple Families | Single-Parent Households |
| No Children | 103 (8.2%) | 14 (16.1%) |
| 1 or 2 Children | 45 (6.1%) | 37 (19.8%) |
| 3 or 4 Children | 0 (0.0%) | 0 (0.0%) |
| 5 or more Children | 0 (0.0%) | 0 (0.0%) |
| Total | 148 (7.1%) | 51 (17.6%) |
Race in Fair Lakes
The most populous races in Fair Lakes are White / Caucasian (3,854 | 43.2%), Asian (3,469 | 38.9%), and Black / African American (741 | 8.3%).
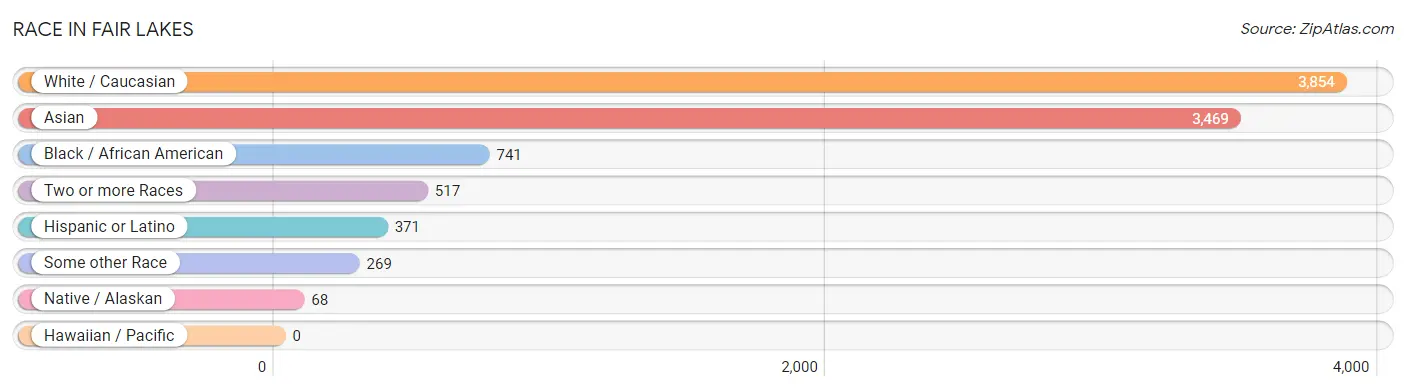
| Race | # Population | % Population |
| Asian | 3,469 | 38.9% |
| Black / African American | 741 | 8.3% |
| Hawaiian / Pacific | 0 | 0.0% |
| Hispanic or Latino | 371 | 4.2% |
| Native / Alaskan | 68 | 0.8% |
| White / Caucasian | 3,854 | 43.2% |
| Two or more Races | 517 | 5.8% |
| Some other Race | 269 | 3.0% |
| Total | 8,918 | 100.0% |
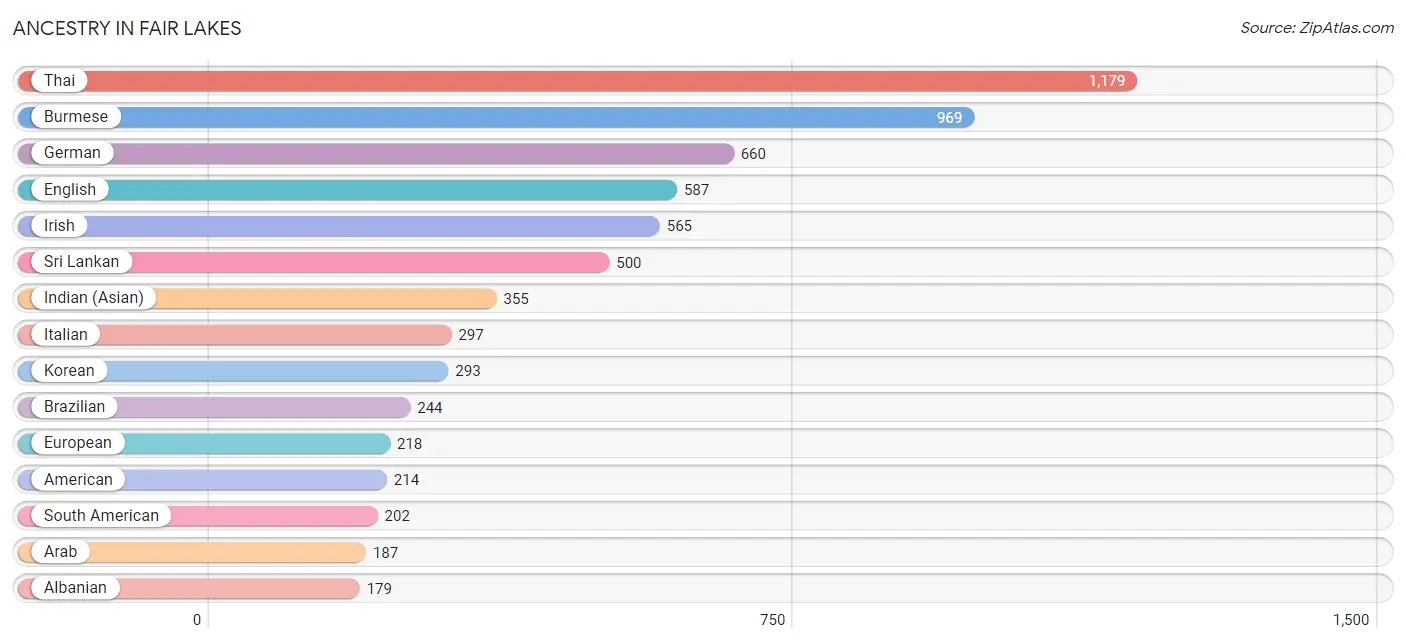
Ancestry in Fair Lakes
The most populous ancestries reported in Fair Lakes are Thai (1,179 | 13.2%), Burmese (969 | 10.9%), German (660 | 7.4%), English (587 | 6.6%), and Irish (565 | 6.3%), together accounting for 44.4% of all Fair Lakes residents.
| Ancestry | # Population | % Population |
| Afghan | 53 | 0.6% |
| African | 34 | 0.4% |
| Albanian | 179 | 2.0% |
| American | 214 | 2.4% |
| Arab | 187 | 2.1% |
| Argentinean | 25 | 0.3% |
| Armenian | 89 | 1.0% |
| Austrian | 12 | 0.1% |
| Bangladeshi | 34 | 0.4% |
| Bhutanese | 84 | 0.9% |
| Blackfeet | 11 | 0.1% |
| Bolivian | 73 | 0.8% |
| Brazilian | 244 | 2.7% |
| British | 45 | 0.5% |
| Burmese | 969 | 10.9% |
| Canadian | 6 | 0.1% |
| Central American | 29 | 0.3% |
| Central American Indian | 11 | 0.1% |
| Cherokee | 11 | 0.1% |
| Chilean | 13 | 0.2% |
| Colombian | 77 | 0.9% |
| Croatian | 5 | 0.1% |
| Cuban | 34 | 0.4% |
| Czech | 33 | 0.4% |
| Danish | 11 | 0.1% |
| Dutch | 33 | 0.4% |
| Eastern European | 10 | 0.1% |
| Egyptian | 59 | 0.7% |
| English | 587 | 6.6% |
| Ethiopian | 27 | 0.3% |
| European | 218 | 2.4% |
| Filipino | 141 | 1.6% |
| Finnish | 21 | 0.2% |
| French | 92 | 1.0% |
| French Canadian | 8 | 0.1% |
| German | 660 | 7.4% |
| Greek | 57 | 0.6% |
| Guyanese | 5 | 0.1% |
| Honduran | 7 | 0.1% |
| Indian (Asian) | 355 | 4.0% |
| Iranian | 134 | 1.5% |
| Irish | 565 | 6.3% |
| Italian | 297 | 3.3% |
| Jamaican | 11 | 0.1% |
| Korean | 293 | 3.3% |
| Laotian | 19 | 0.2% |
| Lebanese | 57 | 0.6% |
| Lithuanian | 20 | 0.2% |
| Malaysian | 6 | 0.1% |
| Mexican | 41 | 0.5% |
| Mexican American Indian | 16 | 0.2% |
| Navajo | 11 | 0.1% |
| Nicaraguan | 5 | 0.1% |
| Northern European | 62 | 0.7% |
| Norwegian | 36 | 0.4% |
| Pakistani | 134 | 1.5% |
| Palestinian | 17 | 0.2% |
| Panamanian | 4 | 0.0% |
| Pennsylvania German | 14 | 0.2% |
| Polish | 161 | 1.8% |
| Portuguese | 36 | 0.4% |
| Puerto Rican | 24 | 0.3% |
| Romanian | 18 | 0.2% |
| Russian | 103 | 1.1% |
| Salvadoran | 13 | 0.2% |
| Scotch-Irish | 92 | 1.0% |
| Scottish | 80 | 0.9% |
| Slavic | 6 | 0.1% |
| Slovene | 13 | 0.2% |
| Somali | 21 | 0.2% |
| South American | 202 | 2.3% |
| South American Indian | 32 | 0.4% |
| Spaniard | 29 | 0.3% |
| Sri Lankan | 500 | 5.6% |
| Subsaharan African | 82 | 0.9% |
| Swedish | 97 | 1.1% |
| Swiss | 35 | 0.4% |
| Syrian | 47 | 0.5% |
| Thai | 1,179 | 13.2% |
| Tongan | 11 | 0.1% |
| Turkish | 86 | 1.0% |
| Ukrainian | 54 | 0.6% |
| Venezuelan | 14 | 0.2% |
| Vietnamese | 79 | 0.9% |
| Welsh | 19 | 0.2% | View All 85 Rows |
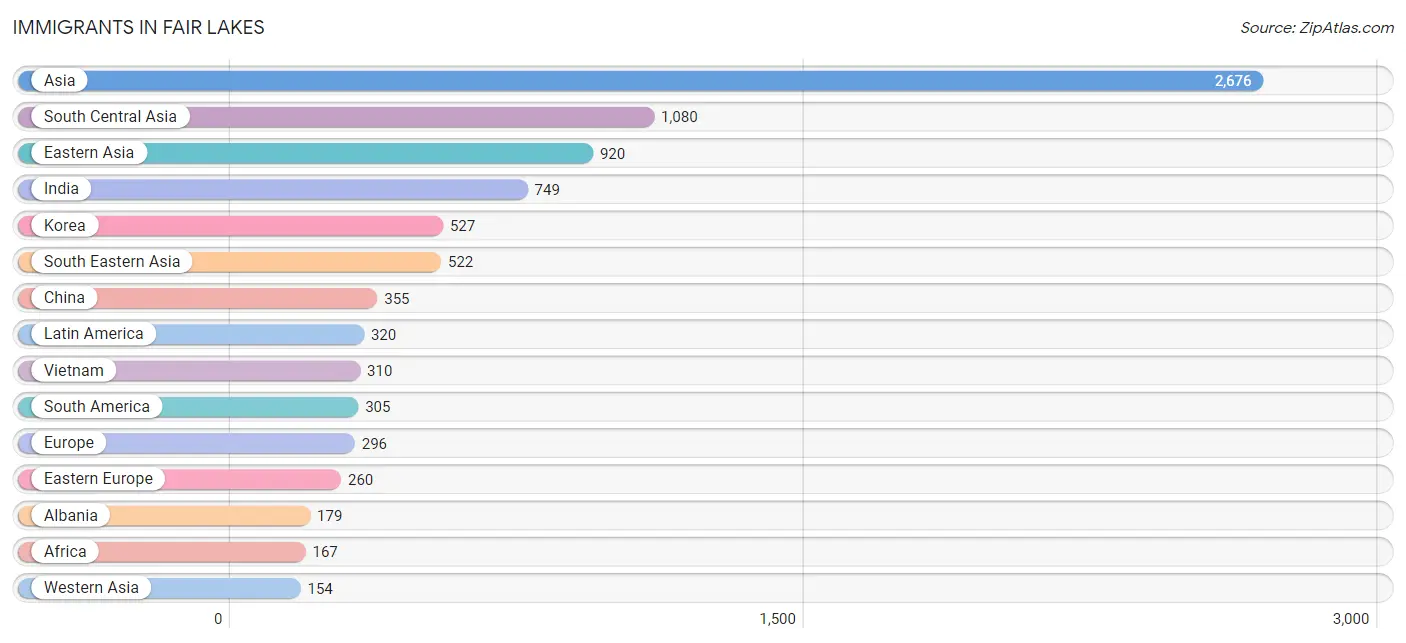
Immigrants in Fair Lakes
The most numerous immigrant groups reported in Fair Lakes came from Asia (2,676 | 30.0%), South Central Asia (1,080 | 12.1%), Eastern Asia (920 | 10.3%), India (749 | 8.4%), and Korea (527 | 5.9%), together accounting for 66.7% of all Fair Lakes residents.
| Immigration Origin | # Population | % Population |
| Afghanistan | 5 | 0.1% |
| Africa | 167 | 1.9% |
| Albania | 179 | 2.0% |
| Argentina | 25 | 0.3% |
| Asia | 2,676 | 30.0% |
| Bangladesh | 79 | 0.9% |
| Bolivia | 57 | 0.6% |
| Brazil | 120 | 1.3% |
| Central America | 15 | 0.2% |
| Chile | 13 | 0.2% |
| China | 355 | 4.0% |
| Colombia | 60 | 0.7% |
| Eastern Africa | 132 | 1.5% |
| Eastern Asia | 920 | 10.3% |
| Eastern Europe | 260 | 2.9% |
| Egypt | 35 | 0.4% |
| Eritrea | 17 | 0.2% |
| Ethiopia | 75 | 0.8% |
| Europe | 296 | 3.3% |
| Germany | 18 | 0.2% |
| Greece | 11 | 0.1% |
| Guyana | 5 | 0.1% |
| Honduras | 2 | 0.0% |
| India | 749 | 8.4% |
| Iran | 145 | 1.6% |
| Japan | 38 | 0.4% |
| Kazakhstan | 19 | 0.2% |
| Kenya | 19 | 0.2% |
| Korea | 527 | 5.9% |
| Laos | 2 | 0.0% |
| Latin America | 320 | 3.6% |
| Lebanon | 16 | 0.2% |
| Mexico | 9 | 0.1% |
| Moldova | 9 | 0.1% |
| Nepal | 23 | 0.3% |
| Northern Africa | 35 | 0.4% |
| Northern Europe | 7 | 0.1% |
| Oceania | 9 | 0.1% |
| Pakistan | 60 | 0.7% |
| Panama | 4 | 0.0% |
| Philippines | 100 | 1.1% |
| Poland | 4 | 0.0% |
| Romania | 9 | 0.1% |
| Russia | 27 | 0.3% |
| Saudi Arabia | 43 | 0.5% |
| Scotland | 7 | 0.1% |
| Somalia | 21 | 0.2% |
| South America | 305 | 3.4% |
| South Central Asia | 1,080 | 12.1% |
| South Eastern Asia | 522 | 5.9% |
| Southern Europe | 11 | 0.1% |
| Syria | 22 | 0.3% |
| Taiwan | 76 | 0.9% |
| Thailand | 110 | 1.2% |
| Turkey | 56 | 0.6% |
| Ukraine | 32 | 0.4% |
| Venezuela | 25 | 0.3% |
| Vietnam | 310 | 3.5% |
| Western Asia | 154 | 1.7% |
| Western Europe | 18 | 0.2% | View All 60 Rows |
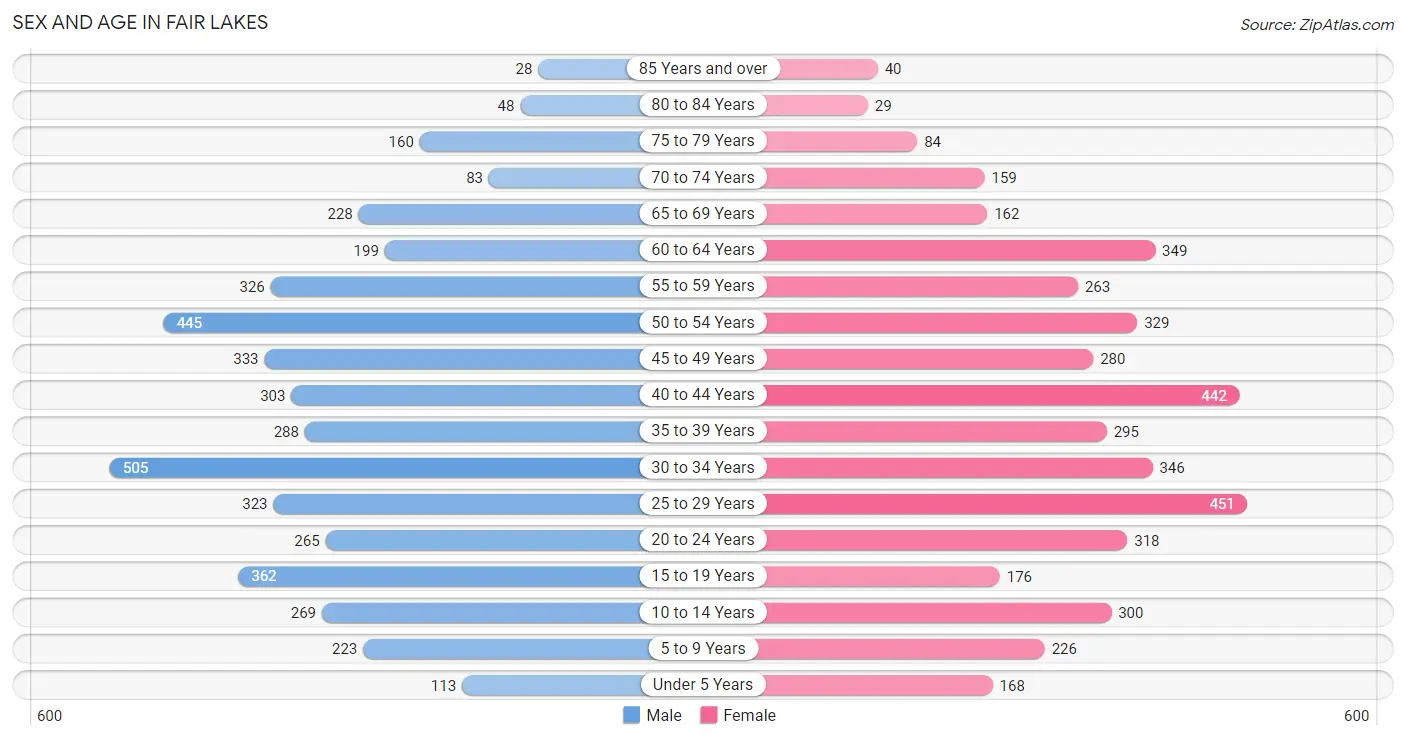
Sex and Age in Fair Lakes
Sex and Age in Fair Lakes
The most populous age groups in Fair Lakes are 30 to 34 Years (505 | 11.2%) for men and 25 to 29 Years (451 | 10.2%) for women.
| Age Bracket | Male | Female |
| Under 5 Years | 113 (2.5%) | 168 (3.8%) |
| 5 to 9 Years | 223 (5.0%) | 226 (5.1%) |
| 10 to 14 Years | 269 (6.0%) | 300 (6.8%) |
| 15 to 19 Years | 362 (8.0%) | 176 (4.0%) |
| 20 to 24 Years | 265 (5.9%) | 318 (7.2%) |
| 25 to 29 Years | 323 (7.2%) | 451 (10.2%) |
| 30 to 34 Years | 505 (11.2%) | 346 (7.8%) |
| 35 to 39 Years | 288 (6.4%) | 295 (6.7%) |
| 40 to 44 Years | 303 (6.7%) | 442 (10.0%) |
| 45 to 49 Years | 333 (7.4%) | 280 (6.3%) |
| 50 to 54 Years | 445 (9.9%) | 329 (7.4%) |
| 55 to 59 Years | 326 (7.2%) | 263 (5.9%) |
| 60 to 64 Years | 199 (4.4%) | 349 (7.9%) |
| 65 to 69 Years | 228 (5.1%) | 162 (3.7%) |
| 70 to 74 Years | 83 (1.8%) | 159 (3.6%) |
| 75 to 79 Years | 160 (3.5%) | 84 (1.9%) |
| 80 to 84 Years | 48 (1.1%) | 29 (0.7%) |
| 85 Years and over | 28 (0.6%) | 40 (0.9%) |
| Total | 4,501 (100.0%) | 4,417 (100.0%) |
Families and Households in Fair Lakes
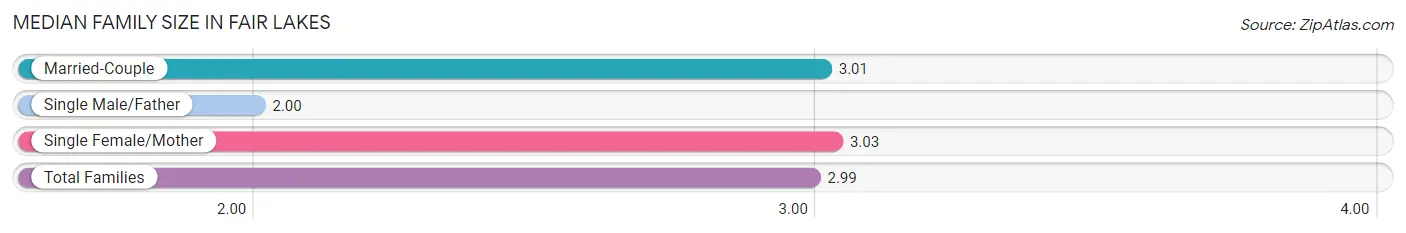
Median Family Size in Fair Lakes
The median family size in Fair Lakes is 2.99 persons per family, with single female/mother families (237 | 10.0%) accounting for the largest median family size of 3.03 persons per family. On the other hand, single male/father families (52 | 2.2%) represent the smallest median family size with 2.00 persons per family.
| Family Type | # Families | Family Size |
| Married-Couple | 2,091 (87.9%) | 3.01 |
| Single Male/Father | 52 (2.2%) | 2.00 |
| Single Female/Mother | 237 (10.0%) | 3.03 |
| Total Families | 2,380 (100.0%) | 2.99 |
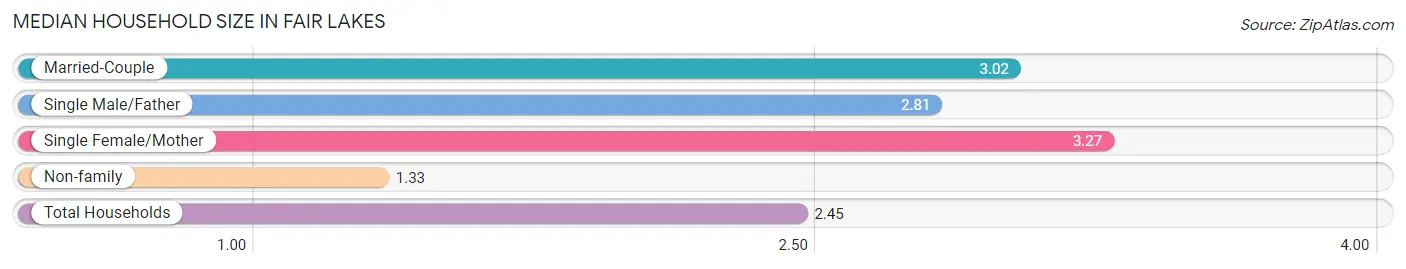
Median Household Size in Fair Lakes
The median household size in Fair Lakes is 2.45 persons per household, with single female/mother households (237 | 6.6%) accounting for the largest median household size of 3.27 persons per household. non-family households (1,241 | 34.3%) represent the smallest median household size with 1.33 persons per household.
| Household Type | # Households | Household Size |
| Married-Couple | 2,091 (57.8%) | 3.02 |
| Single Male/Father | 52 (1.4%) | 2.81 |
| Single Female/Mother | 237 (6.6%) | 3.27 |
| Non-family | 1,241 (34.3%) | 1.33 |
| Total Households | 3,621 (100.0%) | 2.45 |
Household Size by Marriage Status in Fair Lakes
Out of a total of 3,621 households in Fair Lakes, 2,380 (65.7%) are family households, while 1,241 (34.3%) are nonfamily households. The most numerous type of family households are 2-person households, comprising 1,106, and the most common type of nonfamily households are 1-person households, comprising 984.
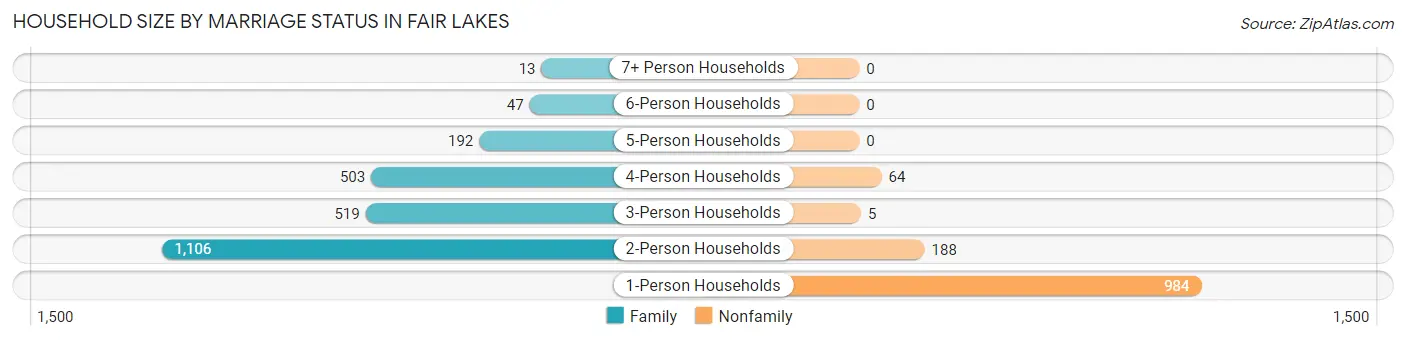
| Household Size | Family Households | Nonfamily Households |
| 1-Person Households | - | 984 (27.2%) |
| 2-Person Households | 1,106 (30.5%) | 188 (5.2%) |
| 3-Person Households | 519 (14.3%) | 5 (0.1%) |
| 4-Person Households | 503 (13.9%) | 64 (1.8%) |
| 5-Person Households | 192 (5.3%) | 0 (0.0%) |
| 6-Person Households | 47 (1.3%) | 0 (0.0%) |
| 7+ Person Households | 13 (0.4%) | 0 (0.0%) |
| Total | 2,380 (65.7%) | 1,241 (34.3%) |
Female Fertility in Fair Lakes
Fertility by Age in Fair Lakes
Average fertility rate in Fair Lakes is 26.0 births per 1,000 women. Women in the age bracket of 35 to 50 years have the highest fertility rate with 29.0 births per 1,000 women. Women in the age bracket of 20 to 34 years acount for 50.8% of all women with births.
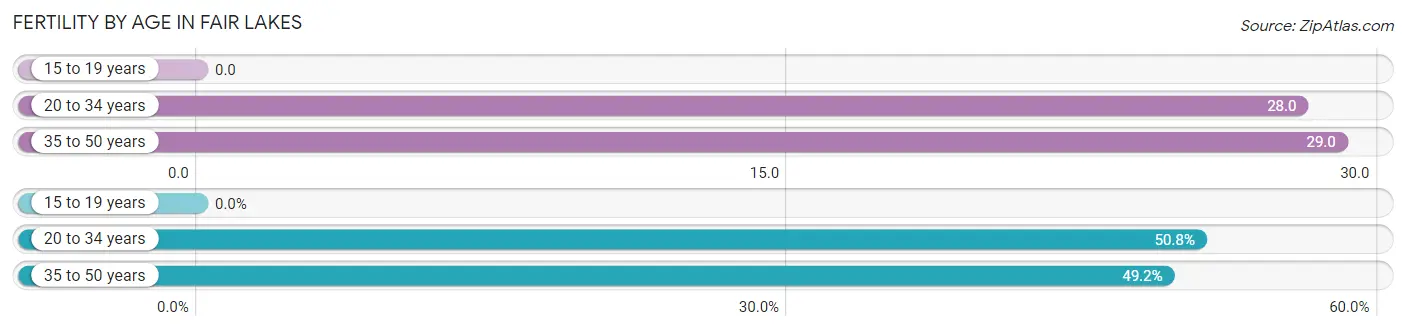
| Age Bracket | Women with Births | Births / 1,000 Women |
| 15 to 19 years | 0 (0.0%) | 0.0 |
| 20 to 34 years | 31 (50.8%) | 28.0 |
| 35 to 50 years | 30 (49.2%) | 29.0 |
| Total | 61 (100.0%) | 26.0 |
Fertility by Age by Marriage Status in Fair Lakes
78.7% of women with births (61) in Fair Lakes are married. The highest percentage of unmarried women with births falls into 20 to 34 years age bracket with 41.9% of them unmarried at the time of birth, while the lowest percentage of unmarried women with births belong to 35 to 50 years age bracket with 0.0% of them unmarried.
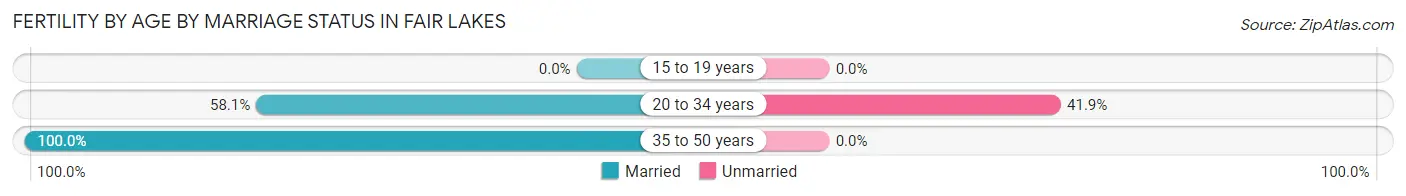
| Age Bracket | Married | Unmarried |
| 15 to 19 years | 0 (0.0%) | 0 (0.0%) |
| 20 to 34 years | 18 (58.1%) | 13 (41.9%) |
| 35 to 50 years | 30 (100.0%) | 0 (0.0%) |
| Total | 48 (78.7%) | 13 (21.3%) |
Fertility by Education in Fair Lakes
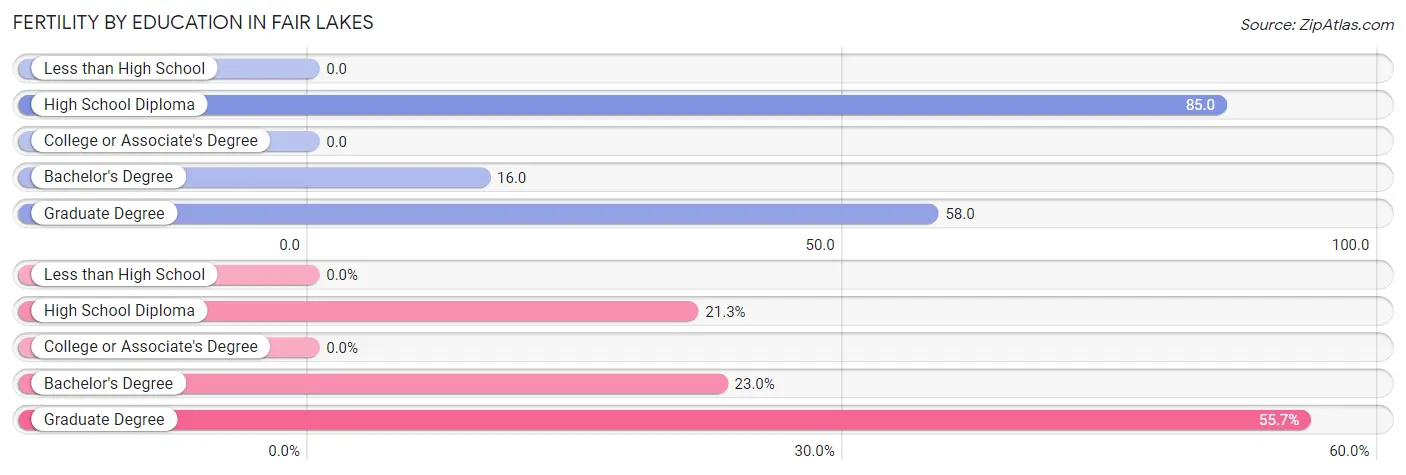
| Educational Attainment | Women with Births | Births / 1,000 Women |
| Less than High School | 0 (0.0%) | 0.0 |
| High School Diploma | 13 (21.3%) | 85.0 |
| College or Associate's Degree | 0 (0.0%) | 0.0 |
| Bachelor's Degree | 14 (23.0%) | 16.0 |
| Graduate Degree | 34 (55.7%) | 58.0 |
| Total | 61 (100.0%) | 26.0 |
Fertility by Education by Marriage Status in Fair Lakes
21.3% of women with births in Fair Lakes are unmarried. Women with the educational attainment of bachelor's degree are most likely to be married with 100.0% of them married at childbirth, while women with the educational attainment of high school diploma are least likely to be married with 100.0% of them unmarried at childbirth.
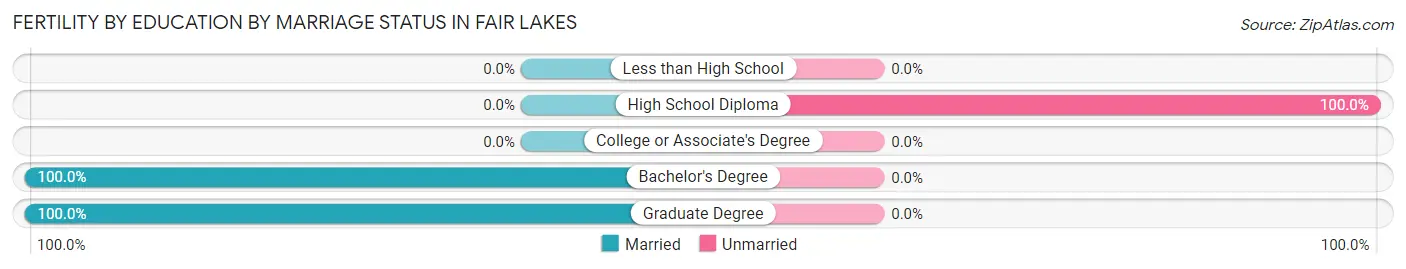
| Educational Attainment | Married | Unmarried |
| Less than High School | 0 (0.0%) | 0 (0.0%) |
| High School Diploma | 0 (0.0%) | 13 (100.0%) |
| College or Associate's Degree | 0 (0.0%) | 0 (0.0%) |
| Bachelor's Degree | 14 (100.0%) | 0 (0.0%) |
| Graduate Degree | 34 (100.0%) | 0 (0.0%) |
| Total | 48 (78.7%) | 13 (21.3%) |
Employment Characteristics in Fair Lakes
Employment by Class of Employer in Fair Lakes
Among the 5,409 employed individuals in Fair Lakes, private company employees (3,408 | 63.0%), federal government employees (530 | 9.8%), and not-for-profit organizations (480 | 8.9%) make up the most common classes of employment.
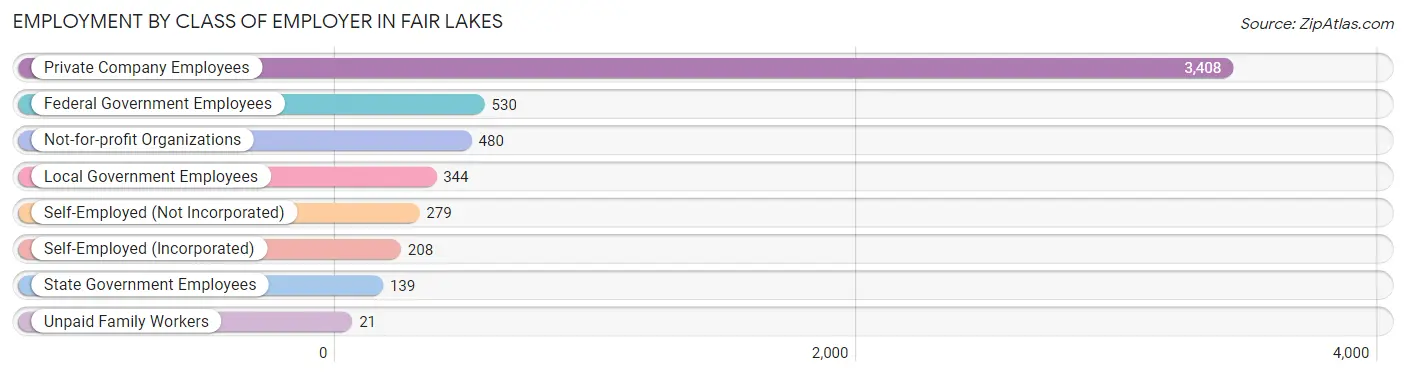
| Employer Class | # Employees | % Employees |
| Private Company Employees | 3,408 | 63.0% |
| Self-Employed (Incorporated) | 208 | 3.8% |
| Self-Employed (Not Incorporated) | 279 | 5.2% |
| Not-for-profit Organizations | 480 | 8.9% |
| Local Government Employees | 344 | 6.4% |
| State Government Employees | 139 | 2.6% |
| Federal Government Employees | 530 | 9.8% |
| Unpaid Family Workers | 21 | 0.4% |
| Total | 5,409 | 100.0% |
Employment Status by Age in Fair Lakes
According to the labor force statistics for Fair Lakes, out of the total population over 16 years of age (7,554), 74.3% or 5,613 individuals are in the labor force, with 2.7% or 152 of them unemployed. The age group with the highest labor force participation rate is 30 to 34 years, with 96.9% or 825 individuals in the labor force. Within the labor force, the 20 to 24 years age range has the highest percentage of unemployed individuals, with 8.2% or 32 of them being unemployed.
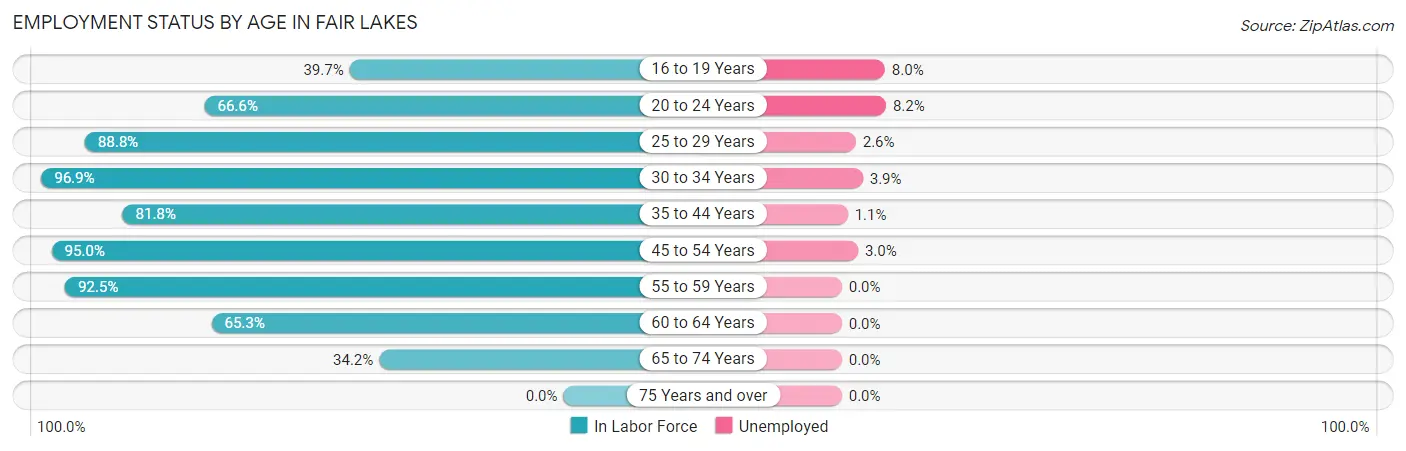
| Age Bracket | In Labor Force | Unemployed |
| 16 to 19 Years | 188 (39.7%) | 15 (8.0%) |
| 20 to 24 Years | 388 (66.6%) | 32 (8.2%) |
| 25 to 29 Years | 687 (88.8%) | 18 (2.6%) |
| 30 to 34 Years | 825 (96.9%) | 32 (3.9%) |
| 35 to 44 Years | 1,086 (81.8%) | 12 (1.1%) |
| 45 to 54 Years | 1,318 (95.0%) | 40 (3.0%) |
| 55 to 59 Years | 545 (92.5%) | 0 (0.0%) |
| 60 to 64 Years | 358 (65.3%) | 0 (0.0%) |
| 65 to 74 Years | 216 (34.2%) | 0 (0.0%) |
| 75 Years and over | 0 (0.0%) | 0 (0.0%) |
| Total | 5,613 (74.3%) | 152 (2.7%) |
Employment Status by Educational Attainment in Fair Lakes
According to labor force statistics for Fair Lakes, 88.0% of individuals (4,820) out of the total population between 25 and 64 years of age (5,477) are in the labor force, with 2.1% or 101 of them being unemployed. The group with the highest labor force participation rate are those with the educational attainment of bachelor's degree or higher, with 89.5% or 3,554 individuals in the labor force. Within the labor force, individuals with high school diploma education have the highest percentage of unemployment, with 4.8% or 12 of them being unemployed.
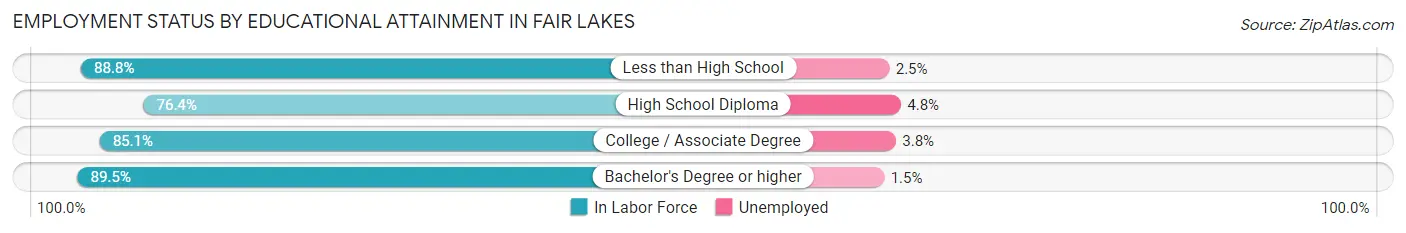
| Educational Attainment | In Labor Force | Unemployed |
| Less than High School | 238 (88.8%) | 7 (2.5%) |
| High School Diploma | 252 (76.4%) | 16 (4.8%) |
| College / Associate Degree | 773 (85.1%) | 35 (3.8%) |
| Bachelor's Degree or higher | 3,554 (89.5%) | 60 (1.5%) |
| Total | 4,820 (88.0%) | 115 (2.1%) |
Employment Occupations by Sex in Fair Lakes
Management, Business, Science and Arts Occupations
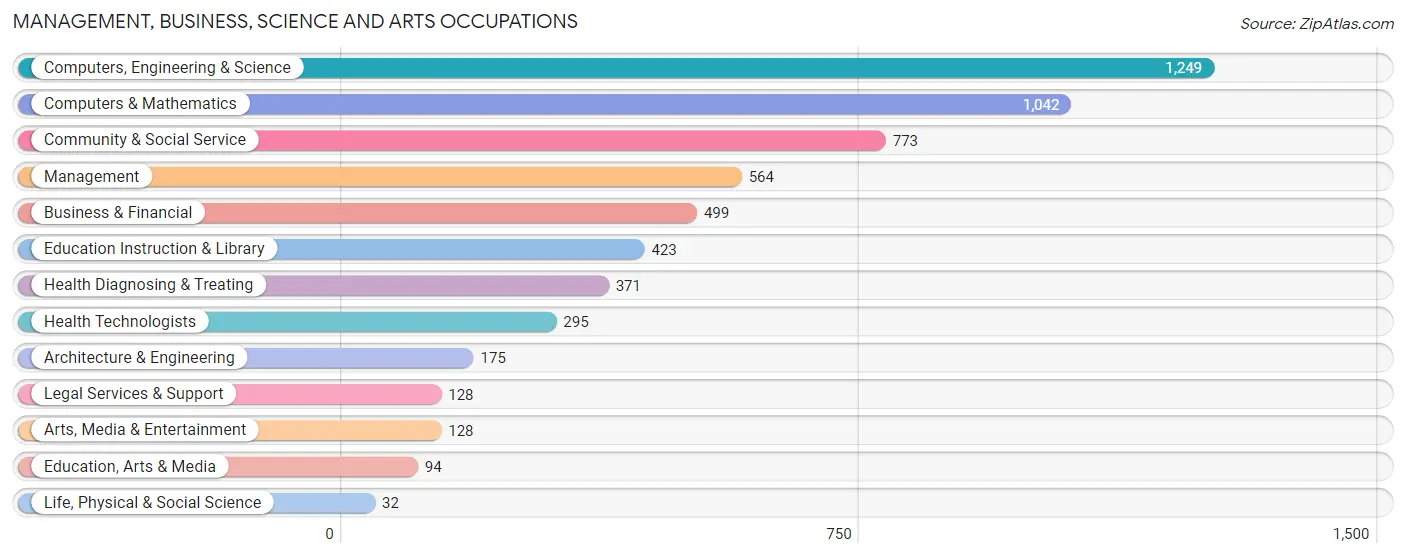
The most common Management, Business, Science and Arts occupations in Fair Lakes are Computers, Engineering & Science (1,249 | 23.1%), Computers & Mathematics (1,042 | 19.2%), Community & Social Service (773 | 14.3%), Management (564 | 10.4%), and Business & Financial (499 | 9.2%).
Management, Business, Science and Arts Occupations by Sex
Within the Management, Business, Science and Arts occupations in Fair Lakes, the most male-oriented occupations are Computers & Mathematics (84.4%), Computers, Engineering & Science (81.5%), and Architecture & Engineering (72.6%), while the most female-oriented occupations are Education, Arts & Media (88.3%), Health Diagnosing & Treating (87.6%), and Health Technologists (84.4%).
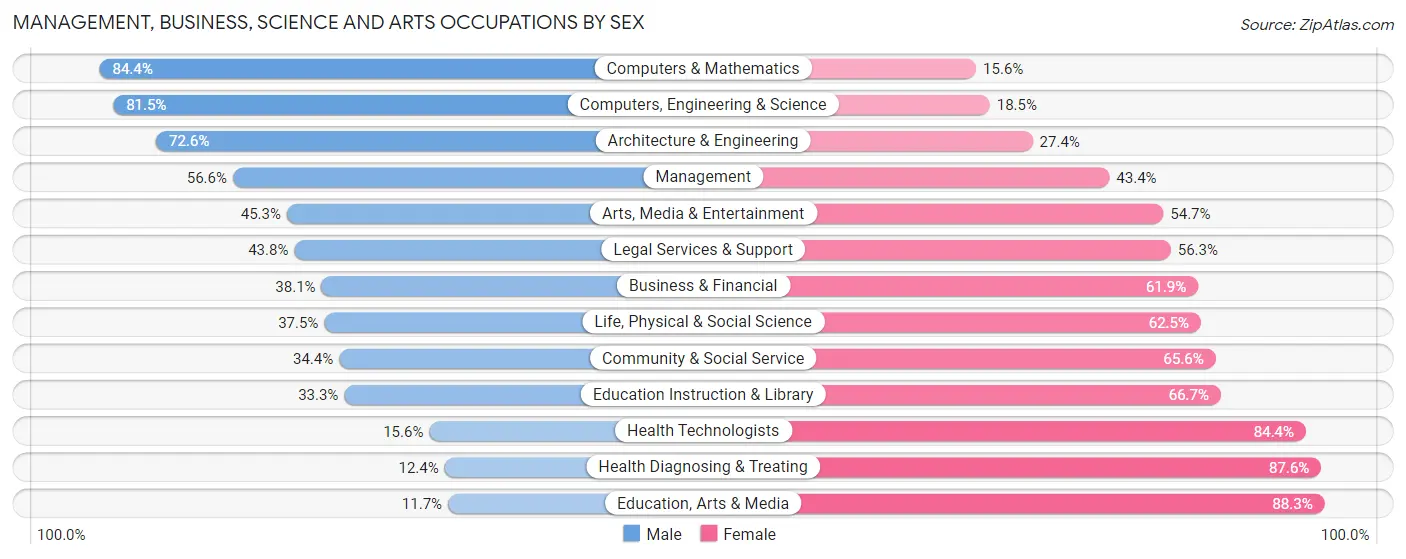
| Occupation | Male | Female |
| Management | 319 (56.6%) | 245 (43.4%) |
| Business & Financial | 190 (38.1%) | 309 (61.9%) |
| Computers, Engineering & Science | 1,018 (81.5%) | 231 (18.5%) |
| Computers & Mathematics | 879 (84.4%) | 163 (15.6%) |
| Architecture & Engineering | 127 (72.6%) | 48 (27.4%) |
| Life, Physical & Social Science | 12 (37.5%) | 20 (62.5%) |
| Community & Social Service | 266 (34.4%) | 507 (65.6%) |
| Education, Arts & Media | 11 (11.7%) | 83 (88.3%) |
| Legal Services & Support | 56 (43.8%) | 72 (56.2%) |
| Education Instruction & Library | 141 (33.3%) | 282 (66.7%) |
| Arts, Media & Entertainment | 58 (45.3%) | 70 (54.7%) |
| Health Diagnosing & Treating | 46 (12.4%) | 325 (87.6%) |
| Health Technologists | 46 (15.6%) | 249 (84.4%) |
| Total (Category) | 1,839 (53.2%) | 1,617 (46.8%) |
| Total (Overall) | 2,851 (52.6%) | 2,567 (47.4%) |
Services Occupations
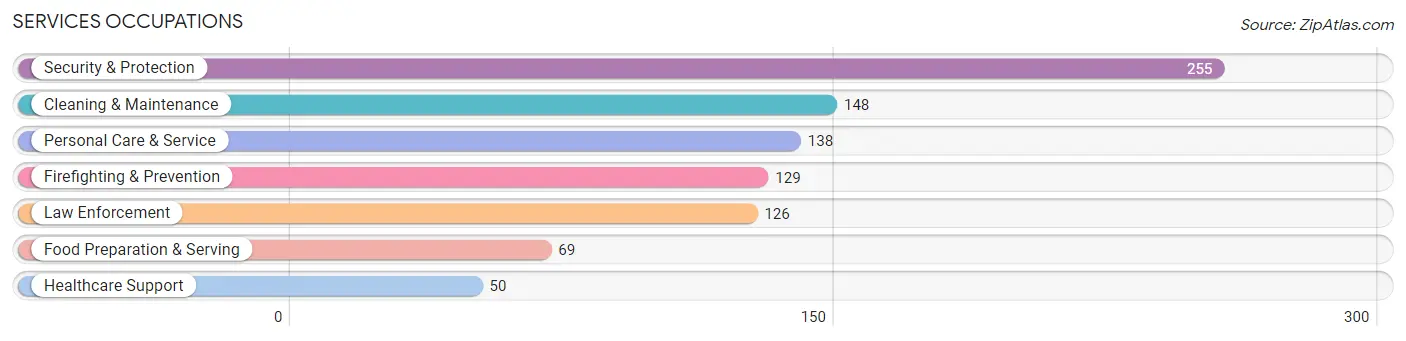
The most common Services occupations in Fair Lakes are Security & Protection (255 | 4.7%), Cleaning & Maintenance (148 | 2.7%), Personal Care & Service (138 | 2.5%), Firefighting & Prevention (129 | 2.4%), and Law Enforcement (126 | 2.3%).
Services Occupations by Sex
Within the Services occupations in Fair Lakes, the most male-oriented occupations are Law Enforcement (89.7%), Security & Protection (70.6%), and Firefighting & Prevention (51.9%), while the most female-oriented occupations are Healthcare Support (100.0%), Personal Care & Service (100.0%), and Food Preparation & Serving (56.5%).
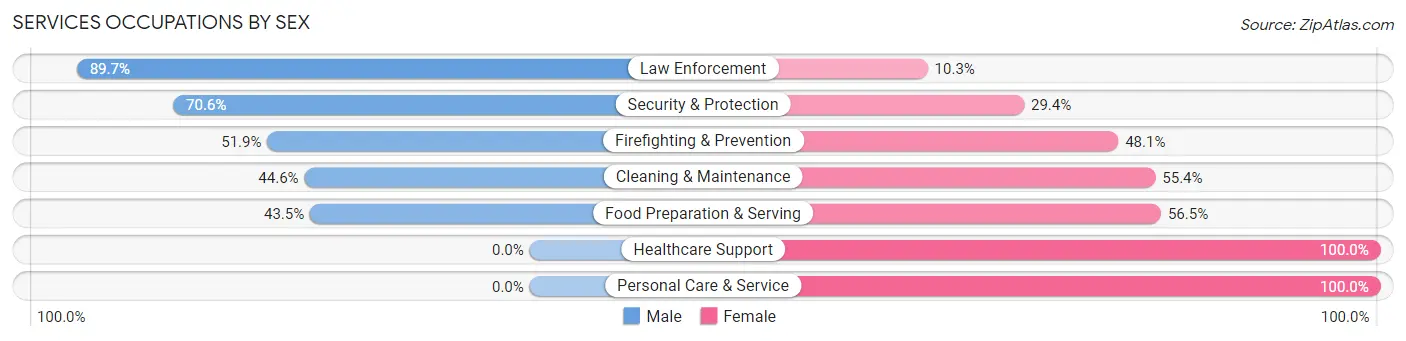
| Occupation | Male | Female |
| Healthcare Support | 0 (0.0%) | 50 (100.0%) |
| Security & Protection | 180 (70.6%) | 75 (29.4%) |
| Firefighting & Prevention | 67 (51.9%) | 62 (48.1%) |
| Law Enforcement | 113 (89.7%) | 13 (10.3%) |
| Food Preparation & Serving | 30 (43.5%) | 39 (56.5%) |
| Cleaning & Maintenance | 66 (44.6%) | 82 (55.4%) |
| Personal Care & Service | 0 (0.0%) | 138 (100.0%) |
| Total (Category) | 276 (41.8%) | 384 (58.2%) |
| Total (Overall) | 2,851 (52.6%) | 2,567 (47.4%) |
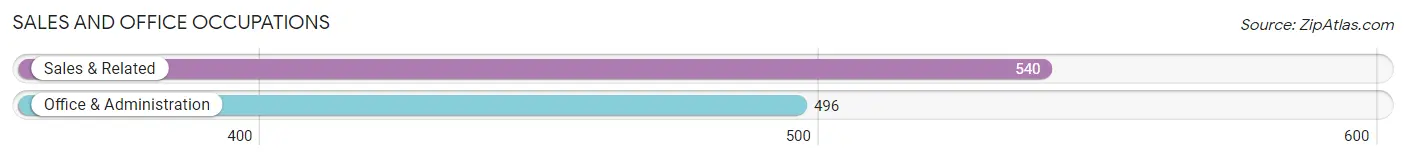
Sales and Office Occupations
The most common Sales and Office occupations in Fair Lakes are Sales & Related (540 | 10.0%), and Office & Administration (496 | 9.1%).
Sales and Office Occupations by Sex
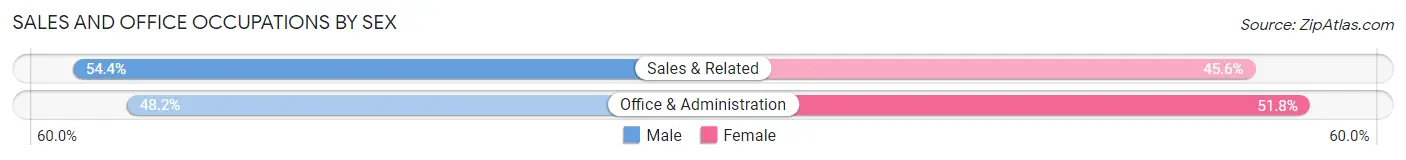
| Occupation | Male | Female |
| Sales & Related | 294 (54.4%) | 246 (45.6%) |
| Office & Administration | 239 (48.2%) | 257 (51.8%) |
| Total (Category) | 533 (51.4%) | 503 (48.5%) |
| Total (Overall) | 2,851 (52.6%) | 2,567 (47.4%) |
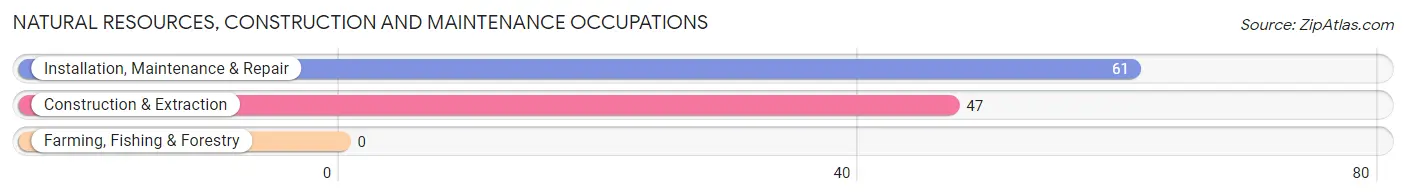
Natural Resources, Construction and Maintenance Occupations
The most common Natural Resources, Construction and Maintenance occupations in Fair Lakes are Installation, Maintenance & Repair (61 | 1.1%), and Construction & Extraction (47 | 0.9%).
Natural Resources, Construction and Maintenance Occupations by Sex
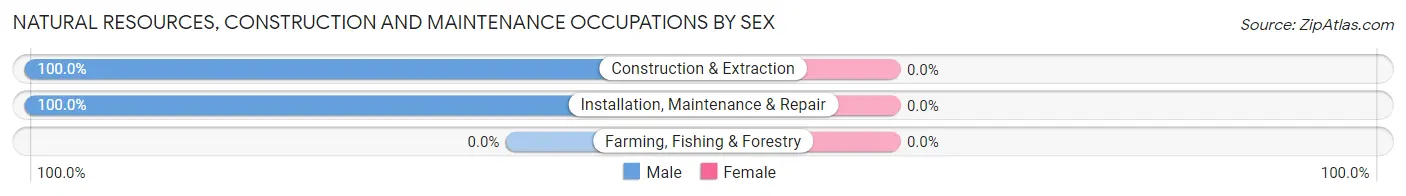
| Occupation | Male | Female |
| Farming, Fishing & Forestry | 0 (0.0%) | 0 (0.0%) |
| Construction & Extraction | 47 (100.0%) | 0 (0.0%) |
| Installation, Maintenance & Repair | 61 (100.0%) | 0 (0.0%) |
| Total (Category) | 108 (100.0%) | 0 (0.0%) |
| Total (Overall) | 2,851 (52.6%) | 2,567 (47.4%) |
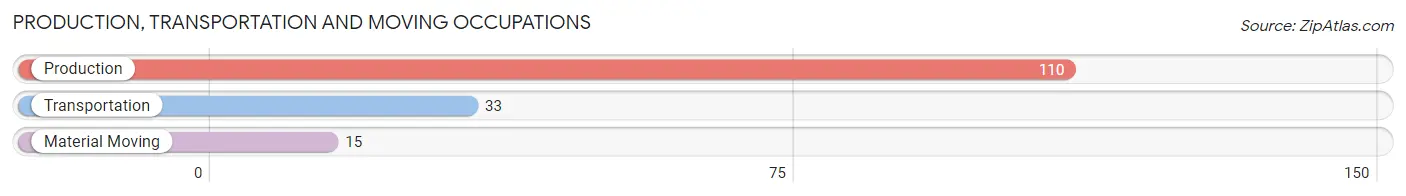
Production, Transportation and Moving Occupations
The most common Production, Transportation and Moving occupations in Fair Lakes are Production (110 | 2.0%), Transportation (33 | 0.6%), and Material Moving (15 | 0.3%).
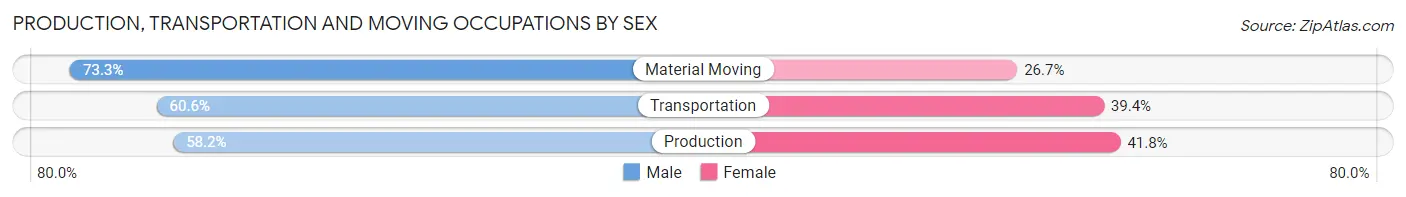
Production, Transportation and Moving Occupations by Sex
| Occupation | Male | Female |
| Production | 64 (58.2%) | 46 (41.8%) |
| Transportation | 20 (60.6%) | 13 (39.4%) |
| Material Moving | 11 (73.3%) | 4 (26.7%) |
| Total (Category) | 95 (60.1%) | 63 (39.9%) |
| Total (Overall) | 2,851 (52.6%) | 2,567 (47.4%) |
Employment Industries by Sex in Fair Lakes
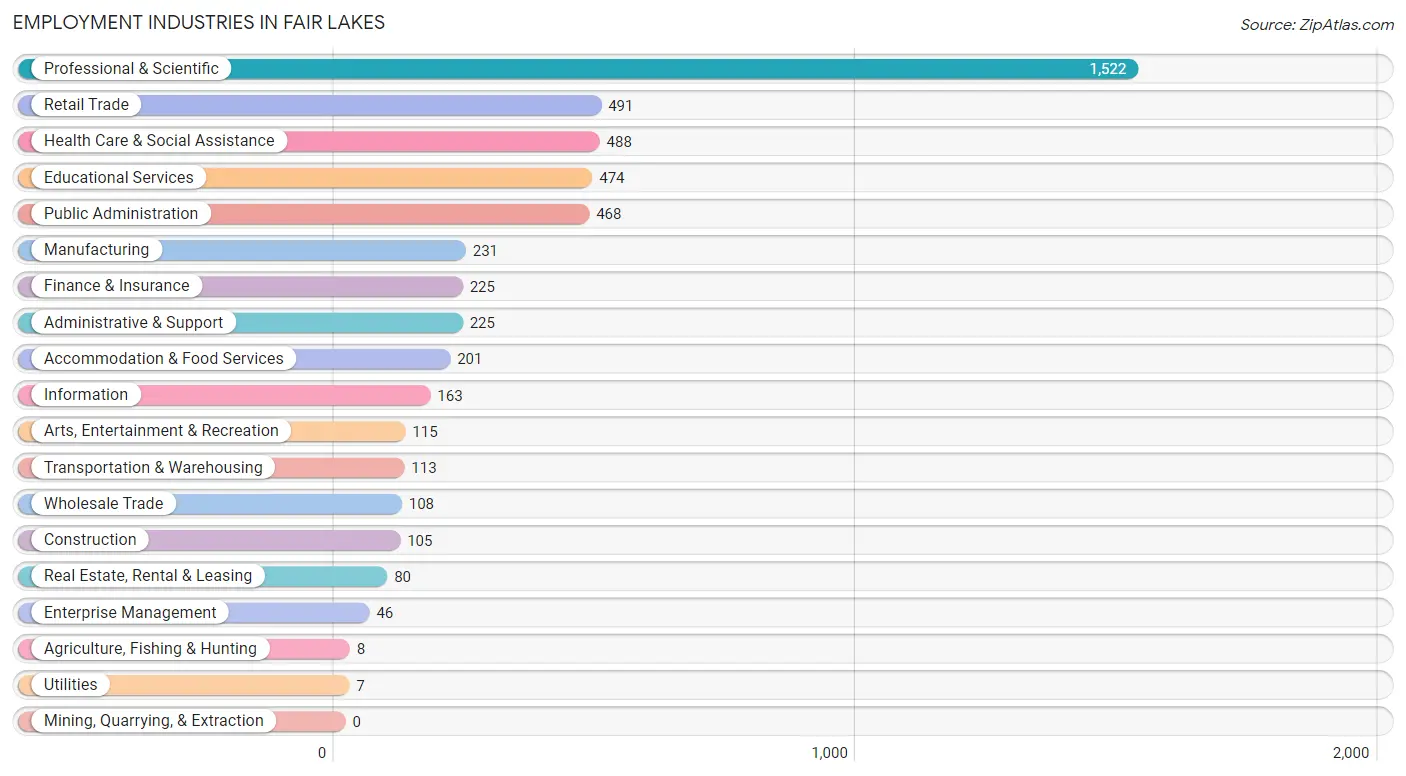
Employment Industries in Fair Lakes
The major employment industries in Fair Lakes include Professional & Scientific (1,522 | 28.1%), Retail Trade (491 | 9.1%), Health Care & Social Assistance (488 | 9.0%), Educational Services (474 | 8.7%), and Public Administration (468 | 8.6%).
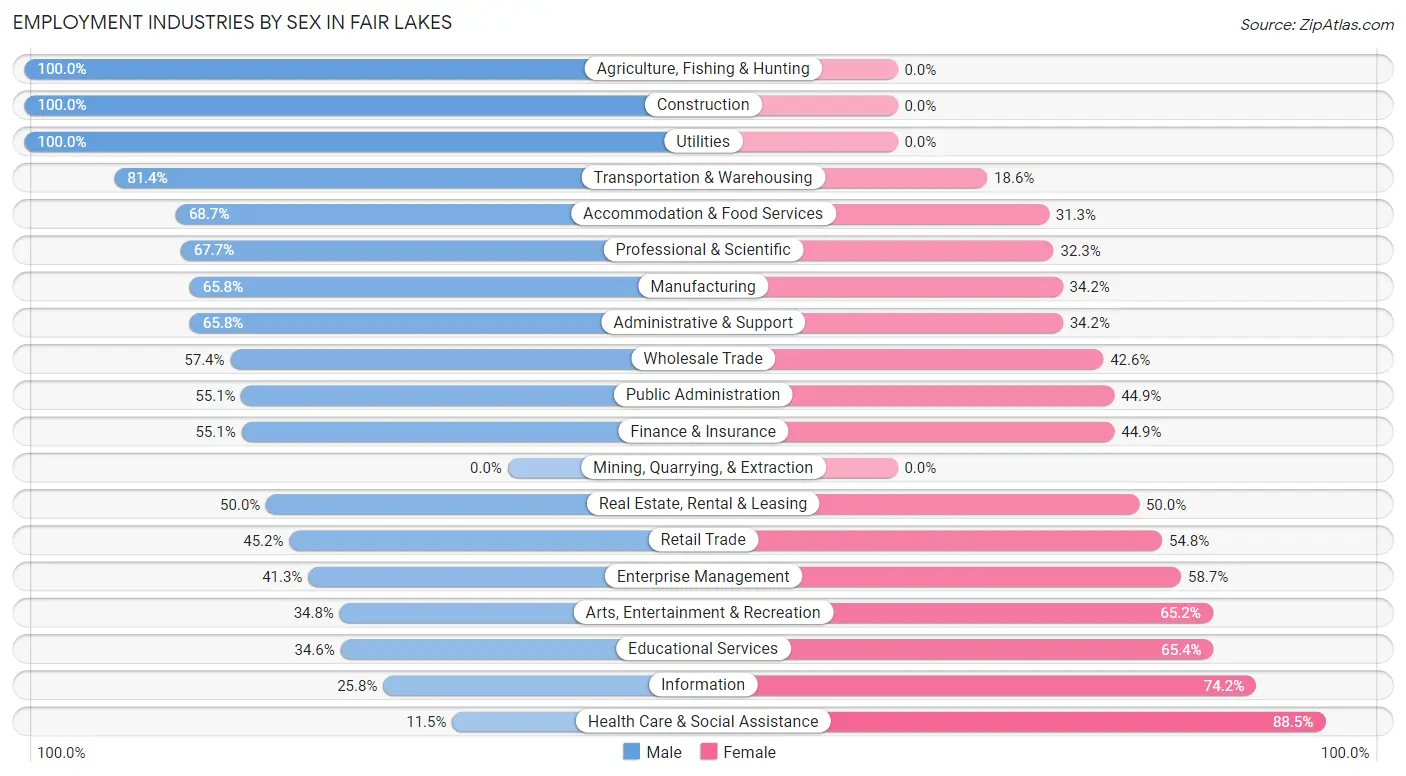
Employment Industries by Sex in Fair Lakes
The Fair Lakes industries that see more men than women are Agriculture, Fishing & Hunting (100.0%), Construction (100.0%), and Utilities (100.0%), whereas the industries that tend to have a higher number of women are Health Care & Social Assistance (88.5%), Information (74.2%), and Educational Services (65.4%).
| Industry | Male | Female |
| Agriculture, Fishing & Hunting | 8 (100.0%) | 0 (0.0%) |
| Mining, Quarrying, & Extraction | 0 (0.0%) | 0 (0.0%) |
| Construction | 105 (100.0%) | 0 (0.0%) |
| Manufacturing | 152 (65.8%) | 79 (34.2%) |
| Wholesale Trade | 62 (57.4%) | 46 (42.6%) |
| Retail Trade | 222 (45.2%) | 269 (54.8%) |
| Transportation & Warehousing | 92 (81.4%) | 21 (18.6%) |
| Utilities | 7 (100.0%) | 0 (0.0%) |
| Information | 42 (25.8%) | 121 (74.2%) |
| Finance & Insurance | 124 (55.1%) | 101 (44.9%) |
| Real Estate, Rental & Leasing | 40 (50.0%) | 40 (50.0%) |
| Professional & Scientific | 1,030 (67.7%) | 492 (32.3%) |
| Enterprise Management | 19 (41.3%) | 27 (58.7%) |
| Administrative & Support | 148 (65.8%) | 77 (34.2%) |
| Educational Services | 164 (34.6%) | 310 (65.4%) |
| Health Care & Social Assistance | 56 (11.5%) | 432 (88.5%) |
| Arts, Entertainment & Recreation | 40 (34.8%) | 75 (65.2%) |
| Accommodation & Food Services | 138 (68.7%) | 63 (31.3%) |
| Public Administration | 258 (55.1%) | 210 (44.9%) |
| Total | 2,851 (52.6%) | 2,567 (47.4%) |
Education in Fair Lakes
School Enrollment in Fair Lakes
The most common levels of schooling among the 2,223 students in Fair Lakes are college / undergraduate (559 | 25.2%), high school (448 | 20.2%), and middle school (432 | 19.4%).
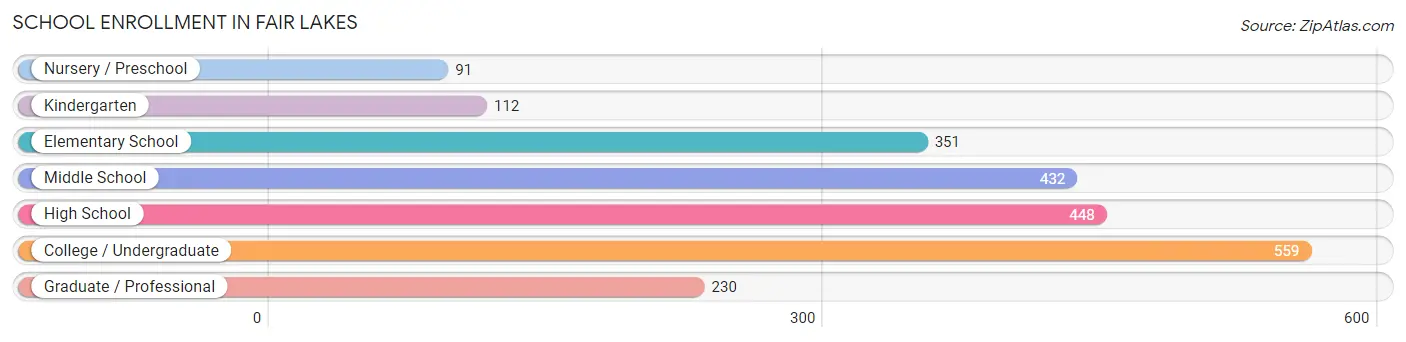
| School Level | # Students | % Students |
| Nursery / Preschool | 91 | 4.1% |
| Kindergarten | 112 | 5.0% |
| Elementary School | 351 | 15.8% |
| Middle School | 432 | 19.4% |
| High School | 448 | 20.2% |
| College / Undergraduate | 559 | 25.2% |
| Graduate / Professional | 230 | 10.3% |
| Total | 2,223 | 100.0% |
School Enrollment by Age by Funding Source in Fair Lakes
Out of a total of 2,223 students who are enrolled in schools in Fair Lakes, 333 (15.0%) attend a private institution, while the remaining 1,890 (85.0%) are enrolled in public schools. The age group of 3 to 4 year olds has the highest likelihood of being enrolled in private schools, with 31 (100.0% in the age bracket) enrolled. Conversely, the age group of 18 to 19 year olds has the lowest likelihood of being enrolled in a private school, with 174 (100.0% in the age bracket) attending a public institution.
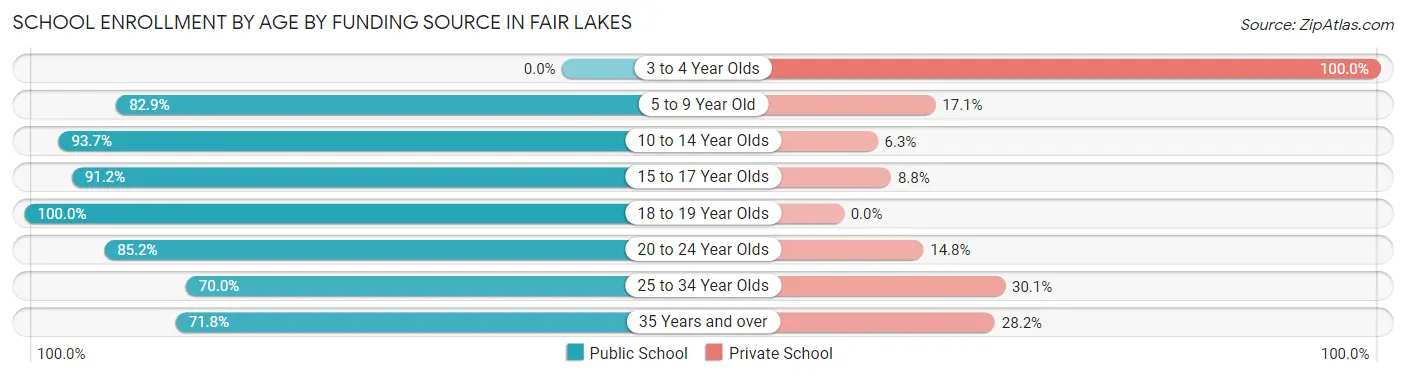
| Age Bracket | Public School | Private School |
| 3 to 4 Year Olds | 0 (0.0%) | 31 (100.0%) |
| 5 to 9 Year Old | 364 (82.9%) | 75 (17.1%) |
| 10 to 14 Year Olds | 504 (93.7%) | 34 (6.3%) |
| 15 to 17 Year Olds | 290 (91.2%) | 28 (8.8%) |
| 18 to 19 Year Olds | 174 (100.0%) | 0 (0.0%) |
| 20 to 24 Year Olds | 270 (85.2%) | 47 (14.8%) |
| 25 to 34 Year Olds | 135 (70.0%) | 58 (30.0%) |
| 35 Years and over | 153 (71.8%) | 60 (28.2%) |
| Total | 1,890 (85.0%) | 333 (15.0%) |
Educational Attainment by Field of Study in Fair Lakes
Engineering (857 | 17.6%), business (728 | 14.9%), computers & mathematics (685 | 14.1%), social sciences (556 | 11.4%), and science & technology (353 | 7.2%) are the most common fields of study among 4,870 individuals in Fair Lakes who have obtained a bachelor's degree or higher.
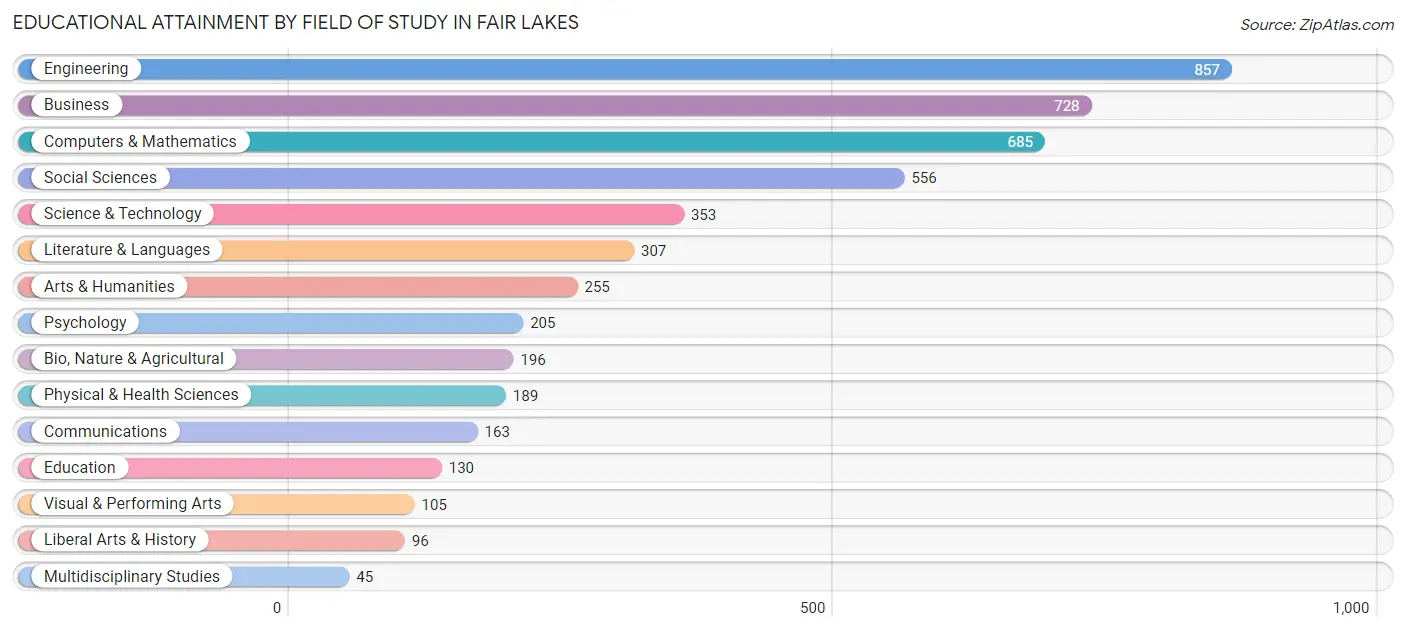
| Field of Study | # Graduates | % Graduates |
| Computers & Mathematics | 685 | 14.1% |
| Bio, Nature & Agricultural | 196 | 4.0% |
| Physical & Health Sciences | 189 | 3.9% |
| Psychology | 205 | 4.2% |
| Social Sciences | 556 | 11.4% |
| Engineering | 857 | 17.6% |
| Multidisciplinary Studies | 45 | 0.9% |
| Science & Technology | 353 | 7.2% |
| Business | 728 | 14.9% |
| Education | 130 | 2.7% |
| Literature & Languages | 307 | 6.3% |
| Liberal Arts & History | 96 | 2.0% |
| Visual & Performing Arts | 105 | 2.2% |
| Communications | 163 | 3.4% |
| Arts & Humanities | 255 | 5.2% |
| Total | 4,870 | 100.0% |
Transportation & Commute in Fair Lakes
Vehicle Availability by Sex in Fair Lakes
The most prevalent vehicle ownership categories in Fair Lakes are males with 2 vehicles (1,198, accounting for 42.0%) and females with 2 vehicles (1,024, making up 47.2%).
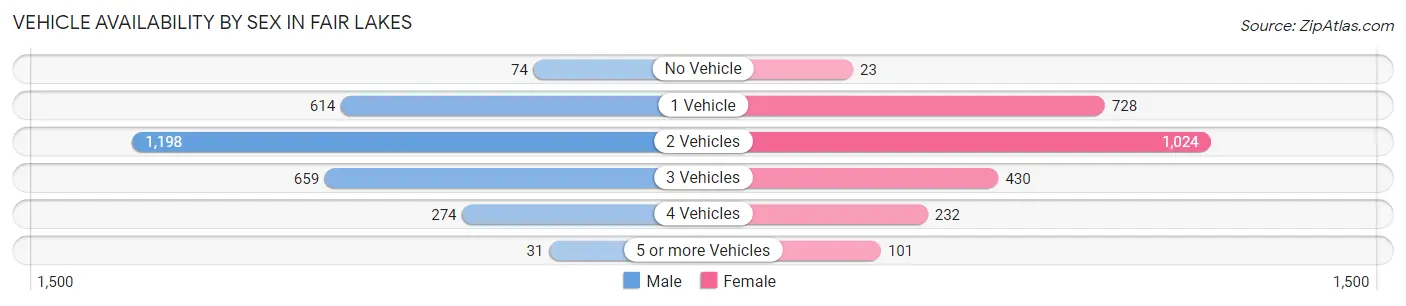
| Vehicles Available | Male | Female |
| No Vehicle | 74 (2.6%) | 23 (0.9%) |
| 1 Vehicle | 614 (21.5%) | 728 (28.7%) |
| 2 Vehicles | 1,198 (42.0%) | 1,024 (40.4%) |
| 3 Vehicles | 659 (23.1%) | 430 (16.9%) |
| 4 Vehicles | 274 (9.6%) | 232 (9.1%) |
| 5 or more Vehicles | 31 (1.1%) | 101 (4.0%) |
| Total | 2,850 (100.0%) | 2,538 (100.0%) |
Commute Time in Fair Lakes
The most frequently occuring commute durations in Fair Lakes are 30 to 34 minutes (905 commuters, 21.2%), 15 to 19 minutes (534 commuters, 12.5%), and 20 to 24 minutes (458 commuters, 10.7%).
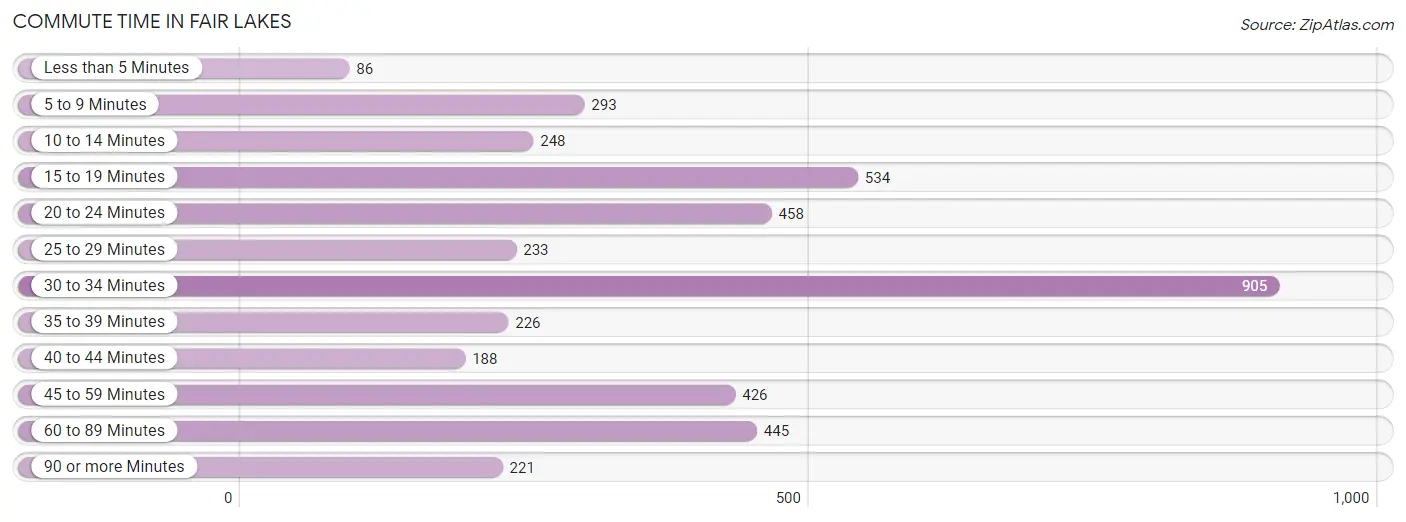
| Commute Time | # Commuters | % Commuters |
| Less than 5 Minutes | 86 | 2.0% |
| 5 to 9 Minutes | 293 | 6.9% |
| 10 to 14 Minutes | 248 | 5.8% |
| 15 to 19 Minutes | 534 | 12.5% |
| 20 to 24 Minutes | 458 | 10.7% |
| 25 to 29 Minutes | 233 | 5.5% |
| 30 to 34 Minutes | 905 | 21.2% |
| 35 to 39 Minutes | 226 | 5.3% |
| 40 to 44 Minutes | 188 | 4.4% |
| 45 to 59 Minutes | 426 | 10.0% |
| 60 to 89 Minutes | 445 | 10.4% |
| 90 or more Minutes | 221 | 5.2% |
Commute Time by Sex in Fair Lakes
The most common commute times in Fair Lakes are 30 to 34 minutes (542 commuters, 23.2%) for males and 30 to 34 minutes (363 commuters, 18.8%) for females.
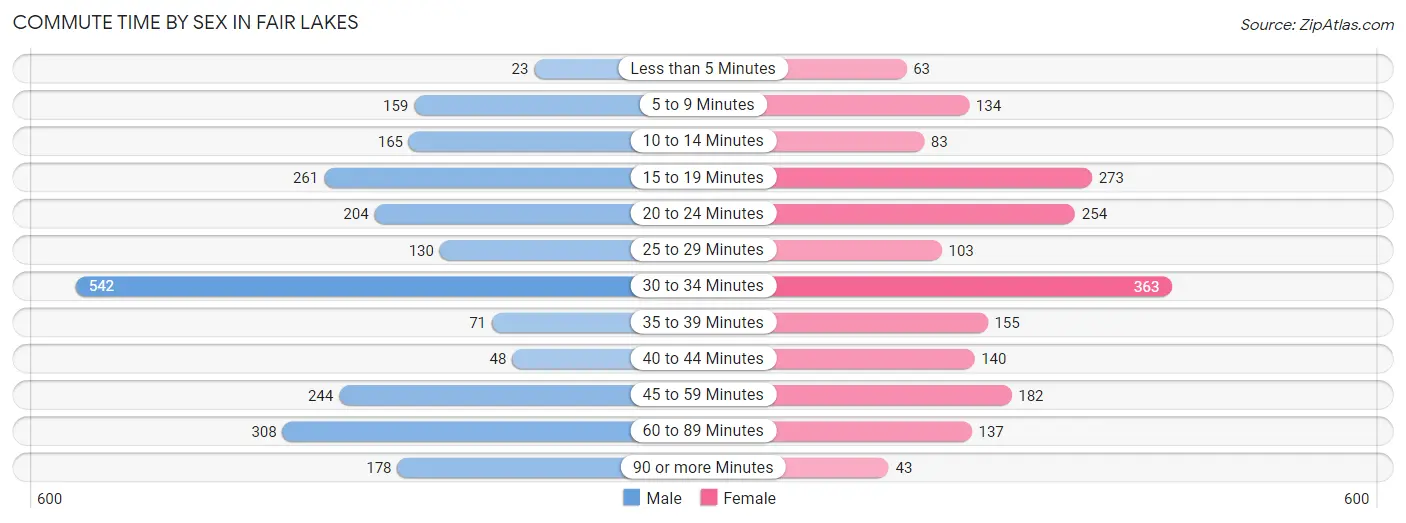
| Commute Time | Male | Female |
| Less than 5 Minutes | 23 (1.0%) | 63 (3.3%) |
| 5 to 9 Minutes | 159 (6.8%) | 134 (6.9%) |
| 10 to 14 Minutes | 165 (7.1%) | 83 (4.3%) |
| 15 to 19 Minutes | 261 (11.2%) | 273 (14.1%) |
| 20 to 24 Minutes | 204 (8.7%) | 254 (13.2%) |
| 25 to 29 Minutes | 130 (5.6%) | 103 (5.3%) |
| 30 to 34 Minutes | 542 (23.2%) | 363 (18.8%) |
| 35 to 39 Minutes | 71 (3.0%) | 155 (8.0%) |
| 40 to 44 Minutes | 48 (2.1%) | 140 (7.2%) |
| 45 to 59 Minutes | 244 (10.5%) | 182 (9.4%) |
| 60 to 89 Minutes | 308 (13.2%) | 137 (7.1%) |
| 90 or more Minutes | 178 (7.6%) | 43 (2.2%) |
Time of Departure to Work by Sex in Fair Lakes
The most frequent times of departure to work in Fair Lakes are 7:00 AM to 7:29 AM (421, 18.0%) for males and 7:00 AM to 7:29 AM (360, 18.6%) for females.
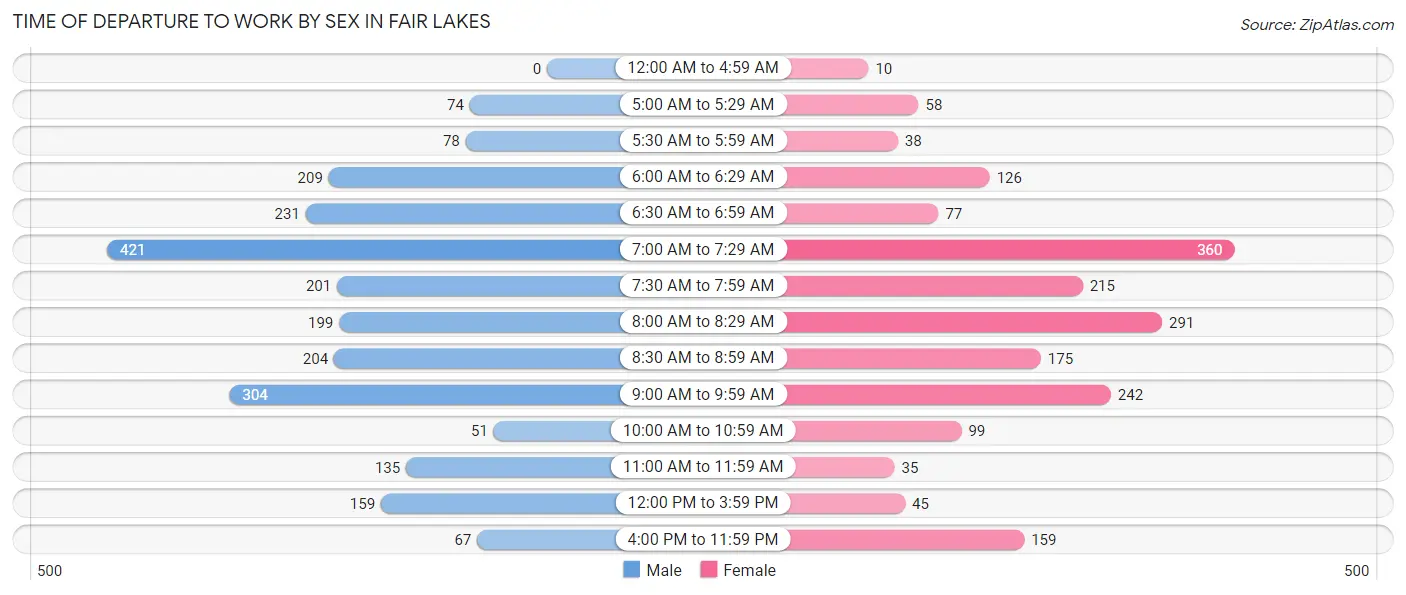
| Time of Departure | Male | Female |
| 12:00 AM to 4:59 AM | 0 (0.0%) | 10 (0.5%) |
| 5:00 AM to 5:29 AM | 74 (3.2%) | 58 (3.0%) |
| 5:30 AM to 5:59 AM | 78 (3.3%) | 38 (2.0%) |
| 6:00 AM to 6:29 AM | 209 (9.0%) | 126 (6.5%) |
| 6:30 AM to 6:59 AM | 231 (9.9%) | 77 (4.0%) |
| 7:00 AM to 7:29 AM | 421 (18.0%) | 360 (18.6%) |
| 7:30 AM to 7:59 AM | 201 (8.6%) | 215 (11.1%) |
| 8:00 AM to 8:29 AM | 199 (8.5%) | 291 (15.1%) |
| 8:30 AM to 8:59 AM | 204 (8.7%) | 175 (9.1%) |
| 9:00 AM to 9:59 AM | 304 (13.0%) | 242 (12.5%) |
| 10:00 AM to 10:59 AM | 51 (2.2%) | 99 (5.1%) |
| 11:00 AM to 11:59 AM | 135 (5.8%) | 35 (1.8%) |
| 12:00 PM to 3:59 PM | 159 (6.8%) | 45 (2.3%) |
| 4:00 PM to 11:59 PM | 67 (2.9%) | 159 (8.2%) |
| Total | 2,333 (100.0%) | 1,930 (100.0%) |
Housing Occupancy in Fair Lakes
Occupancy by Ownership in Fair Lakes
Of the total 3,621 dwellings in Fair Lakes, owner-occupied units account for 2,152 (59.4%), while renter-occupied units make up 1,469 (40.6%).
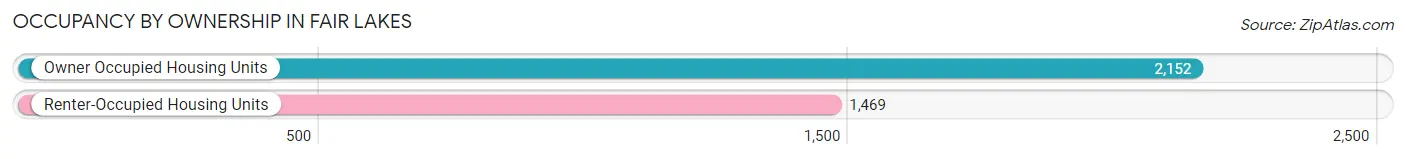
| Occupancy | # Housing Units | % Housing Units |
| Owner Occupied Housing Units | 2,152 | 59.4% |
| Renter-Occupied Housing Units | 1,469 | 40.6% |
| Total Occupied Housing Units | 3,621 | 100.0% |
Occupancy by Household Size in Fair Lakes
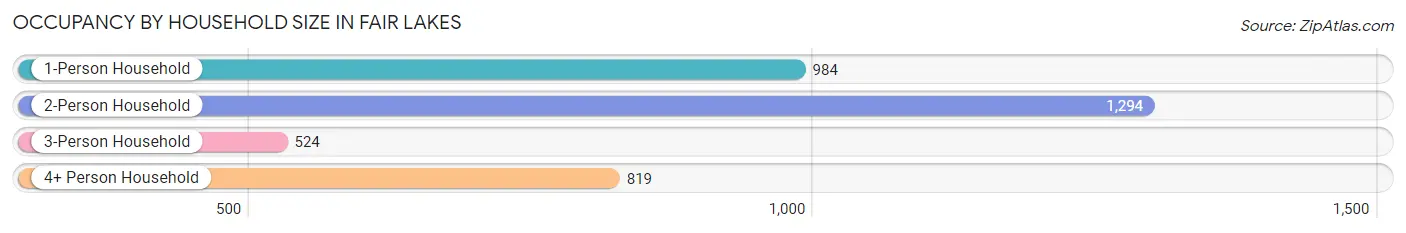
| Household Size | # Housing Units | % Housing Units |
| 1-Person Household | 984 | 27.2% |
| 2-Person Household | 1,294 | 35.7% |
| 3-Person Household | 524 | 14.5% |
| 4+ Person Household | 819 | 22.6% |
| Total Housing Units | 3,621 | 100.0% |
Occupancy by Ownership by Household Size in Fair Lakes
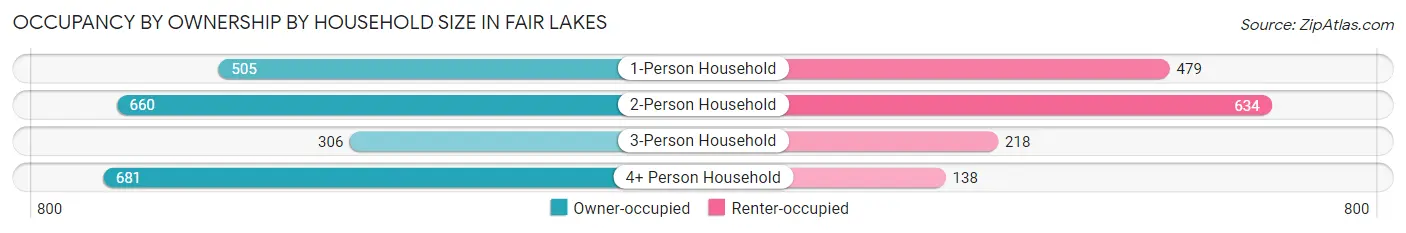
| Household Size | Owner-occupied | Renter-occupied |
| 1-Person Household | 505 (51.3%) | 479 (48.7%) |
| 2-Person Household | 660 (51.0%) | 634 (49.0%) |
| 3-Person Household | 306 (58.4%) | 218 (41.6%) |
| 4+ Person Household | 681 (83.2%) | 138 (16.9%) |
| Total Housing Units | 2,152 (59.4%) | 1,469 (40.6%) |
Occupancy by Educational Attainment in Fair Lakes
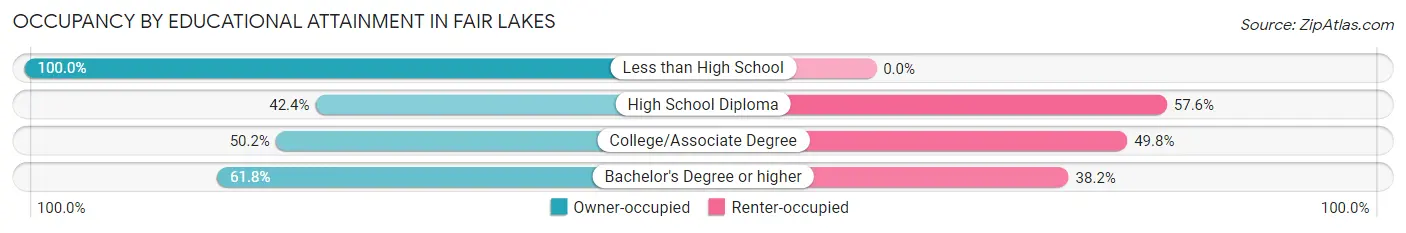
| Household Size | Owner-occupied | Renter-occupied |
| Less than High School | 94 (100.0%) | 0 (0.0%) |
| High School Diploma | 97 (42.4%) | 132 (57.6%) |
| College/Associate Degree | 339 (50.2%) | 336 (49.8%) |
| Bachelor's Degree or higher | 1,622 (61.8%) | 1,001 (38.2%) |
Occupancy by Age of Householder in Fair Lakes
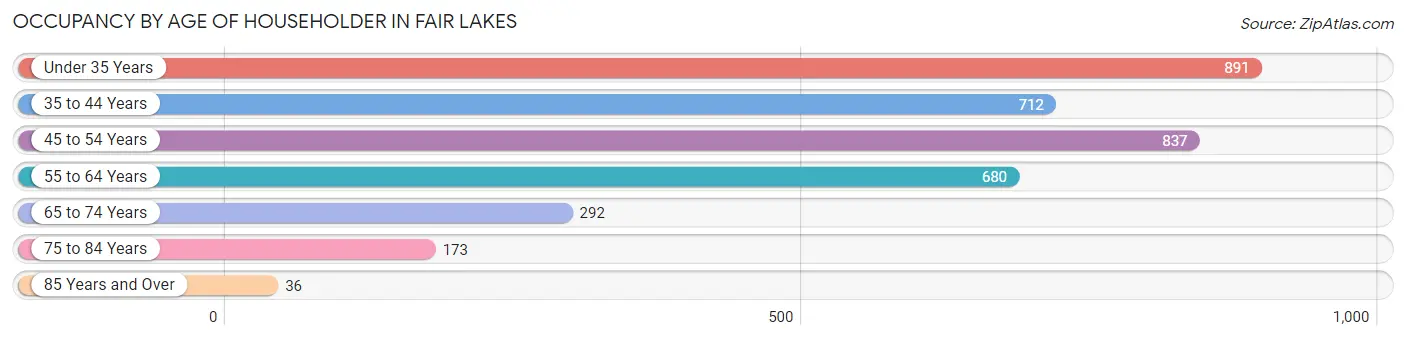
| Age Bracket | # Households | % Households |
| Under 35 Years | 891 | 24.6% |
| 35 to 44 Years | 712 | 19.7% |
| 45 to 54 Years | 837 | 23.1% |
| 55 to 64 Years | 680 | 18.8% |
| 65 to 74 Years | 292 | 8.1% |
| 75 to 84 Years | 173 | 4.8% |
| 85 Years and Over | 36 | 1.0% |
| Total | 3,621 | 100.0% |
Housing Finances in Fair Lakes
Median Income by Occupancy in Fair Lakes
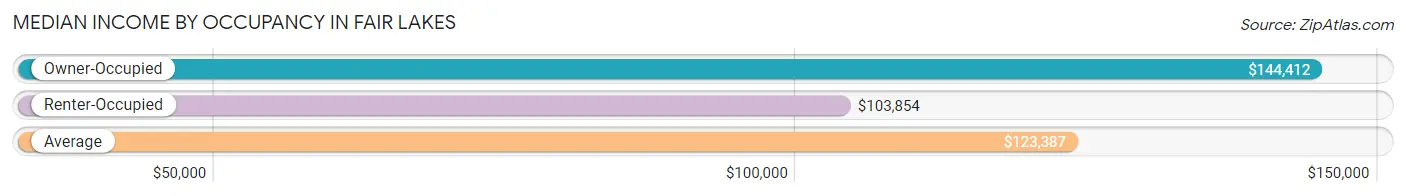
| Occupancy Type | # Households | Median Income |
| Owner-Occupied | 2,152 (59.4%) | $144,412 |
| Renter-Occupied | 1,469 (40.6%) | $103,854 |
| Average | 3,621 (100.0%) | $123,387 |
Occupancy by Householder Income Bracket in Fair Lakes
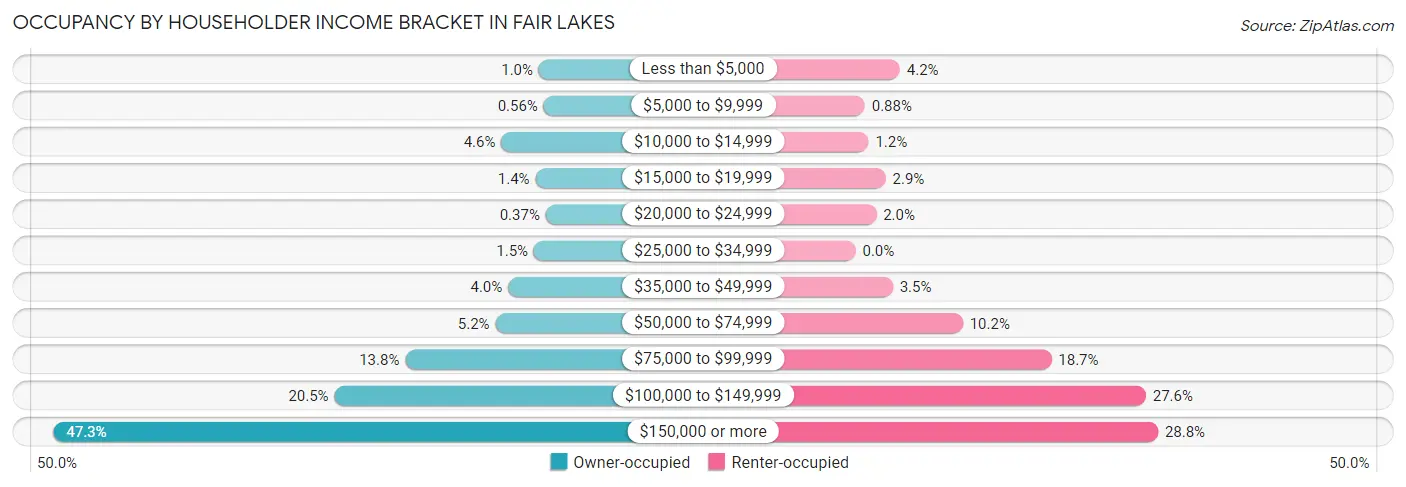
| Income Bracket | Owner-occupied | Renter-occupied |
| Less than $5,000 | 22 (1.0%) | 62 (4.2%) |
| $5,000 to $9,999 | 12 (0.6%) | 13 (0.9%) |
| $10,000 to $14,999 | 99 (4.6%) | 18 (1.2%) |
| $15,000 to $19,999 | 29 (1.3%) | 42 (2.9%) |
| $20,000 to $24,999 | 8 (0.4%) | 29 (2.0%) |
| $25,000 to $34,999 | 32 (1.5%) | 0 (0.0%) |
| $35,000 to $49,999 | 85 (4.0%) | 52 (3.5%) |
| $50,000 to $74,999 | 111 (5.2%) | 150 (10.2%) |
| $75,000 to $99,999 | 296 (13.8%) | 274 (18.6%) |
| $100,000 to $149,999 | 441 (20.5%) | 406 (27.6%) |
| $150,000 or more | 1,017 (47.3%) | 423 (28.8%) |
| Total | 2,152 (100.0%) | 1,469 (100.0%) |
Monthly Housing Cost Tiers in Fair Lakes
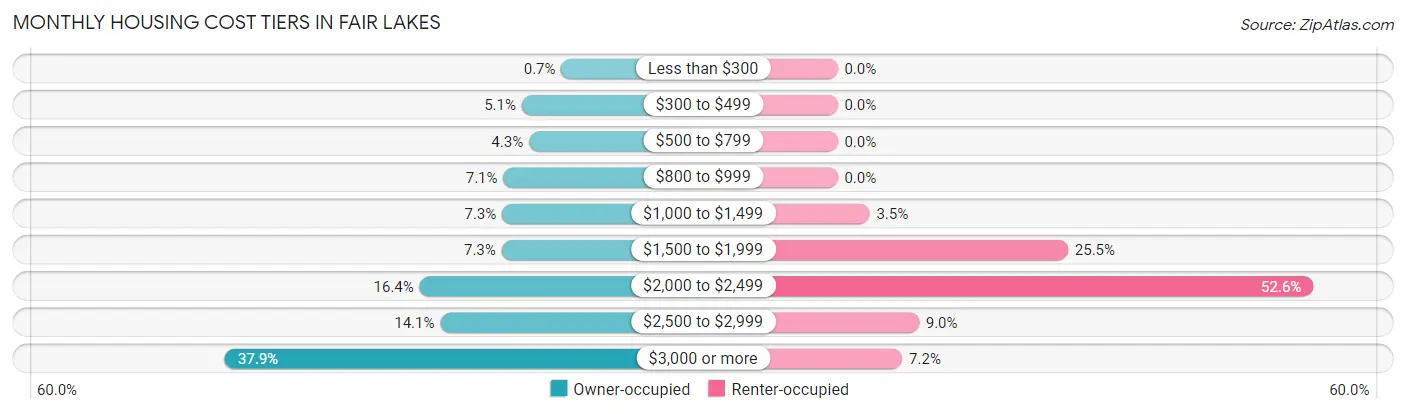
| Monthly Cost | Owner-occupied | Renter-occupied |
| Less than $300 | 15 (0.7%) | 0 (0.0%) |
| $300 to $499 | 109 (5.1%) | 0 (0.0%) |
| $500 to $799 | 92 (4.3%) | 0 (0.0%) |
| $800 to $999 | 153 (7.1%) | 0 (0.0%) |
| $1,000 to $1,499 | 156 (7.2%) | 52 (3.5%) |
| $1,500 to $1,999 | 157 (7.3%) | 374 (25.5%) |
| $2,000 to $2,499 | 352 (16.4%) | 772 (52.5%) |
| $2,500 to $2,999 | 303 (14.1%) | 132 (9.0%) |
| $3,000 or more | 815 (37.9%) | 105 (7.1%) |
| Total | 2,152 (100.0%) | 1,469 (100.0%) |
Physical Housing Characteristics in Fair Lakes
Housing Structures in Fair Lakes
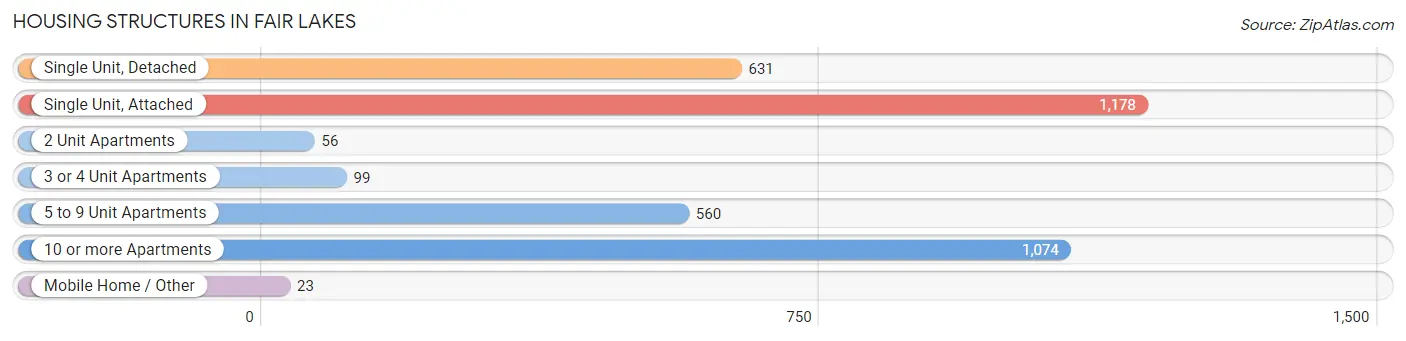
| Structure Type | # Housing Units | % Housing Units |
| Single Unit, Detached | 631 | 17.4% |
| Single Unit, Attached | 1,178 | 32.5% |
| 2 Unit Apartments | 56 | 1.5% |
| 3 or 4 Unit Apartments | 99 | 2.7% |
| 5 to 9 Unit Apartments | 560 | 15.5% |
| 10 or more Apartments | 1,074 | 29.7% |
| Mobile Home / Other | 23 | 0.6% |
| Total | 3,621 | 100.0% |
Housing Structures by Occupancy in Fair Lakes
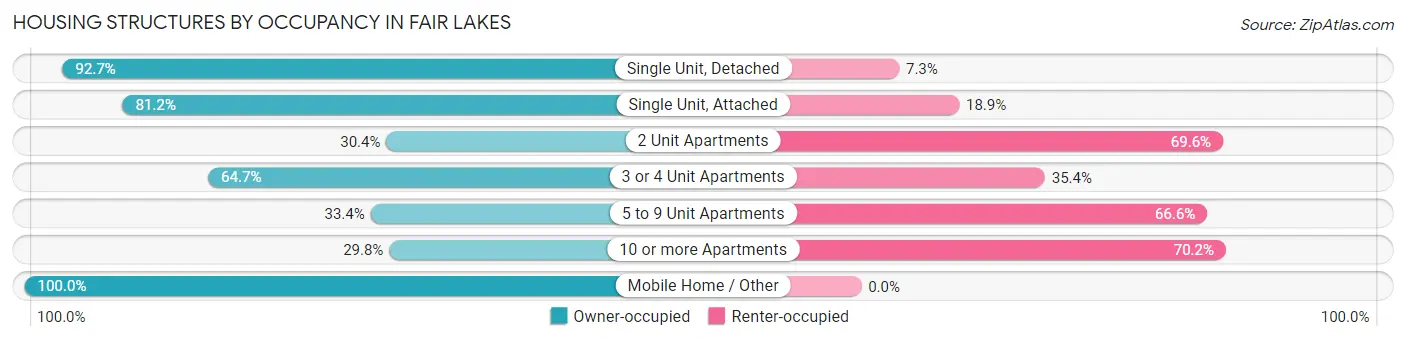
| Structure Type | Owner-occupied | Renter-occupied |
| Single Unit, Detached | 585 (92.7%) | 46 (7.3%) |
| Single Unit, Attached | 956 (81.1%) | 222 (18.9%) |
| 2 Unit Apartments | 17 (30.4%) | 39 (69.6%) |
| 3 or 4 Unit Apartments | 64 (64.6%) | 35 (35.3%) |
| 5 to 9 Unit Apartments | 187 (33.4%) | 373 (66.6%) |
| 10 or more Apartments | 320 (29.8%) | 754 (70.2%) |
| Mobile Home / Other | 23 (100.0%) | 0 (0.0%) |
| Total | 2,152 (59.4%) | 1,469 (40.6%) |
Housing Structures by Number of Rooms in Fair Lakes
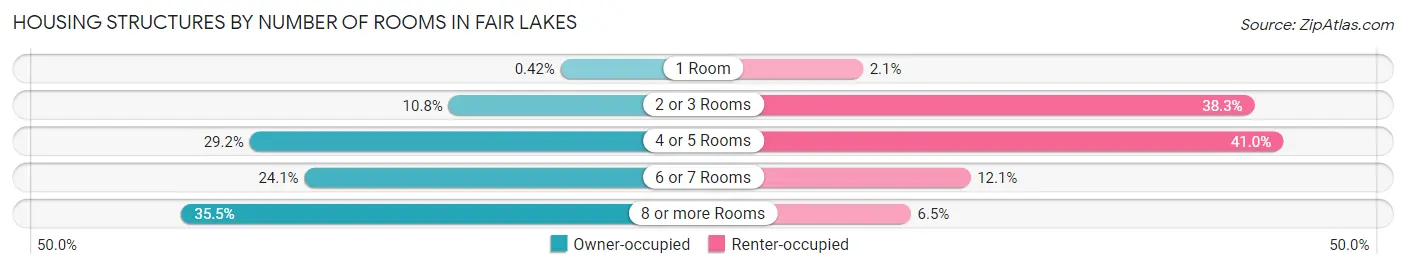
| Number of Rooms | Owner-occupied | Renter-occupied |
| 1 Room | 9 (0.4%) | 31 (2.1%) |
| 2 or 3 Rooms | 232 (10.8%) | 563 (38.3%) |
| 4 or 5 Rooms | 628 (29.2%) | 602 (41.0%) |
| 6 or 7 Rooms | 519 (24.1%) | 177 (12.0%) |
| 8 or more Rooms | 764 (35.5%) | 96 (6.5%) |
| Total | 2,152 (100.0%) | 1,469 (100.0%) |
Housing Structure by Heating Type in Fair Lakes
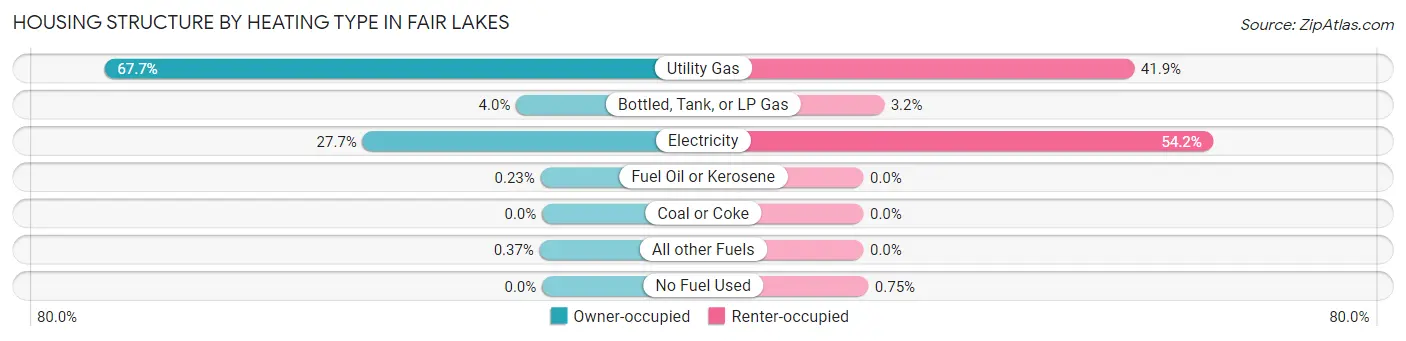
| Heating Type | Owner-occupied | Renter-occupied |
| Utility Gas | 1,456 (67.7%) | 615 (41.9%) |
| Bottled, Tank, or LP Gas | 86 (4.0%) | 47 (3.2%) |
| Electricity | 597 (27.7%) | 796 (54.2%) |
| Fuel Oil or Kerosene | 5 (0.2%) | 0 (0.0%) |
| Coal or Coke | 0 (0.0%) | 0 (0.0%) |
| All other Fuels | 8 (0.4%) | 0 (0.0%) |
| No Fuel Used | 0 (0.0%) | 11 (0.7%) |
| Total | 2,152 (100.0%) | 1,469 (100.0%) |
Household Vehicle Usage in Fair Lakes
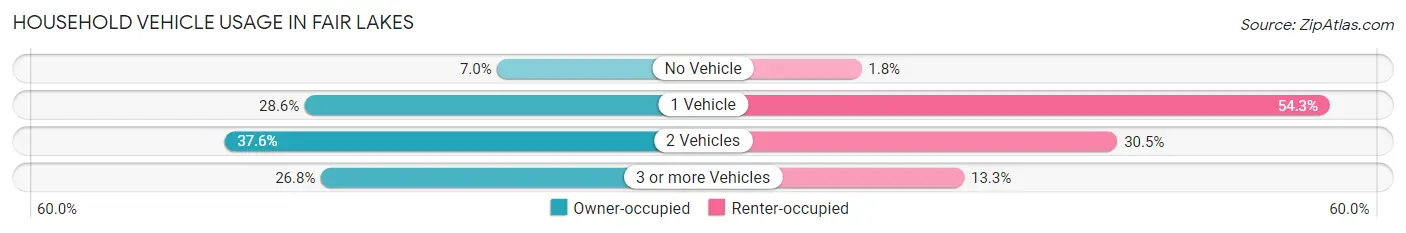
| Vehicles per Household | Owner-occupied | Renter-occupied |
| No Vehicle | 151 (7.0%) | 27 (1.8%) |
| 1 Vehicle | 615 (28.6%) | 798 (54.3%) |
| 2 Vehicles | 810 (37.6%) | 448 (30.5%) |
| 3 or more Vehicles | 576 (26.8%) | 196 (13.3%) |
| Total | 2,152 (100.0%) | 1,469 (100.0%) |
Real Estate & Mortgages in Fair Lakes
Real Estate and Mortgage Overview in Fair Lakes
| Characteristic | Without Mortgage | With Mortgage |
| Housing Units | 497 | 1,655 |
| Median Property Value | $392,500 | $589,500 |
| Median Household Income | - | - |
| Monthly Housing Costs | $858 | $815 |
| Real Estate Taxes | $3,909 | $18 |
Property Value by Mortgage Status in Fair Lakes
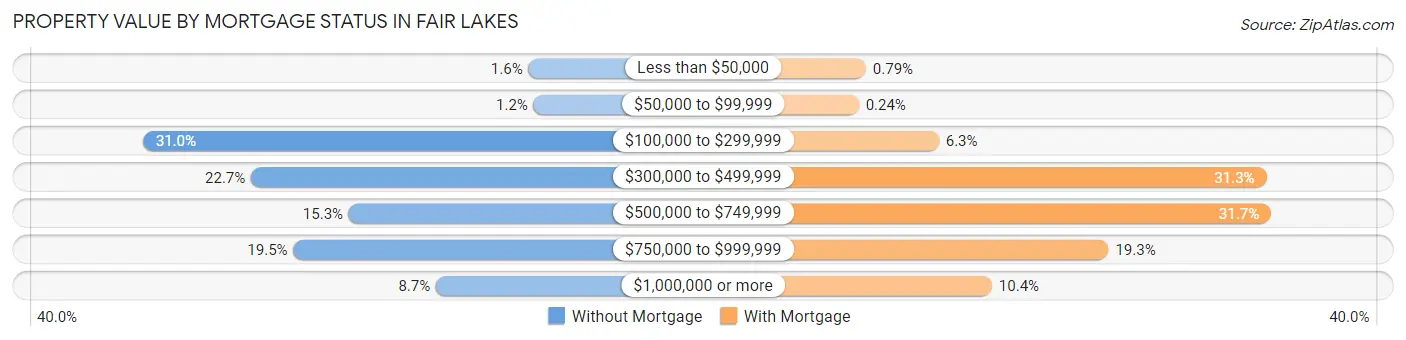
| Property Value | Without Mortgage | With Mortgage |
| Less than $50,000 | 8 (1.6%) | 13 (0.8%) |
| $50,000 to $99,999 | 6 (1.2%) | 4 (0.2%) |
| $100,000 to $299,999 | 154 (31.0%) | 105 (6.3%) |
| $300,000 to $499,999 | 113 (22.7%) | 518 (31.3%) |
| $500,000 to $749,999 | 76 (15.3%) | 524 (31.7%) |
| $750,000 to $999,999 | 97 (19.5%) | 319 (19.3%) |
| $1,000,000 or more | 43 (8.6%) | 172 (10.4%) |
| Total | 497 (100.0%) | 1,655 (100.0%) |
Household Income by Mortgage Status in Fair Lakes
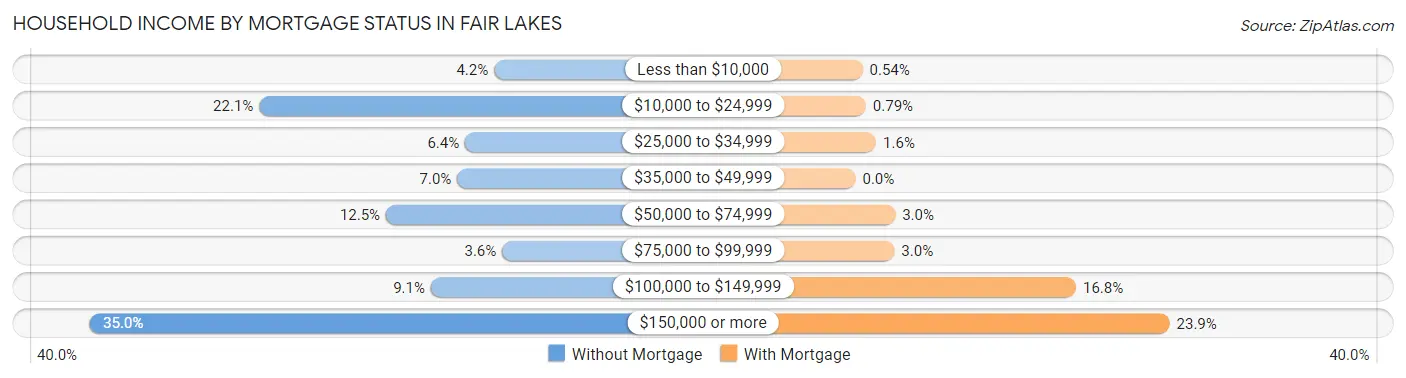
| Household Income | Without Mortgage | With Mortgage |
| Less than $10,000 | 21 (4.2%) | 9 (0.5%) |
| $10,000 to $24,999 | 110 (22.1%) | 13 (0.8%) |
| $25,000 to $34,999 | 32 (6.4%) | 26 (1.6%) |
| $35,000 to $49,999 | 35 (7.0%) | 0 (0.0%) |
| $50,000 to $74,999 | 62 (12.5%) | 50 (3.0%) |
| $75,000 to $99,999 | 18 (3.6%) | 49 (3.0%) |
| $100,000 to $149,999 | 45 (9.0%) | 278 (16.8%) |
| $150,000 or more | 174 (35.0%) | 396 (23.9%) |
| Total | 497 (100.0%) | 1,655 (100.0%) |
Property Value to Household Income Ratio in Fair Lakes
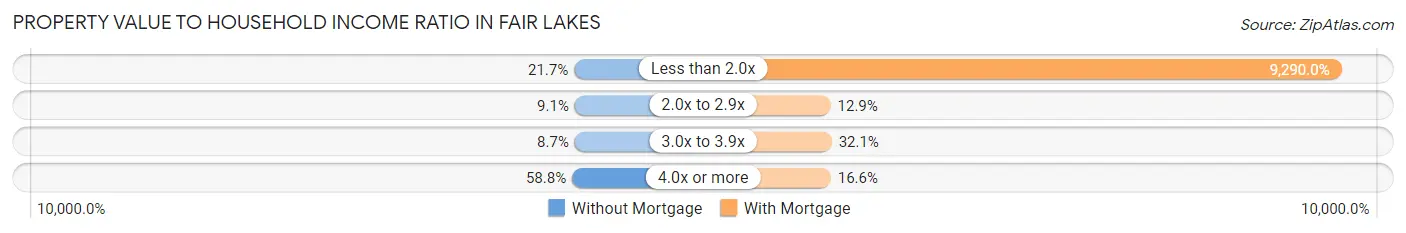
| Value-to-Income Ratio | Without Mortgage | With Mortgage |
| Less than 2.0x | 108 (21.7%) | 153,750 (9,290.0%) |
| 2.0x to 2.9x | 45 (9.0%) | 214 (12.9%) |
| 3.0x to 3.9x | 43 (8.6%) | 531 (32.1%) |
| 4.0x or more | 292 (58.8%) | 274 (16.6%) |
| Total | 497 (100.0%) | 1,655 (100.0%) |
Real Estate Taxes by Mortgage Status in Fair Lakes
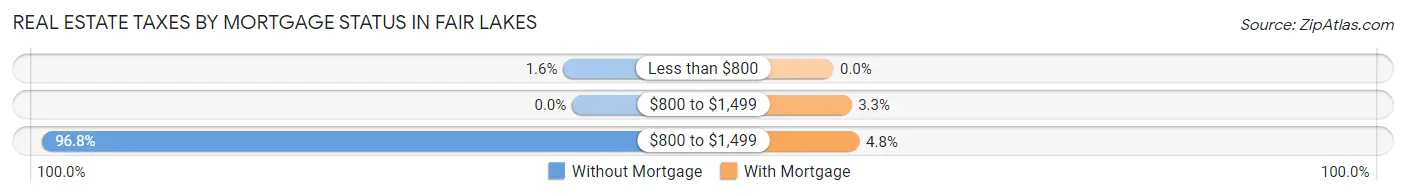
| Property Taxes | Without Mortgage | With Mortgage |
| Less than $800 | 8 (1.6%) | 0 (0.0%) |
| $800 to $1,499 | 0 (0.0%) | 55 (3.3%) |
| $800 to $1,499 | 481 (96.8%) | 79 (4.8%) |
| Total | 497 (100.0%) | 1,655 (100.0%) |
Health & Disability in Fair Lakes
Health Insurance Coverage by Age in Fair Lakes
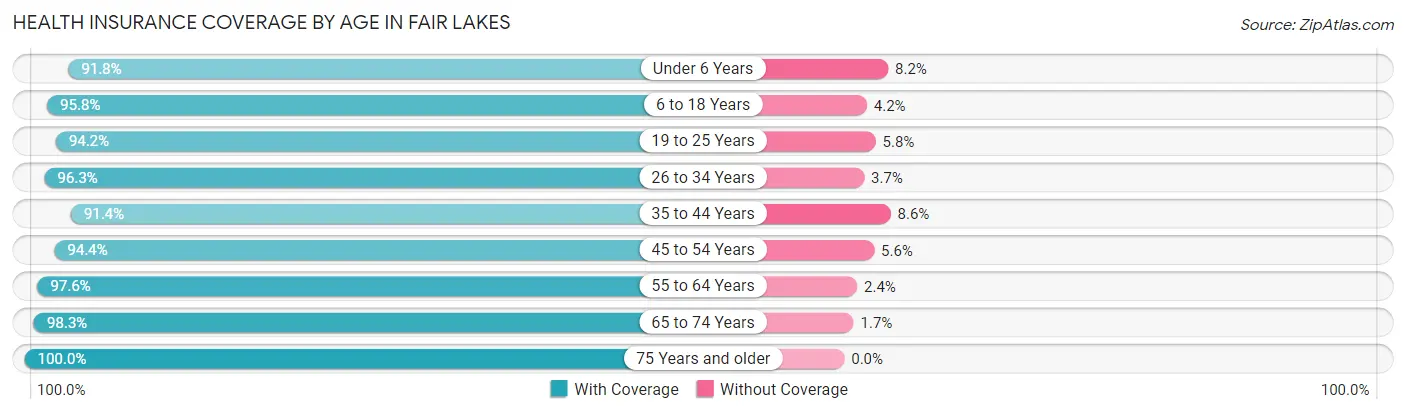
| Age Bracket | With Coverage | Without Coverage |
| Under 6 Years | 371 (91.8%) | 33 (8.2%) |
| 6 to 18 Years | 1,254 (95.8%) | 55 (4.2%) |
| 19 to 25 Years | 839 (94.2%) | 52 (5.8%) |
| 26 to 34 Years | 1,380 (96.3%) | 53 (3.7%) |
| 35 to 44 Years | 1,197 (91.4%) | 113 (8.6%) |
| 45 to 54 Years | 1,291 (94.4%) | 76 (5.6%) |
| 55 to 64 Years | 1,103 (97.6%) | 27 (2.4%) |
| 65 to 74 Years | 621 (98.3%) | 11 (1.7%) |
| 75 Years and older | 389 (100.0%) | 0 (0.0%) |
| Total | 8,445 (95.3%) | 420 (4.7%) |
Health Insurance Coverage by Citizenship Status in Fair Lakes
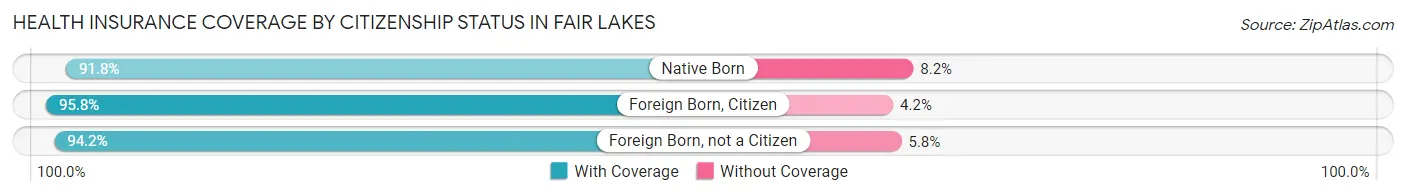
| Citizenship Status | With Coverage | Without Coverage |
| Native Born | 371 (91.8%) | 33 (8.2%) |
| Foreign Born, Citizen | 1,254 (95.8%) | 55 (4.2%) |
| Foreign Born, not a Citizen | 839 (94.2%) | 52 (5.8%) |
Health Insurance Coverage by Household Income in Fair Lakes
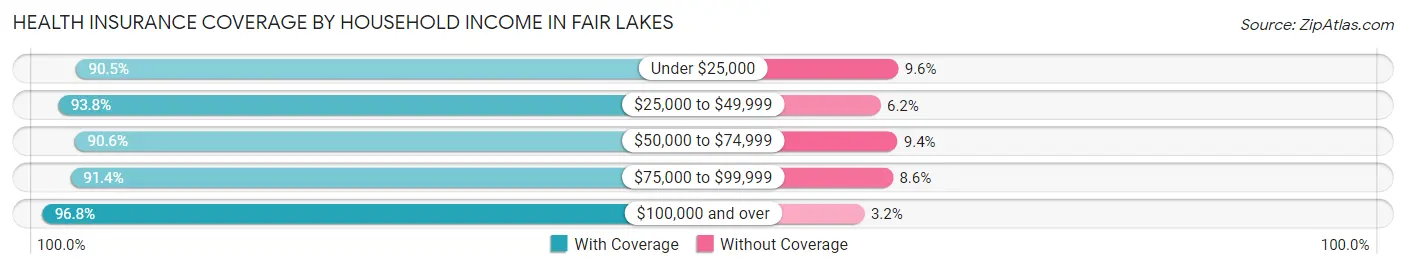
| Household Income | With Coverage | Without Coverage |
| Under $25,000 | 521 (90.4%) | 55 (9.6%) |
| $25,000 to $49,999 | 286 (93.8%) | 19 (6.2%) |
| $50,000 to $74,999 | 522 (90.6%) | 54 (9.4%) |
| $75,000 to $99,999 | 929 (91.4%) | 87 (8.6%) |
| $100,000 and over | 6,166 (96.8%) | 205 (3.2%) |
Public vs Private Health Insurance Coverage by Age in Fair Lakes
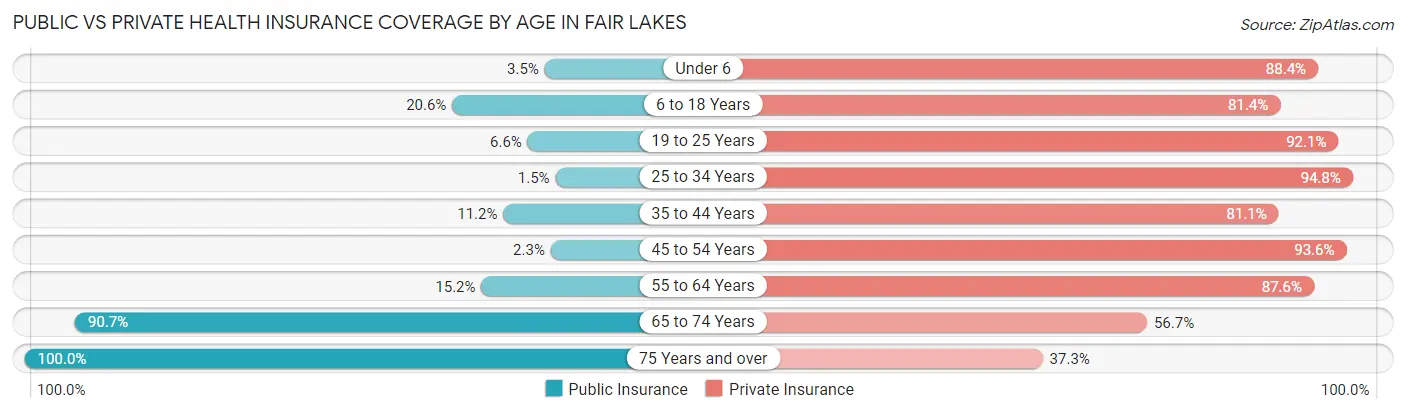
| Age Bracket | Public Insurance | Private Insurance |
| Under 6 | 14 (3.5%) | 357 (88.4%) |
| 6 to 18 Years | 270 (20.6%) | 1,065 (81.4%) |
| 19 to 25 Years | 59 (6.6%) | 821 (92.1%) |
| 25 to 34 Years | 21 (1.5%) | 1,359 (94.8%) |
| 35 to 44 Years | 146 (11.2%) | 1,062 (81.1%) |
| 45 to 54 Years | 32 (2.3%) | 1,280 (93.6%) |
| 55 to 64 Years | 172 (15.2%) | 990 (87.6%) |
| 65 to 74 Years | 573 (90.7%) | 358 (56.7%) |
| 75 Years and over | 389 (100.0%) | 145 (37.3%) |
| Total | 1,676 (18.9%) | 7,437 (83.9%) |
Disability Status by Sex by Age in Fair Lakes
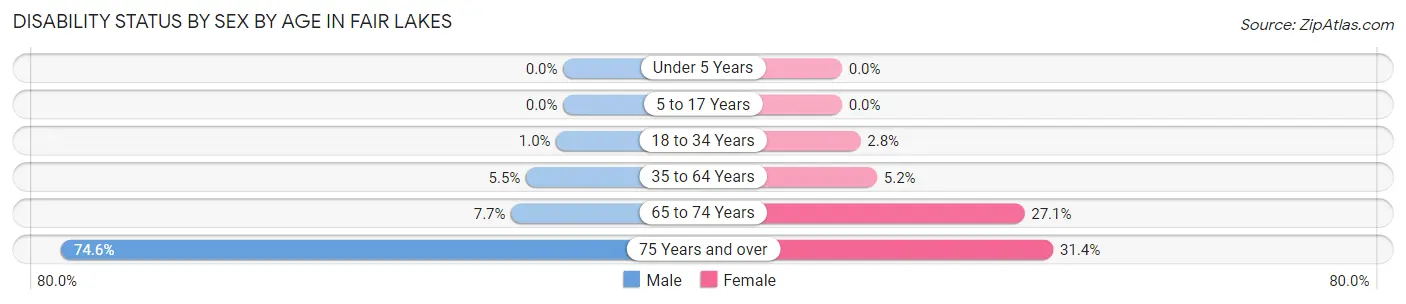
| Age Bracket | Male | Female |
| Under 5 Years | 0 (0.0%) | 0 (0.0%) |
| 5 to 17 Years | 0 (0.0%) | 0 (0.0%) |
| 18 to 34 Years | 13 (1.0%) | 32 (2.8%) |
| 35 to 64 Years | 102 (5.5%) | 102 (5.2%) |
| 65 to 74 Years | 24 (7.7%) | 87 (27.1%) |
| 75 Years and over | 176 (74.6%) | 48 (31.4%) |
Disability Class by Sex by Age in Fair Lakes
Disability Class: Hearing Difficulty
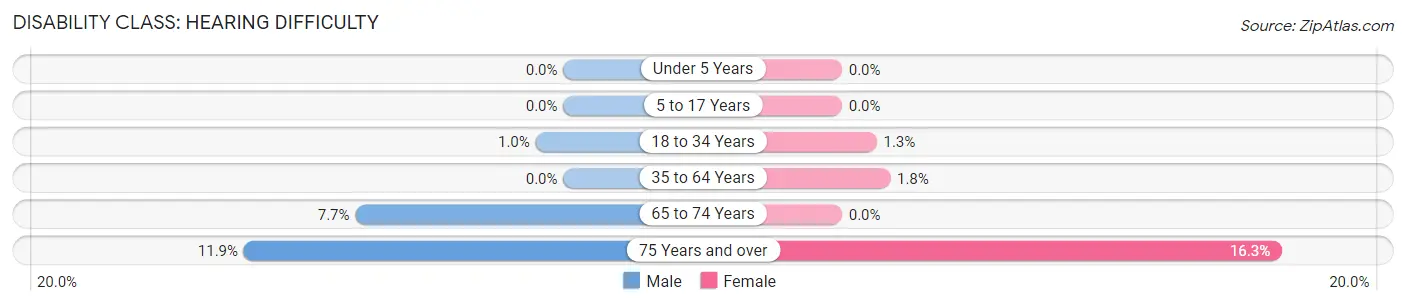
| Age Bracket | Male | Female |
| Under 5 Years | 0 (0.0%) | 0 (0.0%) |
| 5 to 17 Years | 0 (0.0%) | 0 (0.0%) |
| 18 to 34 Years | 13 (1.0%) | 15 (1.3%) |
| 35 to 64 Years | 0 (0.0%) | 35 (1.8%) |
| 65 to 74 Years | 24 (7.7%) | 0 (0.0%) |
| 75 Years and over | 28 (11.9%) | 25 (16.3%) |
Disability Class: Vision Difficulty
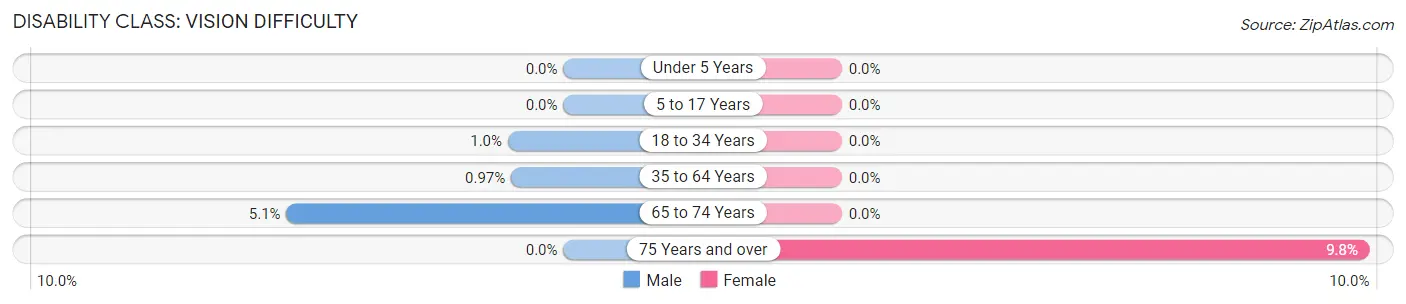
| Age Bracket | Male | Female |
| Under 5 Years | 0 (0.0%) | 0 (0.0%) |
| 5 to 17 Years | 0 (0.0%) | 0 (0.0%) |
| 18 to 34 Years | 13 (1.0%) | 0 (0.0%) |
| 35 to 64 Years | 18 (1.0%) | 0 (0.0%) |
| 65 to 74 Years | 16 (5.1%) | 0 (0.0%) |
| 75 Years and over | 0 (0.0%) | 15 (9.8%) |
Disability Class: Cognitive Difficulty
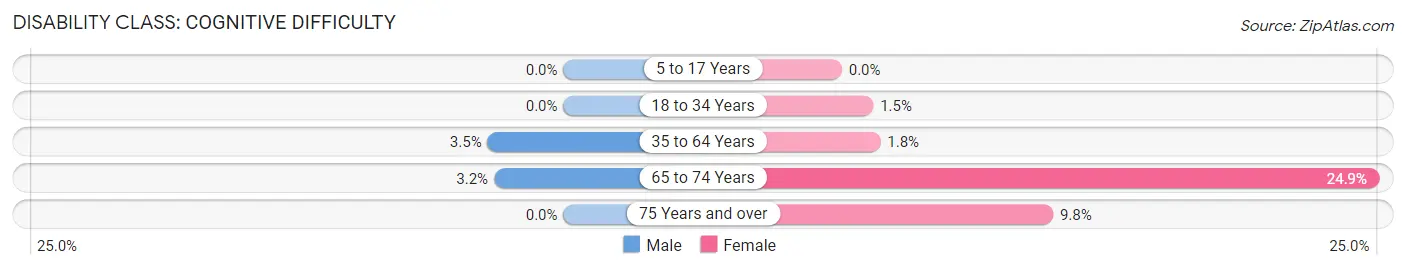
| Age Bracket | Male | Female |
| 5 to 17 Years | 0 (0.0%) | 0 (0.0%) |
| 18 to 34 Years | 0 (0.0%) | 17 (1.5%) |
| 35 to 64 Years | 65 (3.5%) | 35 (1.8%) |
| 65 to 74 Years | 10 (3.2%) | 80 (24.9%) |
| 75 Years and over | 0 (0.0%) | 15 (9.8%) |
Disability Class: Ambulatory Difficulty
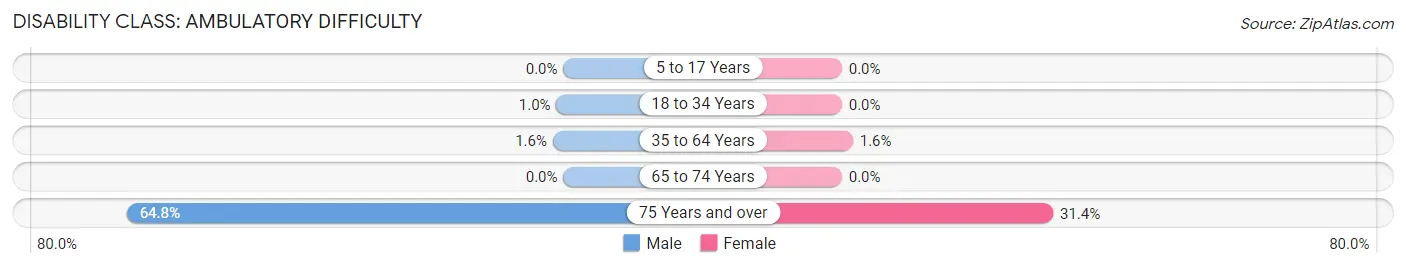
| Age Bracket | Male | Female |
| 5 to 17 Years | 0 (0.0%) | 0 (0.0%) |
| 18 to 34 Years | 13 (1.0%) | 0 (0.0%) |
| 35 to 64 Years | 29 (1.6%) | 32 (1.6%) |
| 65 to 74 Years | 0 (0.0%) | 0 (0.0%) |
| 75 Years and over | 153 (64.8%) | 48 (31.4%) |
Disability Class: Self-Care Difficulty
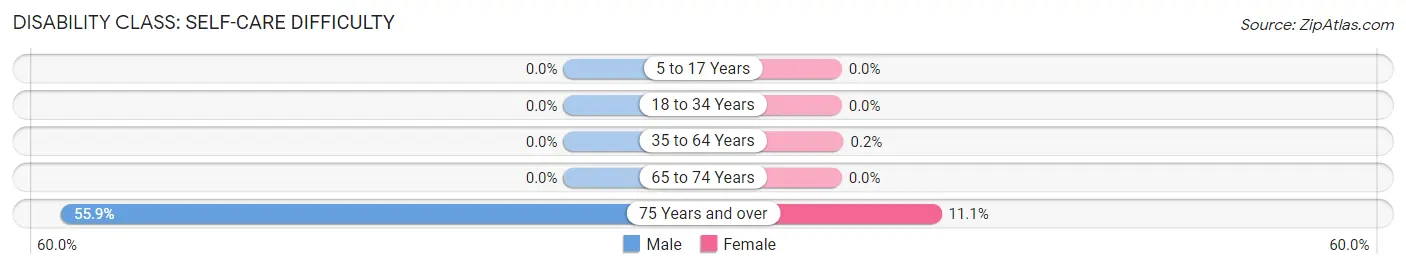
| Age Bracket | Male | Female |
| 5 to 17 Years | 0 (0.0%) | 0 (0.0%) |
| 18 to 34 Years | 0 (0.0%) | 0 (0.0%) |
| 35 to 64 Years | 0 (0.0%) | 4 (0.2%) |
| 65 to 74 Years | 0 (0.0%) | 0 (0.0%) |
| 75 Years and over | 132 (55.9%) | 17 (11.1%) |
Technology Access in Fair Lakes
Computing Device Access in Fair Lakes
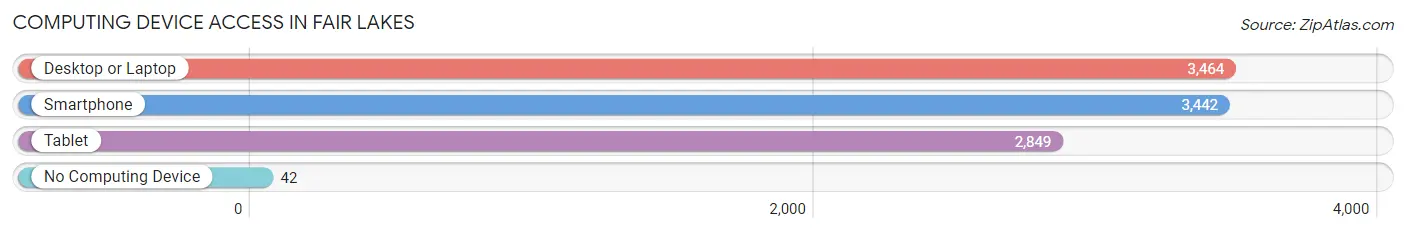
| Device Type | # Households | % Households |
| Desktop or Laptop | 3,464 | 95.7% |
| Smartphone | 3,442 | 95.1% |
| Tablet | 2,849 | 78.7% |
| No Computing Device | 42 | 1.2% |
| Total | 3,621 | 100.0% |
Internet Access in Fair Lakes
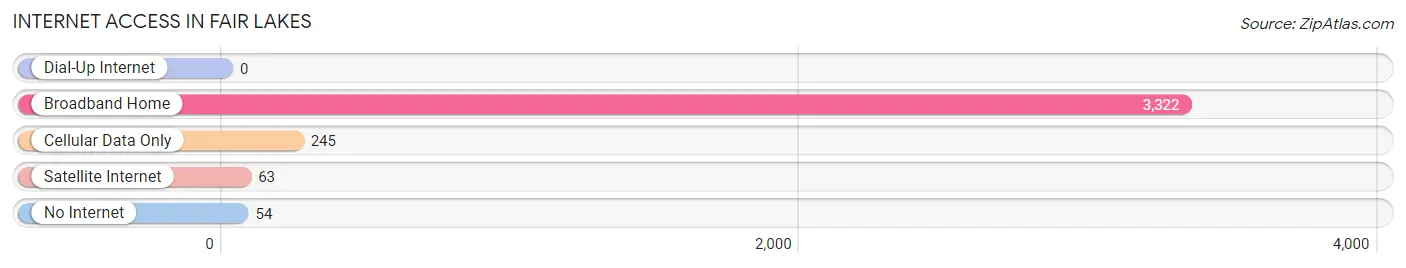
| Internet Type | # Households | % Households |
| Dial-Up Internet | 0 | 0.0% |
| Broadband Home | 3,322 | 91.7% |
| Cellular Data Only | 245 | 6.8% |
| Satellite Internet | 63 | 1.7% |
| No Internet | 54 | 1.5% |
| Total | 3,621 | 100.0% |
Fair Lakes Summary
History
Fair Lakes is a census-designated place (CDP) located in Fairfax County, Virginia. It is situated in the northern part of the county, just south of the city of Fairfax. The area was first settled in the late 1700s, when a small community of farmers and tradesmen established themselves in the area. The community was known as “Fair Lakes” due to the abundance of natural springs in the area.
In the early 1800s, the area was home to a number of small farms and businesses. The area was also home to a number of mills, which provided employment for many of the local residents. In the late 1800s, the area began to experience rapid growth as the Washington and Old Dominion Railroad (W&OD) was built through the area. This allowed for easy access to the nation’s capital and other major cities.
In the early 1900s, the area began to experience a period of rapid growth and development. The area was home to a number of new businesses, including a number of large retail stores. The area also saw the construction of a number of new homes and apartment buildings.
In the late 1900s, the area experienced a period of decline as many of the businesses and residents moved away. However, in the early 2000s, the area began to experience a period of revitalization. A number of new businesses and residential developments were built in the area, and the area began to experience a period of growth and prosperity.
Geography
Fair Lakes is located in northern Fairfax County, Virginia. It is situated just south of the city of Fairfax and is bordered by the cities of Vienna and Oakton to the west, and the towns of Herndon and Reston to the east. The area is located in the Piedmont region of Virginia, and is characterized by rolling hills and wooded areas. The area is home to a number of parks and recreational areas, including the Fairfax County Park Authority’s Fair Lakes Park.
The area is served by a number of major highways, including Interstate 66, U.S. Route 50, and Virginia State Route 7. The area is also served by a number of public transportation options, including the Fairfax Connector bus system and the Washington Metro.
Economy
Fair Lakes is home to a number of businesses and employers. The area is home to a number of large retail stores, including a Walmart Supercenter, a Target, and a Costco. The area is also home to a number of office parks, which are home to a number of corporate headquarters and other businesses.
The area is also home to a number of government agencies, including the National Geospatial-Intelligence Agency, the National Reconnaissance Office, and the National Counterterrorism Center. The area is also home to a number of technology companies, including Northrop Grumman, Booz Allen Hamilton, and Lockheed Martin.
Demographics
As of the 2010 census, the population of Fair Lakes was 16,890. The population is composed of a diverse mix of racial and ethnic backgrounds. The largest racial group is White (63.3%), followed by Asian (20.2%), African American (9.2%), and Hispanic or Latino (7.3%).
The median household income in Fair Lakes is $107,845, which is significantly higher than the national median of $60,336. The median home value in Fair Lakes is $521,400, which is significantly higher than the national median of $184,700. The area is also home to a number of highly educated residents, with over 50% of the population having a bachelor’s degree or higher.
Common Questions
What is Per Capita Income in Fair Lakes?
Per Capita income in Fair Lakes is $60,554.
What is the Median Family Income in Fair Lakes?
Median Family Income in Fair Lakes is $140,921.
What is the Median Household income in Fair Lakes?
Median Household Income in Fair Lakes is $123,387.
What is Income or Wage Gap in Fair Lakes?
Income or Wage Gap in Fair Lakes is 28.5%.
Women in Fair Lakes earn 71.5 cents for every dollar earned by a man.
What is Inequality or Gini Index in Fair Lakes?
Inequality or Gini Index in Fair Lakes is 0.37.
What is the Total Population of Fair Lakes?
Total Population of Fair Lakes is 8,918.
What is the Total Male Population of Fair Lakes?
Total Male Population of Fair Lakes is 4,501.
What is the Total Female Population of Fair Lakes?
Total Female Population of Fair Lakes is 4,417.
What is the Ratio of Males per 100 Females in Fair Lakes?
There are 101.90 Males per 100 Females in Fair Lakes.
What is the Ratio of Females per 100 Males in Fair Lakes?
There are 98.13 Females per 100 Males in Fair Lakes.
What is the Median Population Age in Fair Lakes?
Median Population Age in Fair Lakes is 38.2 Years.
What is the Average Family Size in Fair Lakes
Average Family Size in Fair Lakes is 3.0 People.
What is the Average Household Size in Fair Lakes
Average Household Size in Fair Lakes is 2.5 People.
How Large is the Labor Force in Fair Lakes?
There are 5,613 People in the Labor Forcein in Fair Lakes.
What is the Percentage of People in the Labor Force in Fair Lakes?
74.3% of People are in the Labor Force in Fair Lakes.
What is the Unemployment Rate in Fair Lakes?
Unemployment Rate in Fair Lakes is 2.7%.