Sterling, VA Map & Demographics
Sterling Map
Sterling Overview
$44,054
PER CAPITA INCOME
$128,241
AVG FAMILY INCOME
$117,699
AVG HOUSEHOLD INCOME
30.7%
WAGE / INCOME GAP [ % ]
69.3¢/ $1
WAGE / INCOME GAP [ $ ]
$10,472
FAMILY INCOME DEFICIT
0.41
INEQUALITY / GINI INDEX
31,058
TOTAL POPULATION
15,853
MALE POPULATION
15,205
FEMALE POPULATION
104.26
MALES / 100 FEMALES
95.91
FEMALES / 100 MALES
35.4
MEDIAN AGE
3.6
AVG FAMILY SIZE
3.2
AVG HOUSEHOLD SIZE
18,542
LABOR FORCE [ PEOPLE ]
75.3%
PERCENT IN LABOR FORCE
5.0%
UNEMPLOYMENT RATE
Income in Sterling
Income Overview in Sterling
Per Capita Income in Sterling is $44,054, while median incomes of families and households are $128,241 and $117,699 respectively.
| Characteristic | Number | Measure |
| Per Capita Income | 31,058 | $44,054 |
| Median Family Income | 7,240 | $128,241 |
| Mean Family Income | 7,240 | $137,703 |
| Median Household Income | 9,659 | $117,699 |
| Mean Household Income | 9,659 | $137,743 |
| Income Deficit | 7,240 | $10,472 |
| Wage / Income Gap (%) | 31,058 | 30.73% |
| Wage / Income Gap ($) | 31,058 | 69.27¢ per $1 |
| Gini / Inequality Index | 31,058 | 0.41 |
Earnings by Sex in Sterling
Average Earnings in Sterling are $43,659, $51,161 for men and $35,438 for women, a difference of 30.7%.
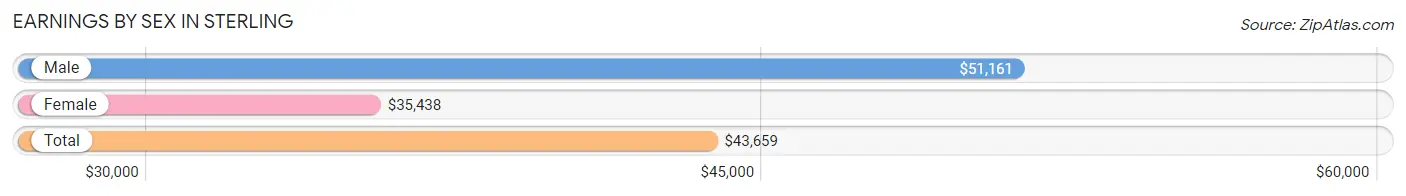
| Sex | Number | Average Earnings |
| Male | 10,629 (56.2%) | $51,161 |
| Female | 8,269 (43.8%) | $35,438 |
| Total | 18,898 (100.0%) | $43,659 |
Earnings by Sex by Income Bracket in Sterling
The most common earnings brackets in Sterling are $100,000+ for men (2,667 | 25.1%) and $100,000+ for women (1,091 | 13.2%).
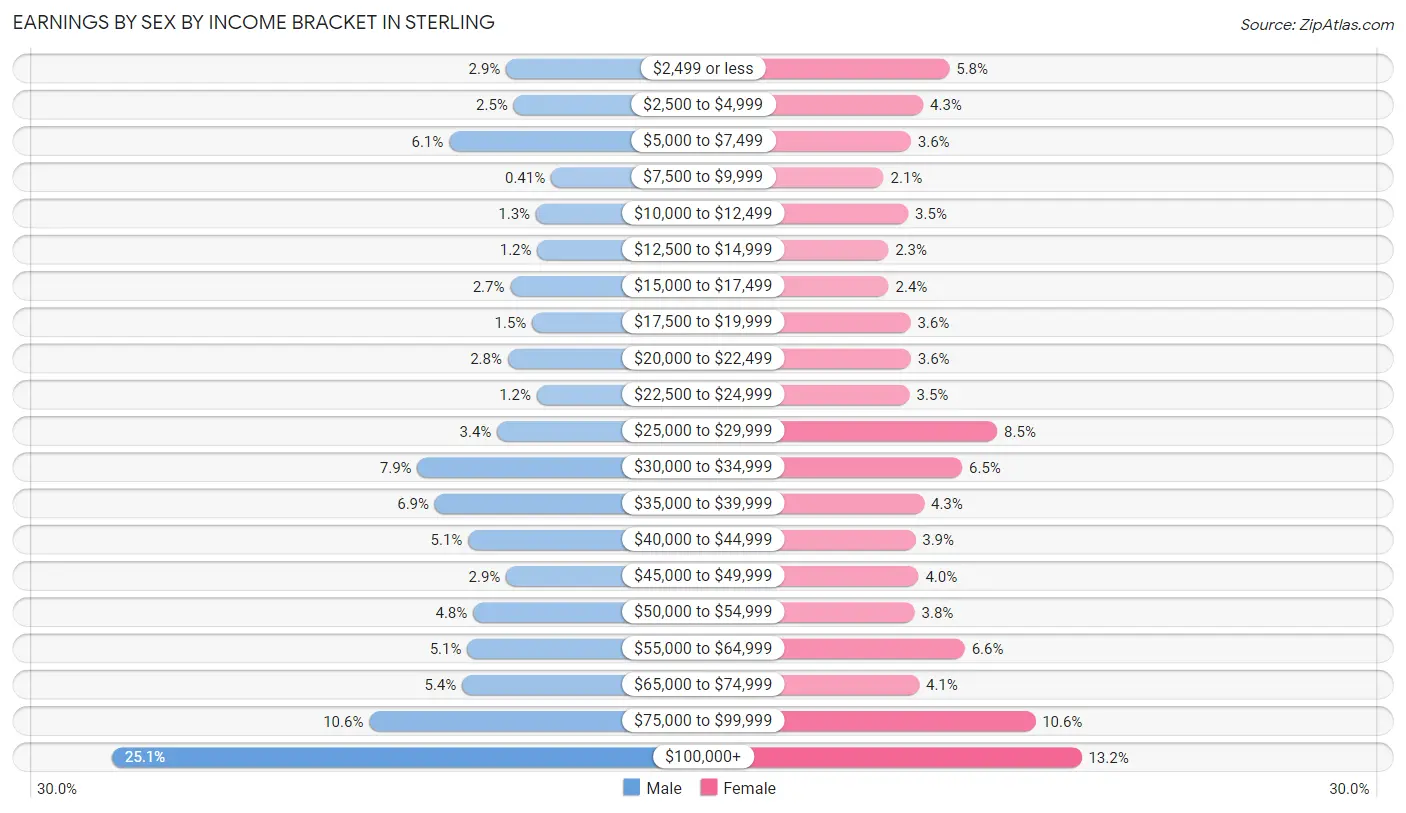
| Income | Male | Female |
| $2,499 or less | 311 (2.9%) | 476 (5.8%) |
| $2,500 to $4,999 | 267 (2.5%) | 355 (4.3%) |
| $5,000 to $7,499 | 653 (6.1%) | 298 (3.6%) |
| $7,500 to $9,999 | 44 (0.4%) | 171 (2.1%) |
| $10,000 to $12,499 | 134 (1.3%) | 285 (3.5%) |
| $12,500 to $14,999 | 125 (1.2%) | 193 (2.3%) |
| $15,000 to $17,499 | 287 (2.7%) | 194 (2.4%) |
| $17,500 to $19,999 | 156 (1.5%) | 296 (3.6%) |
| $20,000 to $22,499 | 302 (2.8%) | 298 (3.6%) |
| $22,500 to $24,999 | 129 (1.2%) | 292 (3.5%) |
| $25,000 to $29,999 | 366 (3.4%) | 699 (8.5%) |
| $30,000 to $34,999 | 842 (7.9%) | 536 (6.5%) |
| $35,000 to $39,999 | 738 (6.9%) | 359 (4.3%) |
| $40,000 to $44,999 | 539 (5.1%) | 318 (3.8%) |
| $45,000 to $49,999 | 311 (2.9%) | 333 (4.0%) |
| $50,000 to $54,999 | 509 (4.8%) | 315 (3.8%) |
| $55,000 to $64,999 | 544 (5.1%) | 548 (6.6%) |
| $65,000 to $74,999 | 575 (5.4%) | 336 (4.1%) |
| $75,000 to $99,999 | 1,130 (10.6%) | 876 (10.6%) |
| $100,000+ | 2,667 (25.1%) | 1,091 (13.2%) |
| Total | 10,629 (100.0%) | 8,269 (100.0%) |
Earnings by Sex by Educational Attainment in Sterling
Average earnings in Sterling are $63,598 for men and $44,792 for women, a difference of 29.6%. Men with an educational attainment of graduate degree enjoy the highest average annual earnings of $140,450, while those with high school diploma education earn the least with $43,202. Women with an educational attainment of graduate degree earn the most with the average annual earnings of $80,711, while those with less than high school education have the smallest earnings of $30,818.
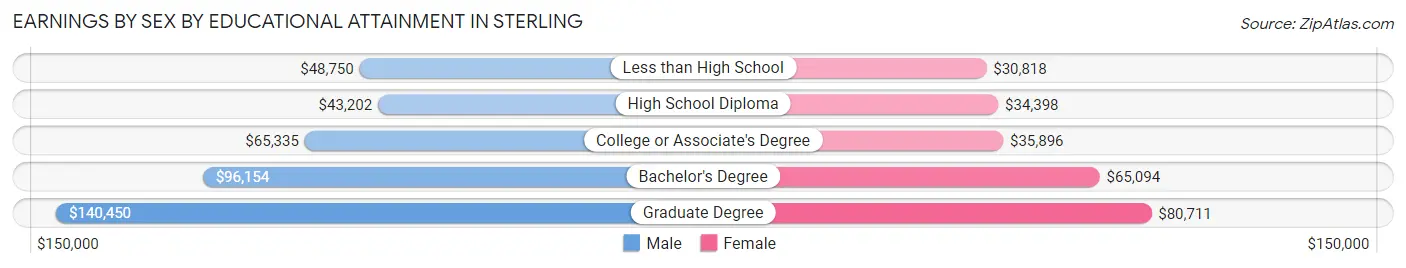
| Educational Attainment | Male Income | Female Income |
| Less than High School | $48,750 | $30,818 |
| High School Diploma | $43,202 | $34,398 |
| College or Associate's Degree | $65,335 | $35,896 |
| Bachelor's Degree | $96,154 | $65,094 |
| Graduate Degree | $140,450 | $80,711 |
| Total | $63,598 | $44,792 |
Family Income in Sterling
Family Income Brackets in Sterling
According to the Sterling family income data, there are 1,557 families falling into the $200,000+ income range, which is the most common income bracket and makes up 21.5% of all families. Conversely, the $10,000 to $14,999 income bracket is the least frequent group with only 22 families (0.3%) belonging to this category.
| Income Bracket | # Families | % Families |
| Less than $10,000 | 217 | 3.0% |
| $10,000 to $14,999 | 22 | 0.3% |
| $15,000 to $24,999 | 355 | 4.9% |
| $25,000 to $34,999 | 210 | 2.9% |
| $35,000 to $49,999 | 485 | 6.7% |
| $50,000 to $74,999 | 717 | 9.9% |
| $75,000 to $99,999 | 891 | 12.3% |
| $100,000 to $149,999 | 1,339 | 18.5% |
| $150,000 to $199,999 | 1,448 | 20.0% |
| $200,000+ | 1,557 | 21.5% |
Family Income by Famaliy Size in Sterling
7+ person families (388 | 5.4%) account for the highest median family income in Sterling with $151,810 per family, while 2-person families (2,314 | 32.0%) have the highest median income of $53,820 per family member.
| Income Bracket | # Families | Median Income |
| 2-Person Families | 2,314 (32.0%) | $107,639 |
| 3-Person Families | 1,727 (23.8%) | $129,871 |
| 4-Person Families | 1,403 (19.4%) | $150,694 |
| 5-Person Families | 929 (12.8%) | $122,750 |
| 6-Person Families | 479 (6.6%) | $150,815 |
| 7+ Person Families | 388 (5.4%) | $151,810 |
| Total | 7,240 (100.0%) | $128,241 |
Family Income by Number of Earners in Sterling
The median family income in Sterling is $128,241, with families comprising 3+ earners (1,894) having the highest median family income of $151,189, while families with no earners (395) have the lowest median family income of $42,257, accounting for 26.2% and 5.5% of families, respectively.
| Number of Earners | # Families | Median Income |
| No Earners | 395 (5.5%) | $42,257 |
| 1 Earner | 1,657 (22.9%) | $72,569 |
| 2 Earners | 3,294 (45.5%) | $150,857 |
| 3+ Earners | 1,894 (26.2%) | $151,189 |
| Total | 7,240 (100.0%) | $128,241 |
Household Income in Sterling
Household Income Brackets in Sterling
With 2,057 households falling in the category, the $100,000 to $149,999 income range is the most frequent in Sterling, accounting for 21.3% of all households. In contrast, only 19 households (0.2%) fall into the $10,000 to $14,999 income bracket, making it the least populous group.
| Income Bracket | # Households | % Households |
| Less than $10,000 | 309 | 3.2% |
| $10,000 to $14,999 | 19 | 0.2% |
| $15,000 to $24,999 | 348 | 3.6% |
| $25,000 to $34,999 | 560 | 5.8% |
| $35,000 to $49,999 | 821 | 8.5% |
| $50,000 to $74,999 | 937 | 9.7% |
| $75,000 to $99,999 | 1,091 | 11.3% |
| $100,000 to $149,999 | 2,057 | 21.3% |
| $150,000 to $199,999 | 1,700 | 17.6% |
| $200,000+ | 1,826 | 18.9% |
Household Income by Householder Age in Sterling
The median household income in Sterling is $117,699, with the highest median household income of $137,112 found in the 45 to 64 years age bracket for the primary householder. A total of 3,692 households (38.2%) fall into this category. Meanwhile, the 65+ years age bracket for the primary householder has the lowest median household income of $45,000, with 1,872 households (19.4%) in this group.
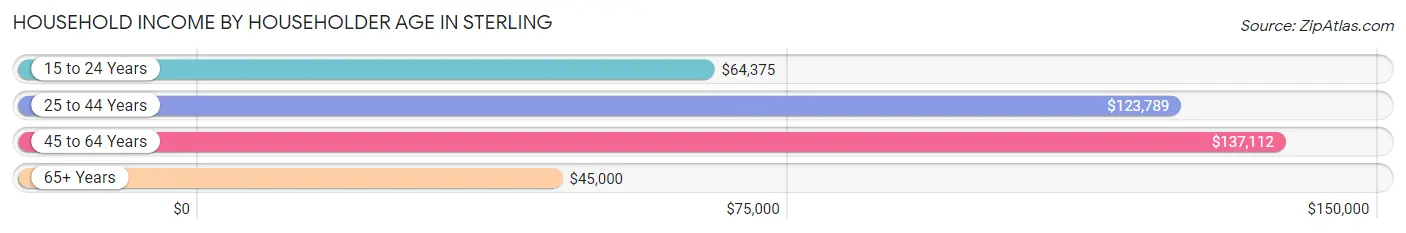
| Income Bracket | # Households | Median Income |
| 15 to 24 Years | 208 (2.1%) | $64,375 |
| 25 to 44 Years | 3,887 (40.2%) | $123,789 |
| 45 to 64 Years | 3,692 (38.2%) | $137,112 |
| 65+ Years | 1,872 (19.4%) | $45,000 |
| Total | 9,659 (100.0%) | $117,699 |
Poverty in Sterling
Income Below Poverty by Sex and Age in Sterling
With 6.7% poverty level for males and 8.1% for females among the residents of Sterling, 15 year old males and 16 and 17 year old females are the most vulnerable to poverty, with 69 males (32.9%) and 150 females (30.0%) in their respective age groups living below the poverty level.
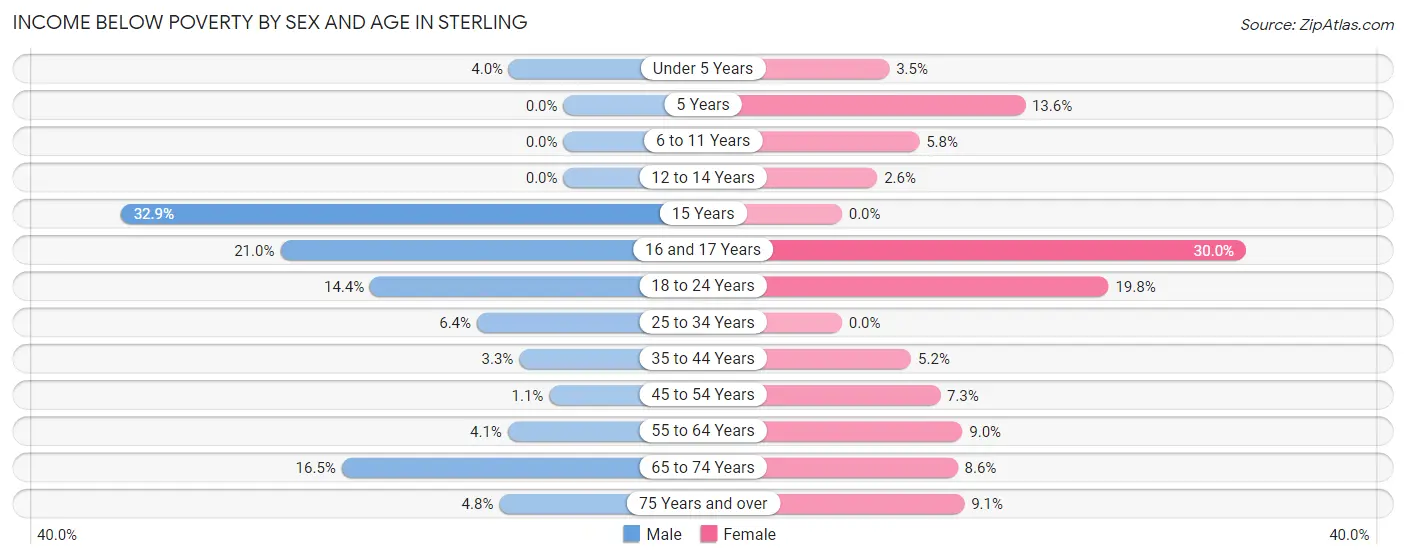
| Age Bracket | Male | Female |
| Under 5 Years | 51 (4.0%) | 33 (3.5%) |
| 5 Years | 0 (0.0%) | 34 (13.6%) |
| 6 to 11 Years | 0 (0.0%) | 87 (5.8%) |
| 12 to 14 Years | 0 (0.0%) | 9 (2.6%) |
| 15 Years | 69 (32.9%) | 0 (0.0%) |
| 16 and 17 Years | 115 (21.0%) | 150 (30.0%) |
| 18 to 24 Years | 247 (14.3%) | 350 (19.8%) |
| 25 to 34 Years | 154 (6.4%) | 0 (0.0%) |
| 35 to 44 Years | 92 (3.3%) | 133 (5.1%) |
| 45 to 54 Years | 17 (1.1%) | 154 (7.3%) |
| 55 to 64 Years | 69 (4.1%) | 150 (8.9%) |
| 65 to 74 Years | 215 (16.5%) | 76 (8.6%) |
| 75 Years and over | 22 (4.8%) | 55 (9.1%) |
| Total | 1,051 (6.7%) | 1,231 (8.1%) |
Income Above Poverty by Sex and Age in Sterling
According to the poverty statistics in Sterling, males aged 5 years and females aged 15 years are the age groups that are most secure financially, with 100.0% of males and 100.0% of females in these age groups living above the poverty line.
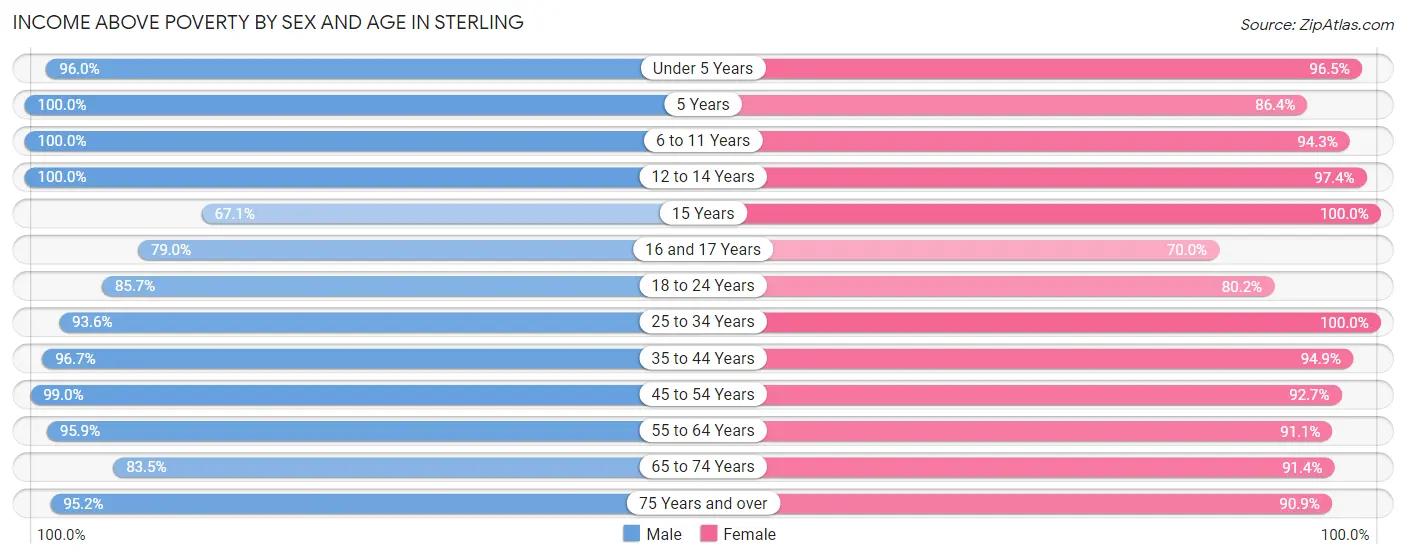
| Age Bracket | Male | Female |
| Under 5 Years | 1,210 (96.0%) | 905 (96.5%) |
| 5 Years | 216 (100.0%) | 216 (86.4%) |
| 6 to 11 Years | 926 (100.0%) | 1,426 (94.3%) |
| 12 to 14 Years | 584 (100.0%) | 333 (97.4%) |
| 15 Years | 141 (67.1%) | 37 (100.0%) |
| 16 and 17 Years | 432 (79.0%) | 350 (70.0%) |
| 18 to 24 Years | 1,474 (85.7%) | 1,418 (80.2%) |
| 25 to 34 Years | 2,245 (93.6%) | 1,921 (100.0%) |
| 35 to 44 Years | 2,715 (96.7%) | 2,448 (94.9%) |
| 45 to 54 Years | 1,607 (99.0%) | 1,959 (92.7%) |
| 55 to 64 Years | 1,601 (95.9%) | 1,526 (91.0%) |
| 65 to 74 Years | 1,091 (83.5%) | 808 (91.4%) |
| 75 Years and over | 440 (95.2%) | 550 (90.9%) |
| Total | 14,682 (93.3%) | 13,897 (91.9%) |
Income Below Poverty Among Married-Couple Families in Sterling
The poverty statistics for married-couple families in Sterling show that 3.1% or 167 of the total 5,465 families live below the poverty line. Families with no children have the highest poverty rate of 6.2%, comprising of 167 families. On the other hand, families with 1 or 2 children have the lowest poverty rate of 0.0%, which includes 0 families.
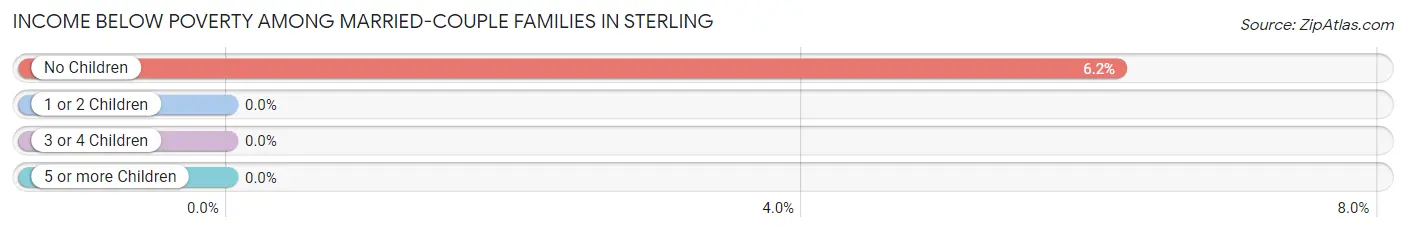
| Children | Above Poverty | Below Poverty |
| No Children | 2,531 (93.8%) | 167 (6.2%) |
| 1 or 2 Children | 2,069 (100.0%) | 0 (0.0%) |
| 3 or 4 Children | 651 (100.0%) | 0 (0.0%) |
| 5 or more Children | 47 (100.0%) | 0 (0.0%) |
| Total | 5,298 (96.9%) | 167 (3.1%) |
Income Below Poverty Among Single-Parent Households in Sterling
According to the poverty data in Sterling, 18.6% or 133 single-father households and 24.3% or 257 single-mother households are living below the poverty line. Among single-father households, those with 1 or 2 children have the highest poverty rate, with 74 households (25.4%) experiencing poverty. Likewise, among single-mother households, those with 1 or 2 children have the highest poverty rate, with 193 households (33.5%) falling below the poverty line.
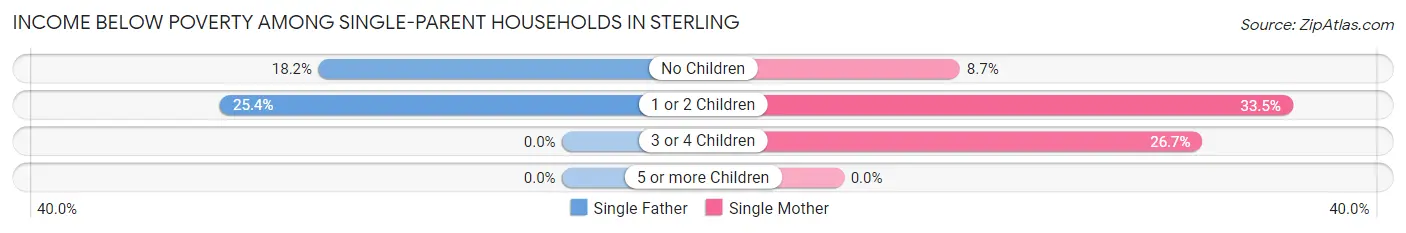
| Children | Single Father | Single Mother |
| No Children | 59 (18.1%) | 29 (8.7%) |
| 1 or 2 Children | 74 (25.4%) | 193 (33.5%) |
| 3 or 4 Children | 0 (0.0%) | 35 (26.7%) |
| 5 or more Children | 0 (0.0%) | 0 (0.0%) |
| Total | 133 (18.6%) | 257 (24.3%) |
Income Below Poverty Among Married-Couple vs Single-Parent Households in Sterling
The poverty data for Sterling shows that 167 of the married-couple family households (3.1%) and 390 of the single-parent households (22.0%) are living below the poverty level. Within the married-couple family households, those with no children have the highest poverty rate, with 167 households (6.2%) falling below the poverty line. Among the single-parent households, those with 1 or 2 children have the highest poverty rate, with 267 household (30.8%) living below poverty.
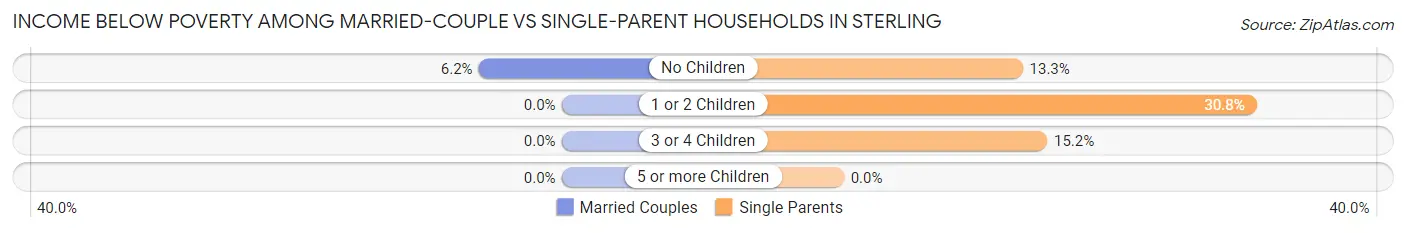
| Children | Married-Couple Families | Single-Parent Households |
| No Children | 167 (6.2%) | 88 (13.3%) |
| 1 or 2 Children | 0 (0.0%) | 267 (30.8%) |
| 3 or 4 Children | 0 (0.0%) | 35 (15.1%) |
| 5 or more Children | 0 (0.0%) | 0 (0.0%) |
| Total | 167 (3.1%) | 390 (22.0%) |
Race in Sterling
The most populous races in Sterling are Hispanic or Latino (14,614 | 47.0%), White / Caucasian (13,049 | 42.0%), and Some other Race (6,861 | 22.1%).
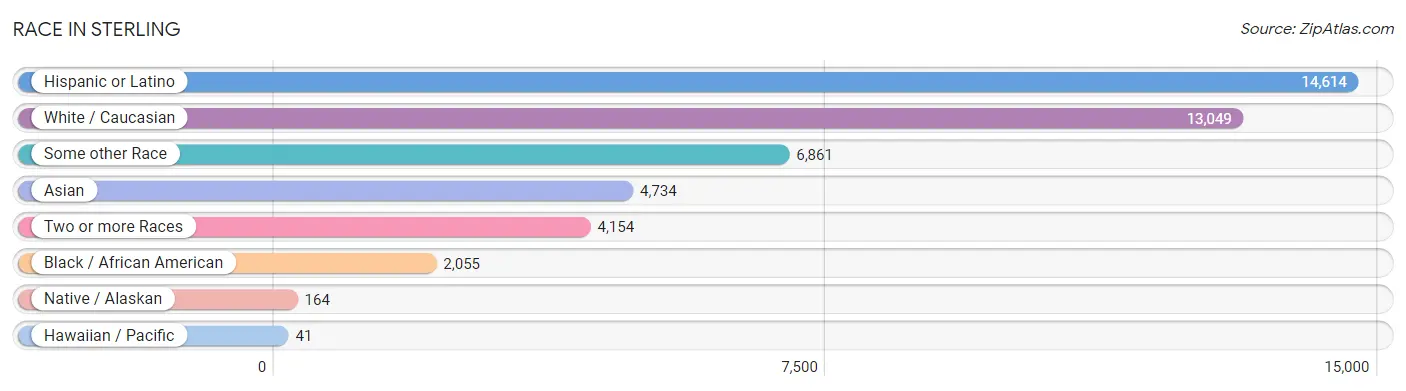
| Race | # Population | % Population |
| Asian | 4,734 | 15.2% |
| Black / African American | 2,055 | 6.6% |
| Hawaiian / Pacific | 41 | 0.1% |
| Hispanic or Latino | 14,614 | 47.0% |
| Native / Alaskan | 164 | 0.5% |
| White / Caucasian | 13,049 | 42.0% |
| Two or more Races | 4,154 | 13.4% |
| Some other Race | 6,861 | 22.1% |
| Total | 31,058 | 100.0% |
Ancestry in Sterling
The most populous ancestries reported in Sterling are Central American (9,071 | 29.2%), Salvadoran (6,187 | 19.9%), South American (2,754 | 8.9%), German (1,865 | 6.0%), and Irish (1,569 | 5.1%), together accounting for 69.1% of all Sterling residents.
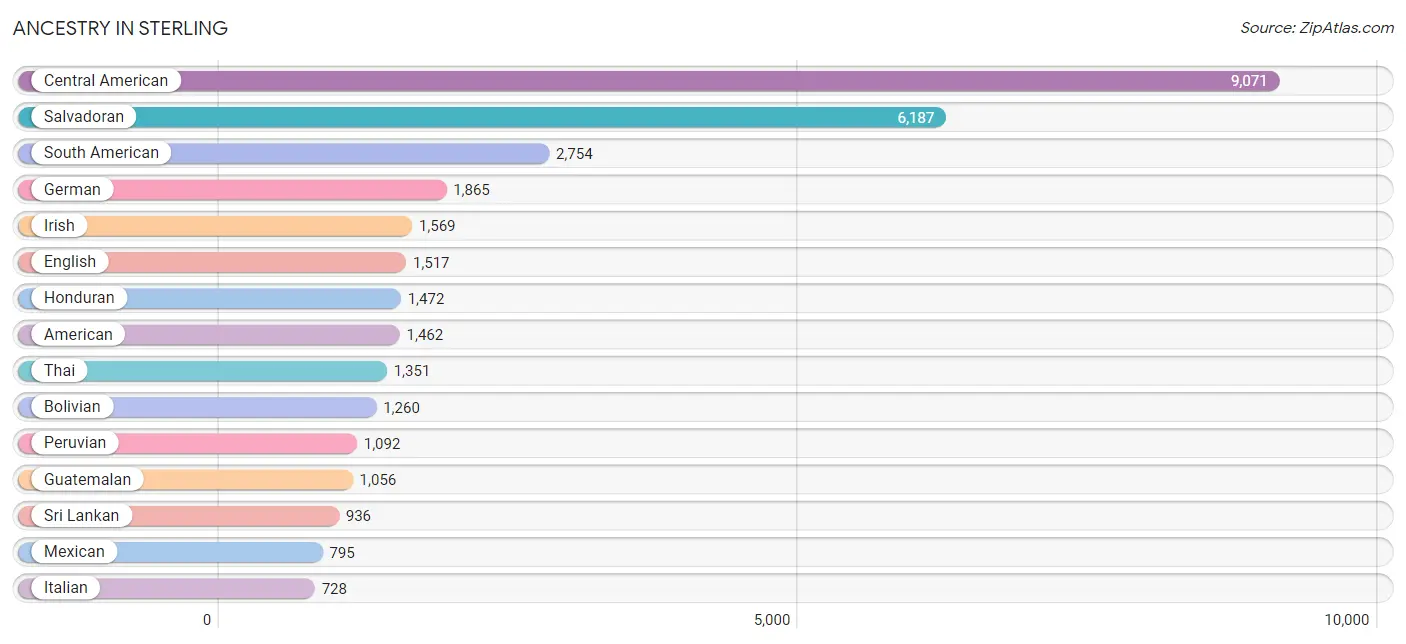
| Ancestry | # Population | % Population |
| Afghan | 20 | 0.1% |
| African | 50 | 0.2% |
| American | 1,462 | 4.7% |
| Arab | 605 | 1.9% |
| Argentinean | 12 | 0.0% |
| Australian | 88 | 0.3% |
| Austrian | 9 | 0.0% |
| Belgian | 39 | 0.1% |
| Belizean | 1 | 0.0% |
| Bhutanese | 179 | 0.6% |
| Bolivian | 1,260 | 4.1% |
| British | 210 | 0.7% |
| Bulgarian | 110 | 0.4% |
| Burmese | 66 | 0.2% |
| Cambodian | 56 | 0.2% |
| Canadian | 15 | 0.1% |
| Central American | 9,071 | 29.2% |
| Cherokee | 25 | 0.1% |
| Chilean | 12 | 0.0% |
| Choctaw | 12 | 0.0% |
| Colombian | 30 | 0.1% |
| Costa Rican | 45 | 0.1% |
| Croatian | 51 | 0.2% |
| Cuban | 103 | 0.3% |
| Czech | 3 | 0.0% |
| Czechoslovakian | 31 | 0.1% |
| Danish | 25 | 0.1% |
| Dominican | 91 | 0.3% |
| Dutch | 114 | 0.4% |
| Eastern European | 50 | 0.2% |
| Ecuadorian | 306 | 1.0% |
| Egyptian | 45 | 0.1% |
| English | 1,517 | 4.9% |
| Ethiopian | 14 | 0.1% |
| European | 511 | 1.7% |
| Filipino | 44 | 0.1% |
| Finnish | 12 | 0.0% |
| French | 384 | 1.2% |
| French Canadian | 57 | 0.2% |
| German | 1,865 | 6.0% |
| Ghanaian | 15 | 0.1% |
| Greek | 168 | 0.5% |
| Guatemalan | 1,056 | 3.4% |
| Honduran | 1,472 | 4.7% |
| Hungarian | 38 | 0.1% |
| Indian (Asian) | 379 | 1.2% |
| Indonesian | 26 | 0.1% |
| Iranian | 65 | 0.2% |
| Irish | 1,569 | 5.1% |
| Iroquois | 10 | 0.0% |
| Italian | 728 | 2.3% |
| Jamaican | 37 | 0.1% |
| Japanese | 49 | 0.2% |
| Korean | 464 | 1.5% |
| Laotian | 18 | 0.1% |
| Lebanese | 269 | 0.9% |
| Liberian | 23 | 0.1% |
| Lithuanian | 7 | 0.0% |
| Malaysian | 55 | 0.2% |
| Mexican | 795 | 2.6% |
| Mexican American Indian | 38 | 0.1% |
| Native Hawaiian | 52 | 0.2% |
| Navajo | 8 | 0.0% |
| Nicaraguan | 293 | 0.9% |
| Nigerian | 56 | 0.2% |
| Northern European | 12 | 0.0% |
| Norwegian | 136 | 0.4% |
| Pakistani | 60 | 0.2% |
| Peruvian | 1,092 | 3.5% |
| Polish | 278 | 0.9% |
| Portuguese | 28 | 0.1% |
| Pueblo | 8 | 0.0% |
| Puerto Rican | 300 | 1.0% |
| Romanian | 10 | 0.0% |
| Russian | 22 | 0.1% |
| Salvadoran | 6,187 | 19.9% |
| Scandinavian | 72 | 0.2% |
| Scotch-Irish | 94 | 0.3% |
| Scottish | 235 | 0.8% |
| Slavic | 5 | 0.0% |
| Slovak | 14 | 0.1% |
| Slovene | 13 | 0.0% |
| South African | 28 | 0.1% |
| South American | 2,754 | 8.9% |
| South American Indian | 41 | 0.1% |
| Spaniard | 60 | 0.2% |
| Spanish | 48 | 0.2% |
| Sri Lankan | 936 | 3.0% |
| Subsaharan African | 337 | 1.1% |
| Swedish | 128 | 0.4% |
| Swiss | 35 | 0.1% |
| Thai | 1,351 | 4.3% |
| Trinidadian and Tobagonian | 146 | 0.5% |
| Turkish | 9 | 0.0% |
| Ukrainian | 56 | 0.2% |
| Uruguayan | 17 | 0.1% |
| Venezuelan | 25 | 0.1% |
| Vietnamese | 313 | 1.0% |
| Welsh | 125 | 0.4% |
| West Indian | 7 | 0.0% |
| Yugoslavian | 20 | 0.1% | View All 101 Rows |
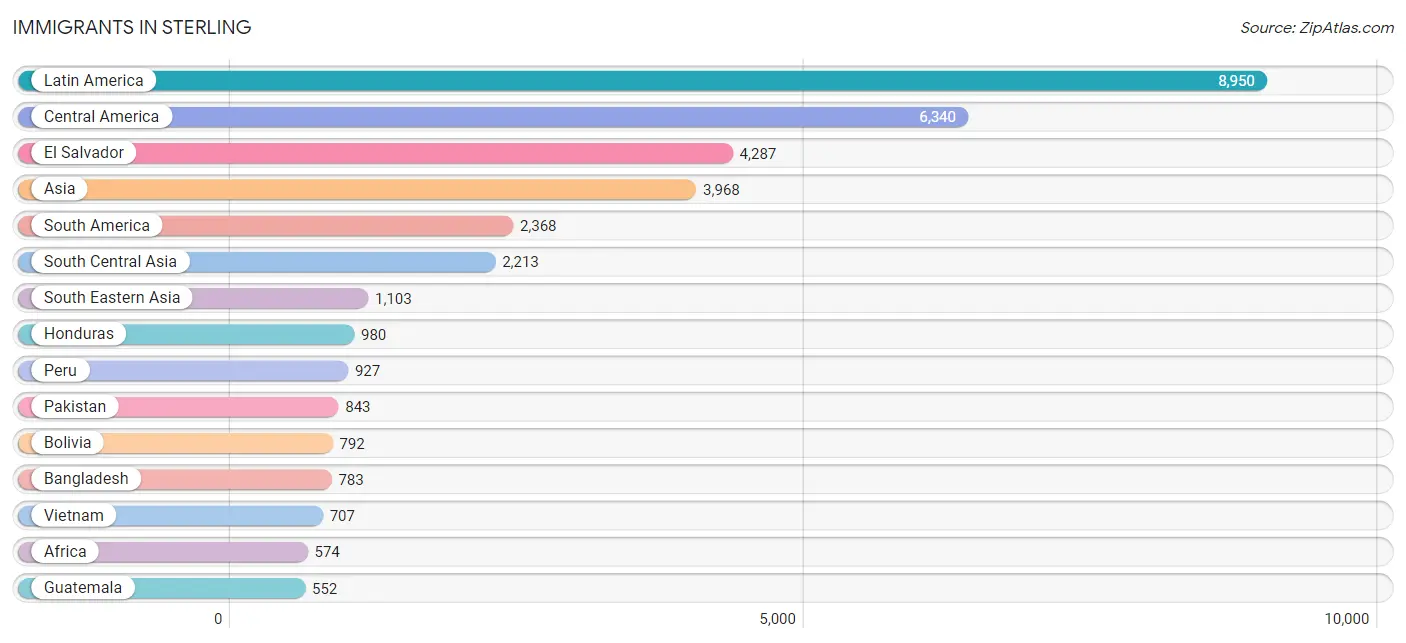
Immigrants in Sterling
The most numerous immigrant groups reported in Sterling came from Latin America (8,950 | 28.8%), Central America (6,340 | 20.4%), El Salvador (4,287 | 13.8%), Asia (3,968 | 12.8%), and South America (2,368 | 7.6%), together accounting for 83.4% of all Sterling residents.
| Immigration Origin | # Population | % Population |
| Afghanistan | 87 | 0.3% |
| Africa | 574 | 1.8% |
| Argentina | 70 | 0.2% |
| Asia | 3,968 | 12.8% |
| Australia | 8 | 0.0% |
| Bangladesh | 783 | 2.5% |
| Belize | 1 | 0.0% |
| Bolivia | 792 | 2.5% |
| Bosnia and Herzegovina | 20 | 0.1% |
| Bulgaria | 45 | 0.1% |
| Cambodia | 24 | 0.1% |
| Canada | 33 | 0.1% |
| Caribbean | 242 | 0.8% |
| Central America | 6,340 | 20.4% |
| Chile | 12 | 0.0% |
| China | 251 | 0.8% |
| Colombia | 268 | 0.9% |
| Costa Rica | 23 | 0.1% |
| Dominica | 41 | 0.1% |
| Dominican Republic | 19 | 0.1% |
| Eastern Africa | 80 | 0.3% |
| Eastern Asia | 433 | 1.4% |
| Eastern Europe | 186 | 0.6% |
| Ecuador | 117 | 0.4% |
| Egypt | 44 | 0.1% |
| El Salvador | 4,287 | 13.8% |
| Ethiopia | 80 | 0.3% |
| Europe | 341 | 1.1% |
| France | 17 | 0.1% |
| Germany | 61 | 0.2% |
| Ghana | 100 | 0.3% |
| Guatemala | 552 | 1.8% |
| Guyana | 28 | 0.1% |
| Honduras | 980 | 3.2% |
| Hong Kong | 15 | 0.1% |
| India | 453 | 1.5% |
| Indonesia | 8 | 0.0% |
| Iran | 47 | 0.2% |
| Ireland | 31 | 0.1% |
| Jamaica | 37 | 0.1% |
| Japan | 83 | 0.3% |
| Korea | 55 | 0.2% |
| Laos | 28 | 0.1% |
| Latin America | 8,950 | 28.8% |
| Lebanon | 169 | 0.5% |
| Lithuania | 74 | 0.2% |
| Mexico | 360 | 1.2% |
| Netherlands | 8 | 0.0% |
| Nicaragua | 101 | 0.3% |
| Nigeria | 42 | 0.1% |
| Northern Africa | 255 | 0.8% |
| Northern Europe | 69 | 0.2% |
| Oceania | 8 | 0.0% |
| Pakistan | 843 | 2.7% |
| Panama | 36 | 0.1% |
| Peru | 927 | 3.0% |
| Philippines | 285 | 0.9% |
| Poland | 15 | 0.1% |
| South Africa | 36 | 0.1% |
| South America | 2,368 | 7.6% |
| South Central Asia | 2,213 | 7.1% |
| South Eastern Asia | 1,103 | 3.5% |
| Taiwan | 31 | 0.1% |
| Thailand | 25 | 0.1% |
| Trinidad and Tobago | 145 | 0.5% |
| Turkey | 9 | 0.0% |
| Ukraine | 32 | 0.1% |
| Uruguay | 10 | 0.0% |
| Venezuela | 144 | 0.5% |
| Vietnam | 707 | 2.3% |
| Western Africa | 203 | 0.6% |
| Western Asia | 219 | 0.7% |
| Western Europe | 86 | 0.3% | View All 73 Rows |
Sex and Age in Sterling
Sex and Age in Sterling
The most populous age groups in Sterling are 35 to 39 Years (1,477 | 9.3%) for men and 20 to 24 Years (1,446 | 9.5%) for women.
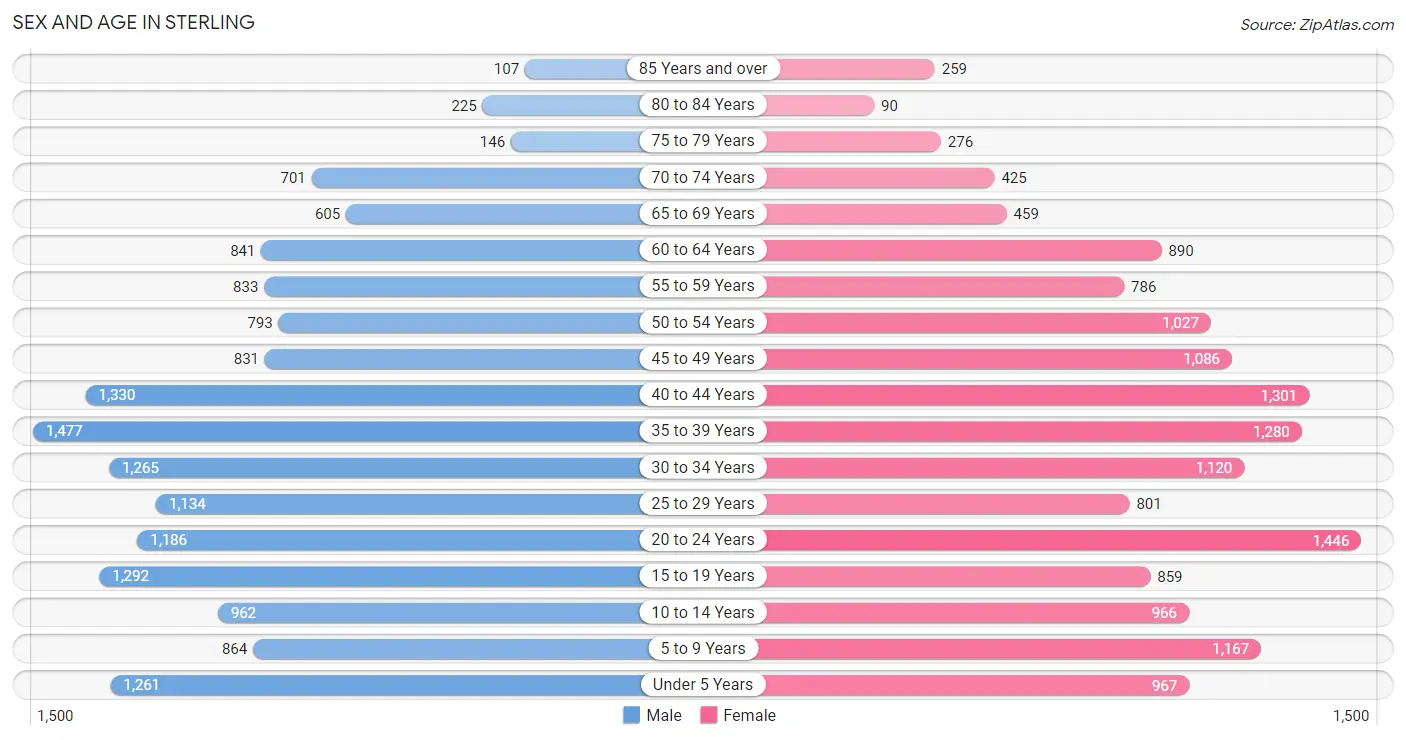
| Age Bracket | Male | Female |
| Under 5 Years | 1,261 (8.0%) | 967 (6.4%) |
| 5 to 9 Years | 864 (5.4%) | 1,167 (7.7%) |
| 10 to 14 Years | 962 (6.1%) | 966 (6.4%) |
| 15 to 19 Years | 1,292 (8.2%) | 859 (5.7%) |
| 20 to 24 Years | 1,186 (7.5%) | 1,446 (9.5%) |
| 25 to 29 Years | 1,134 (7.1%) | 801 (5.3%) |
| 30 to 34 Years | 1,265 (8.0%) | 1,120 (7.4%) |
| 35 to 39 Years | 1,477 (9.3%) | 1,280 (8.4%) |
| 40 to 44 Years | 1,330 (8.4%) | 1,301 (8.6%) |
| 45 to 49 Years | 831 (5.2%) | 1,086 (7.1%) |
| 50 to 54 Years | 793 (5.0%) | 1,027 (6.8%) |
| 55 to 59 Years | 833 (5.2%) | 786 (5.2%) |
| 60 to 64 Years | 841 (5.3%) | 890 (5.9%) |
| 65 to 69 Years | 605 (3.8%) | 459 (3.0%) |
| 70 to 74 Years | 701 (4.4%) | 425 (2.8%) |
| 75 to 79 Years | 146 (0.9%) | 276 (1.8%) |
| 80 to 84 Years | 225 (1.4%) | 90 (0.6%) |
| 85 Years and over | 107 (0.7%) | 259 (1.7%) |
| Total | 15,853 (100.0%) | 15,205 (100.0%) |
Families and Households in Sterling
Median Family Size in Sterling
The median family size in Sterling is 3.65 persons per family, with single female/mother families (1,059 | 14.6%) accounting for the largest median family size of 4.13 persons per family. On the other hand, single male/father families (716 | 9.9%) represent the smallest median family size with 3.43 persons per family.
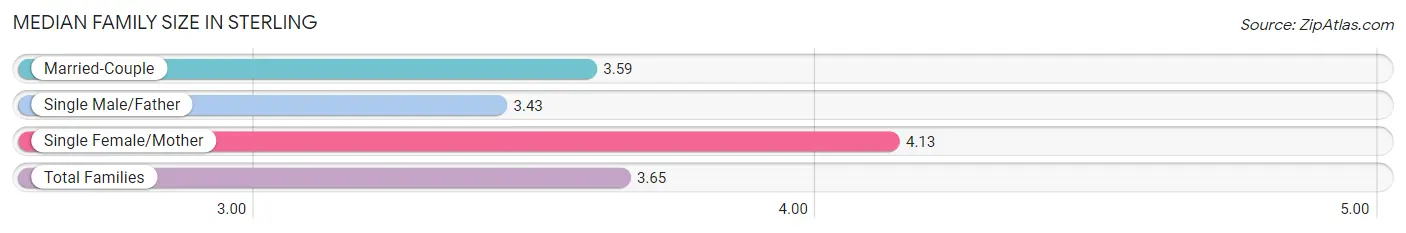
| Family Type | # Families | Family Size |
| Married-Couple | 5,465 (75.5%) | 3.59 |
| Single Male/Father | 716 (9.9%) | 3.43 |
| Single Female/Mother | 1,059 (14.6%) | 4.13 |
| Total Families | 7,240 (100.0%) | 3.65 |
Median Household Size in Sterling
The median household size in Sterling is 3.21 persons per household, with single female/mother households (1,059 | 11.0%) accounting for the largest median household size of 4.55 persons per household. non-family households (2,419 | 25.0%) represent the smallest median household size with 1.31 persons per household.
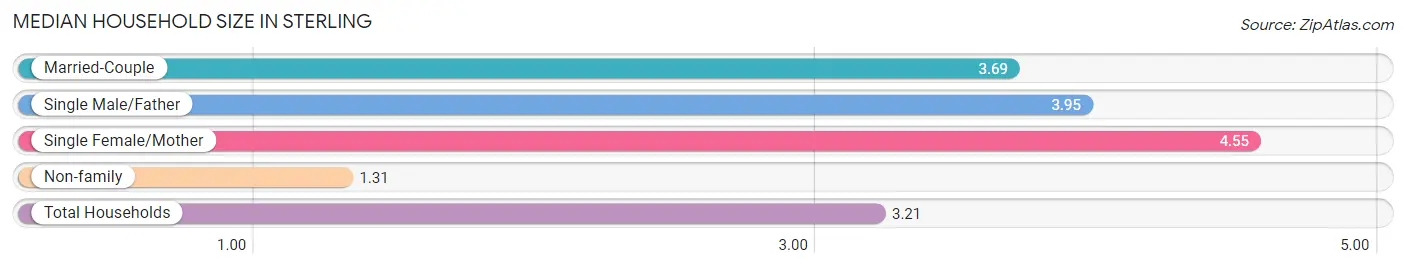
| Household Type | # Households | Household Size |
| Married-Couple | 5,465 (56.6%) | 3.69 |
| Single Male/Father | 716 (7.4%) | 3.95 |
| Single Female/Mother | 1,059 (11.0%) | 4.55 |
| Non-family | 2,419 (25.0%) | 1.31 |
| Total Households | 9,659 (100.0%) | 3.21 |
Household Size by Marriage Status in Sterling
Out of a total of 9,659 households in Sterling, 7,240 (75.0%) are family households, while 2,419 (25.0%) are nonfamily households. The most numerous type of family households are 2-person households, comprising 2,131, and the most common type of nonfamily households are 1-person households, comprising 1,975.
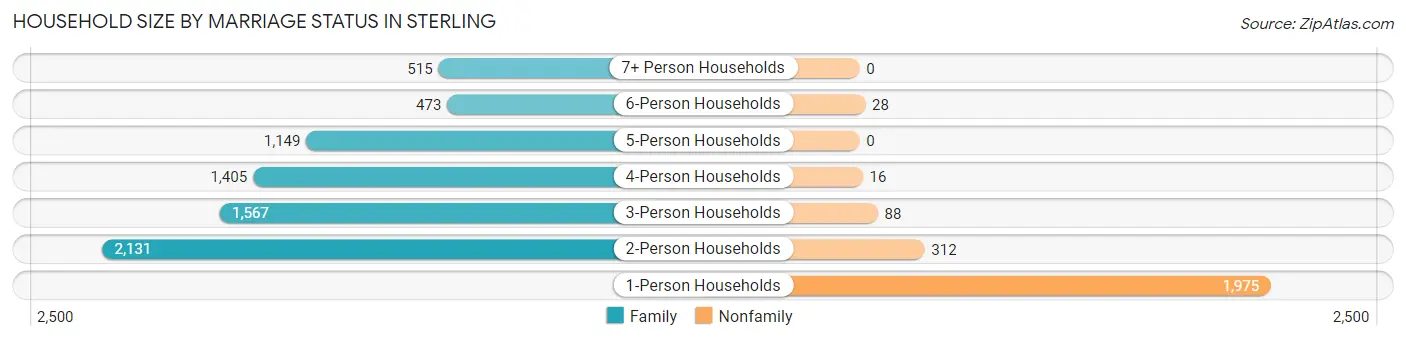
| Household Size | Family Households | Nonfamily Households |
| 1-Person Households | - | 1,975 (20.4%) |
| 2-Person Households | 2,131 (22.1%) | 312 (3.2%) |
| 3-Person Households | 1,567 (16.2%) | 88 (0.9%) |
| 4-Person Households | 1,405 (14.5%) | 16 (0.2%) |
| 5-Person Households | 1,149 (11.9%) | 0 (0.0%) |
| 6-Person Households | 473 (4.9%) | 28 (0.3%) |
| 7+ Person Households | 515 (5.3%) | 0 (0.0%) |
| Total | 7,240 (75.0%) | 2,419 (25.0%) |
Female Fertility in Sterling
Fertility by Age in Sterling
Average fertility rate in Sterling is 64.0 births per 1,000 women. Women in the age bracket of 20 to 34 years have the highest fertility rate with 83.0 births per 1,000 women. Women in the age bracket of 20 to 34 years acount for 53.9% of all women with births.
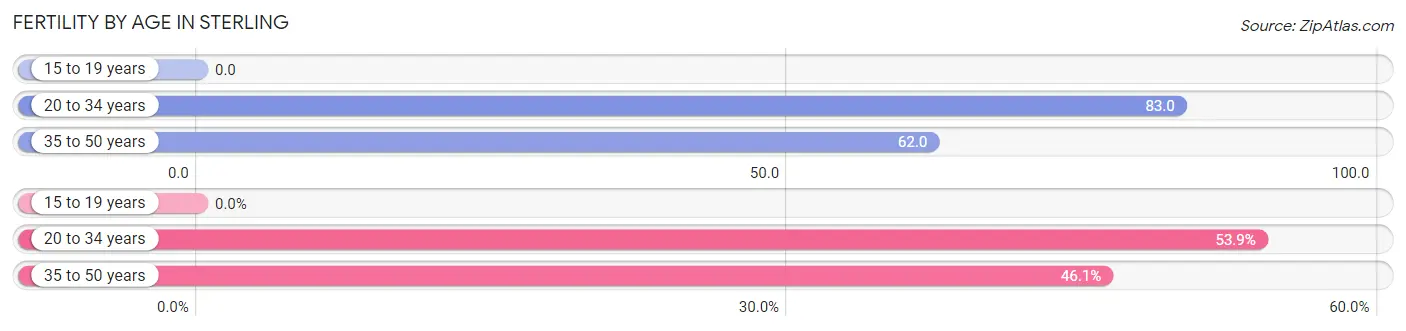
| Age Bracket | Women with Births | Births / 1,000 Women |
| 15 to 19 years | 0 (0.0%) | 0.0 |
| 20 to 34 years | 281 (53.9%) | 83.0 |
| 35 to 50 years | 240 (46.1%) | 62.0 |
| Total | 521 (100.0%) | 64.0 |
Fertility by Age by Marriage Status in Sterling
87.1% of women with births (521) in Sterling are married. The highest percentage of unmarried women with births falls into 20 to 34 years age bracket with 23.8% of them unmarried at the time of birth, while the lowest percentage of unmarried women with births belong to 35 to 50 years age bracket with 0.0% of them unmarried.
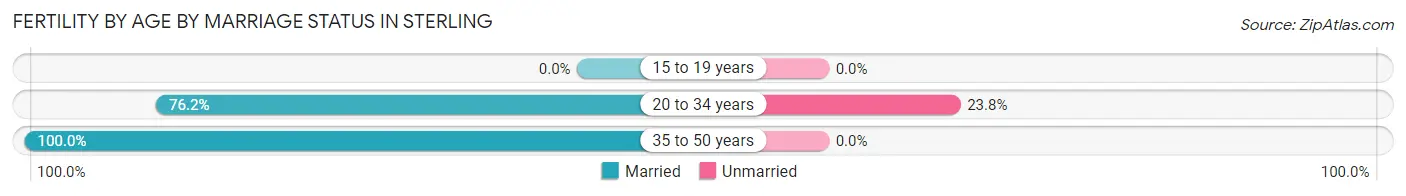
| Age Bracket | Married | Unmarried |
| 15 to 19 years | 0 (0.0%) | 0 (0.0%) |
| 20 to 34 years | 214 (76.2%) | 67 (23.8%) |
| 35 to 50 years | 240 (100.0%) | 0 (0.0%) |
| Total | 454 (87.1%) | 67 (12.9%) |
Fertility by Education in Sterling
Average fertility rate in Sterling is 64.0 births per 1,000 women. Women with the education attainment of bachelor's degree have the highest fertility rate of 101.0 births per 1,000 women, while women with the education attainment of less than high school have the lowest fertility at 20.0 births per 1,000 women. Women with the education attainment of bachelor's degree represent 34.5% of all women with births.
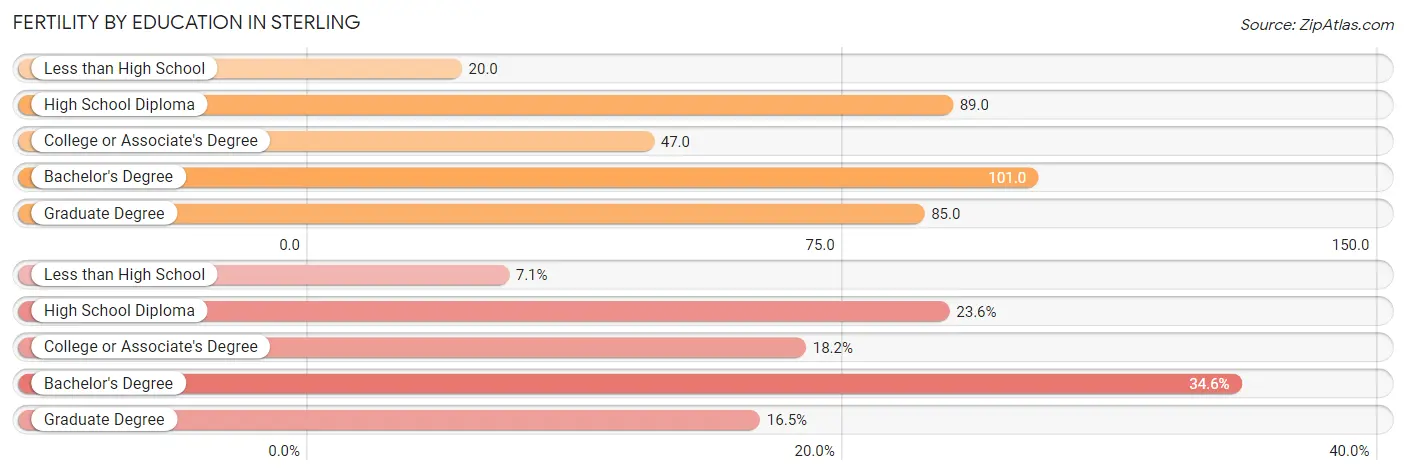
| Educational Attainment | Women with Births | Births / 1,000 Women |
| Less than High School | 37 (7.1%) | 20.0 |
| High School Diploma | 123 (23.6%) | 89.0 |
| College or Associate's Degree | 95 (18.2%) | 47.0 |
| Bachelor's Degree | 180 (34.5%) | 101.0 |
| Graduate Degree | 86 (16.5%) | 85.0 |
| Total | 521 (100.0%) | 64.0 |
Fertility by Education by Marriage Status in Sterling
12.9% of women with births in Sterling are unmarried. Women with the educational attainment of bachelor's degree are most likely to be married with 100.0% of them married at childbirth, while women with the educational attainment of less than high school are least likely to be married with 67.6% of them unmarried at childbirth.
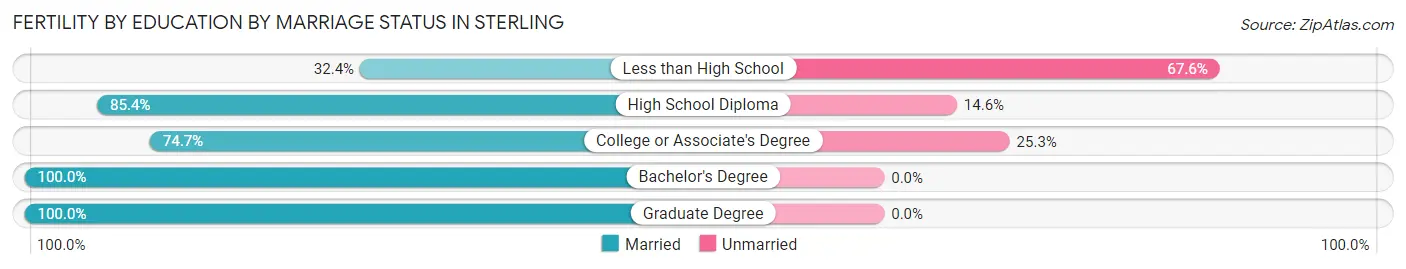
| Educational Attainment | Married | Unmarried |
| Less than High School | 12 (32.4%) | 25 (67.6%) |
| High School Diploma | 105 (85.4%) | 18 (14.6%) |
| College or Associate's Degree | 71 (74.7%) | 24 (25.3%) |
| Bachelor's Degree | 180 (100.0%) | 0 (0.0%) |
| Graduate Degree | 86 (100.0%) | 0 (0.0%) |
| Total | 454 (87.1%) | 67 (12.9%) |
Employment Characteristics in Sterling
Employment by Class of Employer in Sterling
Among the 17,055 employed individuals in Sterling, private company employees (11,823 | 69.3%), federal government employees (1,270 | 7.4%), and not-for-profit organizations (1,243 | 7.3%) make up the most common classes of employment.
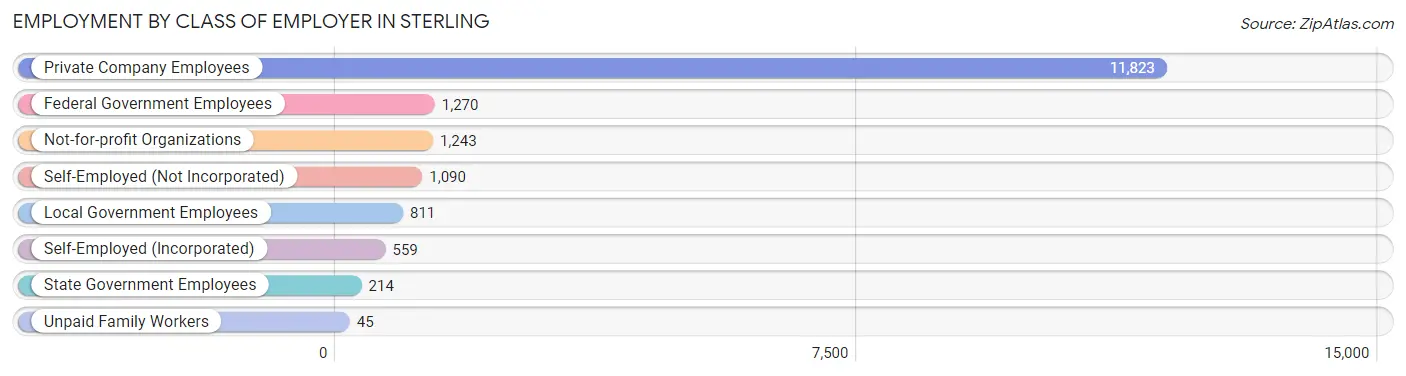
| Employer Class | # Employees | % Employees |
| Private Company Employees | 11,823 | 69.3% |
| Self-Employed (Incorporated) | 559 | 3.3% |
| Self-Employed (Not Incorporated) | 1,090 | 6.4% |
| Not-for-profit Organizations | 1,243 | 7.3% |
| Local Government Employees | 811 | 4.8% |
| State Government Employees | 214 | 1.3% |
| Federal Government Employees | 1,270 | 7.4% |
| Unpaid Family Workers | 45 | 0.3% |
| Total | 17,055 | 100.0% |
Employment Status by Age in Sterling
According to the labor force statistics for Sterling, out of the total population over 16 years of age (24,624), 75.3% or 18,542 individuals are in the labor force, with 5.0% or 927 of them unemployed. The age group with the highest labor force participation rate is 25 to 29 years, with 90.8% or 1,757 individuals in the labor force. Within the labor force, the 16 to 19 years age range has the highest percentage of unemployed individuals, with 19.9% or 211 of them being unemployed.
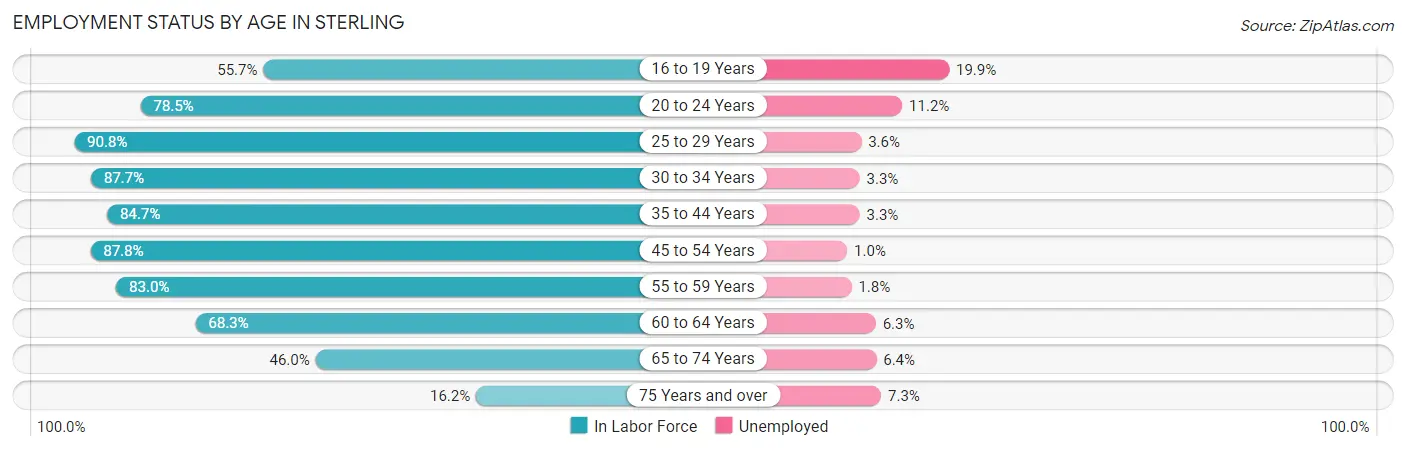
| Age Bracket | In Labor Force | Unemployed |
| 16 to 19 Years | 1,061 (55.7%) | 211 (19.9%) |
| 20 to 24 Years | 2,066 (78.5%) | 231 (11.2%) |
| 25 to 29 Years | 1,757 (90.8%) | 63 (3.6%) |
| 30 to 34 Years | 2,092 (87.7%) | 69 (3.3%) |
| 35 to 44 Years | 4,564 (84.7%) | 151 (3.3%) |
| 45 to 54 Years | 3,281 (87.8%) | 33 (1.0%) |
| 55 to 59 Years | 1,344 (83.0%) | 24 (1.8%) |
| 60 to 64 Years | 1,182 (68.3%) | 74 (6.3%) |
| 65 to 74 Years | 1,007 (46.0%) | 64 (6.4%) |
| 75 Years and over | 179 (16.2%) | 13 (7.3%) |
| Total | 18,542 (75.3%) | 927 (5.0%) |
Employment Status by Educational Attainment in Sterling
According to labor force statistics for Sterling, 84.7% of individuals (14,225) out of the total population between 25 and 64 years of age (16,795) are in the labor force, with 2.9% or 413 of them being unemployed. The group with the highest labor force participation rate are those with the educational attainment of high school diploma, with 87.6% or 2,666 individuals in the labor force. Within the labor force, individuals with less than high school education have the highest percentage of unemployment, with 5.8% or 153 of them being unemployed.
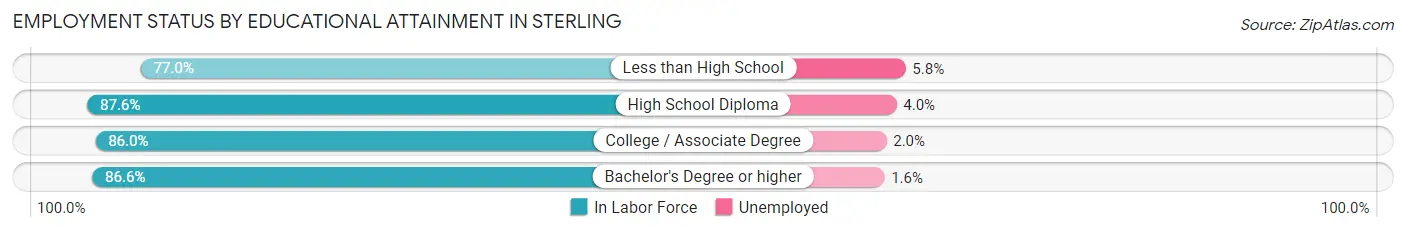
| Educational Attainment | In Labor Force | Unemployed |
| Less than High School | 2,632 (77.0%) | 198 (5.8%) |
| High School Diploma | 2,666 (87.6%) | 122 (4.0%) |
| College / Associate Degree | 3,480 (86.0%) | 81 (2.0%) |
| Bachelor's Degree or higher | 5,445 (86.6%) | 101 (1.6%) |
| Total | 14,225 (84.7%) | 487 (2.9%) |
Employment Occupations by Sex in Sterling
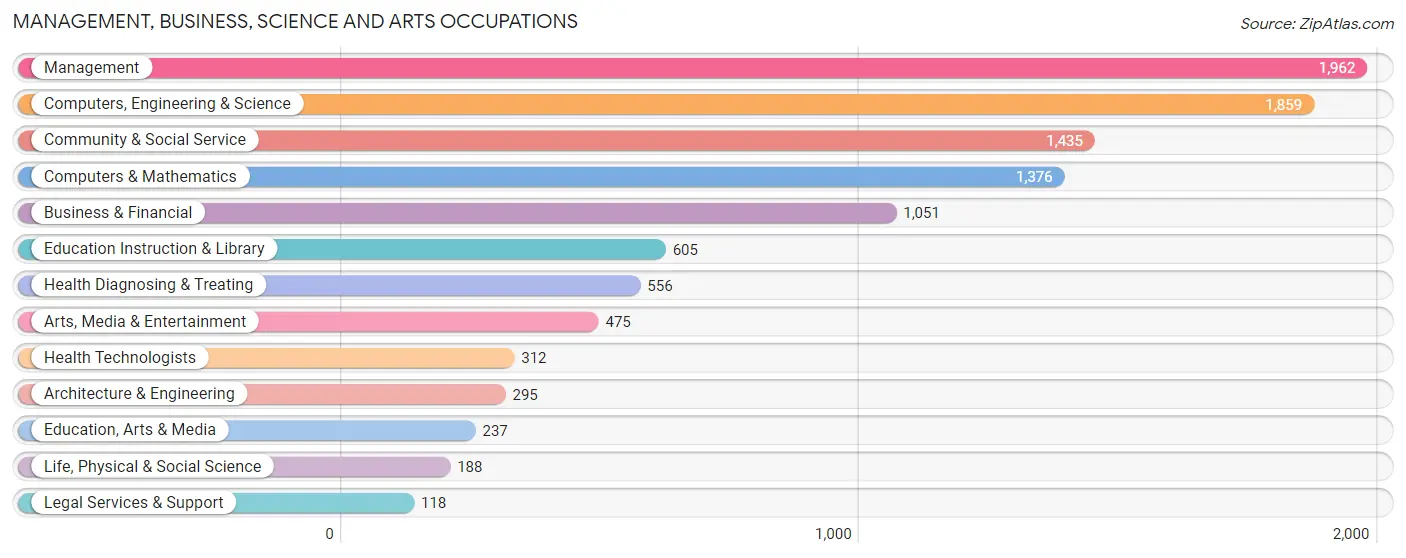
Management, Business, Science and Arts Occupations
The most common Management, Business, Science and Arts occupations in Sterling are Management (1,962 | 11.3%), Computers, Engineering & Science (1,859 | 10.7%), Community & Social Service (1,435 | 8.2%), Computers & Mathematics (1,376 | 7.9%), and Business & Financial (1,051 | 6.0%).
Management, Business, Science and Arts Occupations by Sex
Within the Management, Business, Science and Arts occupations in Sterling, the most male-oriented occupations are Computers & Mathematics (77.8%), Computers, Engineering & Science (74.3%), and Architecture & Engineering (73.2%), while the most female-oriented occupations are Health Technologists (87.8%), Education Instruction & Library (78.0%), and Health Diagnosing & Treating (76.8%).
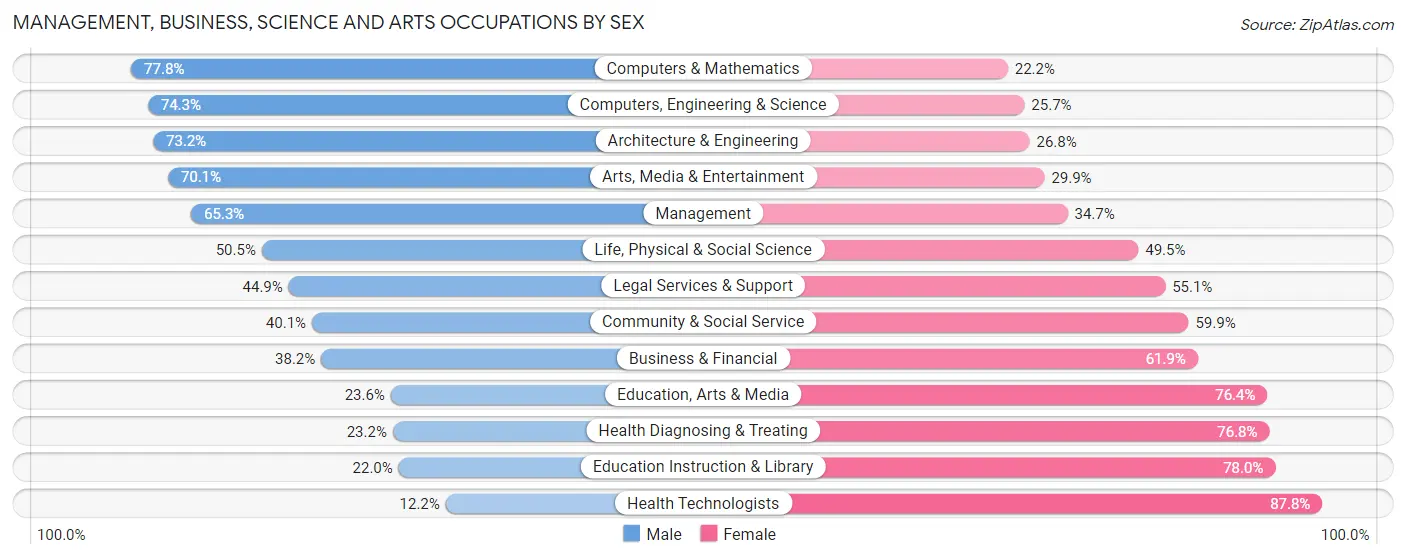
| Occupation | Male | Female |
| Management | 1,281 (65.3%) | 681 (34.7%) |
| Business & Financial | 401 (38.2%) | 650 (61.9%) |
| Computers, Engineering & Science | 1,381 (74.3%) | 478 (25.7%) |
| Computers & Mathematics | 1,070 (77.8%) | 306 (22.2%) |
| Architecture & Engineering | 216 (73.2%) | 79 (26.8%) |
| Life, Physical & Social Science | 95 (50.5%) | 93 (49.5%) |
| Community & Social Service | 575 (40.1%) | 860 (59.9%) |
| Education, Arts & Media | 56 (23.6%) | 181 (76.4%) |
| Legal Services & Support | 53 (44.9%) | 65 (55.1%) |
| Education Instruction & Library | 133 (22.0%) | 472 (78.0%) |
| Arts, Media & Entertainment | 333 (70.1%) | 142 (29.9%) |
| Health Diagnosing & Treating | 129 (23.2%) | 427 (76.8%) |
| Health Technologists | 38 (12.2%) | 274 (87.8%) |
| Total (Category) | 3,767 (54.9%) | 3,096 (45.1%) |
| Total (Overall) | 10,085 (57.9%) | 7,323 (42.1%) |
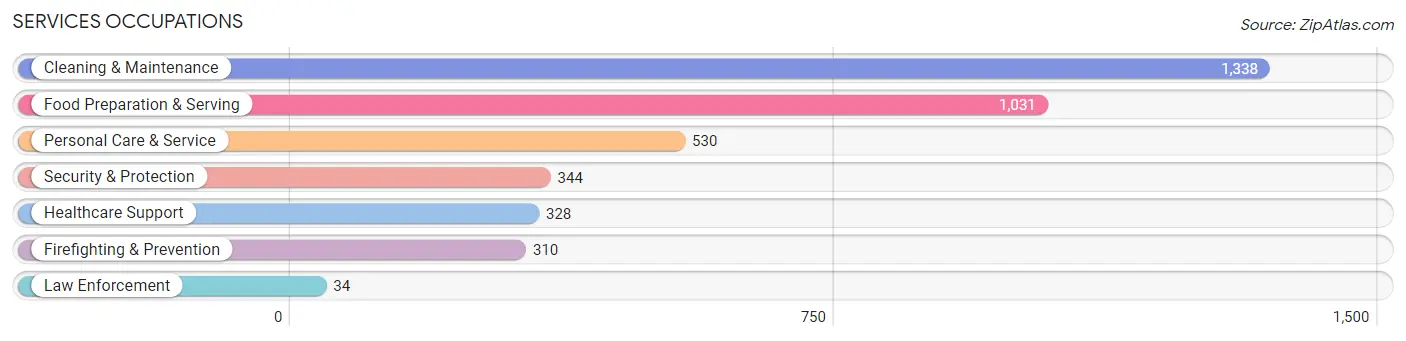
Services Occupations
The most common Services occupations in Sterling are Cleaning & Maintenance (1,338 | 7.7%), Food Preparation & Serving (1,031 | 5.9%), Personal Care & Service (530 | 3.0%), Security & Protection (344 | 2.0%), and Healthcare Support (328 | 1.9%).
Services Occupations by Sex
Within the Services occupations in Sterling, the most male-oriented occupations are Firefighting & Prevention (63.2%), Security & Protection (62.2%), and Food Preparation & Serving (53.0%), while the most female-oriented occupations are Personal Care & Service (85.7%), Healthcare Support (74.7%), and Cleaning & Maintenance (52.1%).
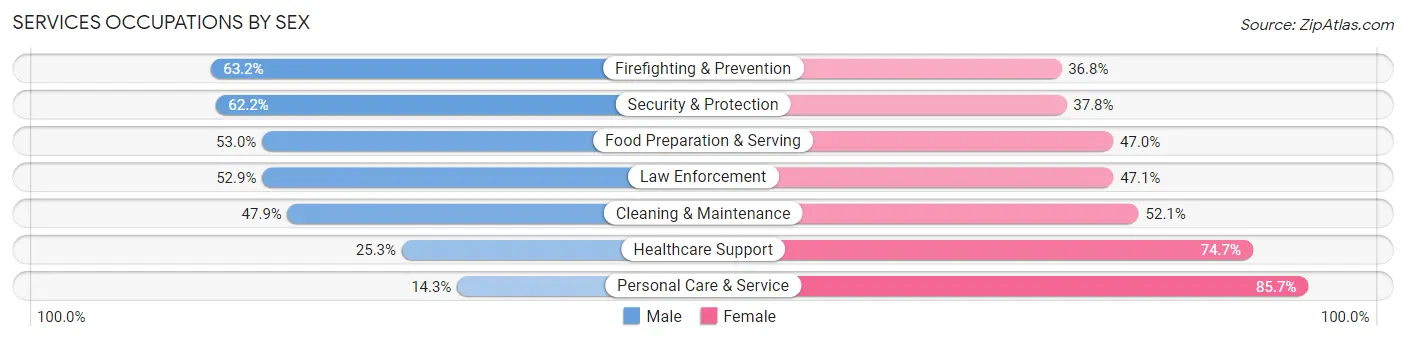
| Occupation | Male | Female |
| Healthcare Support | 83 (25.3%) | 245 (74.7%) |
| Security & Protection | 214 (62.2%) | 130 (37.8%) |
| Firefighting & Prevention | 196 (63.2%) | 114 (36.8%) |
| Law Enforcement | 18 (52.9%) | 16 (47.1%) |
| Food Preparation & Serving | 546 (53.0%) | 485 (47.0%) |
| Cleaning & Maintenance | 641 (47.9%) | 697 (52.1%) |
| Personal Care & Service | 76 (14.3%) | 454 (85.7%) |
| Total (Category) | 1,560 (43.7%) | 2,011 (56.3%) |
| Total (Overall) | 10,085 (57.9%) | 7,323 (42.1%) |
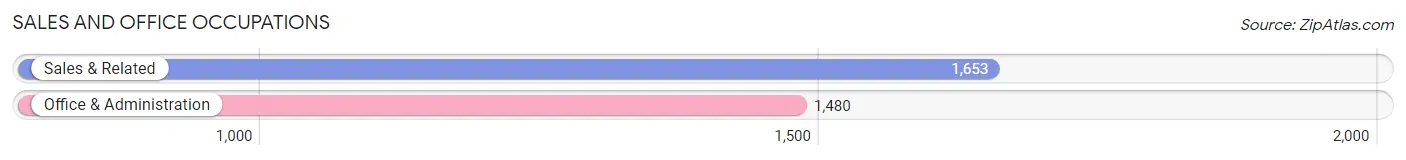
Sales and Office Occupations
The most common Sales and Office occupations in Sterling are Sales & Related (1,653 | 9.5%), and Office & Administration (1,480 | 8.5%).
Sales and Office Occupations by Sex
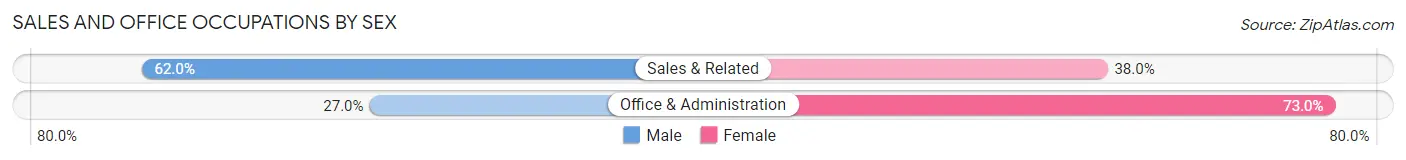
| Occupation | Male | Female |
| Sales & Related | 1,025 (62.0%) | 628 (38.0%) |
| Office & Administration | 399 (27.0%) | 1,081 (73.0%) |
| Total (Category) | 1,424 (45.5%) | 1,709 (54.5%) |
| Total (Overall) | 10,085 (57.9%) | 7,323 (42.1%) |
Natural Resources, Construction and Maintenance Occupations
The most common Natural Resources, Construction and Maintenance occupations in Sterling are Construction & Extraction (1,516 | 8.7%), and Installation, Maintenance & Repair (538 | 3.1%).
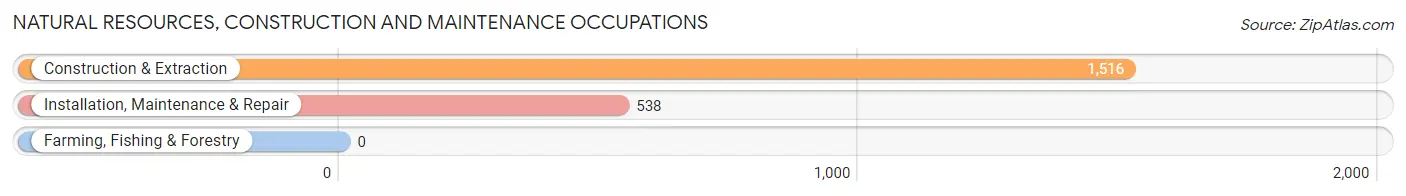
Natural Resources, Construction and Maintenance Occupations by Sex
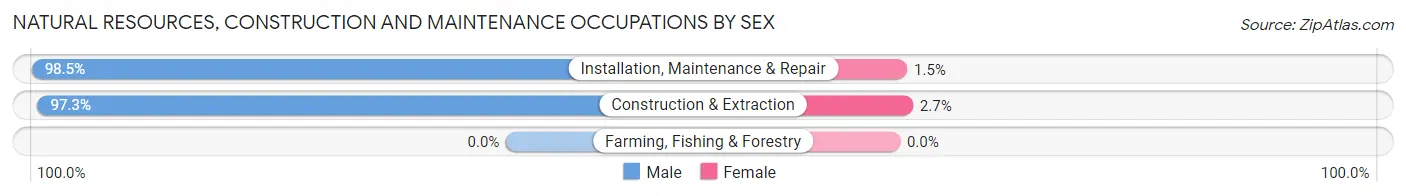
| Occupation | Male | Female |
| Farming, Fishing & Forestry | 0 (0.0%) | 0 (0.0%) |
| Construction & Extraction | 1,475 (97.3%) | 41 (2.7%) |
| Installation, Maintenance & Repair | 530 (98.5%) | 8 (1.5%) |
| Total (Category) | 2,005 (97.6%) | 49 (2.4%) |
| Total (Overall) | 10,085 (57.9%) | 7,323 (42.1%) |
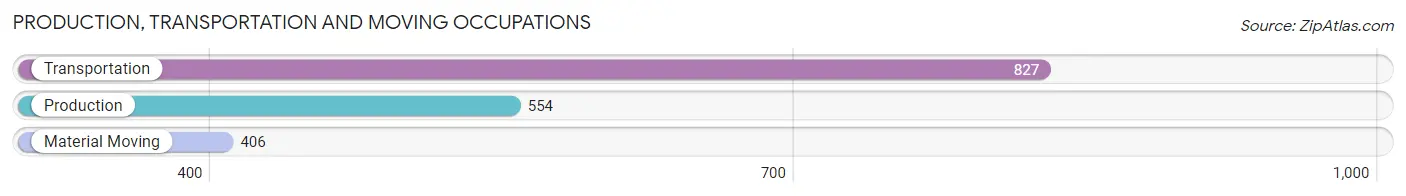
Production, Transportation and Moving Occupations
The most common Production, Transportation and Moving occupations in Sterling are Transportation (827 | 4.8%), Production (554 | 3.2%), and Material Moving (406 | 2.3%).
Production, Transportation and Moving Occupations by Sex
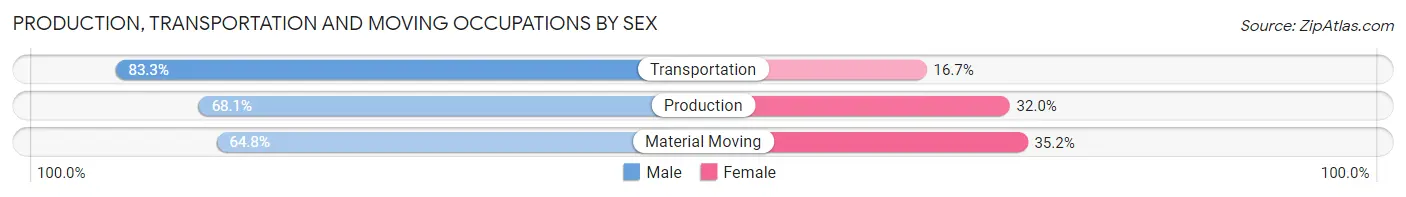
| Occupation | Male | Female |
| Production | 377 (68.0%) | 177 (32.0%) |
| Transportation | 689 (83.3%) | 138 (16.7%) |
| Material Moving | 263 (64.8%) | 143 (35.2%) |
| Total (Category) | 1,329 (74.4%) | 458 (25.6%) |
| Total (Overall) | 10,085 (57.9%) | 7,323 (42.1%) |
Employment Industries by Sex in Sterling
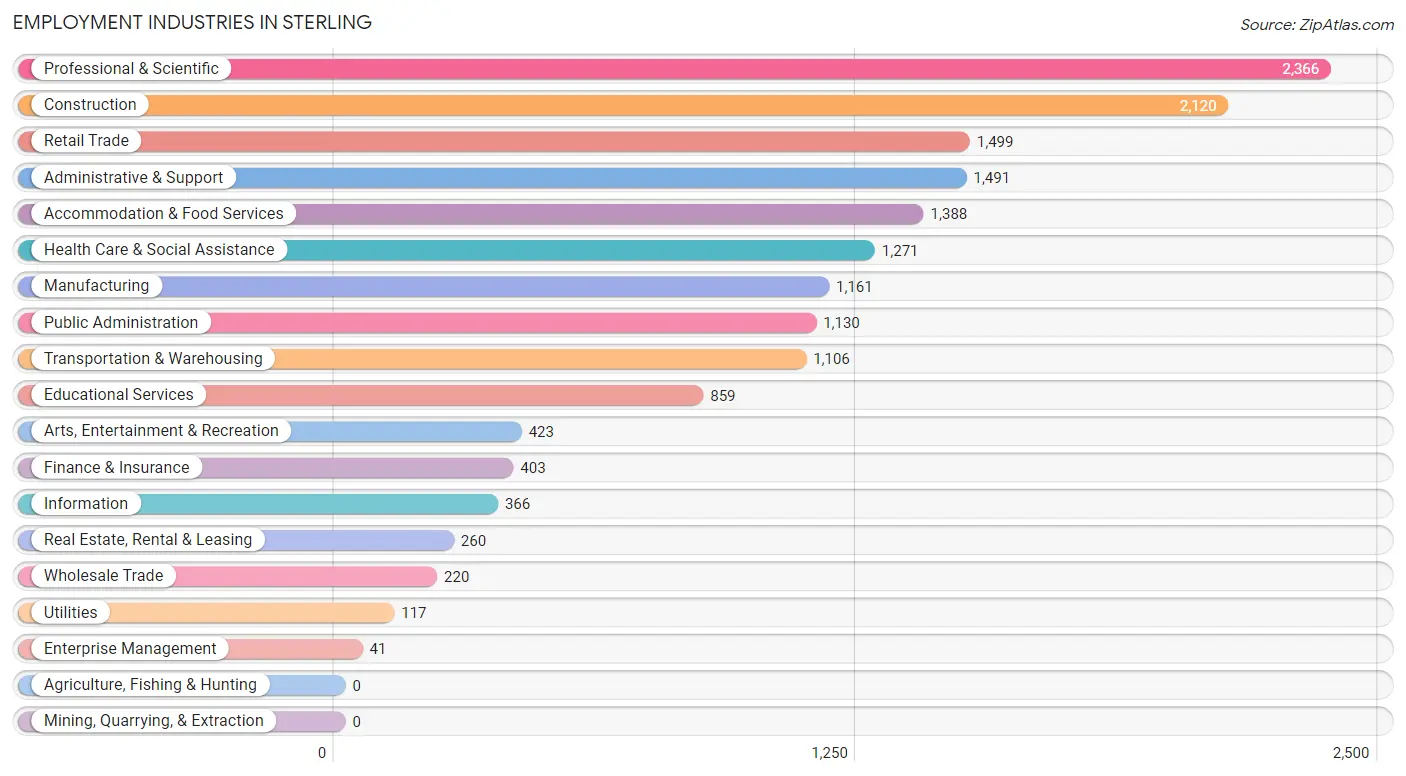
Employment Industries in Sterling
The major employment industries in Sterling include Professional & Scientific (2,366 | 13.6%), Construction (2,120 | 12.2%), Retail Trade (1,499 | 8.6%), Administrative & Support (1,491 | 8.6%), and Accommodation & Food Services (1,388 | 8.0%).
Employment Industries by Sex in Sterling
The Sterling industries that see more men than women are Utilities (100.0%), Construction (91.0%), and Arts, Entertainment & Recreation (72.8%), whereas the industries that tend to have a higher number of women are Health Care & Social Assistance (84.6%), Educational Services (71.4%), and Wholesale Trade (54.1%).
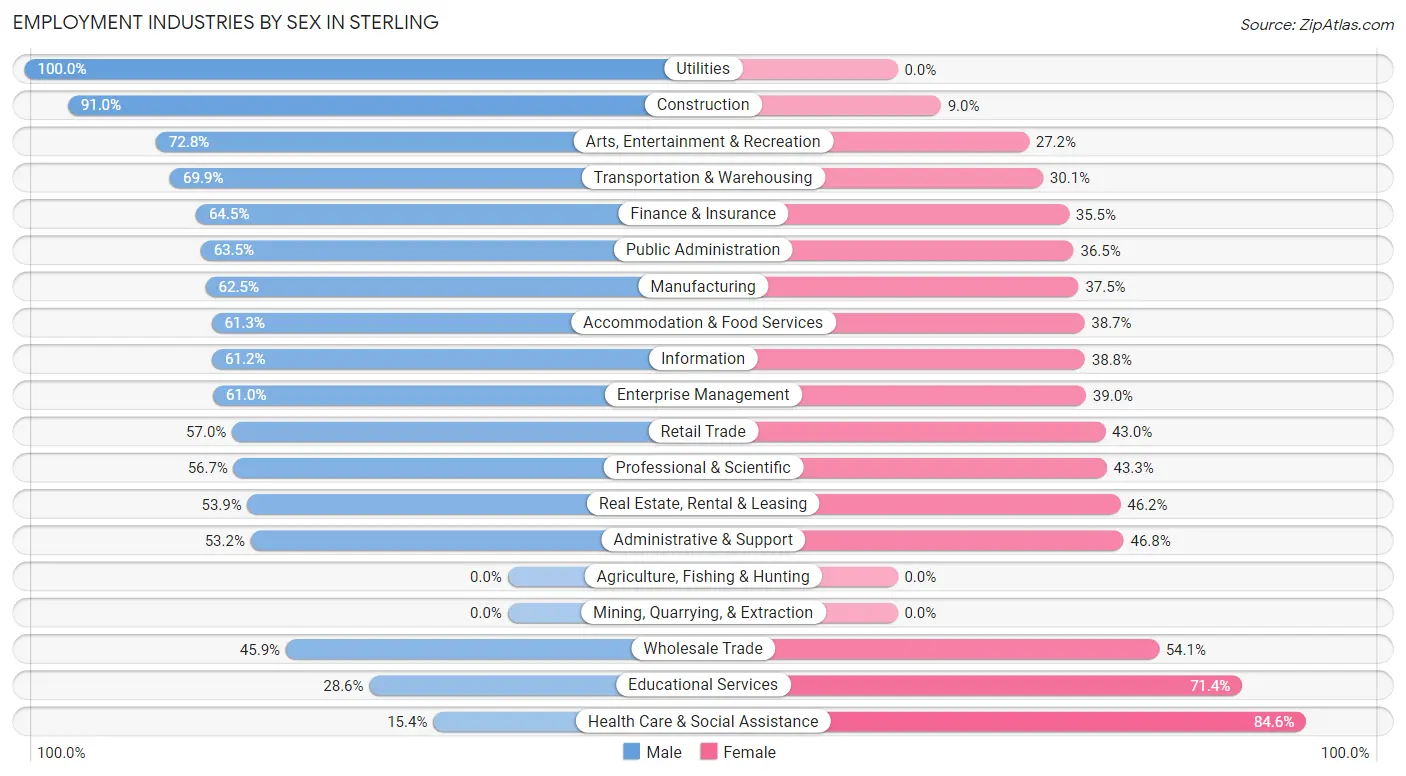
| Industry | Male | Female |
| Agriculture, Fishing & Hunting | 0 (0.0%) | 0 (0.0%) |
| Mining, Quarrying, & Extraction | 0 (0.0%) | 0 (0.0%) |
| Construction | 1,930 (91.0%) | 190 (9.0%) |
| Manufacturing | 726 (62.5%) | 435 (37.5%) |
| Wholesale Trade | 101 (45.9%) | 119 (54.1%) |
| Retail Trade | 855 (57.0%) | 644 (43.0%) |
| Transportation & Warehousing | 773 (69.9%) | 333 (30.1%) |
| Utilities | 117 (100.0%) | 0 (0.0%) |
| Information | 224 (61.2%) | 142 (38.8%) |
| Finance & Insurance | 260 (64.5%) | 143 (35.5%) |
| Real Estate, Rental & Leasing | 140 (53.8%) | 120 (46.2%) |
| Professional & Scientific | 1,342 (56.7%) | 1,024 (43.3%) |
| Enterprise Management | 25 (61.0%) | 16 (39.0%) |
| Administrative & Support | 793 (53.2%) | 698 (46.8%) |
| Educational Services | 246 (28.6%) | 613 (71.4%) |
| Health Care & Social Assistance | 196 (15.4%) | 1,075 (84.6%) |
| Arts, Entertainment & Recreation | 308 (72.8%) | 115 (27.2%) |
| Accommodation & Food Services | 851 (61.3%) | 537 (38.7%) |
| Public Administration | 718 (63.5%) | 412 (36.5%) |
| Total | 10,085 (57.9%) | 7,323 (42.1%) |
Education in Sterling
School Enrollment in Sterling
The most common levels of schooling among the 7,583 students in Sterling are college / undergraduate (1,746 | 23.0%), high school (1,694 | 22.3%), and elementary school (1,617 | 21.3%).
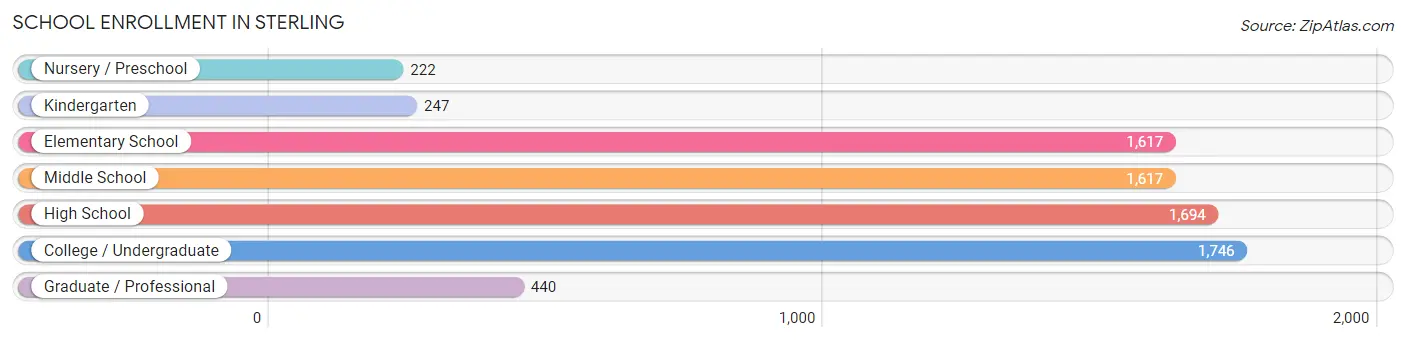
| School Level | # Students | % Students |
| Nursery / Preschool | 222 | 2.9% |
| Kindergarten | 247 | 3.3% |
| Elementary School | 1,617 | 21.3% |
| Middle School | 1,617 | 21.3% |
| High School | 1,694 | 22.3% |
| College / Undergraduate | 1,746 | 23.0% |
| Graduate / Professional | 440 | 5.8% |
| Total | 7,583 | 100.0% |
School Enrollment by Age by Funding Source in Sterling
Out of a total of 7,583 students who are enrolled in schools in Sterling, 940 (12.4%) attend a private institution, while the remaining 6,643 (87.6%) are enrolled in public schools. The age group of 3 to 4 year olds has the highest likelihood of being enrolled in private schools, with 103 (92.8% in the age bracket) enrolled. Conversely, the age group of 15 to 17 year olds has the lowest likelihood of being enrolled in a private school, with 1,182 (95.6% in the age bracket) attending a public institution.
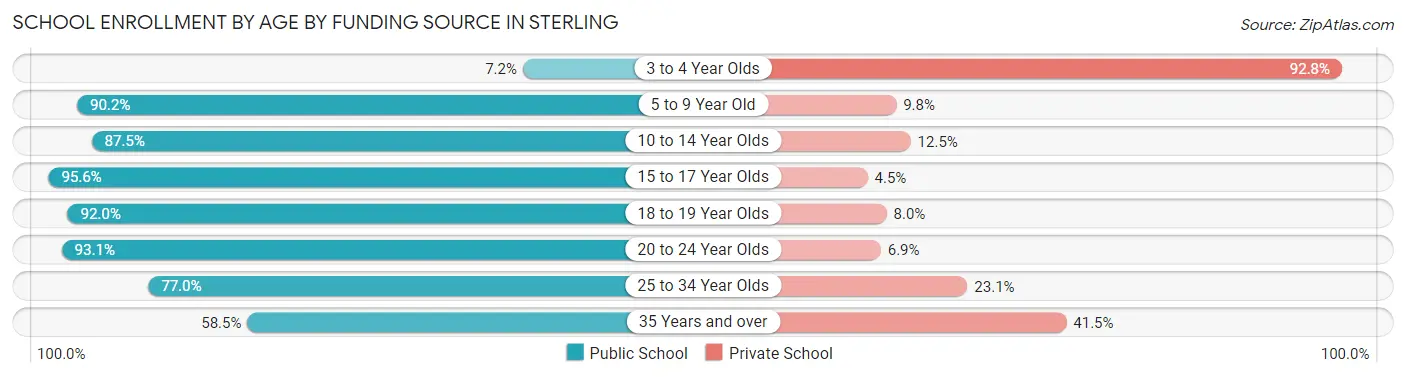
| Age Bracket | Public School | Private School |
| 3 to 4 Year Olds | 8 (7.2%) | 103 (92.8%) |
| 5 to 9 Year Old | 1,706 (90.2%) | 185 (9.8%) |
| 10 to 14 Year Olds | 1,592 (87.5%) | 227 (12.5%) |
| 15 to 17 Year Olds | 1,182 (95.6%) | 55 (4.4%) |
| 18 to 19 Year Olds | 644 (92.0%) | 56 (8.0%) |
| 20 to 24 Year Olds | 876 (93.1%) | 65 (6.9%) |
| 25 to 34 Year Olds | 504 (76.9%) | 151 (23.1%) |
| 35 Years and over | 134 (58.5%) | 95 (41.5%) |
| Total | 6,643 (87.6%) | 940 (12.4%) |
Educational Attainment by Field of Study in Sterling
Business (1,603 | 20.0%), social sciences (866 | 10.8%), engineering (846 | 10.5%), computers & mathematics (788 | 9.8%), and arts & humanities (622 | 7.7%) are the most common fields of study among 8,030 individuals in Sterling who have obtained a bachelor's degree or higher.
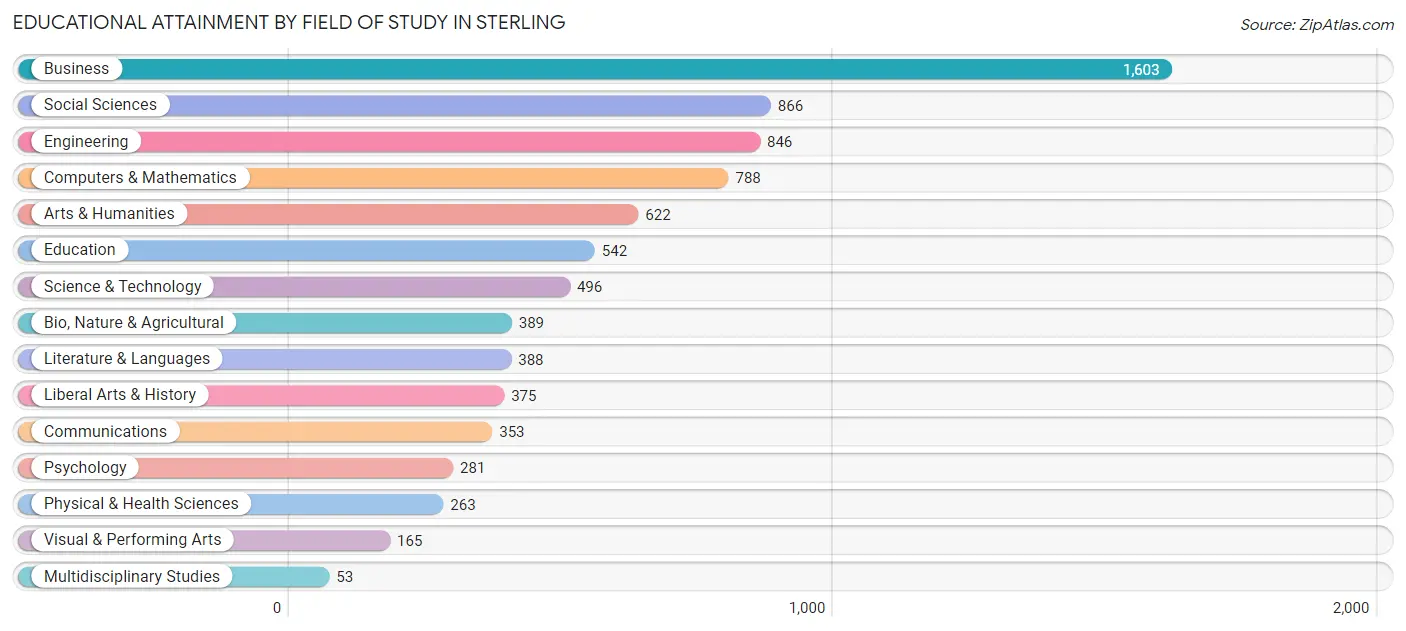
| Field of Study | # Graduates | % Graduates |
| Computers & Mathematics | 788 | 9.8% |
| Bio, Nature & Agricultural | 389 | 4.8% |
| Physical & Health Sciences | 263 | 3.3% |
| Psychology | 281 | 3.5% |
| Social Sciences | 866 | 10.8% |
| Engineering | 846 | 10.5% |
| Multidisciplinary Studies | 53 | 0.7% |
| Science & Technology | 496 | 6.2% |
| Business | 1,603 | 20.0% |
| Education | 542 | 6.8% |
| Literature & Languages | 388 | 4.8% |
| Liberal Arts & History | 375 | 4.7% |
| Visual & Performing Arts | 165 | 2.1% |
| Communications | 353 | 4.4% |
| Arts & Humanities | 622 | 7.7% |
| Total | 8,030 | 100.0% |
Transportation & Commute in Sterling
Vehicle Availability by Sex in Sterling
The most prevalent vehicle ownership categories in Sterling are males with 2 vehicles (3,266, accounting for 33.1%) and females with 2 vehicles (2,528, making up 45.5%).
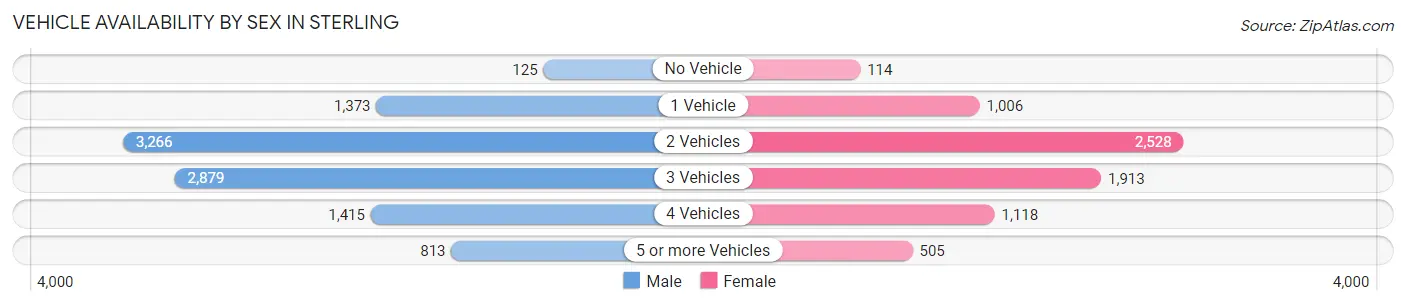
| Vehicles Available | Male | Female |
| No Vehicle | 125 (1.3%) | 114 (1.6%) |
| 1 Vehicle | 1,373 (13.9%) | 1,006 (14.0%) |
| 2 Vehicles | 3,266 (33.1%) | 2,528 (35.2%) |
| 3 Vehicles | 2,879 (29.2%) | 1,913 (26.6%) |
| 4 Vehicles | 1,415 (14.3%) | 1,118 (15.6%) |
| 5 or more Vehicles | 813 (8.2%) | 505 (7.0%) |
| Total | 9,871 (100.0%) | 7,184 (100.0%) |
Commute Time in Sterling
The most frequently occuring commute durations in Sterling are 15 to 19 minutes (2,914 commuters, 19.0%), 10 to 14 minutes (2,900 commuters, 18.9%), and 30 to 34 minutes (2,084 commuters, 13.6%).
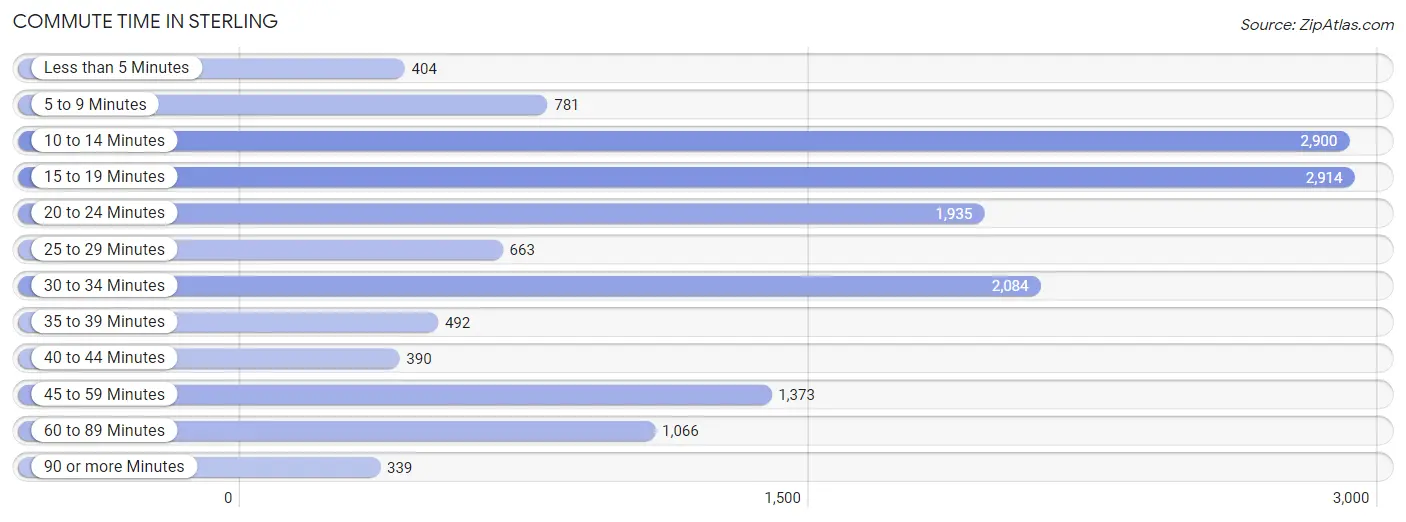
| Commute Time | # Commuters | % Commuters |
| Less than 5 Minutes | 404 | 2.6% |
| 5 to 9 Minutes | 781 | 5.1% |
| 10 to 14 Minutes | 2,900 | 18.9% |
| 15 to 19 Minutes | 2,914 | 19.0% |
| 20 to 24 Minutes | 1,935 | 12.6% |
| 25 to 29 Minutes | 663 | 4.3% |
| 30 to 34 Minutes | 2,084 | 13.6% |
| 35 to 39 Minutes | 492 | 3.2% |
| 40 to 44 Minutes | 390 | 2.5% |
| 45 to 59 Minutes | 1,373 | 8.9% |
| 60 to 89 Minutes | 1,066 | 7.0% |
| 90 or more Minutes | 339 | 2.2% |
Commute Time by Sex in Sterling
The most common commute times in Sterling are 10 to 14 minutes (1,768 commuters, 19.8%) for males and 15 to 19 minutes (1,378 commuters, 21.6%) for females.
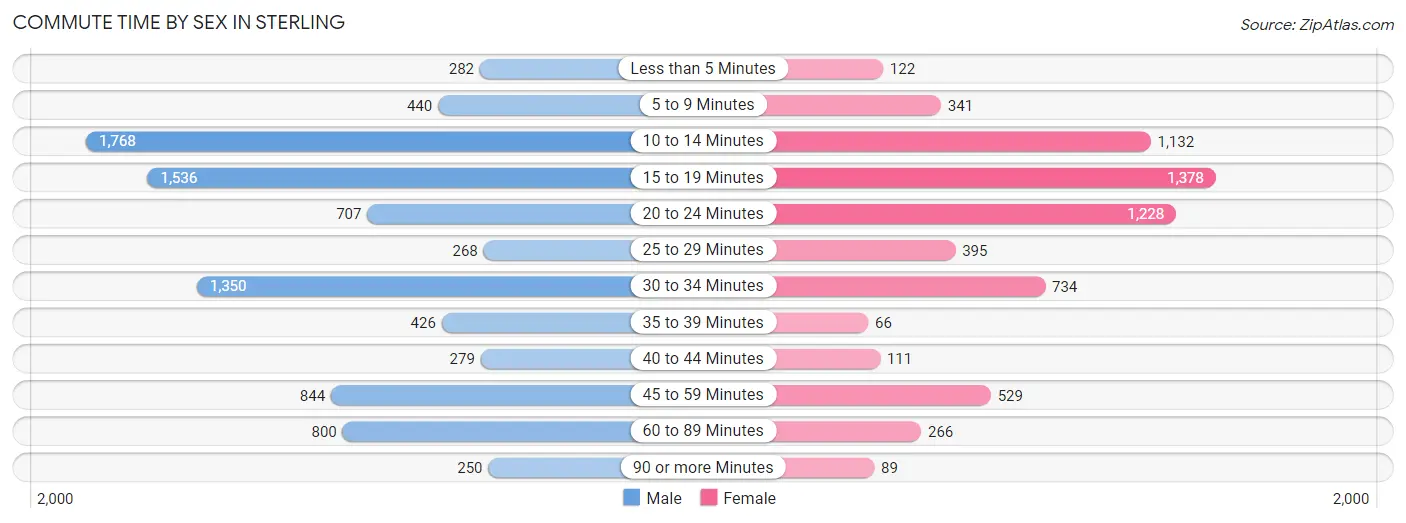
| Commute Time | Male | Female |
| Less than 5 Minutes | 282 (3.2%) | 122 (1.9%) |
| 5 to 9 Minutes | 440 (4.9%) | 341 (5.3%) |
| 10 to 14 Minutes | 1,768 (19.8%) | 1,132 (17.7%) |
| 15 to 19 Minutes | 1,536 (17.2%) | 1,378 (21.6%) |
| 20 to 24 Minutes | 707 (7.9%) | 1,228 (19.2%) |
| 25 to 29 Minutes | 268 (3.0%) | 395 (6.2%) |
| 30 to 34 Minutes | 1,350 (15.1%) | 734 (11.5%) |
| 35 to 39 Minutes | 426 (4.8%) | 66 (1.0%) |
| 40 to 44 Minutes | 279 (3.1%) | 111 (1.7%) |
| 45 to 59 Minutes | 844 (9.4%) | 529 (8.3%) |
| 60 to 89 Minutes | 800 (8.9%) | 266 (4.2%) |
| 90 or more Minutes | 250 (2.8%) | 89 (1.4%) |
Time of Departure to Work by Sex in Sterling
The most frequent times of departure to work in Sterling are 7:00 AM to 7:29 AM (1,054, 11.8%) for males and 8:30 AM to 8:59 AM (833, 13.0%) for females.
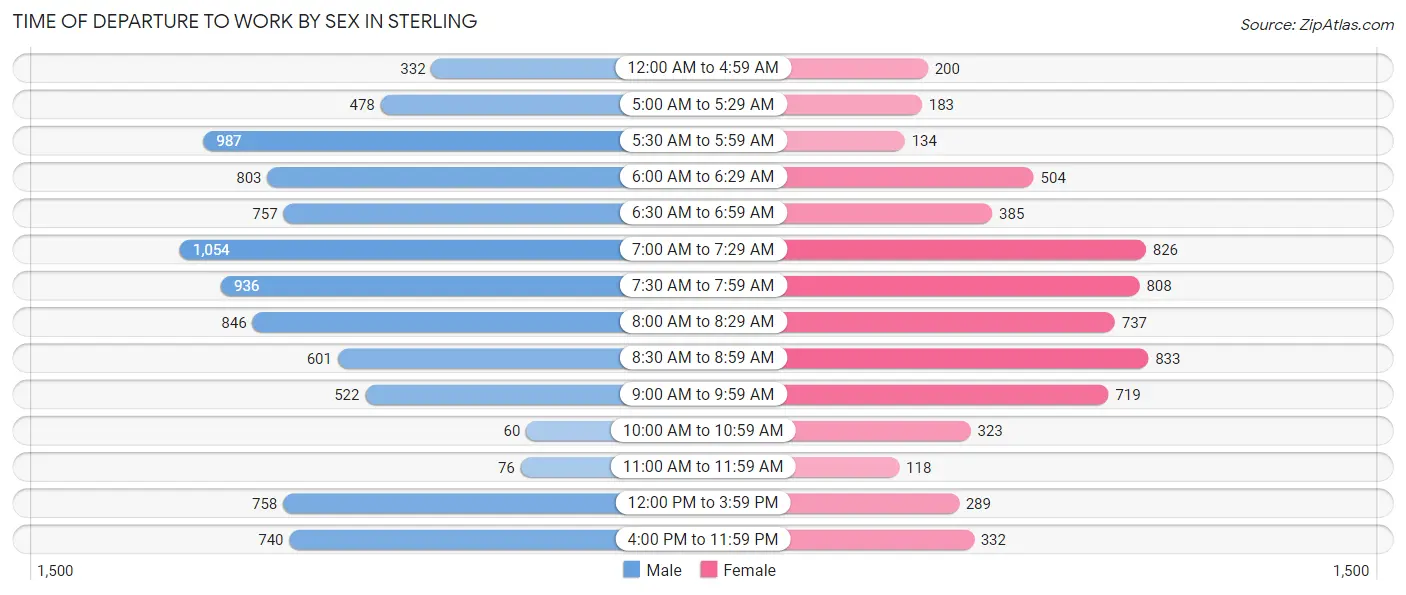
| Time of Departure | Male | Female |
| 12:00 AM to 4:59 AM | 332 (3.7%) | 200 (3.1%) |
| 5:00 AM to 5:29 AM | 478 (5.3%) | 183 (2.9%) |
| 5:30 AM to 5:59 AM | 987 (11.0%) | 134 (2.1%) |
| 6:00 AM to 6:29 AM | 803 (9.0%) | 504 (7.9%) |
| 6:30 AM to 6:59 AM | 757 (8.5%) | 385 (6.0%) |
| 7:00 AM to 7:29 AM | 1,054 (11.8%) | 826 (12.9%) |
| 7:30 AM to 7:59 AM | 936 (10.5%) | 808 (12.6%) |
| 8:00 AM to 8:29 AM | 846 (9.5%) | 737 (11.5%) |
| 8:30 AM to 8:59 AM | 601 (6.7%) | 833 (13.0%) |
| 9:00 AM to 9:59 AM | 522 (5.8%) | 719 (11.3%) |
| 10:00 AM to 10:59 AM | 60 (0.7%) | 323 (5.1%) |
| 11:00 AM to 11:59 AM | 76 (0.9%) | 118 (1.8%) |
| 12:00 PM to 3:59 PM | 758 (8.5%) | 289 (4.5%) |
| 4:00 PM to 11:59 PM | 740 (8.3%) | 332 (5.2%) |
| Total | 8,950 (100.0%) | 6,391 (100.0%) |
Housing Occupancy in Sterling
Occupancy by Ownership in Sterling
Of the total 9,659 dwellings in Sterling, owner-occupied units account for 7,165 (74.2%), while renter-occupied units make up 2,494 (25.8%).
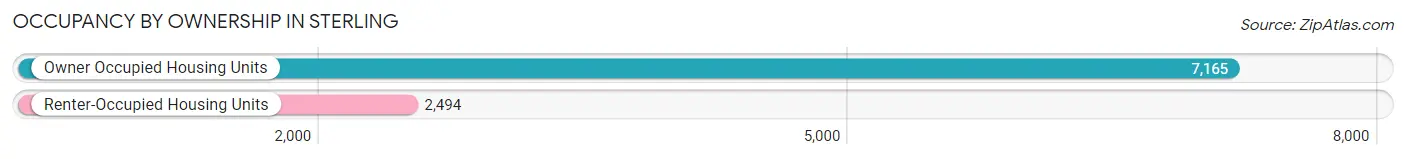
| Occupancy | # Housing Units | % Housing Units |
| Owner Occupied Housing Units | 7,165 | 74.2% |
| Renter-Occupied Housing Units | 2,494 | 25.8% |
| Total Occupied Housing Units | 9,659 | 100.0% |
Occupancy by Household Size in Sterling
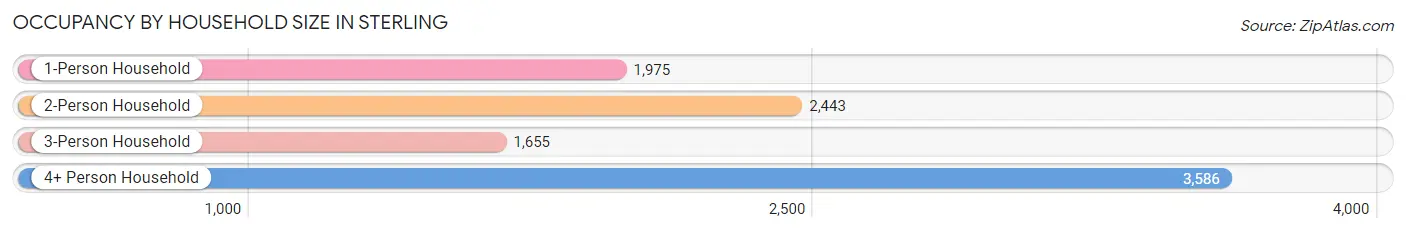
| Household Size | # Housing Units | % Housing Units |
| 1-Person Household | 1,975 | 20.4% |
| 2-Person Household | 2,443 | 25.3% |
| 3-Person Household | 1,655 | 17.1% |
| 4+ Person Household | 3,586 | 37.1% |
| Total Housing Units | 9,659 | 100.0% |
Occupancy by Ownership by Household Size in Sterling
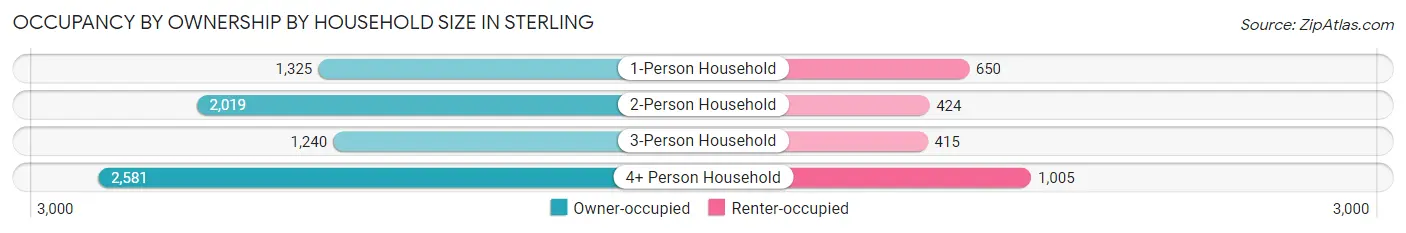
| Household Size | Owner-occupied | Renter-occupied |
| 1-Person Household | 1,325 (67.1%) | 650 (32.9%) |
| 2-Person Household | 2,019 (82.6%) | 424 (17.4%) |
| 3-Person Household | 1,240 (74.9%) | 415 (25.1%) |
| 4+ Person Household | 2,581 (72.0%) | 1,005 (28.0%) |
| Total Housing Units | 7,165 (74.2%) | 2,494 (25.8%) |
Occupancy by Educational Attainment in Sterling
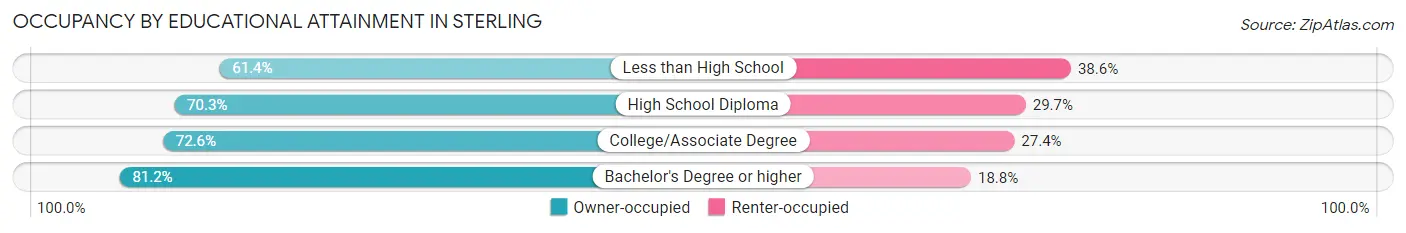
| Household Size | Owner-occupied | Renter-occupied |
| Less than High School | 949 (61.4%) | 597 (38.6%) |
| High School Diploma | 1,271 (70.3%) | 536 (29.7%) |
| College/Associate Degree | 1,478 (72.6%) | 558 (27.4%) |
| Bachelor's Degree or higher | 3,467 (81.2%) | 803 (18.8%) |
Occupancy by Age of Householder in Sterling
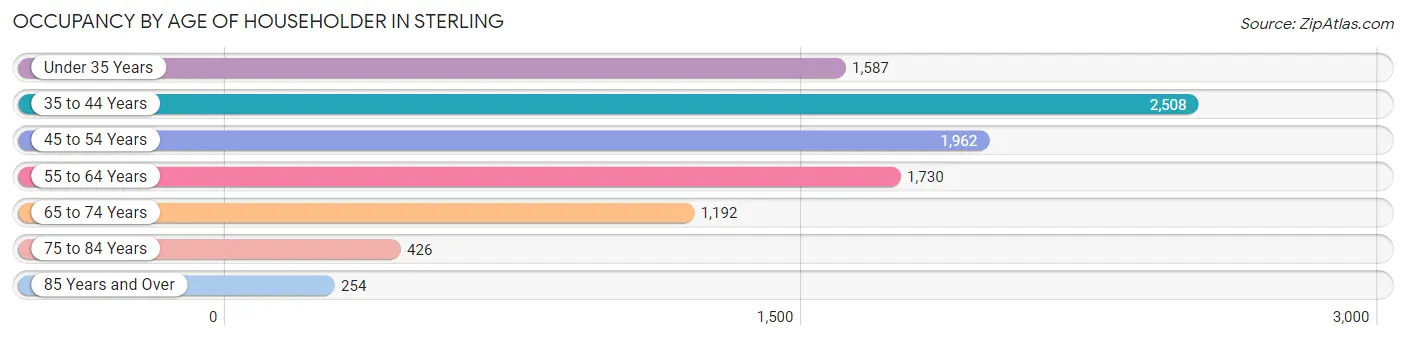
| Age Bracket | # Households | % Households |
| Under 35 Years | 1,587 | 16.4% |
| 35 to 44 Years | 2,508 | 26.0% |
| 45 to 54 Years | 1,962 | 20.3% |
| 55 to 64 Years | 1,730 | 17.9% |
| 65 to 74 Years | 1,192 | 12.3% |
| 75 to 84 Years | 426 | 4.4% |
| 85 Years and Over | 254 | 2.6% |
| Total | 9,659 | 100.0% |
Housing Finances in Sterling
Median Income by Occupancy in Sterling
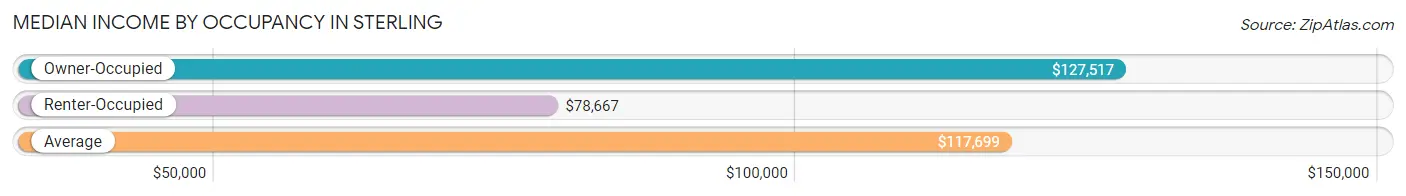
| Occupancy Type | # Households | Median Income |
| Owner-Occupied | 7,165 (74.2%) | $127,517 |
| Renter-Occupied | 2,494 (25.8%) | $78,667 |
| Average | 9,659 (100.0%) | $117,699 |
Occupancy by Householder Income Bracket in Sterling
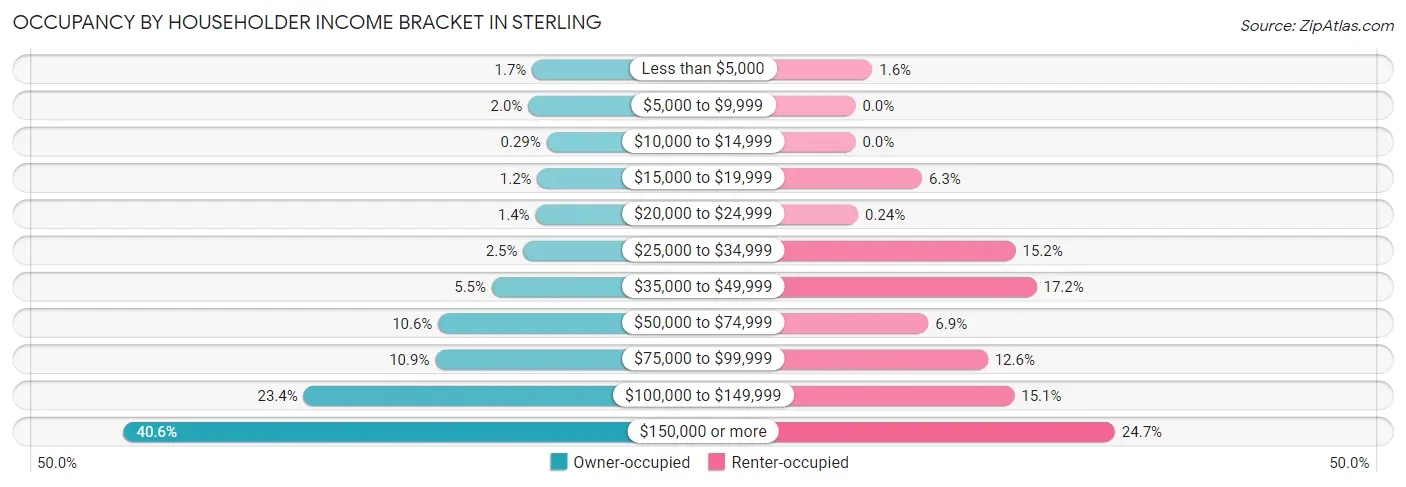
| Income Bracket | Owner-occupied | Renter-occupied |
| Less than $5,000 | 119 (1.7%) | 40 (1.6%) |
| $5,000 to $9,999 | 146 (2.0%) | 0 (0.0%) |
| $10,000 to $14,999 | 21 (0.3%) | 0 (0.0%) |
| $15,000 to $19,999 | 83 (1.2%) | 158 (6.3%) |
| $20,000 to $24,999 | 97 (1.3%) | 6 (0.2%) |
| $25,000 to $34,999 | 179 (2.5%) | 380 (15.2%) |
| $35,000 to $49,999 | 394 (5.5%) | 430 (17.2%) |
| $50,000 to $74,999 | 760 (10.6%) | 173 (6.9%) |
| $75,000 to $99,999 | 780 (10.9%) | 314 (12.6%) |
| $100,000 to $149,999 | 1,679 (23.4%) | 377 (15.1%) |
| $150,000 or more | 2,907 (40.6%) | 616 (24.7%) |
| Total | 7,165 (100.0%) | 2,494 (100.0%) |
Monthly Housing Cost Tiers in Sterling
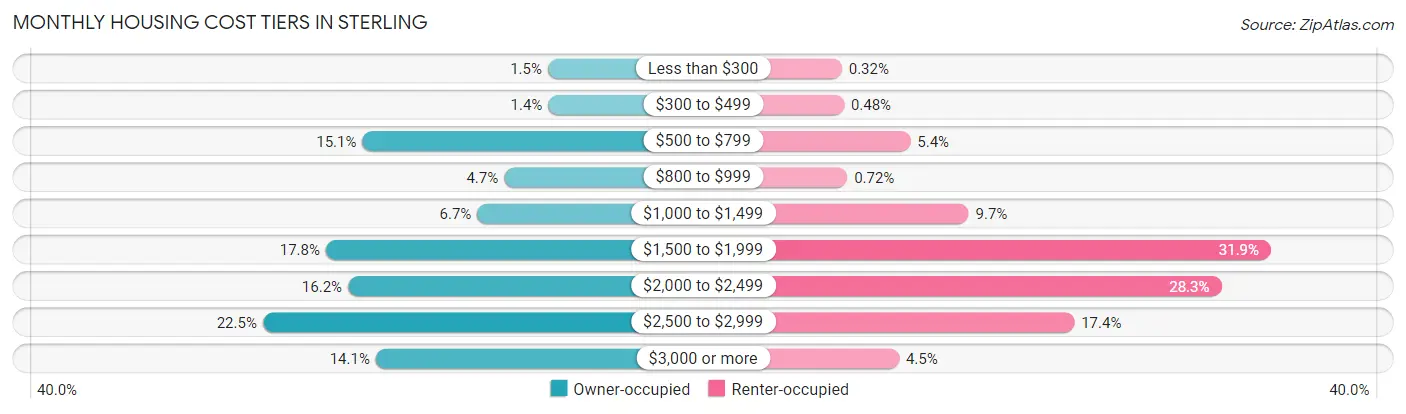
| Monthly Cost | Owner-occupied | Renter-occupied |
| Less than $300 | 105 (1.5%) | 8 (0.3%) |
| $300 to $499 | 103 (1.4%) | 12 (0.5%) |
| $500 to $799 | 1,084 (15.1%) | 134 (5.4%) |
| $800 to $999 | 336 (4.7%) | 18 (0.7%) |
| $1,000 to $1,499 | 478 (6.7%) | 241 (9.7%) |
| $1,500 to $1,999 | 1,277 (17.8%) | 796 (31.9%) |
| $2,000 to $2,499 | 1,160 (16.2%) | 705 (28.3%) |
| $2,500 to $2,999 | 1,609 (22.5%) | 435 (17.4%) |
| $3,000 or more | 1,013 (14.1%) | 113 (4.5%) |
| Total | 7,165 (100.0%) | 2,494 (100.0%) |
Physical Housing Characteristics in Sterling
Housing Structures in Sterling
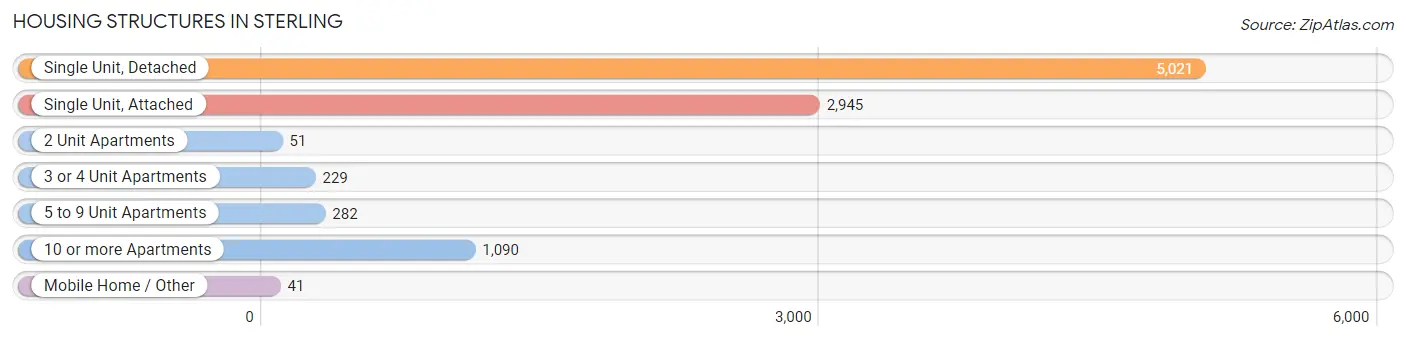
| Structure Type | # Housing Units | % Housing Units |
| Single Unit, Detached | 5,021 | 52.0% |
| Single Unit, Attached | 2,945 | 30.5% |
| 2 Unit Apartments | 51 | 0.5% |
| 3 or 4 Unit Apartments | 229 | 2.4% |
| 5 to 9 Unit Apartments | 282 | 2.9% |
| 10 or more Apartments | 1,090 | 11.3% |
| Mobile Home / Other | 41 | 0.4% |
| Total | 9,659 | 100.0% |
Housing Structures by Occupancy in Sterling
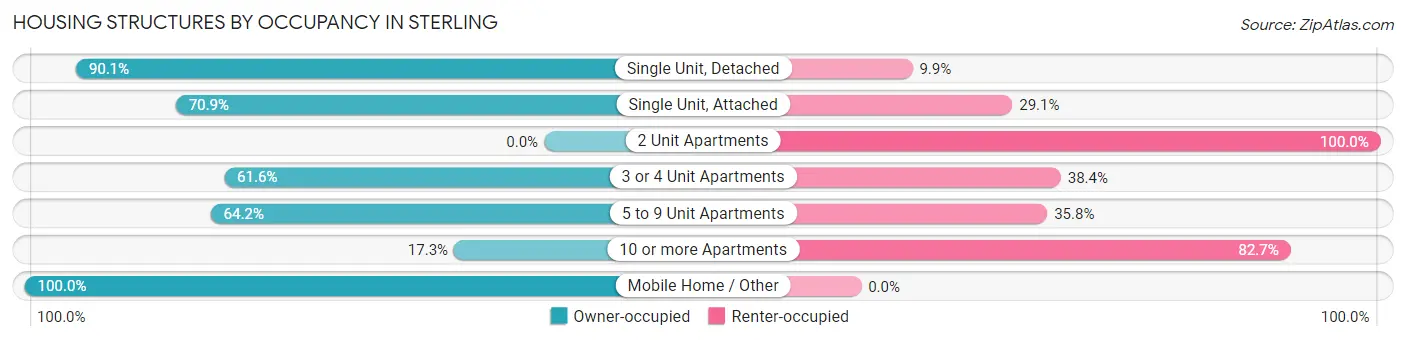
| Structure Type | Owner-occupied | Renter-occupied |
| Single Unit, Detached | 4,525 (90.1%) | 496 (9.9%) |
| Single Unit, Attached | 2,088 (70.9%) | 857 (29.1%) |
| 2 Unit Apartments | 0 (0.0%) | 51 (100.0%) |
| 3 or 4 Unit Apartments | 141 (61.6%) | 88 (38.4%) |
| 5 to 9 Unit Apartments | 181 (64.2%) | 101 (35.8%) |
| 10 or more Apartments | 189 (17.3%) | 901 (82.7%) |
| Mobile Home / Other | 41 (100.0%) | 0 (0.0%) |
| Total | 7,165 (74.2%) | 2,494 (25.8%) |
Housing Structures by Number of Rooms in Sterling
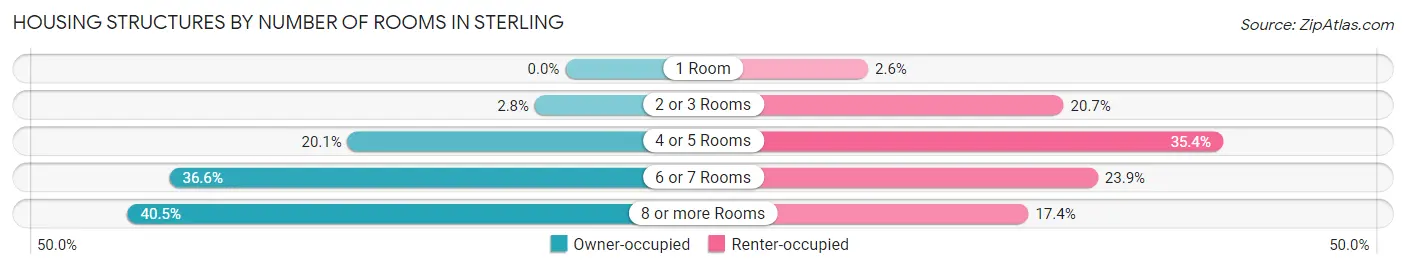
| Number of Rooms | Owner-occupied | Renter-occupied |
| 1 Room | 0 (0.0%) | 65 (2.6%) |
| 2 or 3 Rooms | 201 (2.8%) | 516 (20.7%) |
| 4 or 5 Rooms | 1,442 (20.1%) | 883 (35.4%) |
| 6 or 7 Rooms | 2,622 (36.6%) | 595 (23.9%) |
| 8 or more Rooms | 2,900 (40.5%) | 435 (17.4%) |
| Total | 7,165 (100.0%) | 2,494 (100.0%) |
Housing Structure by Heating Type in Sterling
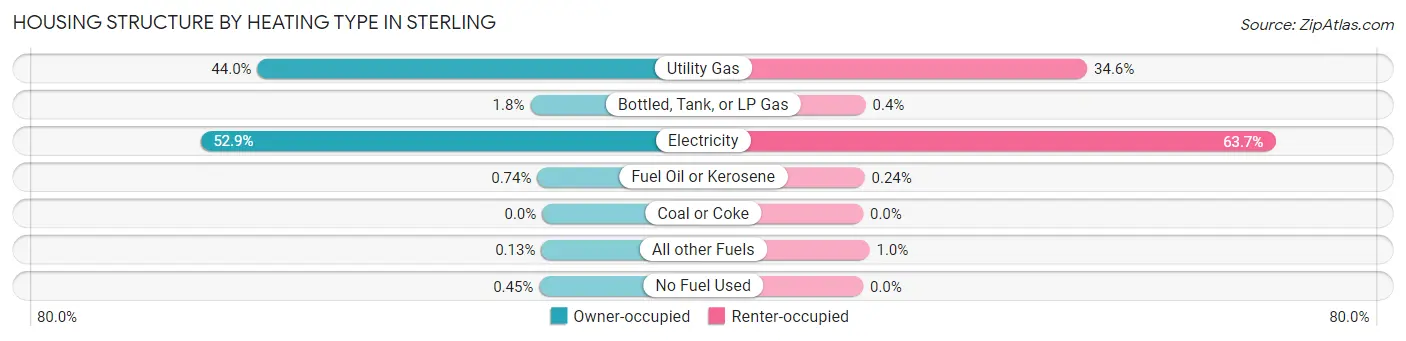
| Heating Type | Owner-occupied | Renter-occupied |
| Utility Gas | 3,153 (44.0%) | 864 (34.6%) |
| Bottled, Tank, or LP Gas | 131 (1.8%) | 10 (0.4%) |
| Electricity | 3,787 (52.8%) | 1,589 (63.7%) |
| Fuel Oil or Kerosene | 53 (0.7%) | 6 (0.2%) |
| Coal or Coke | 0 (0.0%) | 0 (0.0%) |
| All other Fuels | 9 (0.1%) | 25 (1.0%) |
| No Fuel Used | 32 (0.4%) | 0 (0.0%) |
| Total | 7,165 (100.0%) | 2,494 (100.0%) |
Household Vehicle Usage in Sterling
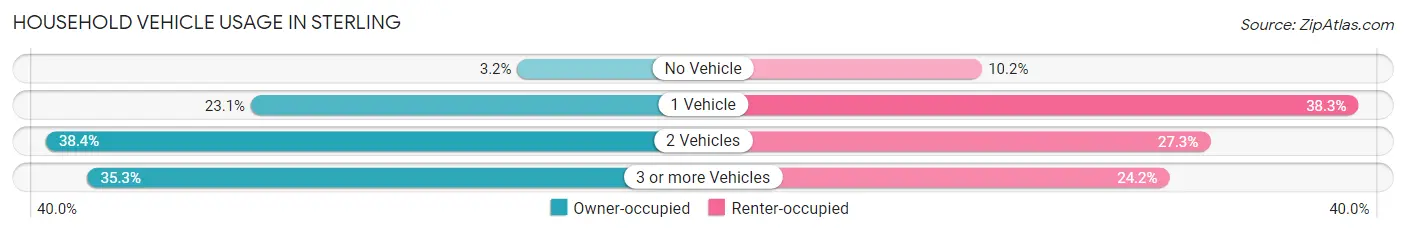
| Vehicles per Household | Owner-occupied | Renter-occupied |
| No Vehicle | 229 (3.2%) | 254 (10.2%) |
| 1 Vehicle | 1,655 (23.1%) | 956 (38.3%) |
| 2 Vehicles | 2,752 (38.4%) | 680 (27.3%) |
| 3 or more Vehicles | 2,529 (35.3%) | 604 (24.2%) |
| Total | 7,165 (100.0%) | 2,494 (100.0%) |
Real Estate & Mortgages in Sterling
Real Estate and Mortgage Overview in Sterling
| Characteristic | Without Mortgage | With Mortgage |
| Housing Units | 1,645 | 5,520 |
| Median Property Value | $427,800 | $468,400 |
| Median Household Income | $86,875 | $2,449 |
| Monthly Housing Costs | $673 | $1,013 |
| Real Estate Taxes | $4,084 | $87 |
Property Value by Mortgage Status in Sterling
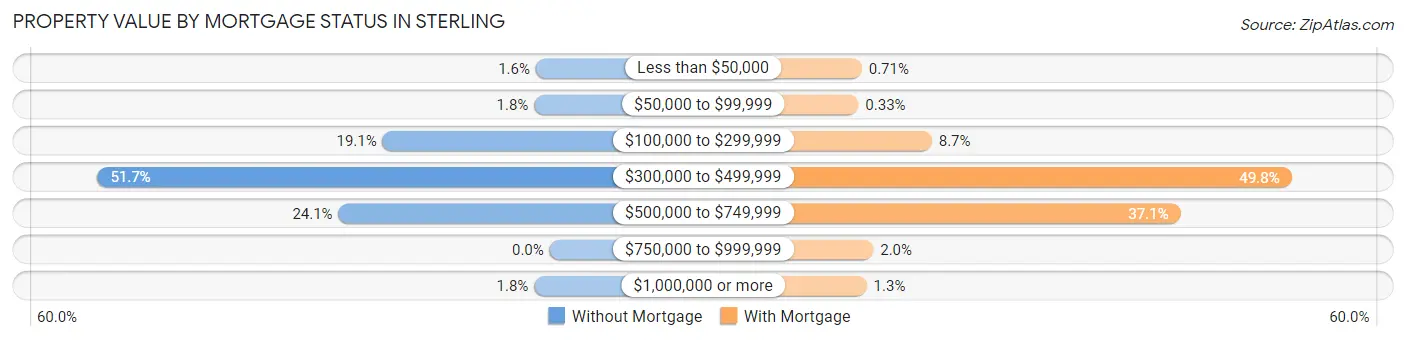
| Property Value | Without Mortgage | With Mortgage |
| Less than $50,000 | 26 (1.6%) | 39 (0.7%) |
| $50,000 to $99,999 | 29 (1.8%) | 18 (0.3%) |
| $100,000 to $299,999 | 314 (19.1%) | 481 (8.7%) |
| $300,000 to $499,999 | 850 (51.7%) | 2,750 (49.8%) |
| $500,000 to $749,999 | 397 (24.1%) | 2,050 (37.1%) |
| $750,000 to $999,999 | 0 (0.0%) | 112 (2.0%) |
| $1,000,000 or more | 29 (1.8%) | 70 (1.3%) |
| Total | 1,645 (100.0%) | 5,520 (100.0%) |
Household Income by Mortgage Status in Sterling
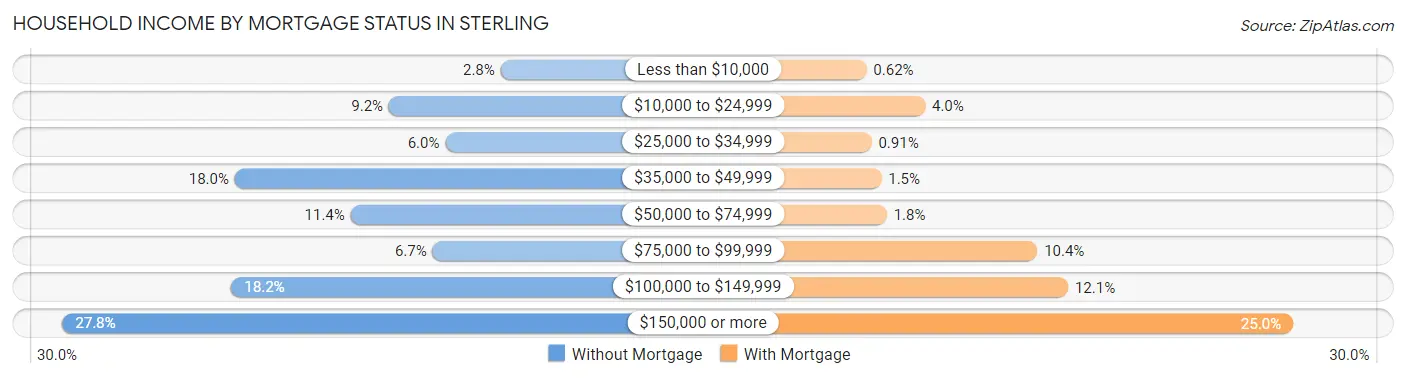
| Household Income | Without Mortgage | With Mortgage |
| Less than $10,000 | 46 (2.8%) | 34 (0.6%) |
| $10,000 to $24,999 | 151 (9.2%) | 219 (4.0%) |
| $25,000 to $34,999 | 98 (6.0%) | 50 (0.9%) |
| $35,000 to $49,999 | 296 (18.0%) | 81 (1.5%) |
| $50,000 to $74,999 | 187 (11.4%) | 98 (1.8%) |
| $75,000 to $99,999 | 110 (6.7%) | 573 (10.4%) |
| $100,000 to $149,999 | 299 (18.2%) | 670 (12.1%) |
| $150,000 or more | 458 (27.8%) | 1,380 (25.0%) |
| Total | 1,645 (100.0%) | 5,520 (100.0%) |
Property Value to Household Income Ratio in Sterling
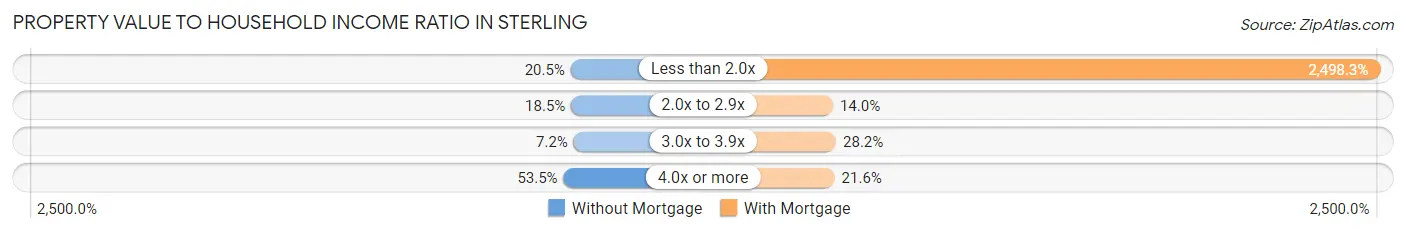
| Value-to-Income Ratio | Without Mortgage | With Mortgage |
| Less than 2.0x | 337 (20.5%) | 137,908 (2,498.3%) |
| 2.0x to 2.9x | 304 (18.5%) | 770 (14.0%) |
| 3.0x to 3.9x | 118 (7.2%) | 1,556 (28.2%) |
| 4.0x or more | 880 (53.5%) | 1,191 (21.6%) |
| Total | 1,645 (100.0%) | 5,520 (100.0%) |
Real Estate Taxes by Mortgage Status in Sterling
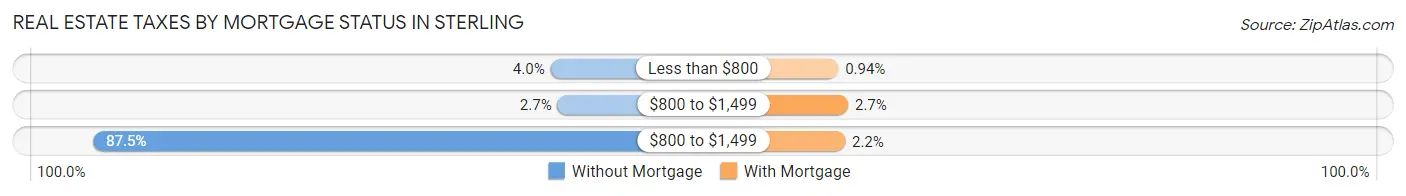
| Property Taxes | Without Mortgage | With Mortgage |
| Less than $800 | 65 (4.0%) | 52 (0.9%) |
| $800 to $1,499 | 44 (2.7%) | 151 (2.7%) |
| $800 to $1,499 | 1,439 (87.5%) | 121 (2.2%) |
| Total | 1,645 (100.0%) | 5,520 (100.0%) |
Health & Disability in Sterling
Health Insurance Coverage by Age in Sterling
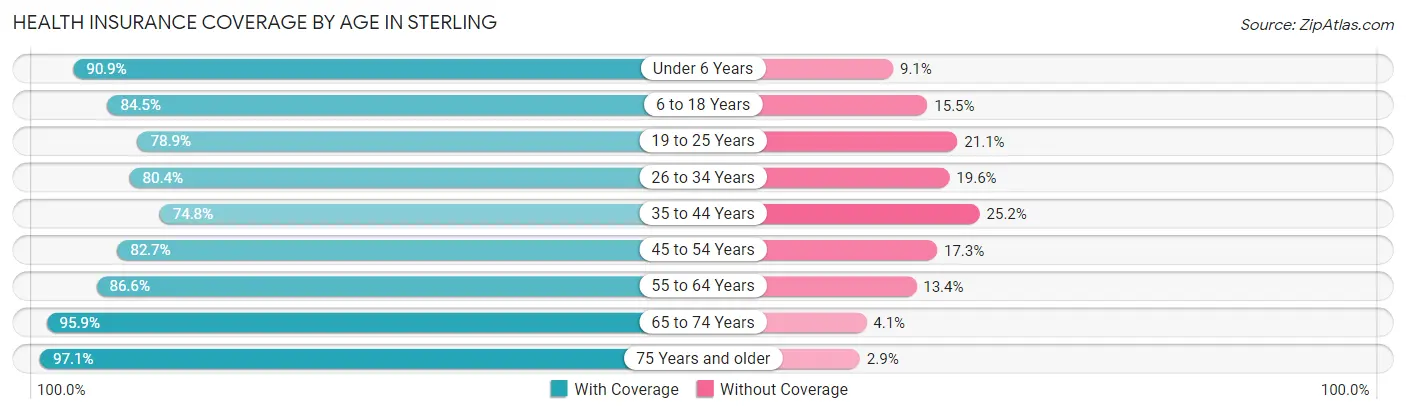
| Age Bracket | With Coverage | Without Coverage |
| Under 6 Years | 2,449 (90.9%) | 245 (9.1%) |
| 6 to 18 Years | 4,451 (84.5%) | 816 (15.5%) |
| 19 to 25 Years | 2,566 (78.9%) | 686 (21.1%) |
| 26 to 34 Years | 3,147 (80.4%) | 767 (19.6%) |
| 35 to 44 Years | 4,000 (74.8%) | 1,350 (25.2%) |
| 45 to 54 Years | 3,091 (82.7%) | 646 (17.3%) |
| 55 to 64 Years | 2,897 (86.6%) | 449 (13.4%) |
| 65 to 74 Years | 2,100 (95.9%) | 90 (4.1%) |
| 75 Years and older | 1,036 (97.1%) | 31 (2.9%) |
| Total | 25,737 (83.5%) | 5,080 (16.5%) |
Health Insurance Coverage by Citizenship Status in Sterling
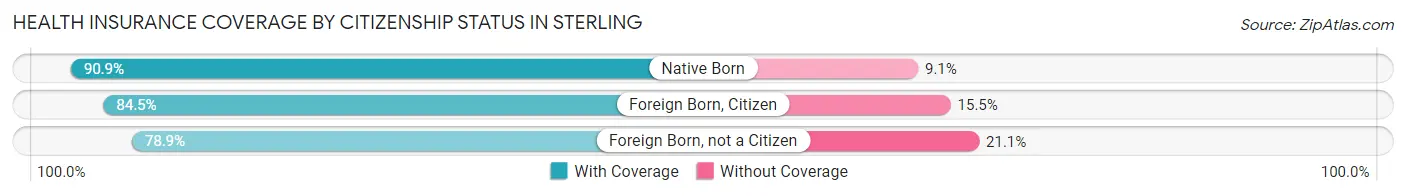
| Citizenship Status | With Coverage | Without Coverage |
| Native Born | 2,449 (90.9%) | 245 (9.1%) |
| Foreign Born, Citizen | 4,451 (84.5%) | 816 (15.5%) |
| Foreign Born, not a Citizen | 2,566 (78.9%) | 686 (21.1%) |
Health Insurance Coverage by Household Income in Sterling
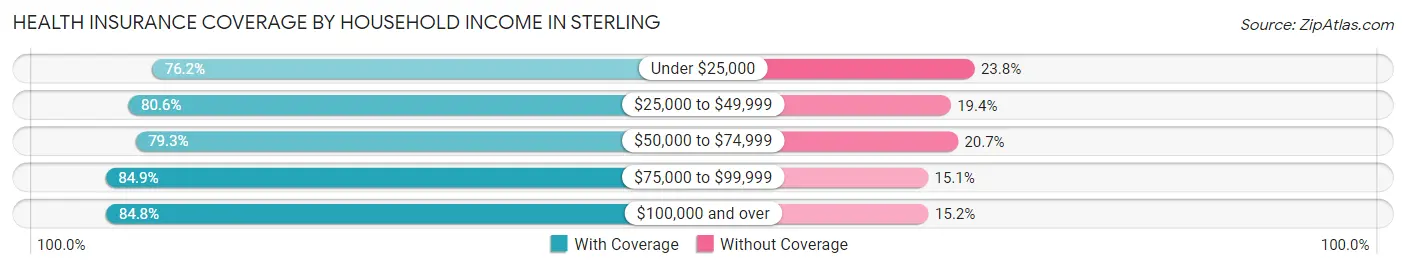
| Household Income | With Coverage | Without Coverage |
| Under $25,000 | 962 (76.2%) | 301 (23.8%) |
| $25,000 to $49,999 | 2,355 (80.6%) | 566 (19.4%) |
| $50,000 to $74,999 | 2,321 (79.3%) | 607 (20.7%) |
| $75,000 to $99,999 | 2,895 (84.9%) | 516 (15.1%) |
| $100,000 and over | 17,194 (84.8%) | 3,090 (15.2%) |
Public vs Private Health Insurance Coverage by Age in Sterling
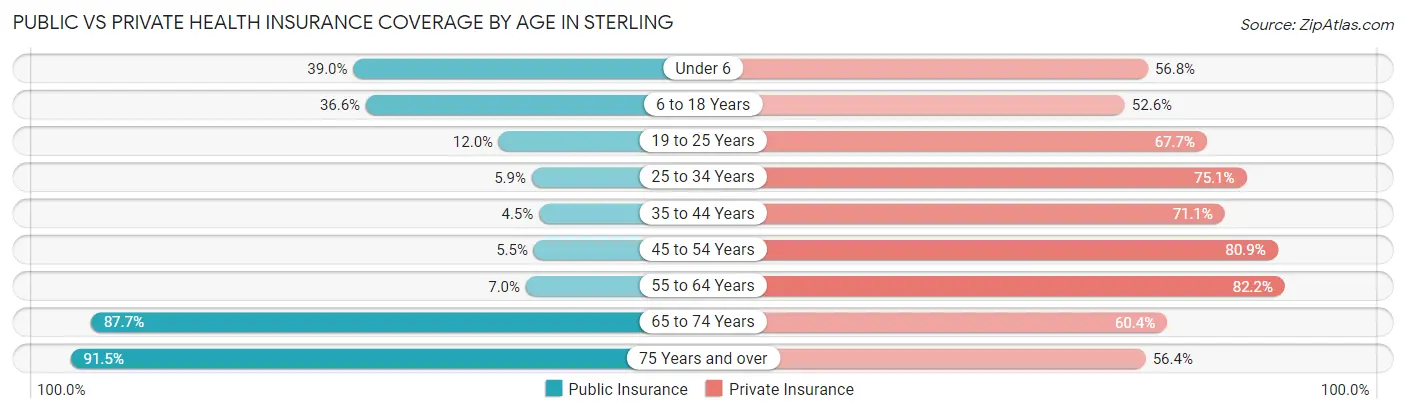
| Age Bracket | Public Insurance | Private Insurance |
| Under 6 | 1,050 (39.0%) | 1,531 (56.8%) |
| 6 to 18 Years | 1,930 (36.6%) | 2,768 (52.5%) |
| 19 to 25 Years | 389 (12.0%) | 2,203 (67.7%) |
| 25 to 34 Years | 229 (5.9%) | 2,939 (75.1%) |
| 35 to 44 Years | 241 (4.5%) | 3,802 (71.1%) |
| 45 to 54 Years | 205 (5.5%) | 3,022 (80.9%) |
| 55 to 64 Years | 233 (7.0%) | 2,751 (82.2%) |
| 65 to 74 Years | 1,921 (87.7%) | 1,322 (60.4%) |
| 75 Years and over | 976 (91.5%) | 602 (56.4%) |
| Total | 7,174 (23.3%) | 20,940 (67.9%) |
Disability Status by Sex by Age in Sterling
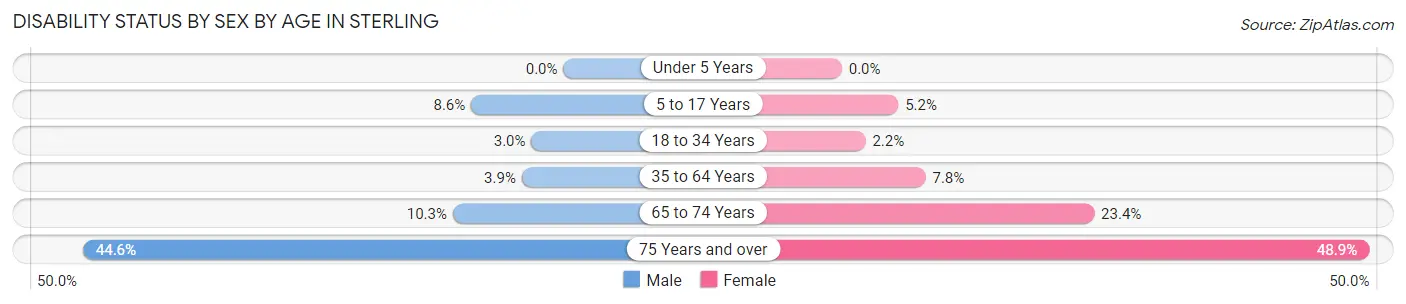
| Age Bracket | Male | Female |
| Under 5 Years | 0 (0.0%) | 0 (0.0%) |
| 5 to 17 Years | 221 (8.6%) | 140 (5.2%) |
| 18 to 34 Years | 122 (3.0%) | 78 (2.2%) |
| 35 to 64 Years | 234 (3.9%) | 495 (7.8%) |
| 65 to 74 Years | 134 (10.3%) | 207 (23.4%) |
| 75 Years and over | 206 (44.6%) | 296 (48.9%) |
Disability Class by Sex by Age in Sterling
Disability Class: Hearing Difficulty
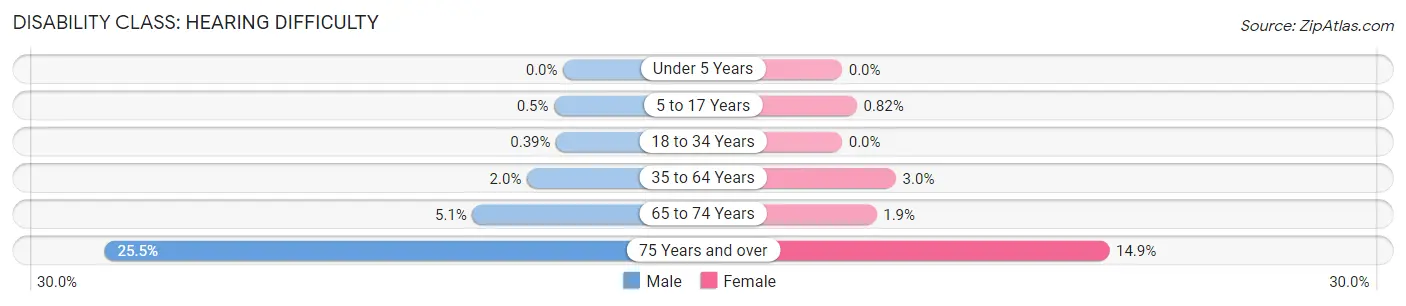
| Age Bracket | Male | Female |
| Under 5 Years | 0 (0.0%) | 0 (0.0%) |
| 5 to 17 Years | 13 (0.5%) | 22 (0.8%) |
| 18 to 34 Years | 16 (0.4%) | 0 (0.0%) |
| 35 to 64 Years | 122 (2.0%) | 191 (3.0%) |
| 65 to 74 Years | 66 (5.1%) | 17 (1.9%) |
| 75 Years and over | 118 (25.5%) | 90 (14.9%) |
Disability Class: Vision Difficulty
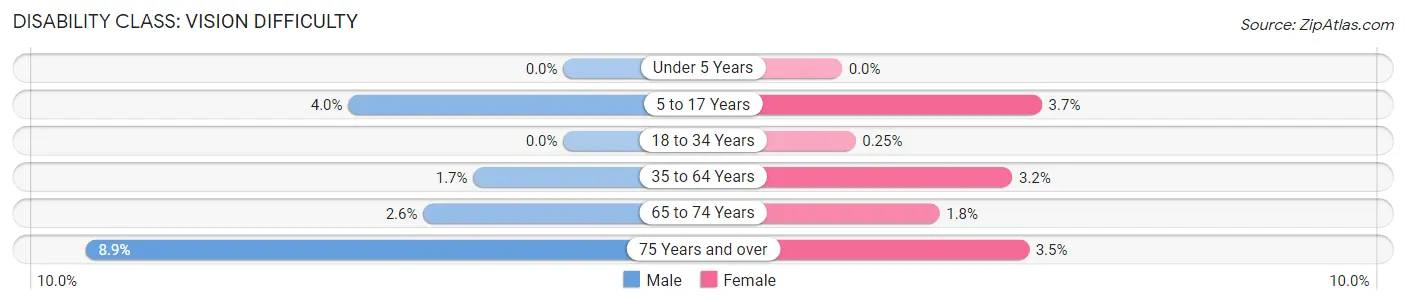
| Age Bracket | Male | Female |
| Under 5 Years | 0 (0.0%) | 0 (0.0%) |
| 5 to 17 Years | 103 (4.0%) | 99 (3.7%) |
| 18 to 34 Years | 0 (0.0%) | 9 (0.3%) |
| 35 to 64 Years | 101 (1.7%) | 201 (3.2%) |
| 65 to 74 Years | 34 (2.6%) | 16 (1.8%) |
| 75 Years and over | 41 (8.9%) | 21 (3.5%) |
Disability Class: Cognitive Difficulty
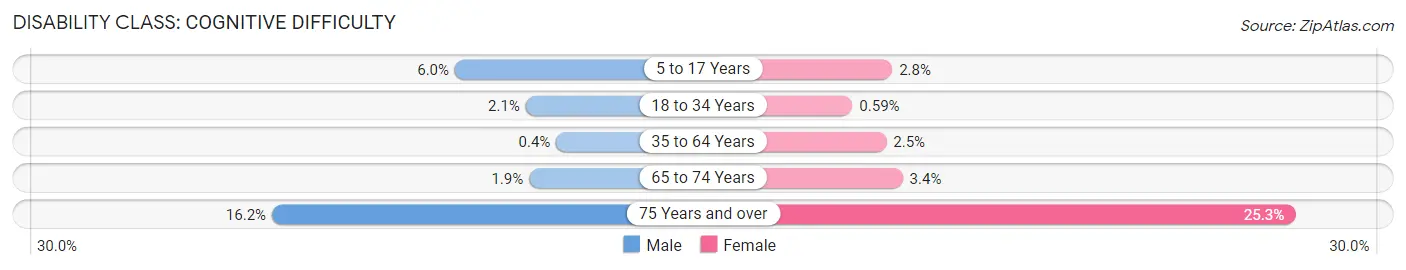
| Age Bracket | Male | Female |
| 5 to 17 Years | 156 (6.0%) | 75 (2.8%) |
| 18 to 34 Years | 86 (2.1%) | 21 (0.6%) |
| 35 to 64 Years | 24 (0.4%) | 158 (2.5%) |
| 65 to 74 Years | 25 (1.9%) | 30 (3.4%) |
| 75 Years and over | 75 (16.2%) | 153 (25.3%) |
Disability Class: Ambulatory Difficulty
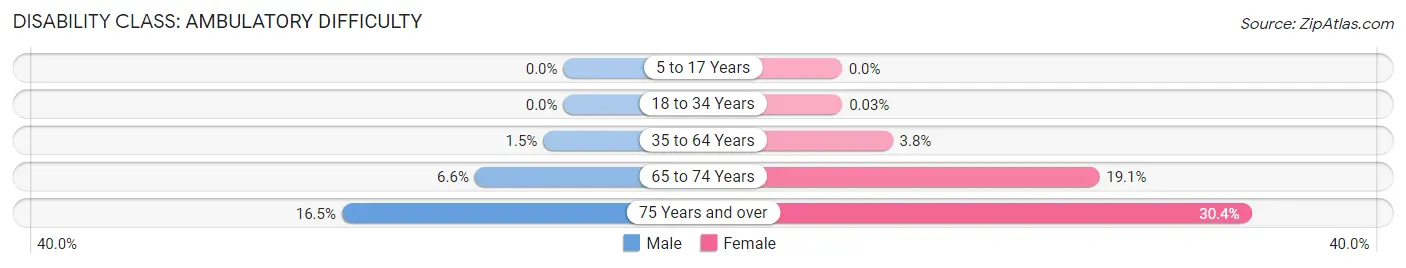
| Age Bracket | Male | Female |
| 5 to 17 Years | 0 (0.0%) | 0 (0.0%) |
| 18 to 34 Years | 0 (0.0%) | 1 (0.0%) |
| 35 to 64 Years | 91 (1.5%) | 240 (3.8%) |
| 65 to 74 Years | 86 (6.6%) | 169 (19.1%) |
| 75 Years and over | 76 (16.5%) | 184 (30.4%) |
Disability Class: Self-Care Difficulty
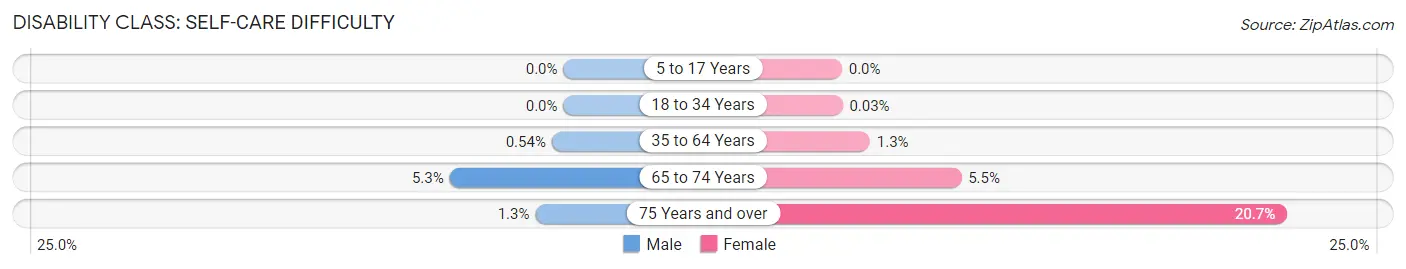
| Age Bracket | Male | Female |
| 5 to 17 Years | 0 (0.0%) | 0 (0.0%) |
| 18 to 34 Years | 0 (0.0%) | 1 (0.0%) |
| 35 to 64 Years | 33 (0.5%) | 83 (1.3%) |
| 65 to 74 Years | 69 (5.3%) | 49 (5.5%) |
| 75 Years and over | 6 (1.3%) | 125 (20.7%) |
Technology Access in Sterling
Computing Device Access in Sterling
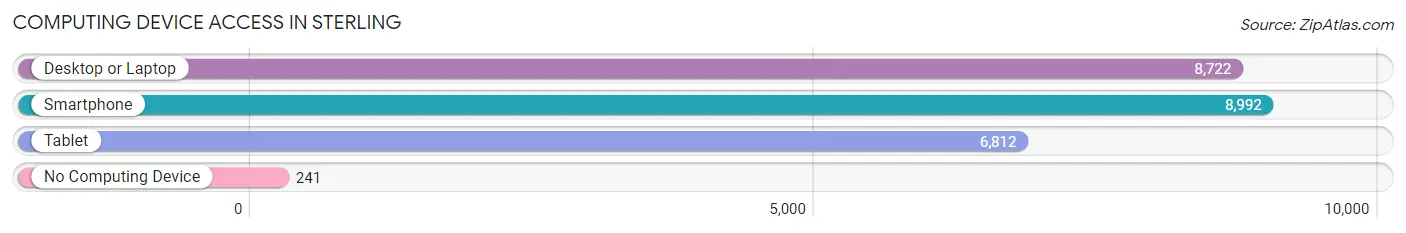
| Device Type | # Households | % Households |
| Desktop or Laptop | 8,722 | 90.3% |
| Smartphone | 8,992 | 93.1% |
| Tablet | 6,812 | 70.5% |
| No Computing Device | 241 | 2.5% |
| Total | 9,659 | 100.0% |
Internet Access in Sterling
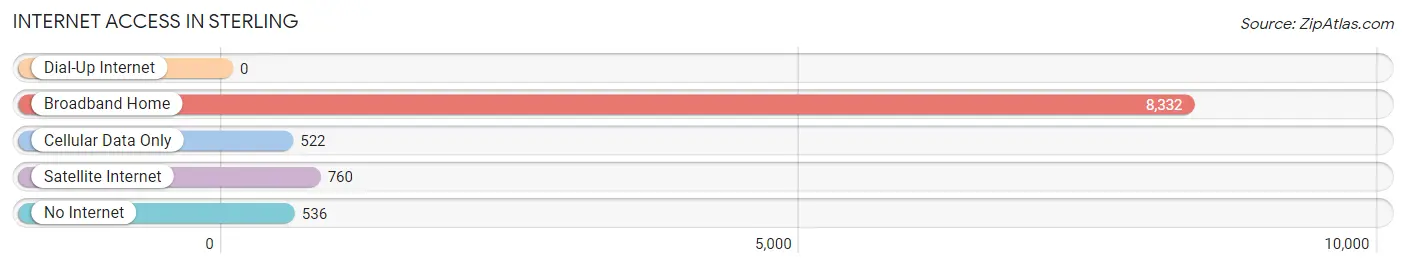
| Internet Type | # Households | % Households |
| Dial-Up Internet | 0 | 0.0% |
| Broadband Home | 8,332 | 86.3% |
| Cellular Data Only | 522 | 5.4% |
| Satellite Internet | 760 | 7.9% |
| No Internet | 536 | 5.6% |
| Total | 9,659 | 100.0% |
Sterling Summary
Sterling, Virginia is a census-designated place (CDP) located in Loudoun County, Virginia. It is located approximately 25 miles northwest of Washington, D.C. and is part of the Washington metropolitan area. As of the 2010 census, the population of Sterling was 27,822.
History
Sterling was first settled in the early 1700s by European settlers. The area was originally known as “Sterling” after the nearby Sterling Store, which was established in 1760. The store was named after the English town of Sterling, Scotland. The area was primarily used for farming and was home to a number of small villages.
In the late 1800s, the area began to experience rapid growth due to the construction of the Washington and Old Dominion Railroad. The railroad connected the area to Washington, D.C. and other nearby cities. This allowed for the development of a number of businesses and industries in the area.
In the early 1900s, the area was incorporated as the Town of Sterling. The town was named after the nearby Sterling Store. The town was home to a number of businesses, including a post office, a bank, a hotel, and a number of stores.
In the late 1960s, the area began to experience rapid growth due to the construction of Dulles International Airport. The airport brought a number of new businesses and industries to the area, as well as an influx of new residents.
In the late 1990s, the area was reincorporated as the CDP of Sterling. The CDP was created in order to provide better services to the growing population.
Geography
Sterling is located in Loudoun County, Virginia. It is located approximately 25 miles northwest of Washington, D.C. and is part of the Washington metropolitan area. The CDP has a total area of 8.3 square miles, all of which is land.
The CDP is located in the Piedmont region of Virginia. The terrain is mostly flat, with some rolling hills. The area is home to a number of parks and recreational areas, including Claude Moore Park, Sterling Park, and Algonkian Regional Park.
Economy
Sterling is home to a number of businesses and industries. The largest employers in the area include Dulles International Airport, the U.S. Department of Defense, and the U.S. Department of Homeland Security. The area is also home to a number of technology companies, including Oracle, Microsoft, and Verizon.
The area is also home to a number of retail stores, restaurants, and other businesses. The area is home to a number of shopping centers, including Dulles Town Center and Dulles 28 Centre.
Demographics
As of the 2010 census, the population of Sterling was 27,822. The racial makeup of the CDP was 68.3% White, 15.2% Asian, 8.2% African American, and 4.3% Hispanic or Latino.
The median household income in Sterling was $107,837, and the median family income was $118,945. The per capita income in Sterling was $41,945. The unemployment rate in Sterling was 3.2%.
Common Questions
What is Per Capita Income in Sterling?
Per Capita income in Sterling is $44,054.
What is the Median Family Income in Sterling?
Median Family Income in Sterling is $128,241.
What is the Median Household income in Sterling?
Median Household Income in Sterling is $117,699.
What is Income or Wage Gap in Sterling?
Income or Wage Gap in Sterling is 30.7%.
Women in Sterling earn 69.3 cents for every dollar earned by a man.
What is Family Income Deficit in Sterling?
Family Income Deficit in Sterling is $10,472.
Families that are below poverty line in Sterling earn $10,472 less on average than the poverty threshold level.
What is Inequality or Gini Index in Sterling?
Inequality or Gini Index in Sterling is 0.41.
What is the Total Population of Sterling?
Total Population of Sterling is 31,058.
What is the Total Male Population of Sterling?
Total Male Population of Sterling is 15,853.
What is the Total Female Population of Sterling?
Total Female Population of Sterling is 15,205.
What is the Ratio of Males per 100 Females in Sterling?
There are 104.26 Males per 100 Females in Sterling.
What is the Ratio of Females per 100 Males in Sterling?
There are 95.91 Females per 100 Males in Sterling.
What is the Median Population Age in Sterling?
Median Population Age in Sterling is 35.4 Years.
What is the Average Family Size in Sterling
Average Family Size in Sterling is 3.6 People.
What is the Average Household Size in Sterling
Average Household Size in Sterling is 3.2 People.
How Large is the Labor Force in Sterling?
There are 18,542 People in the Labor Forcein in Sterling.
What is the Percentage of People in the Labor Force in Sterling?
75.3% of People are in the Labor Force in Sterling.
What is the Unemployment Rate in Sterling?
Unemployment Rate in Sterling is 5.0%.