Triangle, VA Map & Demographics
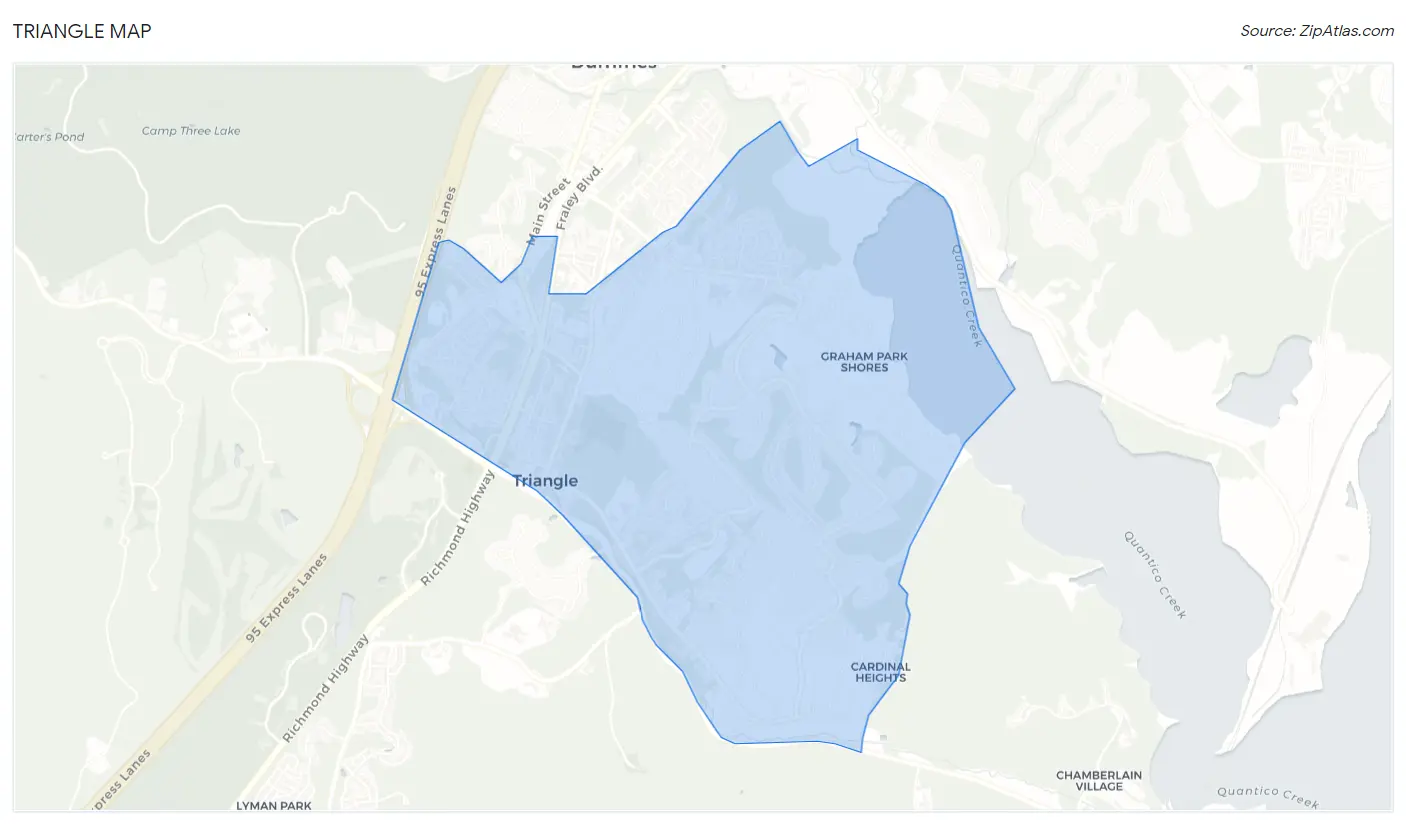
Triangle Map
Triangle Overview
$42,772
PER CAPITA INCOME
$128,772
AVG FAMILY INCOME
$108,229
AVG HOUSEHOLD INCOME
7.9%
WAGE / INCOME GAP [ % ]
92.1¢/ $1
WAGE / INCOME GAP [ $ ]
0.41
INEQUALITY / GINI INDEX
10,886
TOTAL POPULATION
5,959
MALE POPULATION
4,927
FEMALE POPULATION
120.95
MALES / 100 FEMALES
82.68
FEMALES / 100 MALES
33.8
MEDIAN AGE
3.9
AVG FAMILY SIZE
3.3
AVG HOUSEHOLD SIZE
5,886
LABOR FORCE [ PEOPLE ]
68.7%
PERCENT IN LABOR FORCE
9.4%
UNEMPLOYMENT RATE
Triangle Zip Codes
Income in Triangle
Income Overview in Triangle
Per Capita Income in Triangle is $42,772, while median incomes of families and households are $128,772 and $108,229 respectively.
| Characteristic | Number | Measure |
| Per Capita Income | 10,886 | $42,772 |
| Median Family Income | 2,400 | $128,772 |
| Mean Family Income | 2,400 | $145,989 |
| Median Household Income | 3,293 | $108,229 |
| Mean Household Income | 3,293 | $132,920 |
| Income Deficit | 2,400 | $0 |
| Wage / Income Gap (%) | 10,886 | 7.85% |
| Wage / Income Gap ($) | 10,886 | 92.15¢ per $1 |
| Gini / Inequality Index | 10,886 | 0.41 |
Earnings by Sex in Triangle
Average Earnings in Triangle are $44,993, $46,747 for men and $43,076 for women, a difference of 7.9%.
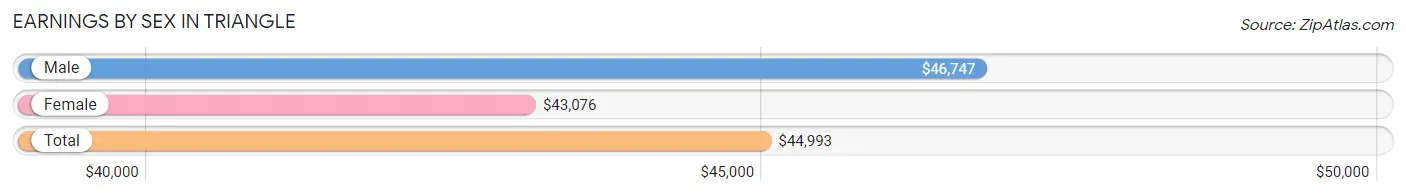
| Sex | Number | Average Earnings |
| Male | 3,482 (55.5%) | $46,747 |
| Female | 2,795 (44.5%) | $43,076 |
| Total | 6,277 (100.0%) | $44,993 |
Earnings by Sex by Income Bracket in Triangle
The most common earnings brackets in Triangle are $100,000+ for men (858 | 24.6%) and $100,000+ for women (547 | 19.6%).
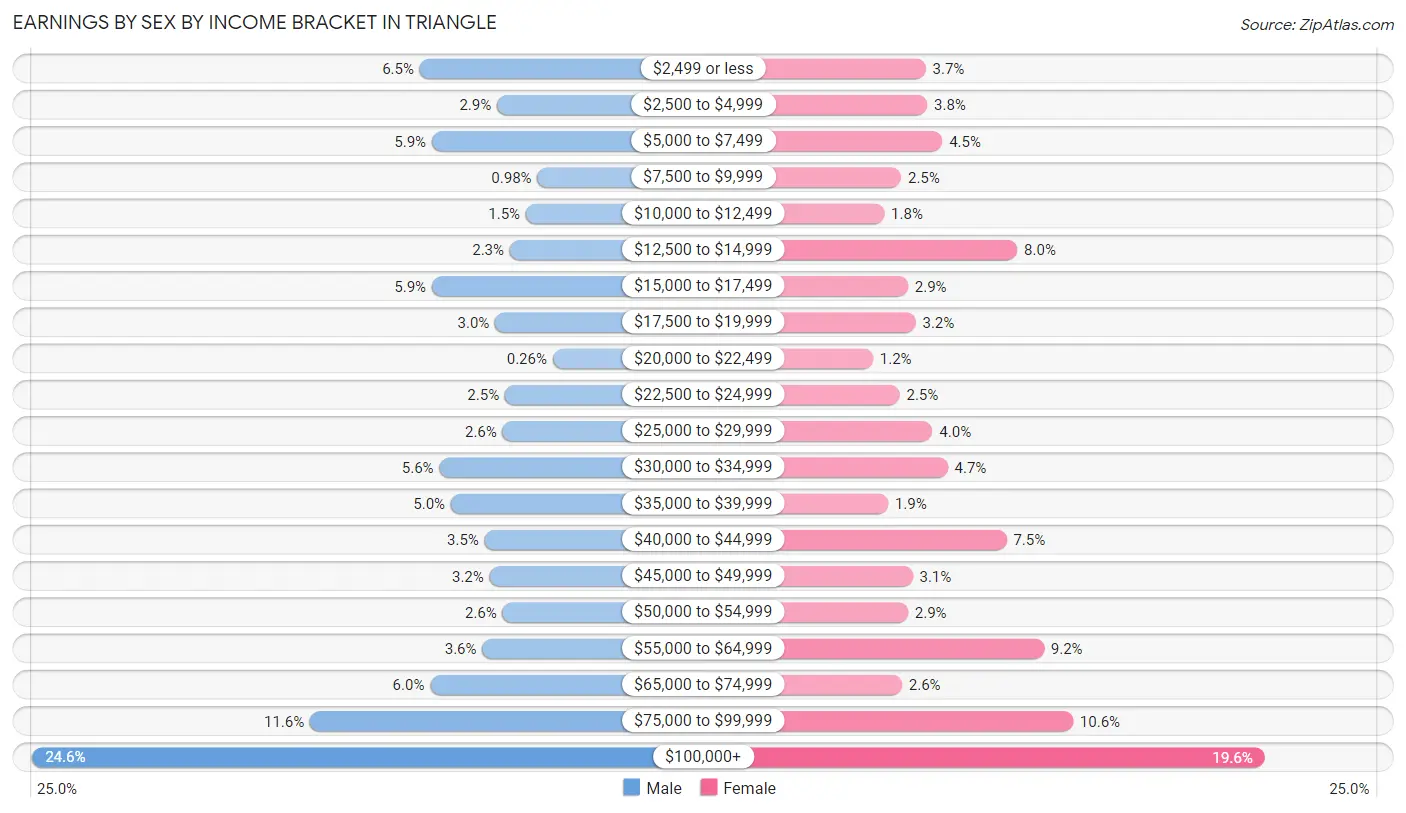
| Income | Male | Female |
| $2,499 or less | 226 (6.5%) | 103 (3.7%) |
| $2,500 to $4,999 | 100 (2.9%) | 105 (3.8%) |
| $5,000 to $7,499 | 206 (5.9%) | 125 (4.5%) |
| $7,500 to $9,999 | 34 (1.0%) | 71 (2.5%) |
| $10,000 to $12,499 | 53 (1.5%) | 49 (1.8%) |
| $12,500 to $14,999 | 79 (2.3%) | 223 (8.0%) |
| $15,000 to $17,499 | 206 (5.9%) | 80 (2.9%) |
| $17,500 to $19,999 | 103 (3.0%) | 90 (3.2%) |
| $20,000 to $22,499 | 9 (0.3%) | 34 (1.2%) |
| $22,500 to $24,999 | 87 (2.5%) | 69 (2.5%) |
| $25,000 to $29,999 | 91 (2.6%) | 112 (4.0%) |
| $30,000 to $34,999 | 194 (5.6%) | 132 (4.7%) |
| $35,000 to $39,999 | 175 (5.0%) | 54 (1.9%) |
| $40,000 to $44,999 | 120 (3.5%) | 209 (7.5%) |
| $45,000 to $49,999 | 112 (3.2%) | 86 (3.1%) |
| $50,000 to $54,999 | 91 (2.6%) | 80 (2.9%) |
| $55,000 to $64,999 | 124 (3.6%) | 258 (9.2%) |
| $65,000 to $74,999 | 209 (6.0%) | 72 (2.6%) |
| $75,000 to $99,999 | 405 (11.6%) | 296 (10.6%) |
| $100,000+ | 858 (24.6%) | 547 (19.6%) |
| Total | 3,482 (100.0%) | 2,795 (100.0%) |
Earnings by Sex by Educational Attainment in Triangle
Average earnings in Triangle are $62,986 for men and $49,722 for women, a difference of 21.1%. Men with an educational attainment of graduate degree enjoy the highest average annual earnings of $92,500, while those with less than high school education earn the least with $38,599. Women with an educational attainment of graduate degree earn the most with the average annual earnings of $92,886, while those with high school diploma education have the smallest earnings of $24,879.
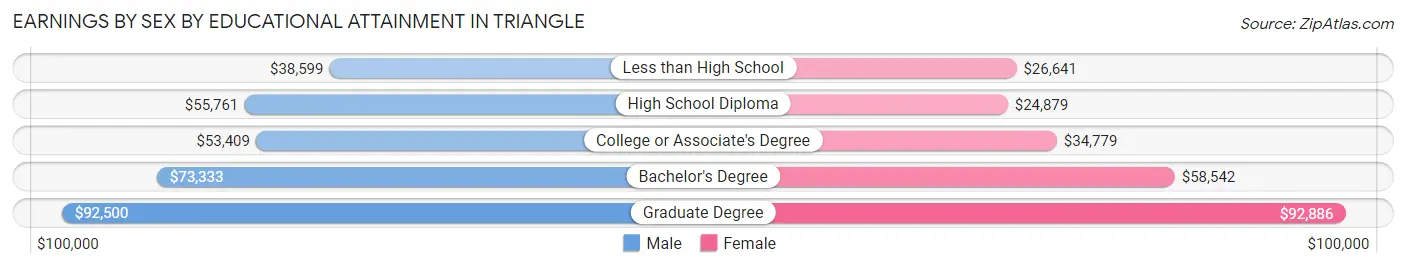
| Educational Attainment | Male Income | Female Income |
| Less than High School | $38,599 | $26,641 |
| High School Diploma | $55,761 | $24,879 |
| College or Associate's Degree | $53,409 | $34,779 |
| Bachelor's Degree | $73,333 | $58,542 |
| Graduate Degree | $92,500 | $92,886 |
| Total | $62,986 | $49,722 |
Family Income in Triangle
Family Income Brackets in Triangle
According to the Triangle family income data, there are 550 families falling into the $100,000 to $149,999 income range, which is the most common income bracket and makes up 22.9% of all families. Conversely, the $10,000 to $14,999 income bracket is the least frequent group with only 10 families (0.4%) belonging to this category.
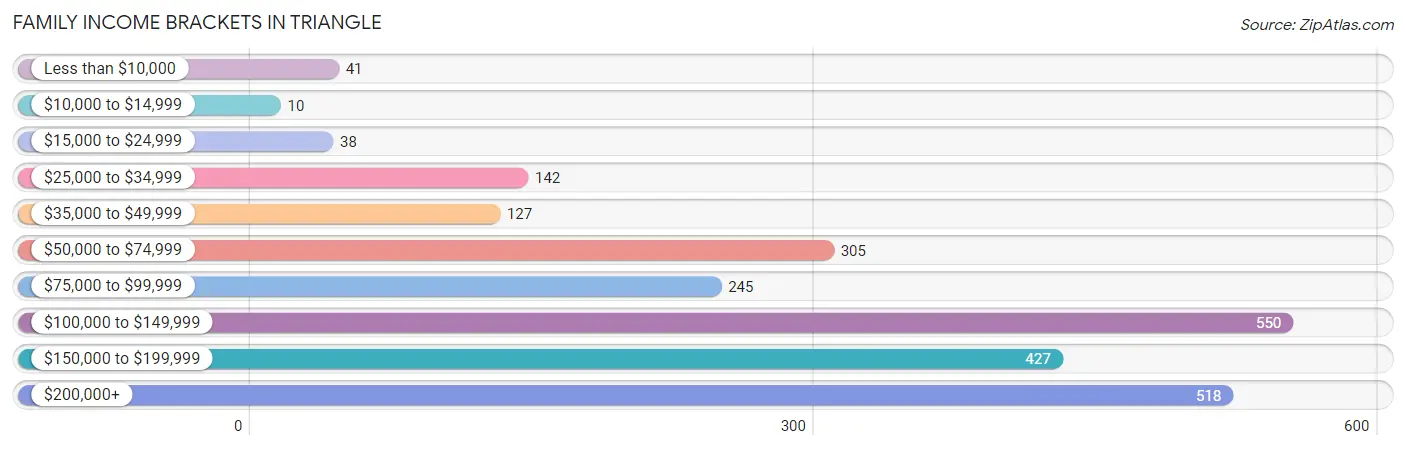
| Income Bracket | # Families | % Families |
| Less than $10,000 | 41 | 1.7% |
| $10,000 to $14,999 | 10 | 0.4% |
| $15,000 to $24,999 | 38 | 1.6% |
| $25,000 to $34,999 | 142 | 5.9% |
| $35,000 to $49,999 | 127 | 5.3% |
| $50,000 to $74,999 | 305 | 12.7% |
| $75,000 to $99,999 | 245 | 10.2% |
| $100,000 to $149,999 | 550 | 22.9% |
| $150,000 to $199,999 | 427 | 17.8% |
| $200,000+ | 518 | 21.6% |
Family Income by Famaliy Size in Triangle
7+ person families (106 | 4.4%) account for the highest median family income in Triangle with $196,231 per family, while 2-person families (743 | 31.0%) have the highest median income of $50,312 per family member.
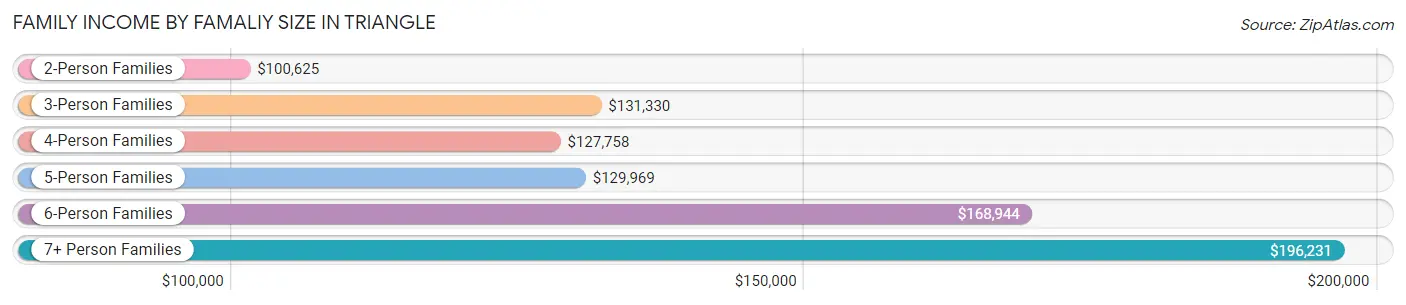
| Income Bracket | # Families | Median Income |
| 2-Person Families | 743 (31.0%) | $100,625 |
| 3-Person Families | 497 (20.7%) | $131,330 |
| 4-Person Families | 563 (23.5%) | $127,758 |
| 5-Person Families | 355 (14.8%) | $129,969 |
| 6-Person Families | 136 (5.7%) | $168,944 |
| 7+ Person Families | 106 (4.4%) | $196,231 |
| Total | 2,400 (100.0%) | $128,772 |
Family Income by Number of Earners in Triangle
The median family income in Triangle is $128,772, with families comprising 3+ earners (544) having the highest median family income of $169,342, while families with 1 earner (443) have the lowest median family income of $61,101, accounting for 22.7% and 18.5% of families, respectively.
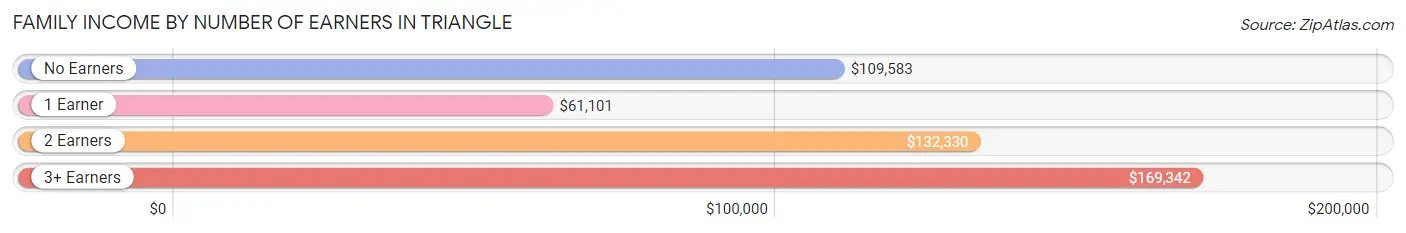
| Number of Earners | # Families | Median Income |
| No Earners | 280 (11.7%) | $109,583 |
| 1 Earner | 443 (18.5%) | $61,101 |
| 2 Earners | 1,133 (47.2%) | $132,330 |
| 3+ Earners | 544 (22.7%) | $169,342 |
| Total | 2,400 (100.0%) | $128,772 |
Household Income in Triangle
Household Income Brackets in Triangle
With 741 households falling in the category, the $100,000 to $149,999 income range is the most frequent in Triangle, accounting for 22.5% of all households. In contrast, only 43 households (1.3%) fall into the $10,000 to $14,999 income bracket, making it the least populous group.
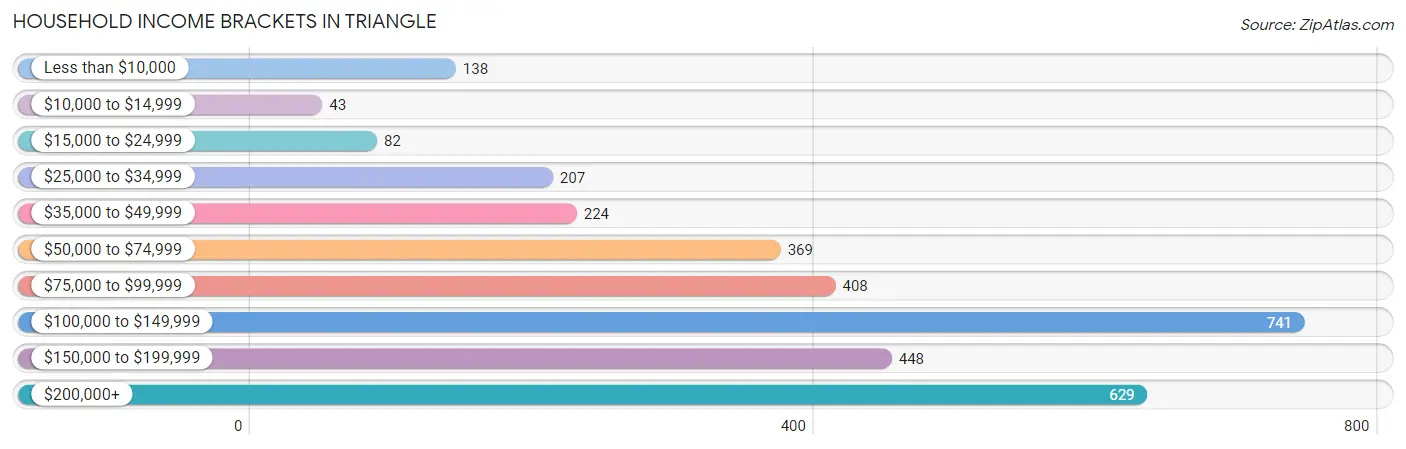
| Income Bracket | # Households | % Households |
| Less than $10,000 | 138 | 4.2% |
| $10,000 to $14,999 | 43 | 1.3% |
| $15,000 to $24,999 | 82 | 2.5% |
| $25,000 to $34,999 | 207 | 6.3% |
| $35,000 to $49,999 | 224 | 6.8% |
| $50,000 to $74,999 | 369 | 11.2% |
| $75,000 to $99,999 | 408 | 12.4% |
| $100,000 to $149,999 | 741 | 22.5% |
| $150,000 to $199,999 | 448 | 13.6% |
| $200,000+ | 629 | 19.1% |
Household Income by Householder Age in Triangle
The median household income in Triangle is $108,229, with the highest median household income of $143,676 found in the 45 to 64 years age bracket for the primary householder. A total of 1,366 households (41.5%) fall into this category. Meanwhile, the 15 to 24 years age bracket for the primary householder has the lowest median household income of $0, with 77 households (2.3%) in this group.
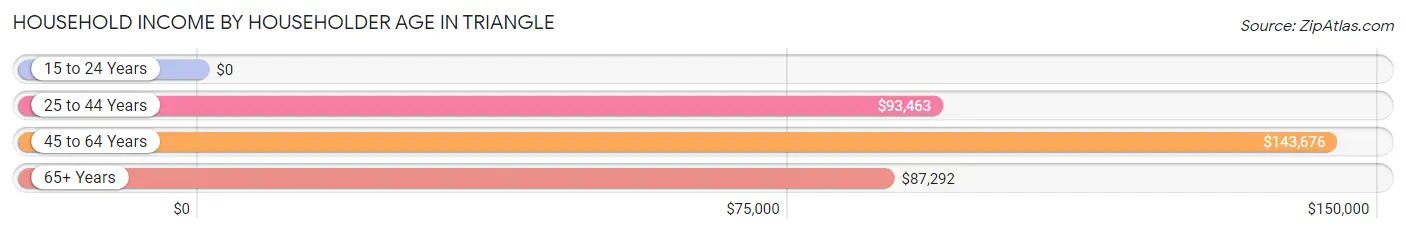
| Income Bracket | # Households | Median Income |
| 15 to 24 Years | 77 (2.3%) | $0 |
| 25 to 44 Years | 1,443 (43.8%) | $93,463 |
| 45 to 64 Years | 1,366 (41.5%) | $143,676 |
| 65+ Years | 407 (12.4%) | $87,292 |
| Total | 3,293 (100.0%) | $108,229 |
Poverty in Triangle
Income Below Poverty by Sex and Age in Triangle
With 10.8% poverty level for males and 8.4% for females among the residents of Triangle, 18 to 24 year old males and 65 to 74 year old females are the most vulnerable to poverty, with 182 males (29.9%) and 50 females (23.2%) in their respective age groups living below the poverty level.
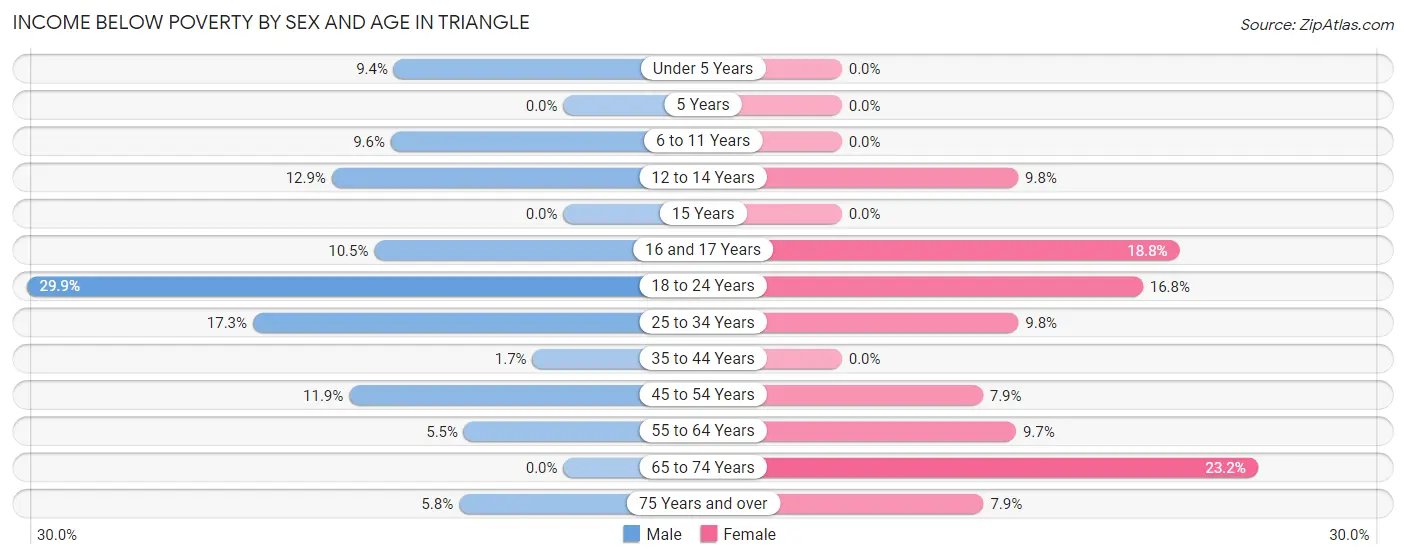
| Age Bracket | Male | Female |
| Under 5 Years | 61 (9.4%) | 0 (0.0%) |
| 5 Years | 0 (0.0%) | 0 (0.0%) |
| 6 to 11 Years | 32 (9.6%) | 0 (0.0%) |
| 12 to 14 Years | 32 (12.9%) | 16 (9.8%) |
| 15 Years | 0 (0.0%) | 0 (0.0%) |
| 16 and 17 Years | 24 (10.5%) | 47 (18.8%) |
| 18 to 24 Years | 182 (29.9%) | 90 (16.8%) |
| 25 to 34 Years | 161 (17.3%) | 80 (9.8%) |
| 35 to 44 Years | 16 (1.7%) | 0 (0.0%) |
| 45 to 54 Years | 81 (11.9%) | 67 (7.9%) |
| 55 to 64 Years | 41 (5.5%) | 46 (9.7%) |
| 65 to 74 Years | 0 (0.0%) | 50 (23.2%) |
| 75 Years and over | 10 (5.8%) | 18 (7.9%) |
| Total | 640 (10.8%) | 414 (8.4%) |
Income Above Poverty by Sex and Age in Triangle
According to the poverty statistics in Triangle, males aged 5 years and females aged under 5 years are the age groups that are most secure financially, with 100.0% of males and 100.0% of females in these age groups living above the poverty line.
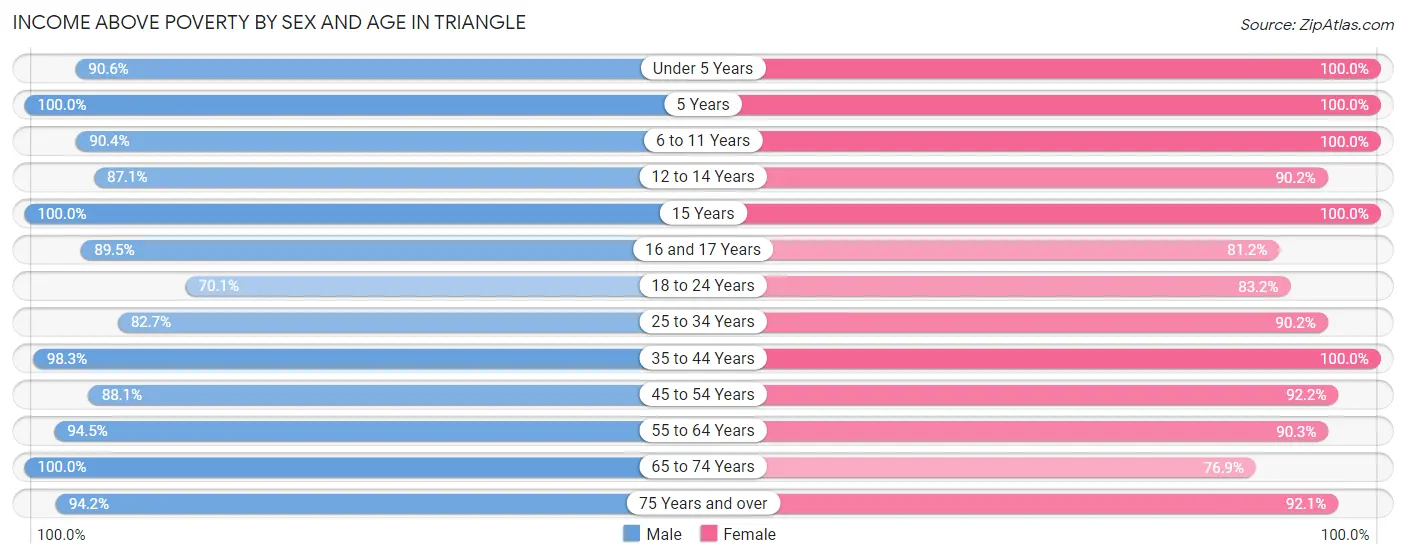
| Age Bracket | Male | Female |
| Under 5 Years | 585 (90.6%) | 245 (100.0%) |
| 5 Years | 52 (100.0%) | 35 (100.0%) |
| 6 to 11 Years | 301 (90.4%) | 338 (100.0%) |
| 12 to 14 Years | 216 (87.1%) | 147 (90.2%) |
| 15 Years | 157 (100.0%) | 69 (100.0%) |
| 16 and 17 Years | 204 (89.5%) | 203 (81.2%) |
| 18 to 24 Years | 427 (70.1%) | 447 (83.2%) |
| 25 to 34 Years | 770 (82.7%) | 734 (90.2%) |
| 35 to 44 Years | 915 (98.3%) | 697 (100.0%) |
| 45 to 54 Years | 598 (88.1%) | 787 (92.1%) |
| 55 to 64 Years | 699 (94.5%) | 428 (90.3%) |
| 65 to 74 Years | 207 (100.0%) | 166 (76.8%) |
| 75 Years and over | 162 (94.2%) | 210 (92.1%) |
| Total | 5,293 (89.2%) | 4,506 (91.6%) |
Income Below Poverty Among Married-Couple Families in Triangle
The poverty statistics for married-couple families in Triangle show that 4.4% or 85 of the total 1,923 families live below the poverty line. Families with 1 or 2 children have the highest poverty rate of 5.8%, comprising of 56 families. On the other hand, families with 3 or 4 children have the lowest poverty rate of 0.0%, which includes 0 families.
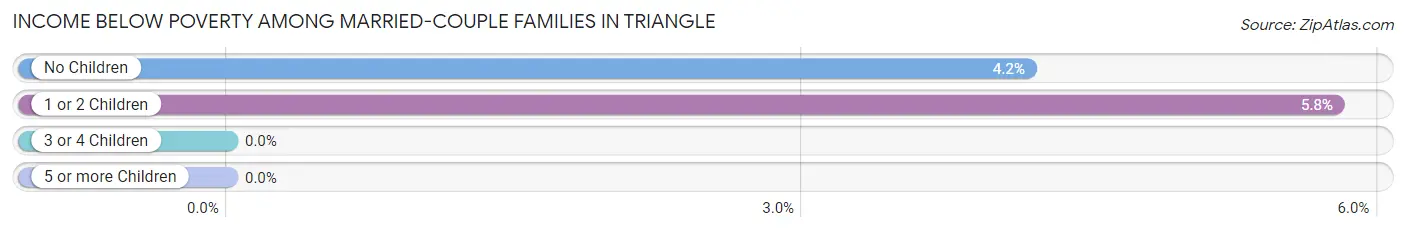
| Children | Above Poverty | Below Poverty |
| No Children | 666 (95.8%) | 29 (4.2%) |
| 1 or 2 Children | 913 (94.2%) | 56 (5.8%) |
| 3 or 4 Children | 230 (100.0%) | 0 (0.0%) |
| 5 or more Children | 29 (100.0%) | 0 (0.0%) |
| Total | 1,838 (95.6%) | 85 (4.4%) |
Income Below Poverty Among Single-Parent Households in Triangle
According to the poverty data in Triangle, 17.8% or 29 single-father households and 11.2% or 35 single-mother households are living below the poverty line. Among single-father households, those with 3 or 4 children have the highest poverty rate, with 29 households (100.0%) experiencing poverty. Likewise, among single-mother households, those with no children have the highest poverty rate, with 12 households (11.7%) falling below the poverty line.
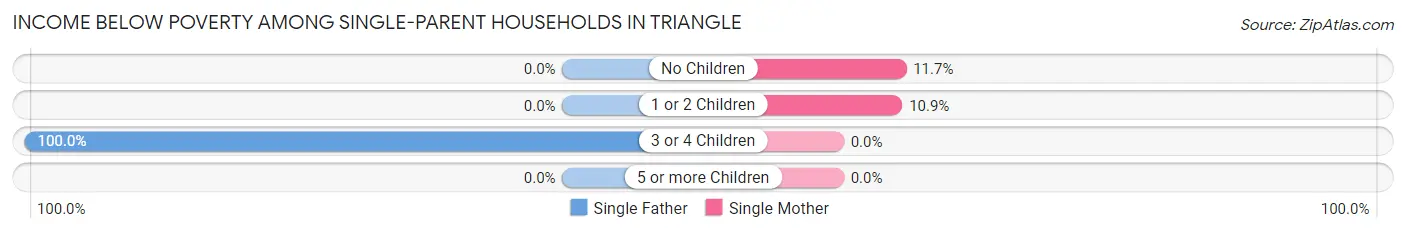
| Children | Single Father | Single Mother |
| No Children | 0 (0.0%) | 12 (11.7%) |
| 1 or 2 Children | 0 (0.0%) | 23 (10.9%) |
| 3 or 4 Children | 29 (100.0%) | 0 (0.0%) |
| 5 or more Children | 0 (0.0%) | 0 (0.0%) |
| Total | 29 (17.8%) | 35 (11.2%) |
Income Below Poverty Among Married-Couple vs Single-Parent Households in Triangle
The poverty data for Triangle shows that 85 of the married-couple family households (4.4%) and 64 of the single-parent households (13.4%) are living below the poverty level. Within the married-couple family households, those with 1 or 2 children have the highest poverty rate, with 56 households (5.8%) falling below the poverty line. Among the single-parent households, those with 3 or 4 children have the highest poverty rate, with 29 household (100.0%) living below poverty.
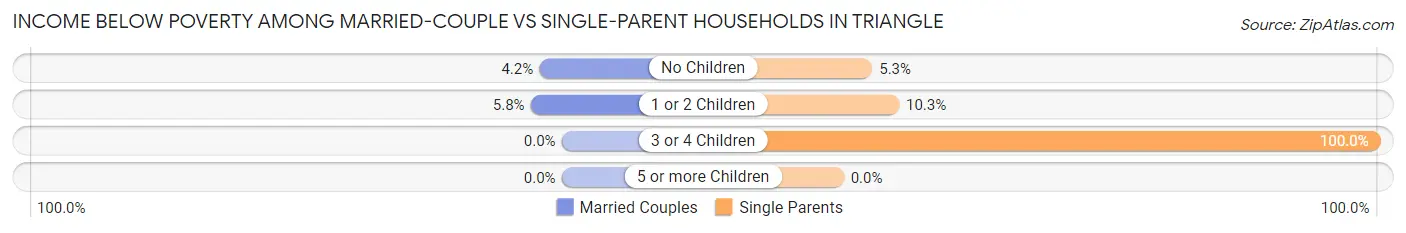
| Children | Married-Couple Families | Single-Parent Households |
| No Children | 29 (4.2%) | 12 (5.3%) |
| 1 or 2 Children | 56 (5.8%) | 23 (10.3%) |
| 3 or 4 Children | 0 (0.0%) | 29 (100.0%) |
| 5 or more Children | 0 (0.0%) | 0 (0.0%) |
| Total | 85 (4.4%) | 64 (13.4%) |
Race in Triangle
The most populous races in Triangle are Black / African American (4,030 | 37.0%), White / Caucasian (3,313 | 30.4%), and Hispanic or Latino (2,390 | 22.0%).
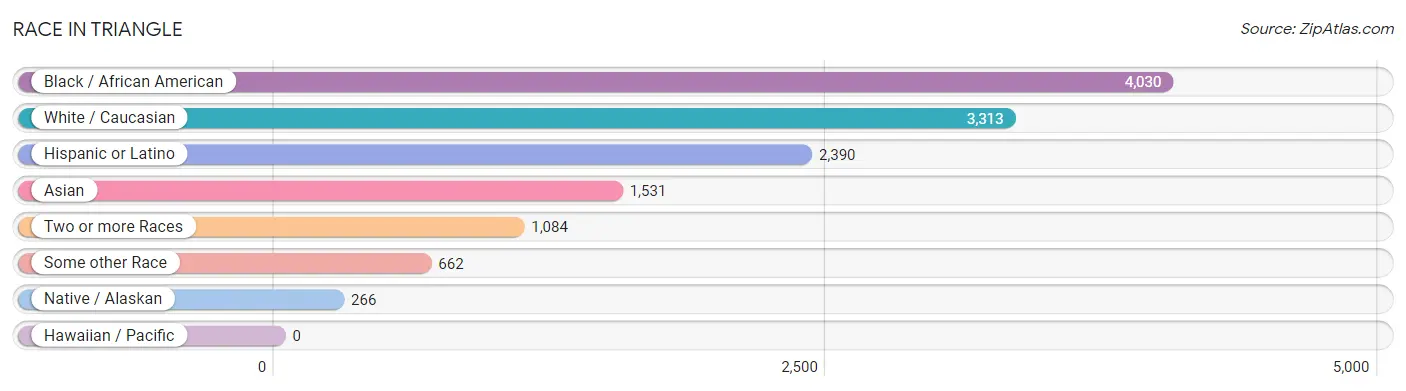
| Race | # Population | % Population |
| Asian | 1,531 | 14.1% |
| Black / African American | 4,030 | 37.0% |
| Hawaiian / Pacific | 0 | 0.0% |
| Hispanic or Latino | 2,390 | 22.0% |
| Native / Alaskan | 266 | 2.4% |
| White / Caucasian | 3,313 | 30.4% |
| Two or more Races | 1,084 | 10.0% |
| Some other Race | 662 | 6.1% |
| Total | 10,886 | 100.0% |
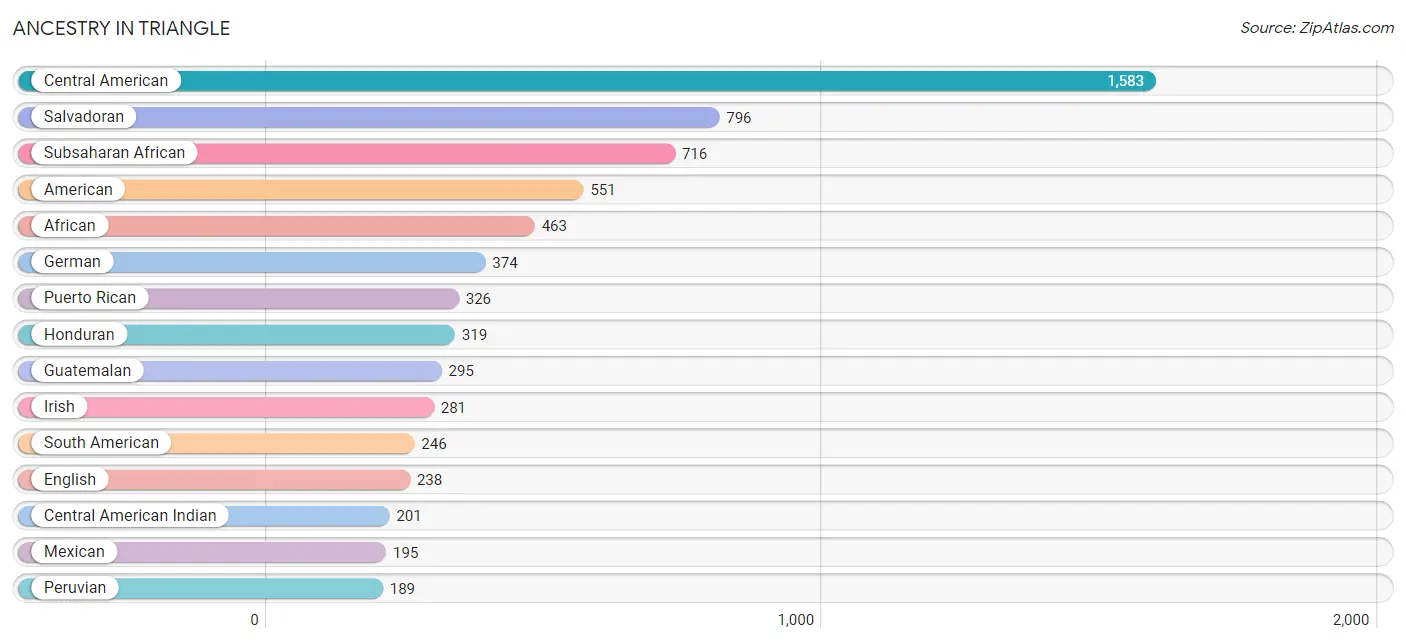
Ancestry in Triangle
The most populous ancestries reported in Triangle are Central American (1,583 | 14.5%), Salvadoran (796 | 7.3%), Subsaharan African (716 | 6.6%), American (551 | 5.1%), and African (463 | 4.3%), together accounting for 37.7% of all Triangle residents.
| Ancestry | # Population | % Population |
| Afghan | 6 | 0.1% |
| African | 463 | 4.3% |
| American | 551 | 5.1% |
| Arab | 60 | 0.5% |
| Armenian | 6 | 0.1% |
| Bhutanese | 17 | 0.2% |
| Blackfeet | 7 | 0.1% |
| Bolivian | 27 | 0.3% |
| Brazilian | 126 | 1.2% |
| British | 31 | 0.3% |
| Burmese | 148 | 1.4% |
| Central American | 1,583 | 14.5% |
| Central American Indian | 201 | 1.8% |
| Colombian | 30 | 0.3% |
| Danish | 17 | 0.2% |
| Dutch | 29 | 0.3% |
| Eastern European | 6 | 0.1% |
| English | 238 | 2.2% |
| European | 8 | 0.1% |
| Filipino | 7 | 0.1% |
| French | 51 | 0.5% |
| German | 374 | 3.4% |
| Ghanaian | 129 | 1.2% |
| Greek | 40 | 0.4% |
| Guatemalan | 295 | 2.7% |
| Honduran | 319 | 2.9% |
| Hungarian | 37 | 0.3% |
| Indian (Asian) | 79 | 0.7% |
| Irish | 281 | 2.6% |
| Italian | 90 | 0.8% |
| Jamaican | 128 | 1.2% |
| Korean | 170 | 1.6% |
| Lebanese | 14 | 0.1% |
| Malaysian | 99 | 0.9% |
| Mexican | 195 | 1.8% |
| Mexican American Indian | 65 | 0.6% |
| Nicaraguan | 95 | 0.9% |
| Nigerian | 51 | 0.5% |
| Northern European | 37 | 0.3% |
| Norwegian | 36 | 0.3% |
| Pakistani | 170 | 1.6% |
| Panamanian | 78 | 0.7% |
| Peruvian | 189 | 1.7% |
| Polish | 160 | 1.5% |
| Portuguese | 14 | 0.1% |
| Puerto Rican | 326 | 3.0% |
| Russian | 14 | 0.1% |
| Salvadoran | 796 | 7.3% |
| Scandinavian | 66 | 0.6% |
| Scotch-Irish | 25 | 0.2% |
| Scottish | 38 | 0.4% |
| Sierra Leonean | 39 | 0.4% |
| South American | 246 | 2.3% |
| Sri Lankan | 141 | 1.3% |
| Subsaharan African | 716 | 6.6% |
| Thai | 16 | 0.2% |
| Trinidadian and Tobagonian | 141 | 1.3% |
| Ugandan | 8 | 0.1% |
| Welsh | 7 | 0.1% |
| West Indian | 104 | 1.0% | View All 60 Rows |
Immigrants in Triangle
The most numerous immigrant groups reported in Triangle came from Latin America (1,474 | 13.5%), Central America (1,011 | 9.3%), Asia (845 | 7.8%), Africa (588 | 5.4%), and El Salvador (466 | 4.3%), together accounting for 40.3% of all Triangle residents.
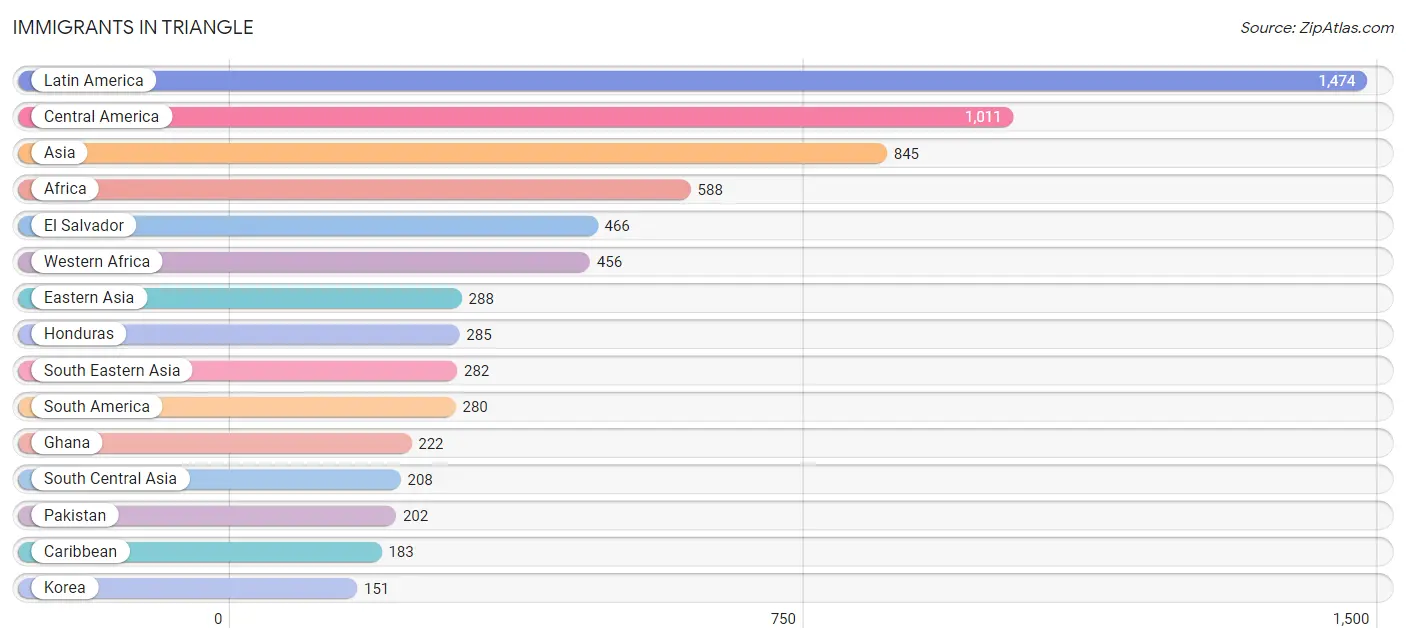
| Immigration Origin | # Population | % Population |
| Afghanistan | 6 | 0.1% |
| Africa | 588 | 5.4% |
| Asia | 845 | 7.8% |
| Belgium | 7 | 0.1% |
| Bolivia | 43 | 0.4% |
| Brazil | 72 | 0.7% |
| Cameroon | 36 | 0.3% |
| Caribbean | 183 | 1.7% |
| Central America | 1,011 | 9.3% |
| China | 21 | 0.2% |
| Colombia | 119 | 1.1% |
| Eastern Africa | 45 | 0.4% |
| Eastern Asia | 288 | 2.6% |
| El Salvador | 466 | 4.3% |
| Ethiopia | 23 | 0.2% |
| Europe | 7 | 0.1% |
| Ghana | 222 | 2.0% |
| Guatemala | 73 | 0.7% |
| Honduras | 285 | 2.6% |
| Jamaica | 42 | 0.4% |
| Japan | 116 | 1.1% |
| Korea | 151 | 1.4% |
| Laos | 28 | 0.3% |
| Latin America | 1,474 | 13.5% |
| Liberia | 92 | 0.9% |
| Mexico | 103 | 0.9% |
| Middle Africa | 87 | 0.8% |
| Nicaragua | 54 | 0.5% |
| Nigeria | 82 | 0.7% |
| Pakistan | 202 | 1.9% |
| Panama | 30 | 0.3% |
| Peru | 46 | 0.4% |
| Philippines | 89 | 0.8% |
| Sierra Leone | 39 | 0.4% |
| South America | 280 | 2.6% |
| South Central Asia | 208 | 1.9% |
| South Eastern Asia | 282 | 2.6% |
| Thailand | 85 | 0.8% |
| Trinidad and Tobago | 141 | 1.3% |
| Uganda | 22 | 0.2% |
| Vietnam | 80 | 0.7% |
| Western Africa | 456 | 4.2% |
| Western Asia | 67 | 0.6% |
| Western Europe | 7 | 0.1% |
| Zaire | 51 | 0.5% | View All 45 Rows |
Sex and Age in Triangle
Sex and Age in Triangle
The most populous age groups in Triangle are Under 5 Years (646 | 10.8%) for men and 30 to 34 Years (594 | 12.1%) for women.
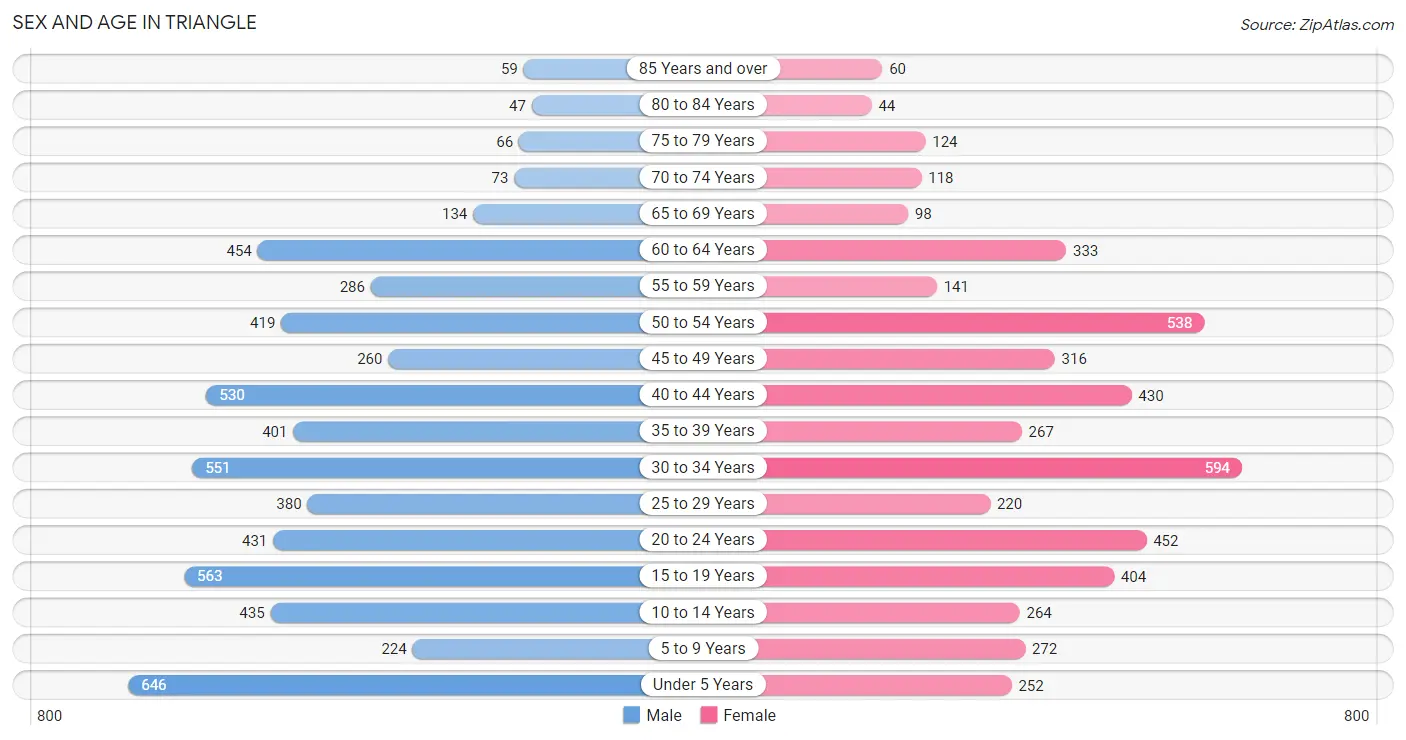
| Age Bracket | Male | Female |
| Under 5 Years | 646 (10.8%) | 252 (5.1%) |
| 5 to 9 Years | 224 (3.8%) | 272 (5.5%) |
| 10 to 14 Years | 435 (7.3%) | 264 (5.4%) |
| 15 to 19 Years | 563 (9.5%) | 404 (8.2%) |
| 20 to 24 Years | 431 (7.2%) | 452 (9.2%) |
| 25 to 29 Years | 380 (6.4%) | 220 (4.5%) |
| 30 to 34 Years | 551 (9.2%) | 594 (12.1%) |
| 35 to 39 Years | 401 (6.7%) | 267 (5.4%) |
| 40 to 44 Years | 530 (8.9%) | 430 (8.7%) |
| 45 to 49 Years | 260 (4.4%) | 316 (6.4%) |
| 50 to 54 Years | 419 (7.0%) | 538 (10.9%) |
| 55 to 59 Years | 286 (4.8%) | 141 (2.9%) |
| 60 to 64 Years | 454 (7.6%) | 333 (6.8%) |
| 65 to 69 Years | 134 (2.2%) | 98 (2.0%) |
| 70 to 74 Years | 73 (1.2%) | 118 (2.4%) |
| 75 to 79 Years | 66 (1.1%) | 124 (2.5%) |
| 80 to 84 Years | 47 (0.8%) | 44 (0.9%) |
| 85 Years and over | 59 (1.0%) | 60 (1.2%) |
| Total | 5,959 (100.0%) | 4,927 (100.0%) |
Families and Households in Triangle
Median Family Size in Triangle
The median family size in Triangle is 3.90 persons per family, with married-couple families (1,923 | 80.1%) accounting for the largest median family size of 4.16 persons per family. On the other hand, single female/mother families (314 | 13.1%) represent the smallest median family size with 2.48 persons per family.
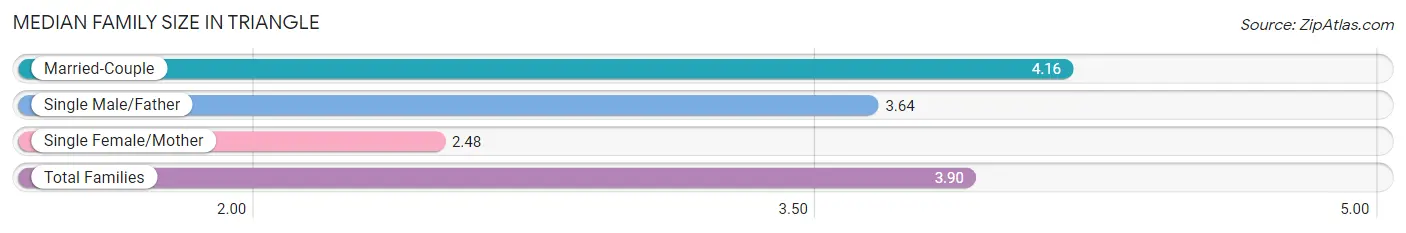
| Family Type | # Families | Family Size |
| Married-Couple | 1,923 (80.1%) | 4.16 |
| Single Male/Father | 163 (6.8%) | 3.64 |
| Single Female/Mother | 314 (13.1%) | 2.48 |
| Total Families | 2,400 (100.0%) | 3.90 |
Median Household Size in Triangle
The median household size in Triangle is 3.30 persons per household, with married-couple households (1,923 | 58.4%) accounting for the largest median household size of 4.21 persons per household. non-family households (893 | 27.1%) represent the smallest median household size with 1.40 persons per household.
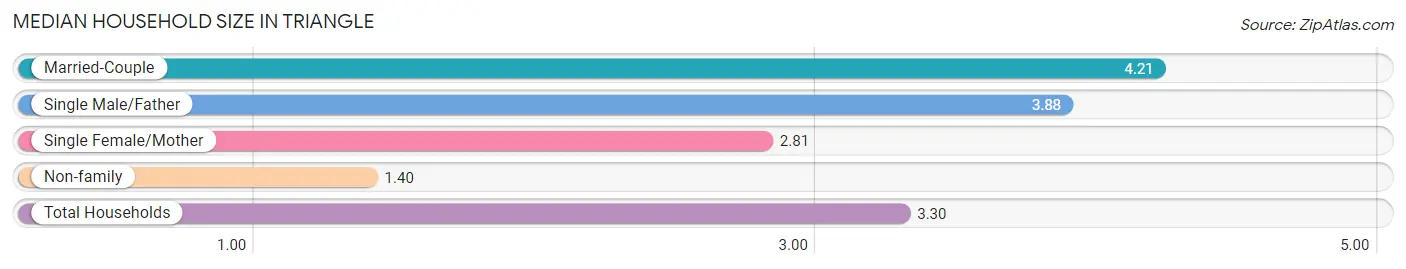
| Household Type | # Households | Household Size |
| Married-Couple | 1,923 (58.4%) | 4.21 |
| Single Male/Father | 163 (5.0%) | 3.88 |
| Single Female/Mother | 314 (9.5%) | 2.81 |
| Non-family | 893 (27.1%) | 1.40 |
| Total Households | 3,293 (100.0%) | 3.30 |
Household Size by Marriage Status in Triangle
Out of a total of 3,293 households in Triangle, 2,400 (72.9%) are family households, while 893 (27.1%) are nonfamily households. The most numerous type of family households are 2-person households, comprising 698, and the most common type of nonfamily households are 1-person households, comprising 715.
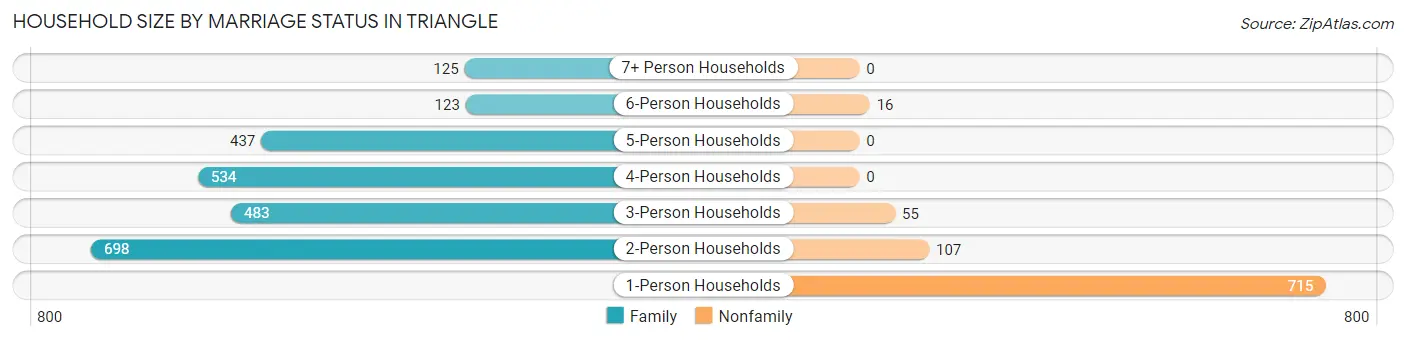
| Household Size | Family Households | Nonfamily Households |
| 1-Person Households | - | 715 (21.7%) |
| 2-Person Households | 698 (21.2%) | 107 (3.3%) |
| 3-Person Households | 483 (14.7%) | 55 (1.7%) |
| 4-Person Households | 534 (16.2%) | 0 (0.0%) |
| 5-Person Households | 437 (13.3%) | 0 (0.0%) |
| 6-Person Households | 123 (3.7%) | 16 (0.5%) |
| 7+ Person Households | 125 (3.8%) | 0 (0.0%) |
| Total | 2,400 (72.9%) | 893 (27.1%) |
Female Fertility in Triangle
Fertility by Age in Triangle
Average fertility rate in Triangle is 45.0 births per 1,000 women. Women in the age bracket of 20 to 34 years have the highest fertility rate with 62.0 births per 1,000 women. Women in the age bracket of 20 to 34 years acount for 63.7% of all women with births.
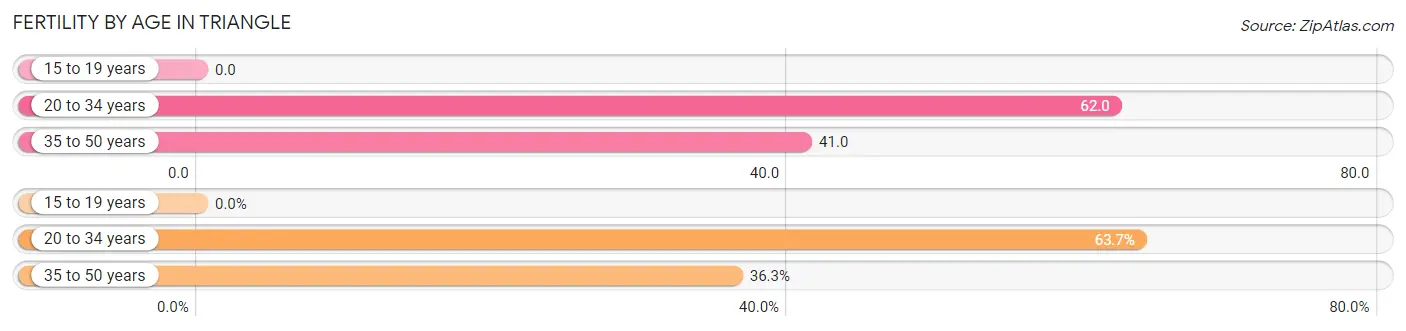
| Age Bracket | Women with Births | Births / 1,000 Women |
| 15 to 19 years | 0 (0.0%) | 0.0 |
| 20 to 34 years | 79 (63.7%) | 62.0 |
| 35 to 50 years | 45 (36.3%) | 41.0 |
| Total | 124 (100.0%) | 45.0 |
Fertility by Age by Marriage Status in Triangle
62.1% of women with births (124) in Triangle are married. The highest percentage of unmarried women with births falls into 20 to 34 years age bracket with 59.5% of them unmarried at the time of birth, while the lowest percentage of unmarried women with births belong to 35 to 50 years age bracket with 0.0% of them unmarried.
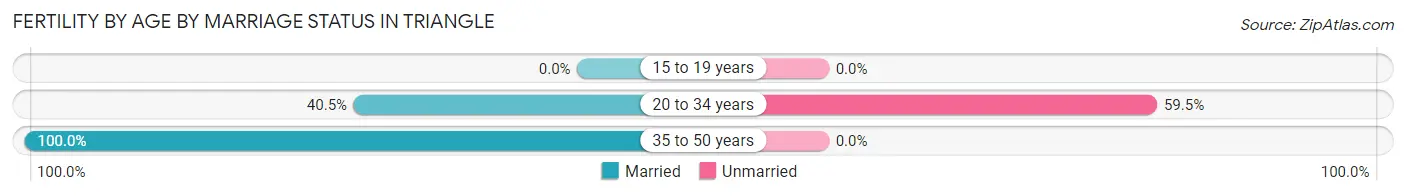
| Age Bracket | Married | Unmarried |
| 15 to 19 years | 0 (0.0%) | 0 (0.0%) |
| 20 to 34 years | 32 (40.5%) | 47 (59.5%) |
| 35 to 50 years | 45 (100.0%) | 0 (0.0%) |
| Total | 77 (62.1%) | 47 (37.9%) |
Fertility by Education in Triangle
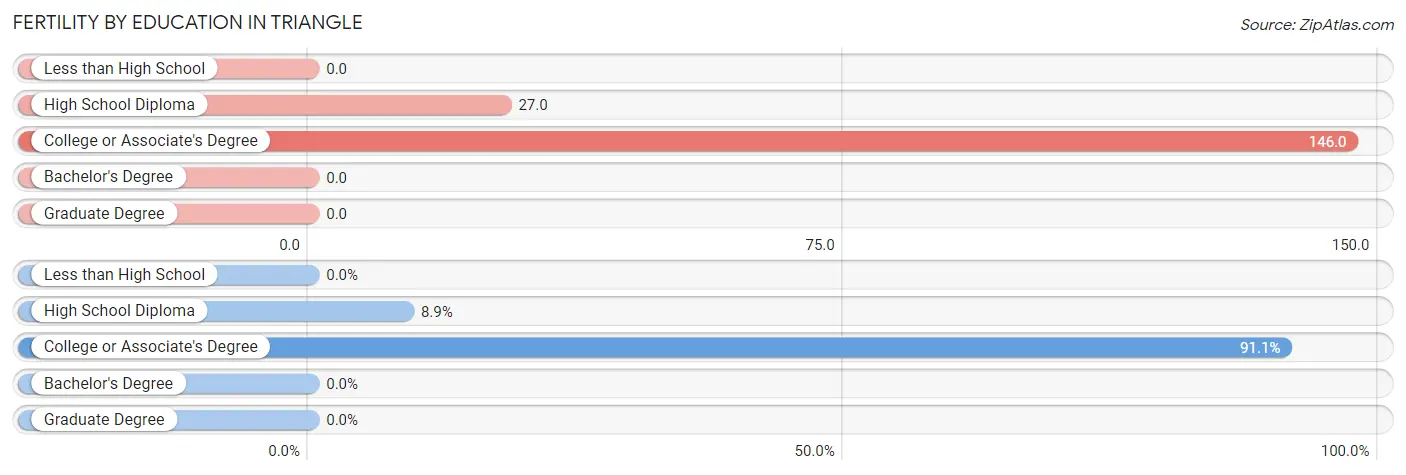
| Educational Attainment | Women with Births | Births / 1,000 Women |
| Less than High School | 0 (0.0%) | 0.0 |
| High School Diploma | 11 (8.9%) | 27.0 |
| College or Associate's Degree | 113 (91.1%) | 146.0 |
| Bachelor's Degree | 0 (0.0%) | 0.0 |
| Graduate Degree | 0 (0.0%) | 0.0 |
| Total | 124 (100.0%) | 45.0 |
Fertility by Education by Marriage Status in Triangle
37.9% of women with births in Triangle are unmarried. Women with the educational attainment of high school diploma are most likely to be married with 100.0% of them married at childbirth, while women with the educational attainment of college or associate's degree are least likely to be married with 41.6% of them unmarried at childbirth.
| Educational Attainment | Married | Unmarried |
| Less than High School | 0 (0.0%) | 0 (0.0%) |
| High School Diploma | 11 (100.0%) | 0 (0.0%) |
| College or Associate's Degree | 66 (58.4%) | 47 (41.6%) |
| Bachelor's Degree | 0 (0.0%) | 0 (0.0%) |
| Graduate Degree | 0 (0.0%) | 0 (0.0%) |
| Total | 77 (62.1%) | 47 (37.9%) |
Employment Characteristics in Triangle
Employment by Class of Employer in Triangle
Among the 5,319 employed individuals in Triangle, private company employees (2,656 | 49.9%), federal government employees (1,084 | 20.4%), and not-for-profit organizations (605 | 11.4%) make up the most common classes of employment.
| Employer Class | # Employees | % Employees |
| Private Company Employees | 2,656 | 49.9% |
| Self-Employed (Incorporated) | 169 | 3.2% |
| Self-Employed (Not Incorporated) | 386 | 7.3% |
| Not-for-profit Organizations | 605 | 11.4% |
| Local Government Employees | 300 | 5.6% |
| State Government Employees | 119 | 2.2% |
| Federal Government Employees | 1,084 | 20.4% |
| Unpaid Family Workers | 0 | 0.0% |
| Total | 5,319 | 100.0% |
Employment Status by Age in Triangle
According to the labor force statistics for Triangle, out of the total population over 16 years of age (8,567), 68.7% or 5,886 individuals are in the labor force, with 9.4% or 553 of them unemployed. The age group with the highest labor force participation rate is 35 to 44 years, with 87.3% or 1,421 individuals in the labor force. Within the labor force, the 20 to 24 years age range has the highest percentage of unemployed individuals, with 31.2% or 148 of them being unemployed.
| Age Bracket | In Labor Force | Unemployed |
| 16 to 19 Years | 202 (27.3%) | 20 (9.9%) |
| 20 to 24 Years | 475 (53.8%) | 148 (31.2%) |
| 25 to 29 Years | 509 (84.8%) | 69 (13.5%) |
| 30 to 34 Years | 960 (83.8%) | 132 (13.7%) |
| 35 to 44 Years | 1,421 (87.3%) | 37 (2.6%) |
| 45 to 54 Years | 1,334 (87.0%) | 48 (3.6%) |
| 55 to 59 Years | 345 (80.8%) | 51 (14.8%) |
| 60 to 64 Years | 478 (60.7%) | 33 (6.9%) |
| 65 to 74 Years | 133 (31.4%) | 15 (11.3%) |
| 75 Years and over | 27 (6.8%) | 0 (0.0%) |
| Total | 5,886 (68.7%) | 553 (9.4%) |
Employment Status by Educational Attainment in Triangle
According to labor force statistics for Triangle, 82.5% of individuals (5,049) out of the total population between 25 and 64 years of age (6,120) are in the labor force, with 7.4% or 374 of them being unemployed. The group with the highest labor force participation rate are those with the educational attainment of bachelor's degree or higher, with 88.9% or 2,491 individuals in the labor force. Within the labor force, individuals with less than high school education have the highest percentage of unemployment, with 16.2% or 58 of them being unemployed.
| Educational Attainment | In Labor Force | Unemployed |
| Less than High School | 359 (65.4%) | 89 (16.2%) |
| High School Diploma | 752 (86.1%) | 123 (14.1%) |
| College / Associate Degree | 1,445 (76.2%) | 184 (9.7%) |
| Bachelor's Degree or higher | 2,491 (88.9%) | 67 (2.4%) |
| Total | 5,049 (82.5%) | 453 (7.4%) |
Employment Occupations by Sex in Triangle
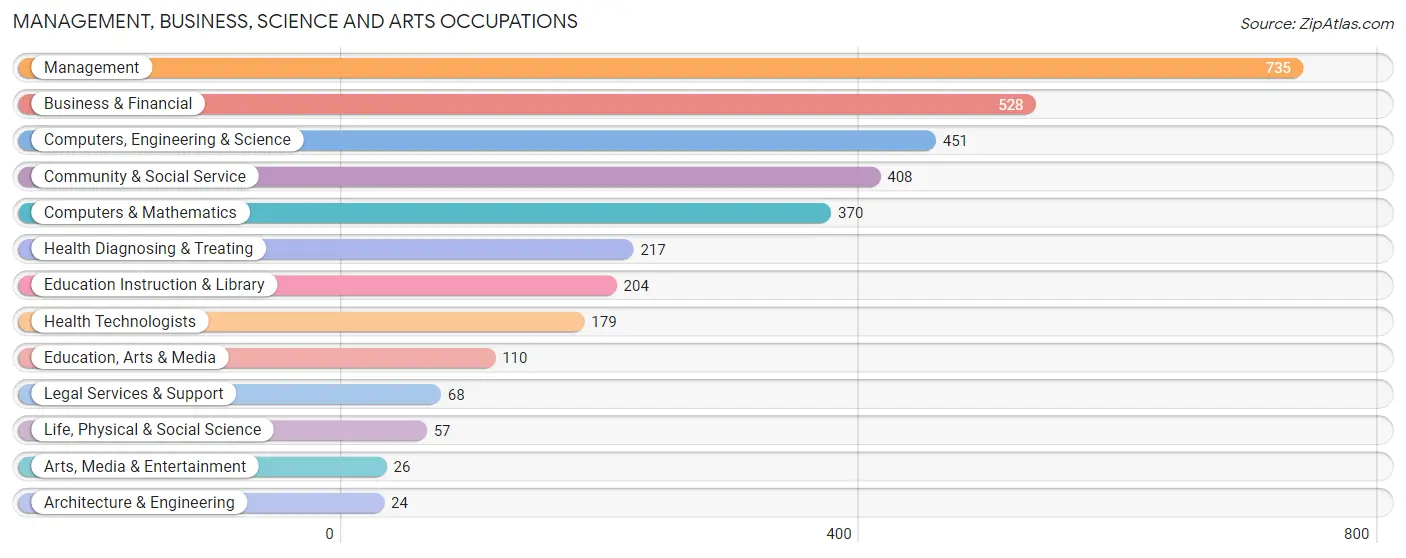
Management, Business, Science and Arts Occupations
The most common Management, Business, Science and Arts occupations in Triangle are Management (735 | 14.3%), Business & Financial (528 | 10.3%), Computers, Engineering & Science (451 | 8.8%), Community & Social Service (408 | 8.0%), and Computers & Mathematics (370 | 7.2%).
Management, Business, Science and Arts Occupations by Sex
Within the Management, Business, Science and Arts occupations in Triangle, the most male-oriented occupations are Architecture & Engineering (100.0%), Life, Physical & Social Science (100.0%), and Computers, Engineering & Science (72.5%), while the most female-oriented occupations are Health Diagnosing & Treating (91.7%), Health Technologists (89.9%), and Education Instruction & Library (88.2%).
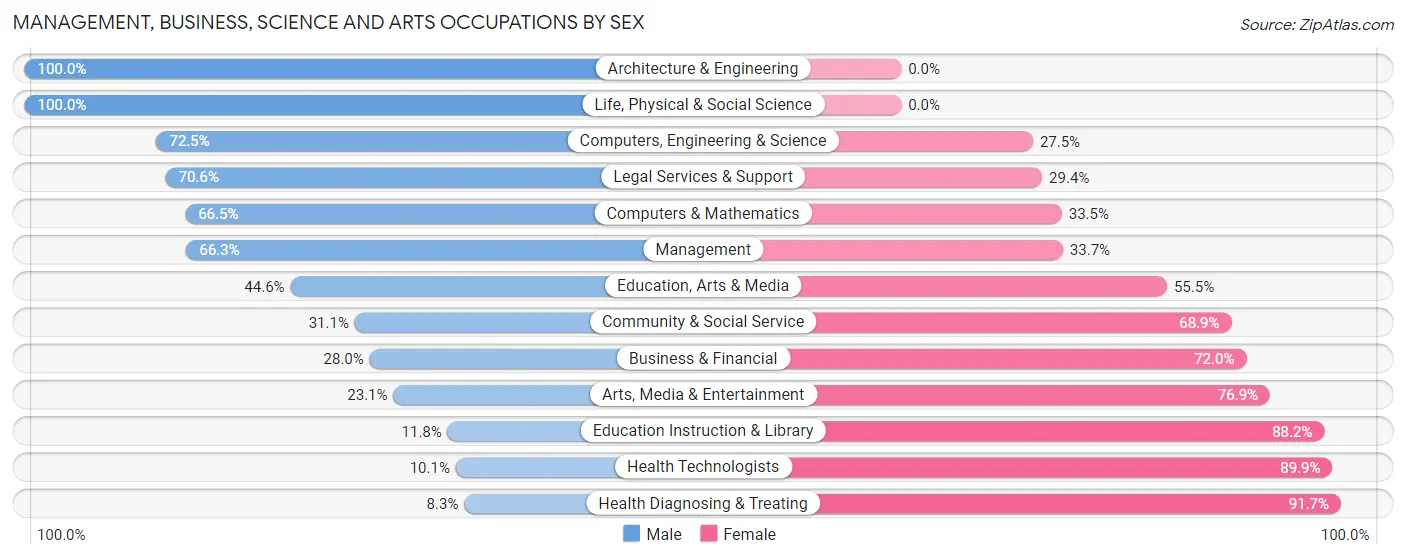
| Occupation | Male | Female |
| Management | 487 (66.3%) | 248 (33.7%) |
| Business & Financial | 148 (28.0%) | 380 (72.0%) |
| Computers, Engineering & Science | 327 (72.5%) | 124 (27.5%) |
| Computers & Mathematics | 246 (66.5%) | 124 (33.5%) |
| Architecture & Engineering | 24 (100.0%) | 0 (0.0%) |
| Life, Physical & Social Science | 57 (100.0%) | 0 (0.0%) |
| Community & Social Service | 127 (31.1%) | 281 (68.9%) |
| Education, Arts & Media | 49 (44.6%) | 61 (55.4%) |
| Legal Services & Support | 48 (70.6%) | 20 (29.4%) |
| Education Instruction & Library | 24 (11.8%) | 180 (88.2%) |
| Arts, Media & Entertainment | 6 (23.1%) | 20 (76.9%) |
| Health Diagnosing & Treating | 18 (8.3%) | 199 (91.7%) |
| Health Technologists | 18 (10.1%) | 161 (89.9%) |
| Total (Category) | 1,107 (47.3%) | 1,232 (52.7%) |
| Total (Overall) | 2,861 (55.7%) | 2,273 (44.3%) |
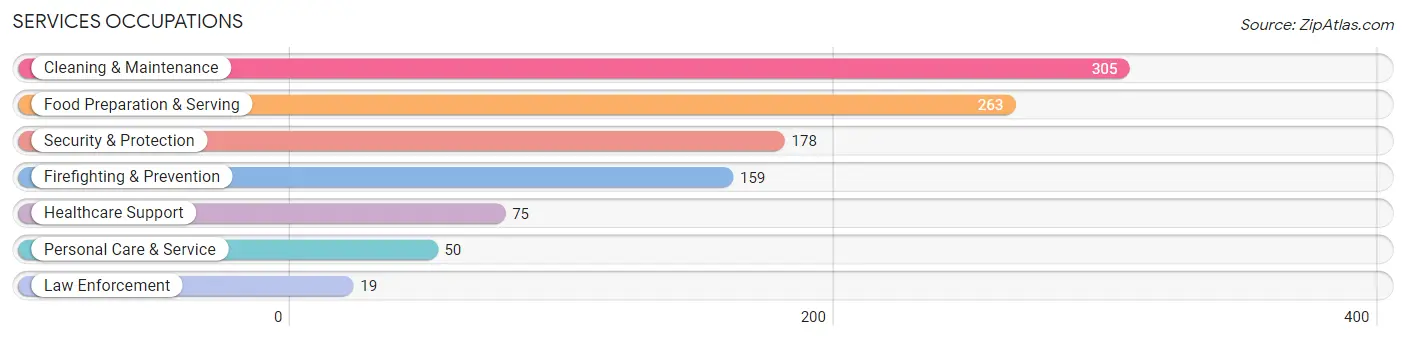
Services Occupations
The most common Services occupations in Triangle are Cleaning & Maintenance (305 | 5.9%), Food Preparation & Serving (263 | 5.1%), Security & Protection (178 | 3.5%), Firefighting & Prevention (159 | 3.1%), and Healthcare Support (75 | 1.5%).
Services Occupations by Sex
Within the Services occupations in Triangle, the most male-oriented occupations are Firefighting & Prevention (87.4%), Security & Protection (85.4%), and Food Preparation & Serving (78.7%), while the most female-oriented occupations are Healthcare Support (82.7%), Personal Care & Service (78.0%), and Cleaning & Maintenance (67.2%).
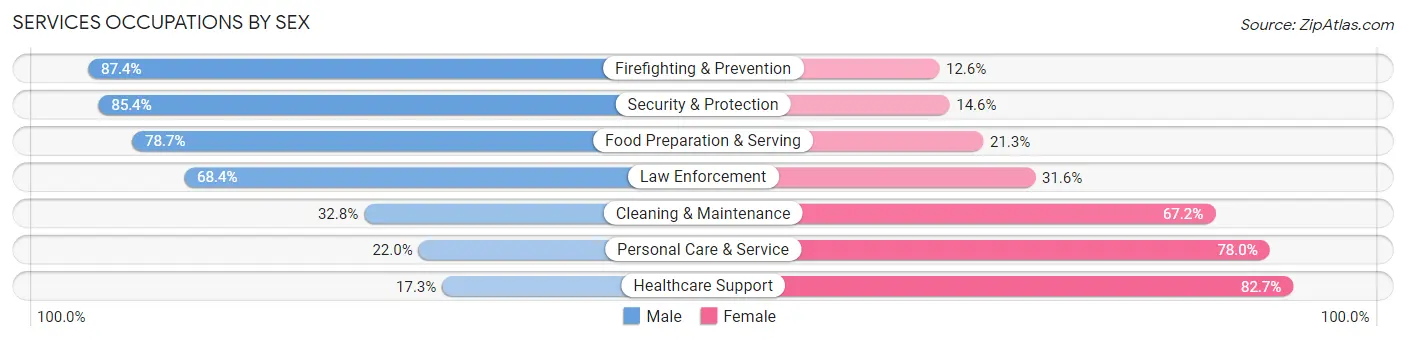
| Occupation | Male | Female |
| Healthcare Support | 13 (17.3%) | 62 (82.7%) |
| Security & Protection | 152 (85.4%) | 26 (14.6%) |
| Firefighting & Prevention | 139 (87.4%) | 20 (12.6%) |
| Law Enforcement | 13 (68.4%) | 6 (31.6%) |
| Food Preparation & Serving | 207 (78.7%) | 56 (21.3%) |
| Cleaning & Maintenance | 100 (32.8%) | 205 (67.2%) |
| Personal Care & Service | 11 (22.0%) | 39 (78.0%) |
| Total (Category) | 483 (55.4%) | 388 (44.6%) |
| Total (Overall) | 2,861 (55.7%) | 2,273 (44.3%) |
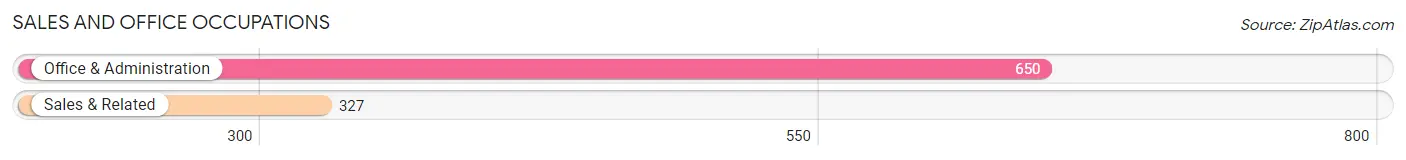
Sales and Office Occupations
The most common Sales and Office occupations in Triangle are Office & Administration (650 | 12.7%), and Sales & Related (327 | 6.4%).
Sales and Office Occupations by Sex
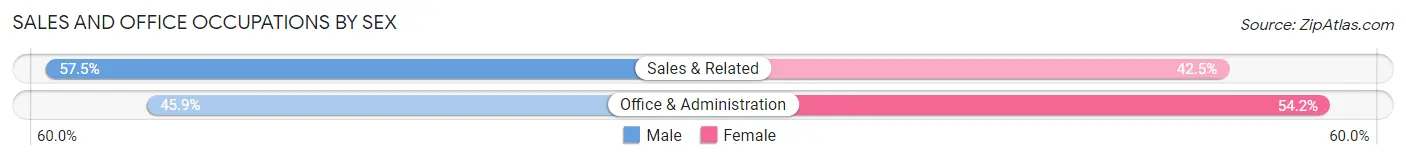
| Occupation | Male | Female |
| Sales & Related | 188 (57.5%) | 139 (42.5%) |
| Office & Administration | 298 (45.9%) | 352 (54.1%) |
| Total (Category) | 486 (49.7%) | 491 (50.3%) |
| Total (Overall) | 2,861 (55.7%) | 2,273 (44.3%) |
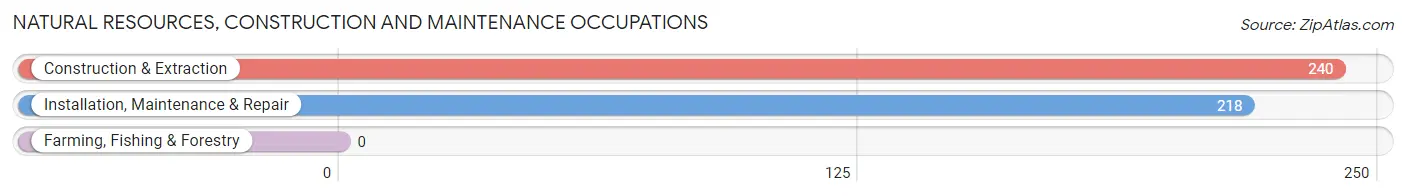
Natural Resources, Construction and Maintenance Occupations
The most common Natural Resources, Construction and Maintenance occupations in Triangle are Construction & Extraction (240 | 4.7%), and Installation, Maintenance & Repair (218 | 4.3%).
Natural Resources, Construction and Maintenance Occupations by Sex
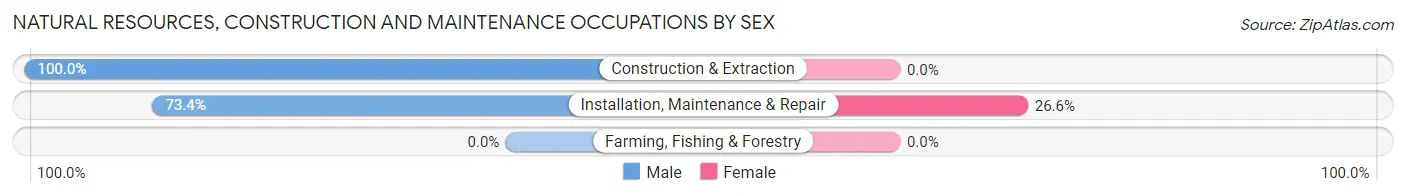
| Occupation | Male | Female |
| Farming, Fishing & Forestry | 0 (0.0%) | 0 (0.0%) |
| Construction & Extraction | 240 (100.0%) | 0 (0.0%) |
| Installation, Maintenance & Repair | 160 (73.4%) | 58 (26.6%) |
| Total (Category) | 400 (87.3%) | 58 (12.7%) |
| Total (Overall) | 2,861 (55.7%) | 2,273 (44.3%) |
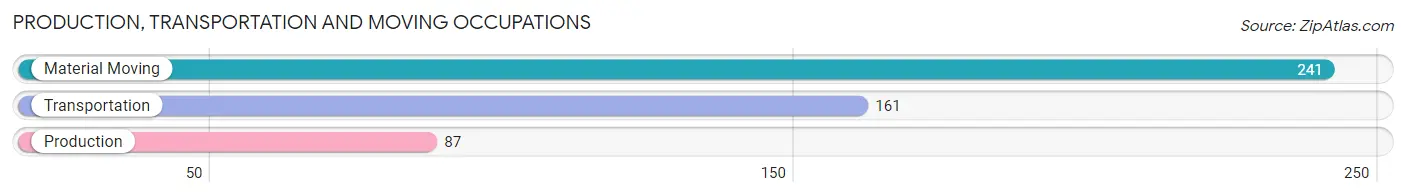
Production, Transportation and Moving Occupations
The most common Production, Transportation and Moving occupations in Triangle are Material Moving (241 | 4.7%), Transportation (161 | 3.1%), and Production (87 | 1.7%).
Production, Transportation and Moving Occupations by Sex
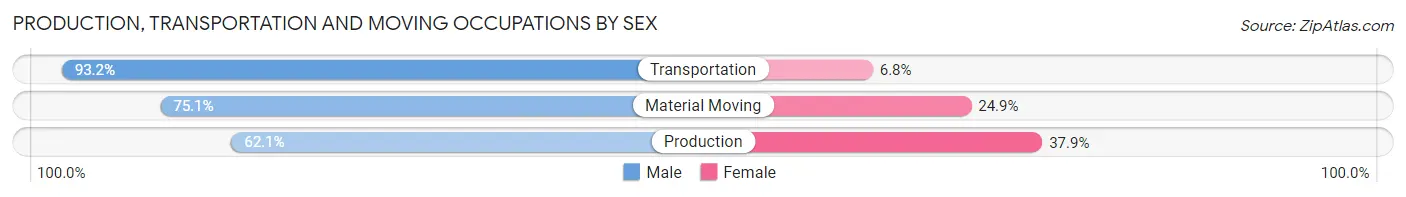
| Occupation | Male | Female |
| Production | 54 (62.1%) | 33 (37.9%) |
| Transportation | 150 (93.2%) | 11 (6.8%) |
| Material Moving | 181 (75.1%) | 60 (24.9%) |
| Total (Category) | 385 (78.7%) | 104 (21.3%) |
| Total (Overall) | 2,861 (55.7%) | 2,273 (44.3%) |
Employment Industries by Sex in Triangle
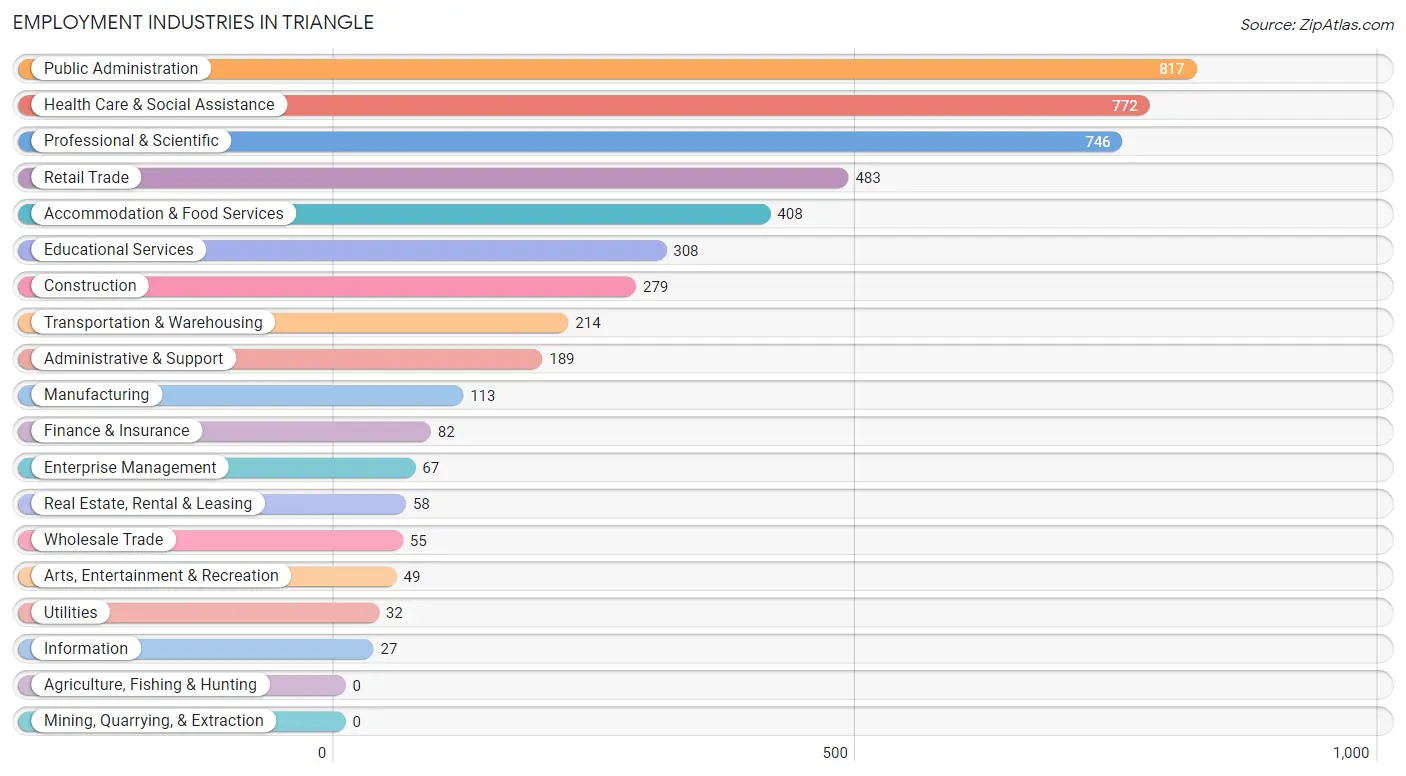
Employment Industries in Triangle
The major employment industries in Triangle include Public Administration (817 | 15.9%), Health Care & Social Assistance (772 | 15.0%), Professional & Scientific (746 | 14.5%), Retail Trade (483 | 9.4%), and Accommodation & Food Services (408 | 8.0%).
Employment Industries by Sex in Triangle
The Triangle industries that see more men than women are Wholesale Trade (100.0%), Utilities (100.0%), and Real Estate, Rental & Leasing (100.0%), whereas the industries that tend to have a higher number of women are Arts, Entertainment & Recreation (77.5%), Educational Services (70.8%), and Health Care & Social Assistance (65.4%).
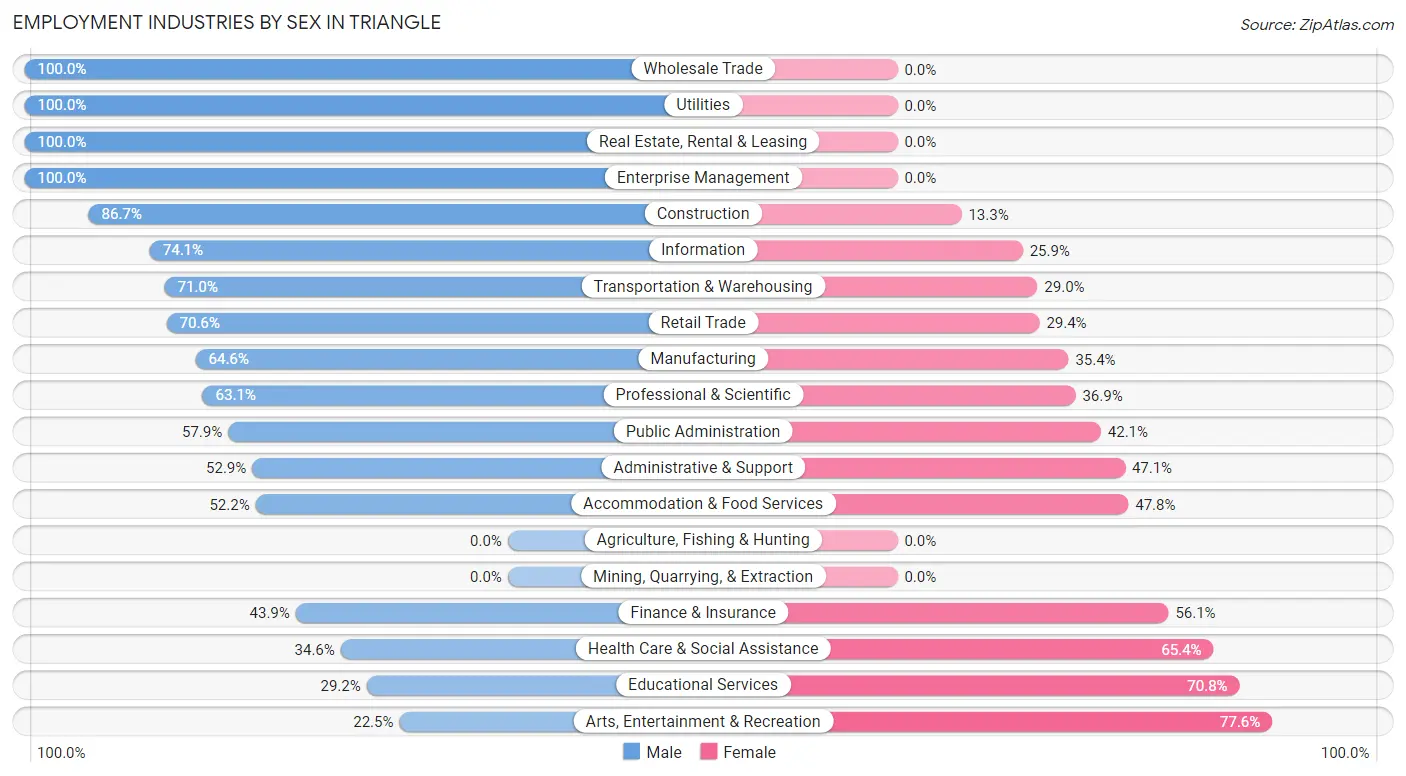
| Industry | Male | Female |
| Agriculture, Fishing & Hunting | 0 (0.0%) | 0 (0.0%) |
| Mining, Quarrying, & Extraction | 0 (0.0%) | 0 (0.0%) |
| Construction | 242 (86.7%) | 37 (13.3%) |
| Manufacturing | 73 (64.6%) | 40 (35.4%) |
| Wholesale Trade | 55 (100.0%) | 0 (0.0%) |
| Retail Trade | 341 (70.6%) | 142 (29.4%) |
| Transportation & Warehousing | 152 (71.0%) | 62 (29.0%) |
| Utilities | 32 (100.0%) | 0 (0.0%) |
| Information | 20 (74.1%) | 7 (25.9%) |
| Finance & Insurance | 36 (43.9%) | 46 (56.1%) |
| Real Estate, Rental & Leasing | 58 (100.0%) | 0 (0.0%) |
| Professional & Scientific | 471 (63.1%) | 275 (36.9%) |
| Enterprise Management | 67 (100.0%) | 0 (0.0%) |
| Administrative & Support | 100 (52.9%) | 89 (47.1%) |
| Educational Services | 90 (29.2%) | 218 (70.8%) |
| Health Care & Social Assistance | 267 (34.6%) | 505 (65.4%) |
| Arts, Entertainment & Recreation | 11 (22.5%) | 38 (77.5%) |
| Accommodation & Food Services | 213 (52.2%) | 195 (47.8%) |
| Public Administration | 473 (57.9%) | 344 (42.1%) |
| Total | 2,861 (55.7%) | 2,273 (44.3%) |
Education in Triangle
School Enrollment in Triangle
The most common levels of schooling among the 2,969 students in Triangle are high school (826 | 27.8%), college / undergraduate (764 | 25.7%), and middle school (608 | 20.5%).
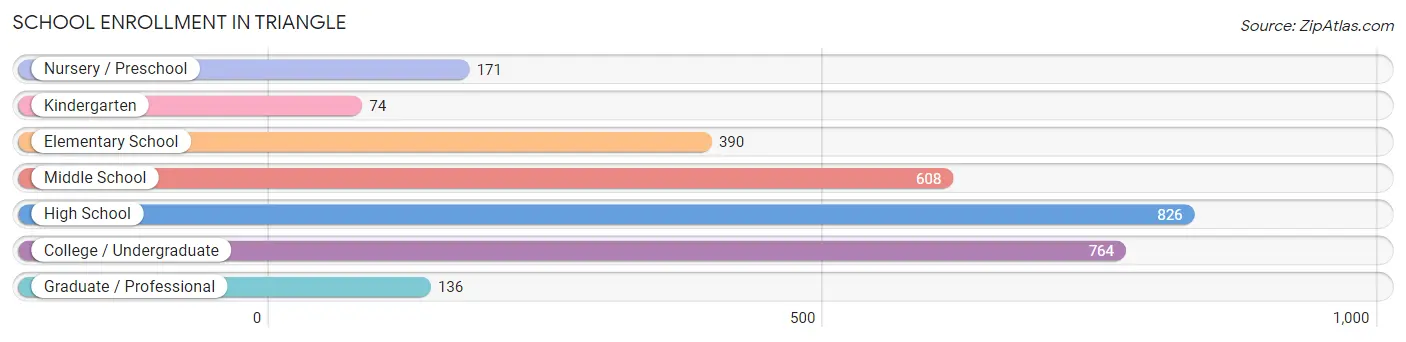
| School Level | # Students | % Students |
| Nursery / Preschool | 171 | 5.8% |
| Kindergarten | 74 | 2.5% |
| Elementary School | 390 | 13.1% |
| Middle School | 608 | 20.5% |
| High School | 826 | 27.8% |
| College / Undergraduate | 764 | 25.7% |
| Graduate / Professional | 136 | 4.6% |
| Total | 2,969 | 100.0% |
School Enrollment by Age by Funding Source in Triangle
Out of a total of 2,969 students who are enrolled in schools in Triangle, 650 (21.9%) attend a private institution, while the remaining 2,319 (78.1%) are enrolled in public schools. The age group of 3 to 4 year olds has the highest likelihood of being enrolled in private schools, with 84 (67.7% in the age bracket) enrolled. Conversely, the age group of 18 to 19 year olds has the lowest likelihood of being enrolled in a private school, with 167 (100.0% in the age bracket) attending a public institution.
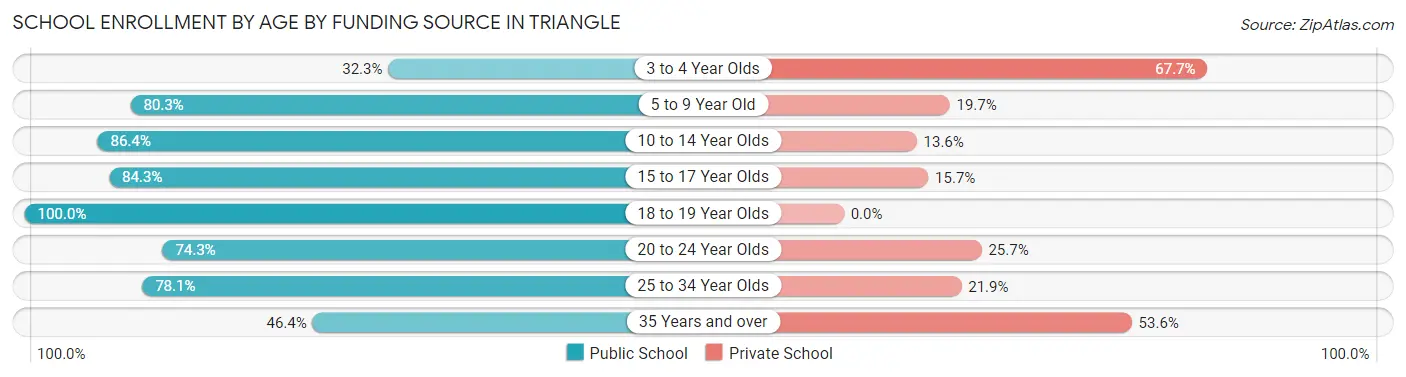
| Age Bracket | Public School | Private School |
| 3 to 4 Year Olds | 40 (32.3%) | 84 (67.7%) |
| 5 to 9 Year Old | 346 (80.3%) | 85 (19.7%) |
| 10 to 14 Year Olds | 604 (86.4%) | 95 (13.6%) |
| 15 to 17 Year Olds | 562 (84.3%) | 105 (15.7%) |
| 18 to 19 Year Olds | 167 (100.0%) | 0 (0.0%) |
| 20 to 24 Year Olds | 359 (74.3%) | 124 (25.7%) |
| 25 to 34 Year Olds | 139 (78.1%) | 39 (21.9%) |
| 35 Years and over | 102 (46.4%) | 118 (53.6%) |
| Total | 2,319 (78.1%) | 650 (21.9%) |
Educational Attainment by Field of Study in Triangle
Business (783 | 24.3%), computers & mathematics (335 | 10.4%), science & technology (307 | 9.5%), engineering (287 | 8.9%), and liberal arts & history (257 | 8.0%) are the most common fields of study among 3,219 individuals in Triangle who have obtained a bachelor's degree or higher.
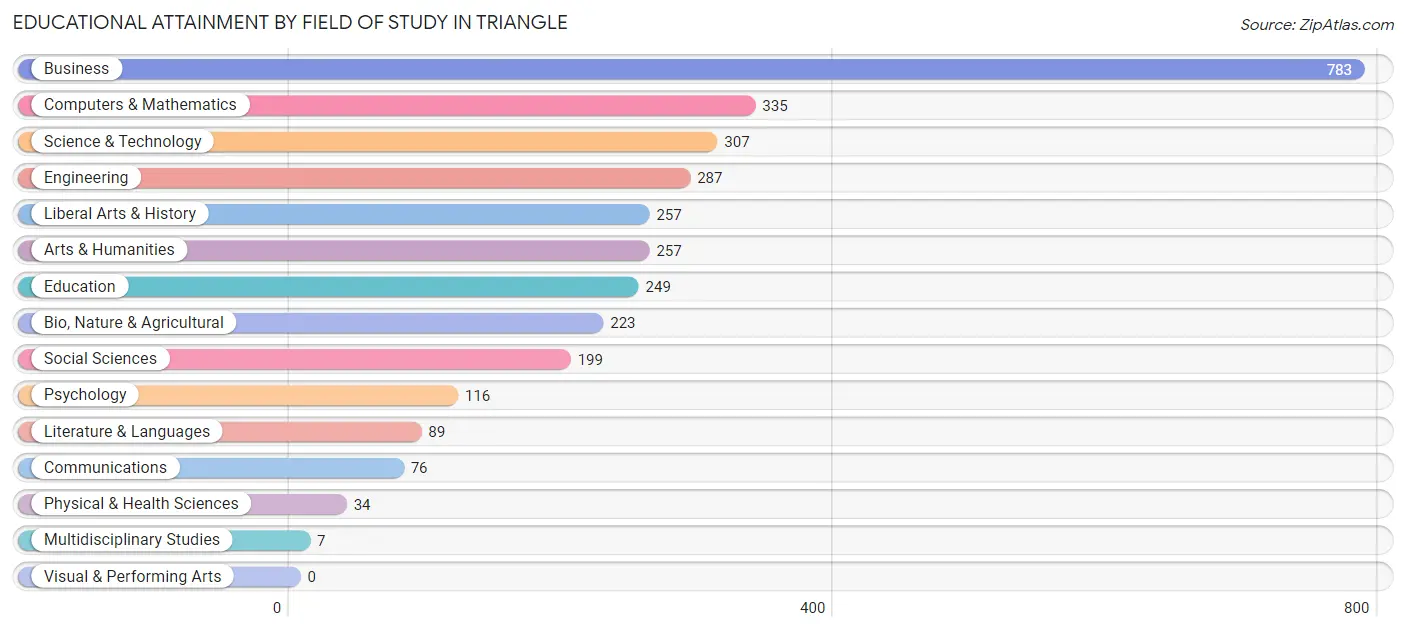
| Field of Study | # Graduates | % Graduates |
| Computers & Mathematics | 335 | 10.4% |
| Bio, Nature & Agricultural | 223 | 6.9% |
| Physical & Health Sciences | 34 | 1.1% |
| Psychology | 116 | 3.6% |
| Social Sciences | 199 | 6.2% |
| Engineering | 287 | 8.9% |
| Multidisciplinary Studies | 7 | 0.2% |
| Science & Technology | 307 | 9.5% |
| Business | 783 | 24.3% |
| Education | 249 | 7.7% |
| Literature & Languages | 89 | 2.8% |
| Liberal Arts & History | 257 | 8.0% |
| Visual & Performing Arts | 0 | 0.0% |
| Communications | 76 | 2.4% |
| Arts & Humanities | 257 | 8.0% |
| Total | 3,219 | 100.0% |
Transportation & Commute in Triangle
Vehicle Availability by Sex in Triangle
The most prevalent vehicle ownership categories in Triangle are males with 2 vehicles (989, accounting for 32.6%) and females with 2 vehicles (735, making up 43.3%).
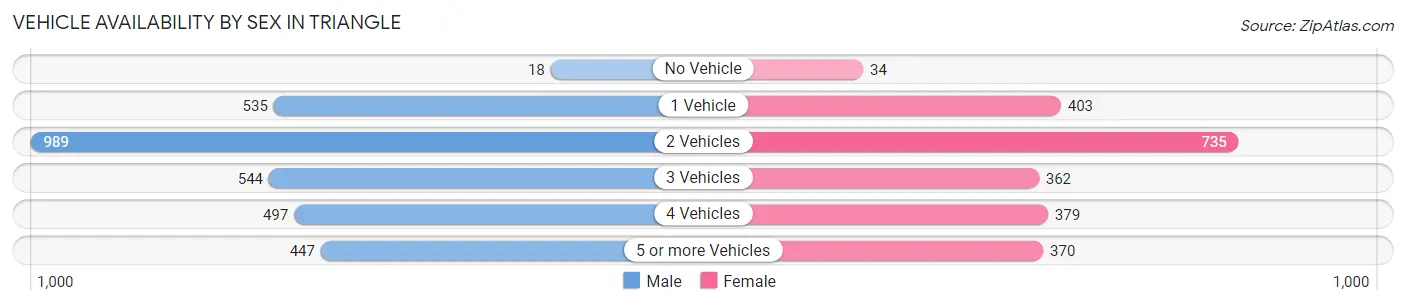
| Vehicles Available | Male | Female |
| No Vehicle | 18 (0.6%) | 34 (1.5%) |
| 1 Vehicle | 535 (17.7%) | 403 (17.6%) |
| 2 Vehicles | 989 (32.6%) | 735 (32.2%) |
| 3 Vehicles | 544 (17.9%) | 362 (15.9%) |
| 4 Vehicles | 497 (16.4%) | 379 (16.6%) |
| 5 or more Vehicles | 447 (14.7%) | 370 (16.2%) |
| Total | 3,030 (100.0%) | 2,283 (100.0%) |
Commute Time in Triangle
The most frequently occuring commute durations in Triangle are 45 to 59 minutes (937 commuters, 18.9%), 30 to 34 minutes (723 commuters, 14.6%), and 15 to 19 minutes (711 commuters, 14.3%).
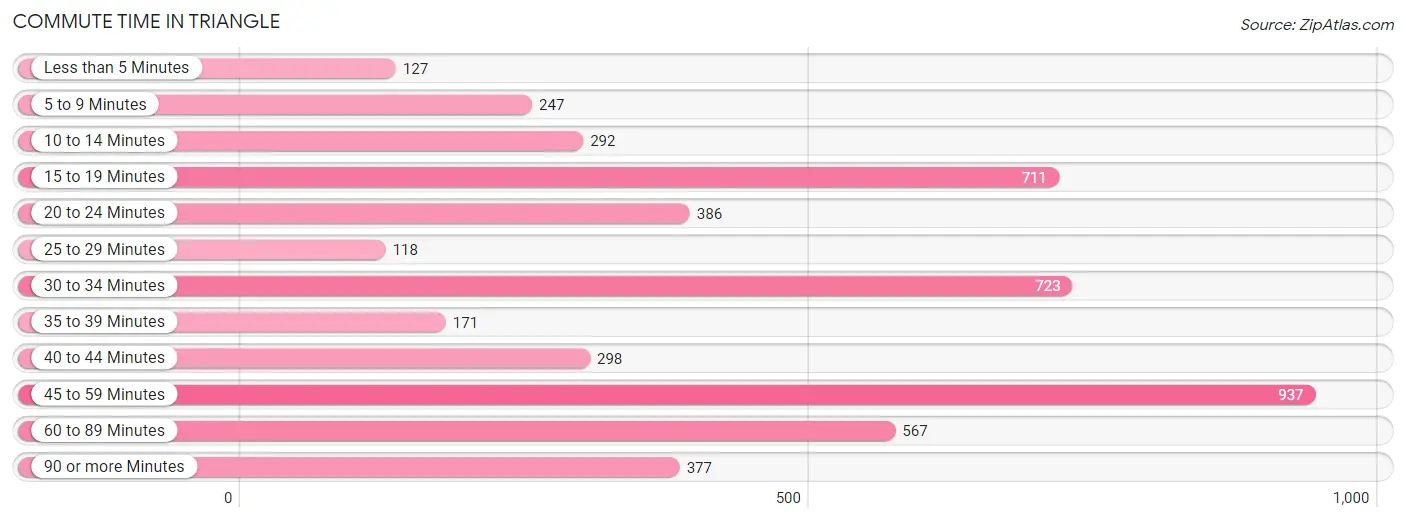
| Commute Time | # Commuters | % Commuters |
| Less than 5 Minutes | 127 | 2.6% |
| 5 to 9 Minutes | 247 | 5.0% |
| 10 to 14 Minutes | 292 | 5.9% |
| 15 to 19 Minutes | 711 | 14.3% |
| 20 to 24 Minutes | 386 | 7.8% |
| 25 to 29 Minutes | 118 | 2.4% |
| 30 to 34 Minutes | 723 | 14.6% |
| 35 to 39 Minutes | 171 | 3.5% |
| 40 to 44 Minutes | 298 | 6.0% |
| 45 to 59 Minutes | 937 | 18.9% |
| 60 to 89 Minutes | 567 | 11.5% |
| 90 or more Minutes | 377 | 7.6% |
Commute Time by Sex in Triangle
The most common commute times in Triangle are 30 to 34 minutes (617 commuters, 21.5%) for males and 45 to 59 minutes (428 commuters, 20.5%) for females.
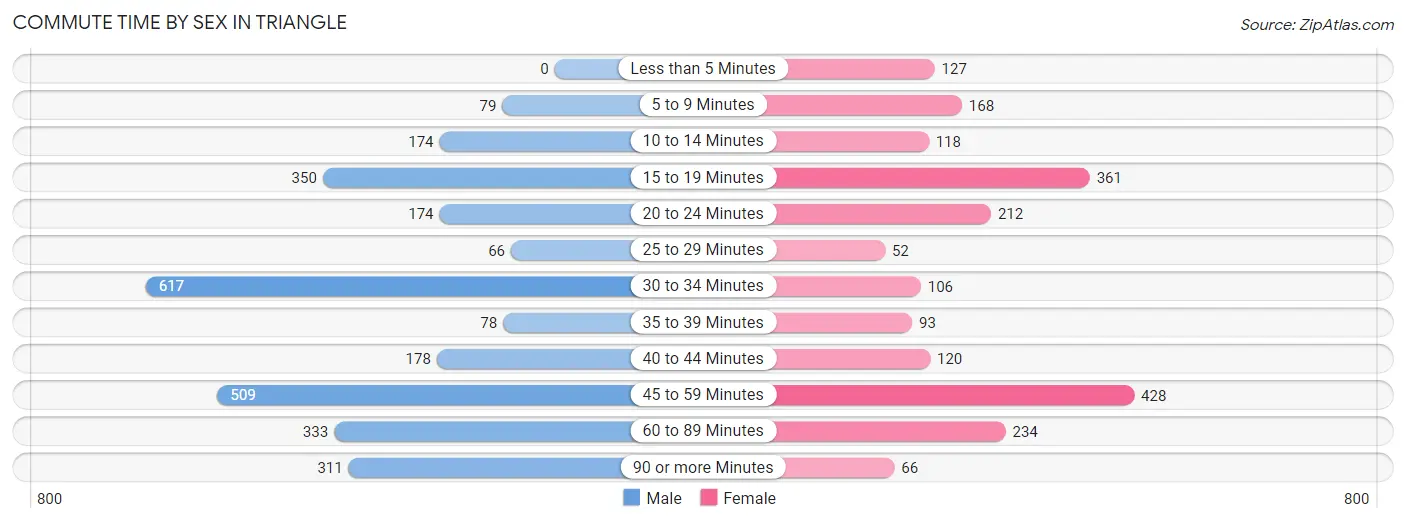
| Commute Time | Male | Female |
| Less than 5 Minutes | 0 (0.0%) | 127 (6.1%) |
| 5 to 9 Minutes | 79 (2.8%) | 168 (8.1%) |
| 10 to 14 Minutes | 174 (6.1%) | 118 (5.7%) |
| 15 to 19 Minutes | 350 (12.2%) | 361 (17.3%) |
| 20 to 24 Minutes | 174 (6.1%) | 212 (10.2%) |
| 25 to 29 Minutes | 66 (2.3%) | 52 (2.5%) |
| 30 to 34 Minutes | 617 (21.5%) | 106 (5.1%) |
| 35 to 39 Minutes | 78 (2.7%) | 93 (4.5%) |
| 40 to 44 Minutes | 178 (6.2%) | 120 (5.8%) |
| 45 to 59 Minutes | 509 (17.7%) | 428 (20.5%) |
| 60 to 89 Minutes | 333 (11.6%) | 234 (11.2%) |
| 90 or more Minutes | 311 (10.8%) | 66 (3.2%) |
Time of Departure to Work by Sex in Triangle
The most frequent times of departure to work in Triangle are 6:00 AM to 6:29 AM (458, 16.0%) for males and 7:00 AM to 7:29 AM (315, 15.1%) for females.
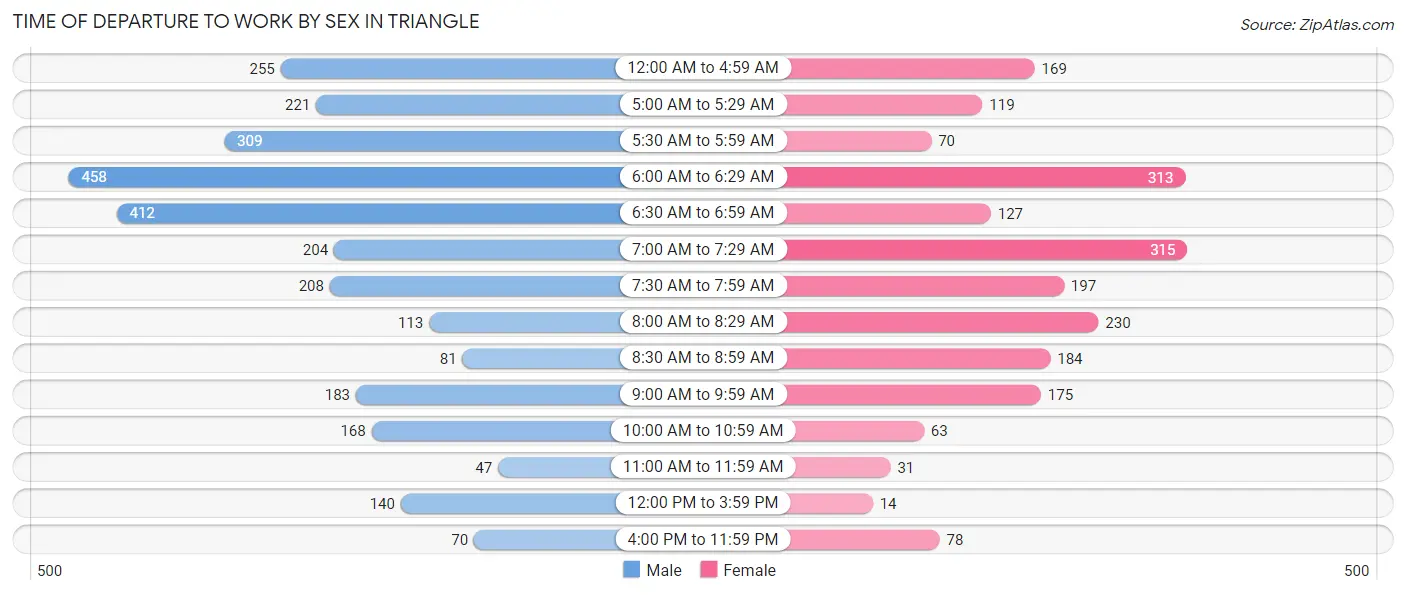
| Time of Departure | Male | Female |
| 12:00 AM to 4:59 AM | 255 (8.9%) | 169 (8.1%) |
| 5:00 AM to 5:29 AM | 221 (7.7%) | 119 (5.7%) |
| 5:30 AM to 5:59 AM | 309 (10.8%) | 70 (3.4%) |
| 6:00 AM to 6:29 AM | 458 (16.0%) | 313 (15.0%) |
| 6:30 AM to 6:59 AM | 412 (14.4%) | 127 (6.1%) |
| 7:00 AM to 7:29 AM | 204 (7.1%) | 315 (15.1%) |
| 7:30 AM to 7:59 AM | 208 (7.2%) | 197 (9.5%) |
| 8:00 AM to 8:29 AM | 113 (3.9%) | 230 (11.0%) |
| 8:30 AM to 8:59 AM | 81 (2.8%) | 184 (8.8%) |
| 9:00 AM to 9:59 AM | 183 (6.4%) | 175 (8.4%) |
| 10:00 AM to 10:59 AM | 168 (5.9%) | 63 (3.0%) |
| 11:00 AM to 11:59 AM | 47 (1.6%) | 31 (1.5%) |
| 12:00 PM to 3:59 PM | 140 (4.9%) | 14 (0.7%) |
| 4:00 PM to 11:59 PM | 70 (2.4%) | 78 (3.7%) |
| Total | 2,869 (100.0%) | 2,085 (100.0%) |
Housing Occupancy in Triangle
Occupancy by Ownership in Triangle
Of the total 3,293 dwellings in Triangle, owner-occupied units account for 2,147 (65.2%), while renter-occupied units make up 1,146 (34.8%).
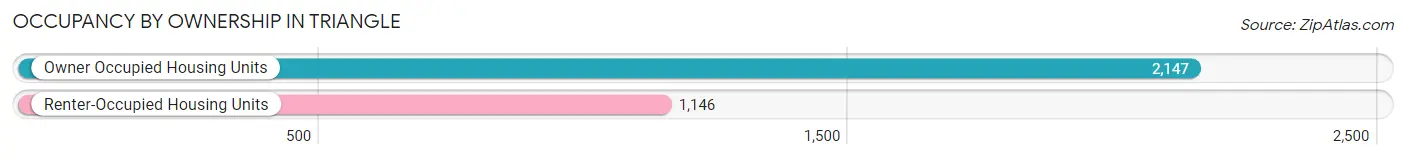
| Occupancy | # Housing Units | % Housing Units |
| Owner Occupied Housing Units | 2,147 | 65.2% |
| Renter-Occupied Housing Units | 1,146 | 34.8% |
| Total Occupied Housing Units | 3,293 | 100.0% |
Occupancy by Household Size in Triangle
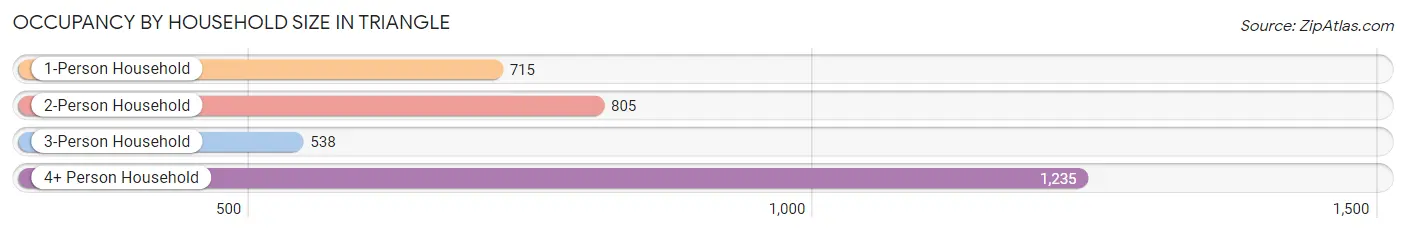
| Household Size | # Housing Units | % Housing Units |
| 1-Person Household | 715 | 21.7% |
| 2-Person Household | 805 | 24.4% |
| 3-Person Household | 538 | 16.3% |
| 4+ Person Household | 1,235 | 37.5% |
| Total Housing Units | 3,293 | 100.0% |
Occupancy by Ownership by Household Size in Triangle
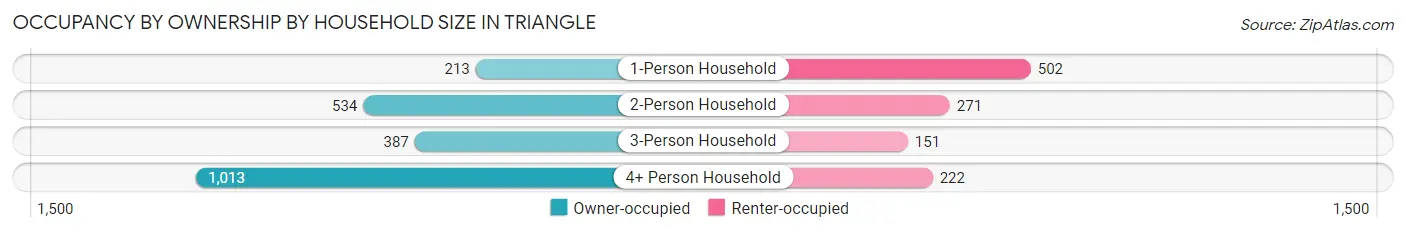
| Household Size | Owner-occupied | Renter-occupied |
| 1-Person Household | 213 (29.8%) | 502 (70.2%) |
| 2-Person Household | 534 (66.3%) | 271 (33.7%) |
| 3-Person Household | 387 (71.9%) | 151 (28.1%) |
| 4+ Person Household | 1,013 (82.0%) | 222 (18.0%) |
| Total Housing Units | 2,147 (65.2%) | 1,146 (34.8%) |
Occupancy by Educational Attainment in Triangle
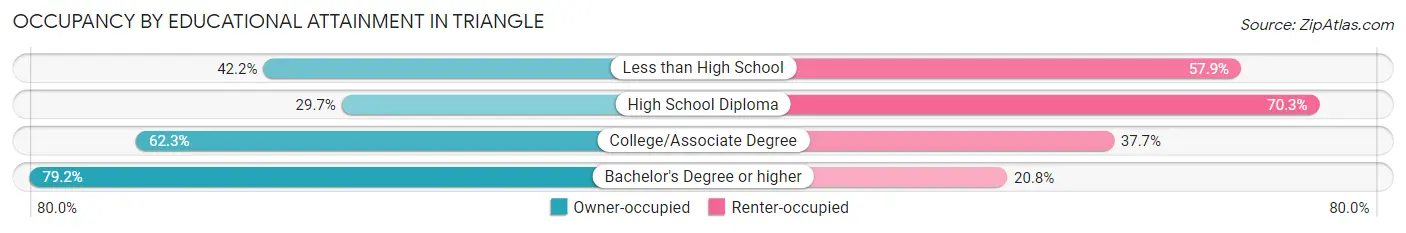
| Household Size | Owner-occupied | Renter-occupied |
| Less than High School | 102 (42.1%) | 140 (57.9%) |
| High School Diploma | 142 (29.7%) | 336 (70.3%) |
| College/Associate Degree | 499 (62.3%) | 302 (37.7%) |
| Bachelor's Degree or higher | 1,404 (79.2%) | 368 (20.8%) |
Occupancy by Age of Householder in Triangle
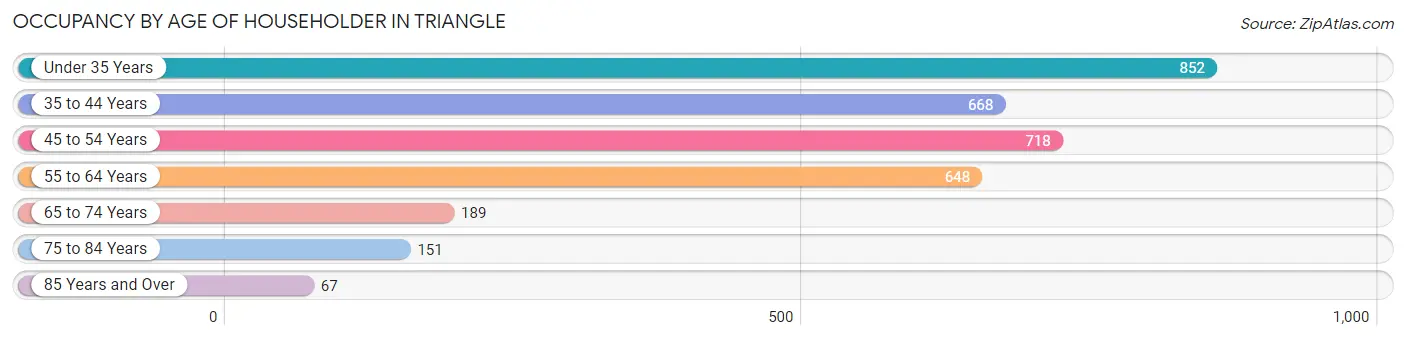
| Age Bracket | # Households | % Households |
| Under 35 Years | 852 | 25.9% |
| 35 to 44 Years | 668 | 20.3% |
| 45 to 54 Years | 718 | 21.8% |
| 55 to 64 Years | 648 | 19.7% |
| 65 to 74 Years | 189 | 5.7% |
| 75 to 84 Years | 151 | 4.6% |
| 85 Years and Over | 67 | 2.0% |
| Total | 3,293 | 100.0% |
Housing Finances in Triangle
Median Income by Occupancy in Triangle
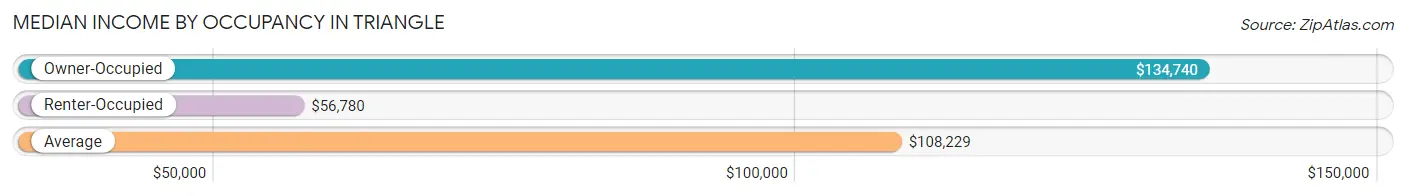
| Occupancy Type | # Households | Median Income |
| Owner-Occupied | 2,147 (65.2%) | $134,740 |
| Renter-Occupied | 1,146 (34.8%) | $56,780 |
| Average | 3,293 (100.0%) | $108,229 |
Occupancy by Householder Income Bracket in Triangle
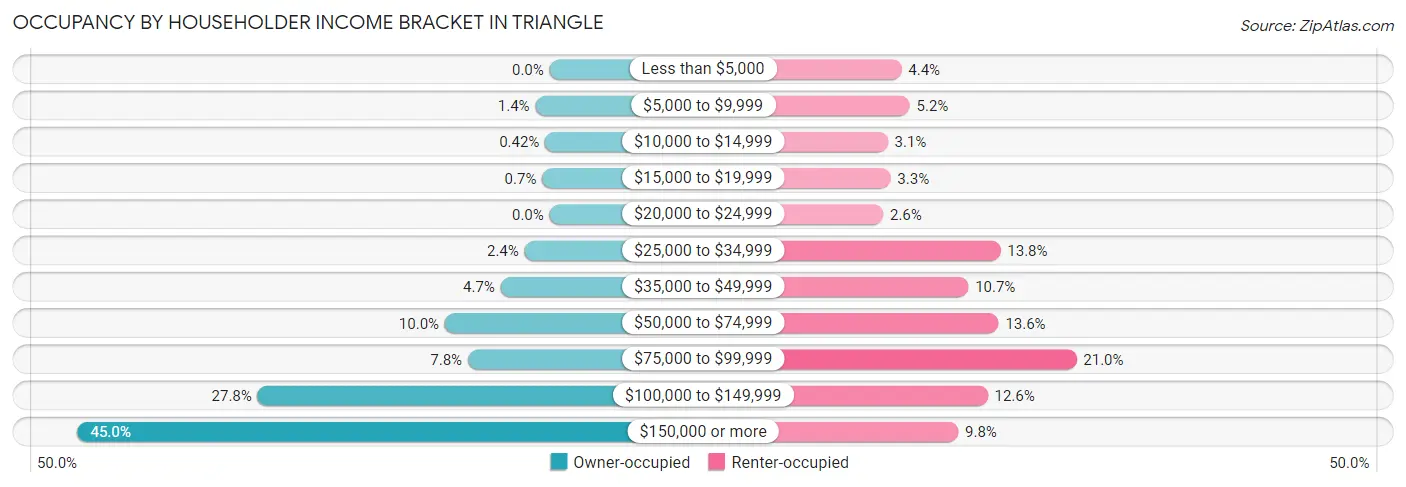
| Income Bracket | Owner-occupied | Renter-occupied |
| Less than $5,000 | 0 (0.0%) | 50 (4.4%) |
| $5,000 to $9,999 | 29 (1.3%) | 59 (5.1%) |
| $10,000 to $14,999 | 9 (0.4%) | 35 (3.0%) |
| $15,000 to $19,999 | 15 (0.7%) | 38 (3.3%) |
| $20,000 to $24,999 | 0 (0.0%) | 30 (2.6%) |
| $25,000 to $34,999 | 51 (2.4%) | 158 (13.8%) |
| $35,000 to $49,999 | 100 (4.7%) | 123 (10.7%) |
| $50,000 to $74,999 | 214 (10.0%) | 156 (13.6%) |
| $75,000 to $99,999 | 167 (7.8%) | 241 (21.0%) |
| $100,000 to $149,999 | 597 (27.8%) | 144 (12.6%) |
| $150,000 or more | 965 (45.0%) | 112 (9.8%) |
| Total | 2,147 (100.0%) | 1,146 (100.0%) |
Monthly Housing Cost Tiers in Triangle
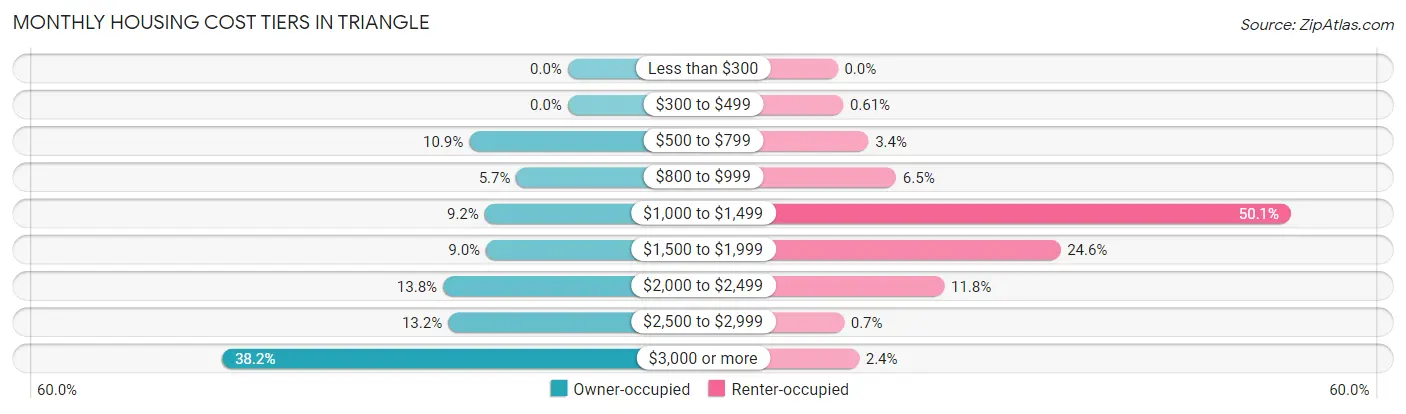
| Monthly Cost | Owner-occupied | Renter-occupied |
| Less than $300 | 0 (0.0%) | 0 (0.0%) |
| $300 to $499 | 0 (0.0%) | 7 (0.6%) |
| $500 to $799 | 234 (10.9%) | 39 (3.4%) |
| $800 to $999 | 122 (5.7%) | 74 (6.5%) |
| $1,000 to $1,499 | 197 (9.2%) | 574 (50.1%) |
| $1,500 to $1,999 | 194 (9.0%) | 282 (24.6%) |
| $2,000 to $2,499 | 296 (13.8%) | 135 (11.8%) |
| $2,500 to $2,999 | 284 (13.2%) | 8 (0.7%) |
| $3,000 or more | 820 (38.2%) | 27 (2.4%) |
| Total | 2,147 (100.0%) | 1,146 (100.0%) |
Physical Housing Characteristics in Triangle
Housing Structures in Triangle
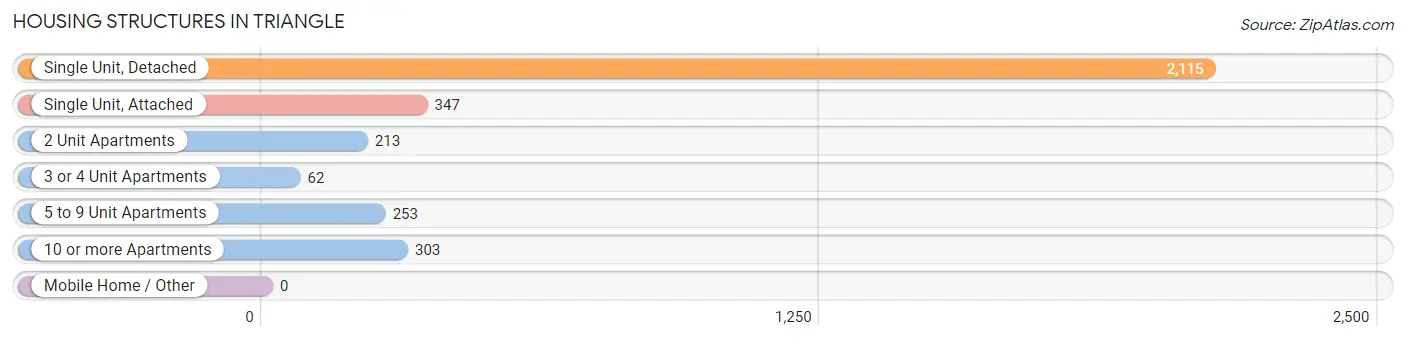
| Structure Type | # Housing Units | % Housing Units |
| Single Unit, Detached | 2,115 | 64.2% |
| Single Unit, Attached | 347 | 10.5% |
| 2 Unit Apartments | 213 | 6.5% |
| 3 or 4 Unit Apartments | 62 | 1.9% |
| 5 to 9 Unit Apartments | 253 | 7.7% |
| 10 or more Apartments | 303 | 9.2% |
| Mobile Home / Other | 0 | 0.0% |
| Total | 3,293 | 100.0% |
Housing Structures by Occupancy in Triangle
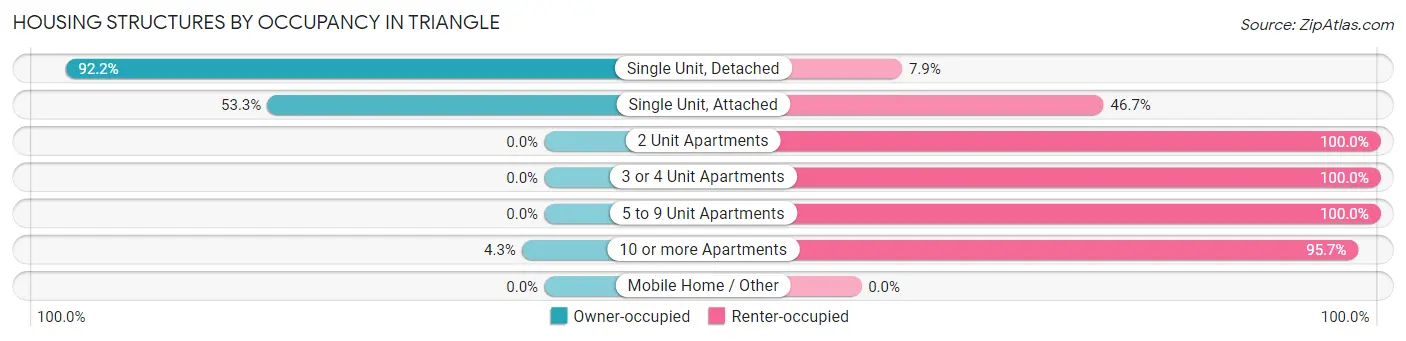
| Structure Type | Owner-occupied | Renter-occupied |
| Single Unit, Detached | 1,949 (92.1%) | 166 (7.9%) |
| Single Unit, Attached | 185 (53.3%) | 162 (46.7%) |
| 2 Unit Apartments | 0 (0.0%) | 213 (100.0%) |
| 3 or 4 Unit Apartments | 0 (0.0%) | 62 (100.0%) |
| 5 to 9 Unit Apartments | 0 (0.0%) | 253 (100.0%) |
| 10 or more Apartments | 13 (4.3%) | 290 (95.7%) |
| Mobile Home / Other | 0 (0.0%) | 0 (0.0%) |
| Total | 2,147 (65.2%) | 1,146 (34.8%) |
Housing Structures by Number of Rooms in Triangle
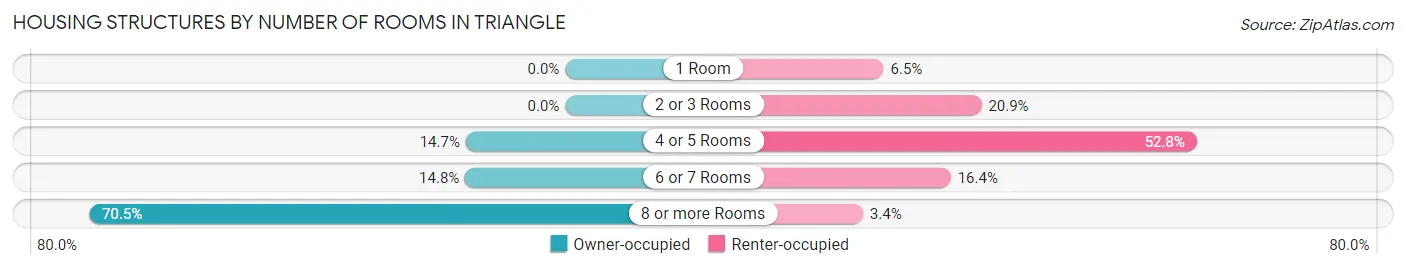
| Number of Rooms | Owner-occupied | Renter-occupied |
| 1 Room | 0 (0.0%) | 74 (6.5%) |
| 2 or 3 Rooms | 0 (0.0%) | 240 (20.9%) |
| 4 or 5 Rooms | 316 (14.7%) | 605 (52.8%) |
| 6 or 7 Rooms | 318 (14.8%) | 188 (16.4%) |
| 8 or more Rooms | 1,513 (70.5%) | 39 (3.4%) |
| Total | 2,147 (100.0%) | 1,146 (100.0%) |
Housing Structure by Heating Type in Triangle
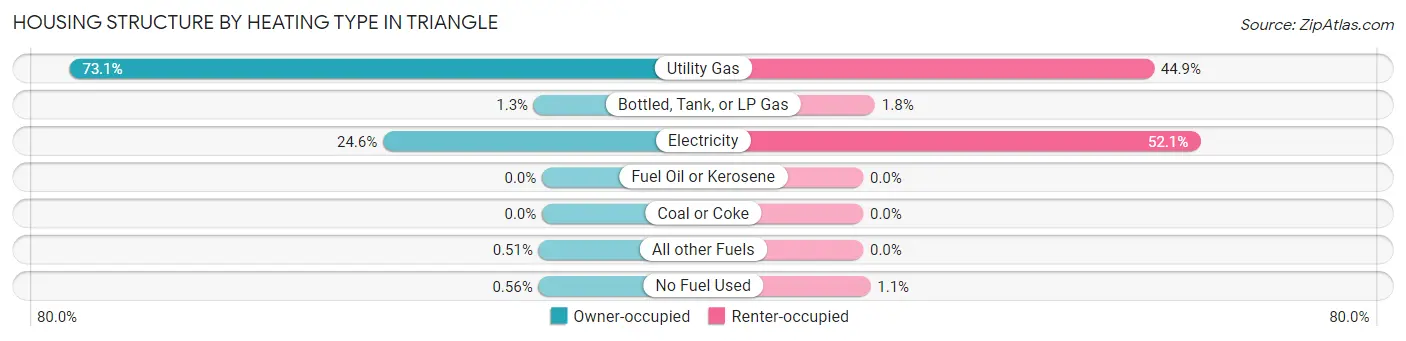
| Heating Type | Owner-occupied | Renter-occupied |
| Utility Gas | 1,569 (73.1%) | 515 (44.9%) |
| Bottled, Tank, or LP Gas | 27 (1.3%) | 21 (1.8%) |
| Electricity | 528 (24.6%) | 597 (52.1%) |
| Fuel Oil or Kerosene | 0 (0.0%) | 0 (0.0%) |
| Coal or Coke | 0 (0.0%) | 0 (0.0%) |
| All other Fuels | 11 (0.5%) | 0 (0.0%) |
| No Fuel Used | 12 (0.6%) | 13 (1.1%) |
| Total | 2,147 (100.0%) | 1,146 (100.0%) |
Household Vehicle Usage in Triangle
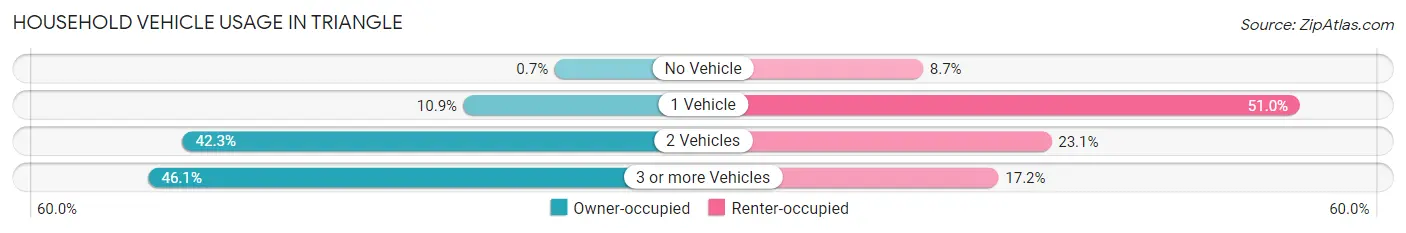
| Vehicles per Household | Owner-occupied | Renter-occupied |
| No Vehicle | 15 (0.7%) | 100 (8.7%) |
| 1 Vehicle | 234 (10.9%) | 584 (51.0%) |
| 2 Vehicles | 908 (42.3%) | 265 (23.1%) |
| 3 or more Vehicles | 990 (46.1%) | 197 (17.2%) |
| Total | 2,147 (100.0%) | 1,146 (100.0%) |
Real Estate & Mortgages in Triangle
Real Estate and Mortgage Overview in Triangle
| Characteristic | Without Mortgage | With Mortgage |
| Housing Units | 375 | 1,772 |
| Median Property Value | $380,900 | $527,800 |
| Median Household Income | $124,732 | $881 |
| Monthly Housing Costs | $670 | $820 |
| Real Estate Taxes | $3,370 | $172 |
Property Value by Mortgage Status in Triangle
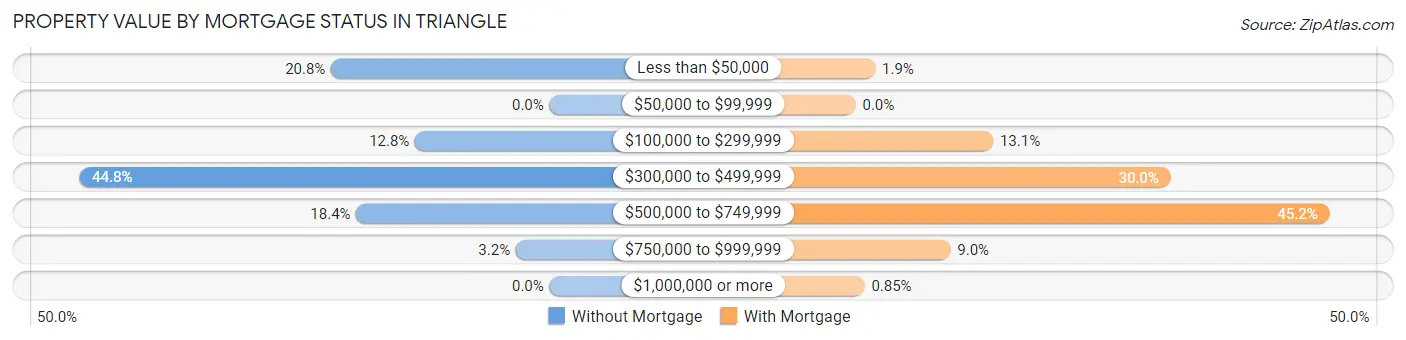
| Property Value | Without Mortgage | With Mortgage |
| Less than $50,000 | 78 (20.8%) | 33 (1.9%) |
| $50,000 to $99,999 | 0 (0.0%) | 0 (0.0%) |
| $100,000 to $299,999 | 48 (12.8%) | 232 (13.1%) |
| $300,000 to $499,999 | 168 (44.8%) | 532 (30.0%) |
| $500,000 to $749,999 | 69 (18.4%) | 800 (45.2%) |
| $750,000 to $999,999 | 12 (3.2%) | 160 (9.0%) |
| $1,000,000 or more | 0 (0.0%) | 15 (0.9%) |
| Total | 375 (100.0%) | 1,772 (100.0%) |
Household Income by Mortgage Status in Triangle
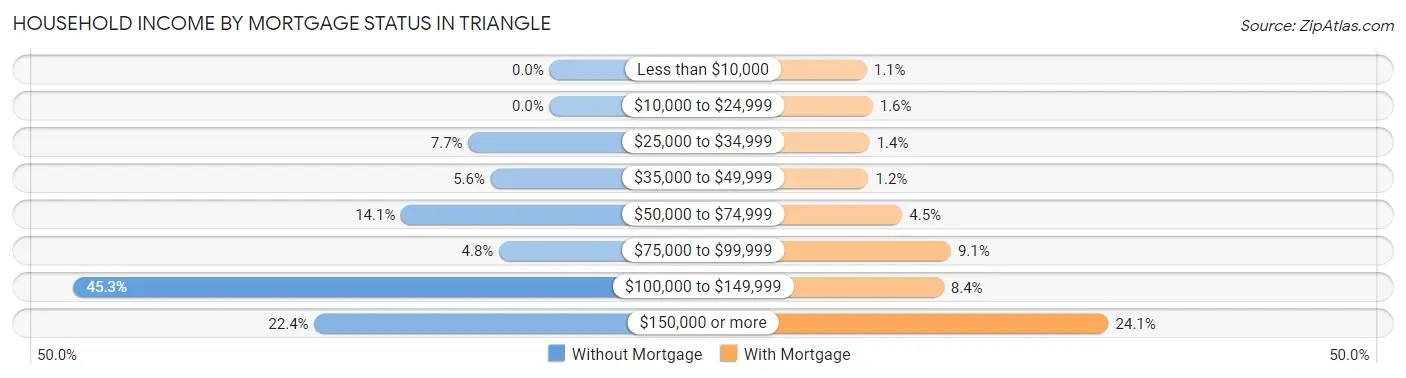
| Household Income | Without Mortgage | With Mortgage |
| Less than $10,000 | 0 (0.0%) | 19 (1.1%) |
| $10,000 to $24,999 | 0 (0.0%) | 29 (1.6%) |
| $25,000 to $34,999 | 29 (7.7%) | 24 (1.3%) |
| $35,000 to $49,999 | 21 (5.6%) | 22 (1.2%) |
| $50,000 to $74,999 | 53 (14.1%) | 79 (4.5%) |
| $75,000 to $99,999 | 18 (4.8%) | 161 (9.1%) |
| $100,000 to $149,999 | 170 (45.3%) | 149 (8.4%) |
| $150,000 or more | 84 (22.4%) | 427 (24.1%) |
| Total | 375 (100.0%) | 1,772 (100.0%) |
Property Value to Household Income Ratio in Triangle
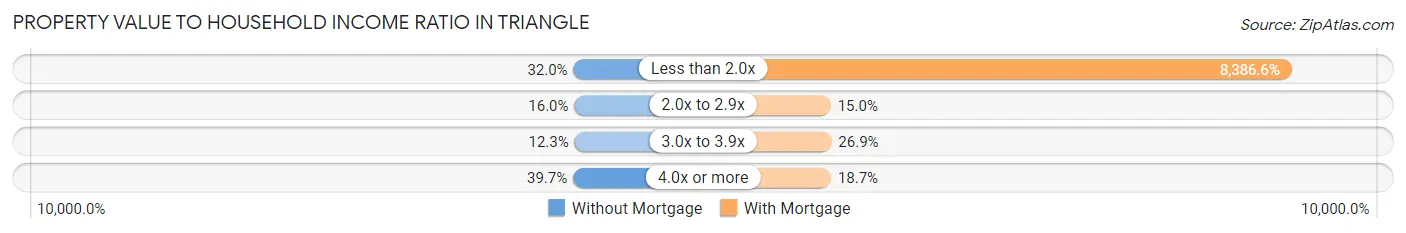
| Value-to-Income Ratio | Without Mortgage | With Mortgage |
| Less than 2.0x | 120 (32.0%) | 148,611 (8,386.6%) |
| 2.0x to 2.9x | 60 (16.0%) | 265 (14.9%) |
| 3.0x to 3.9x | 46 (12.3%) | 477 (26.9%) |
| 4.0x or more | 149 (39.7%) | 332 (18.7%) |
| Total | 375 (100.0%) | 1,772 (100.0%) |
Real Estate Taxes by Mortgage Status in Triangle
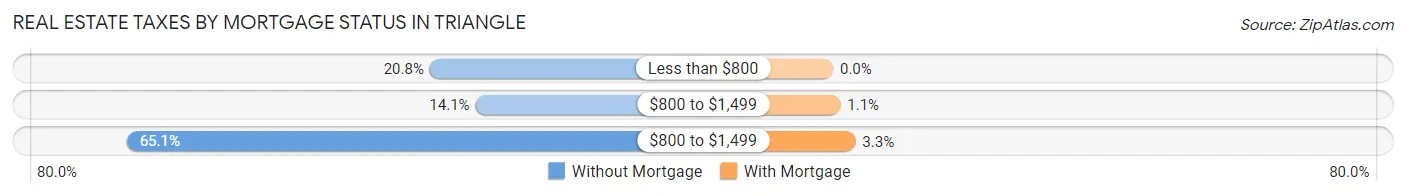
| Property Taxes | Without Mortgage | With Mortgage |
| Less than $800 | 78 (20.8%) | 0 (0.0%) |
| $800 to $1,499 | 53 (14.1%) | 19 (1.1%) |
| $800 to $1,499 | 244 (65.1%) | 58 (3.3%) |
| Total | 375 (100.0%) | 1,772 (100.0%) |
Health & Disability in Triangle
Health Insurance Coverage by Age in Triangle
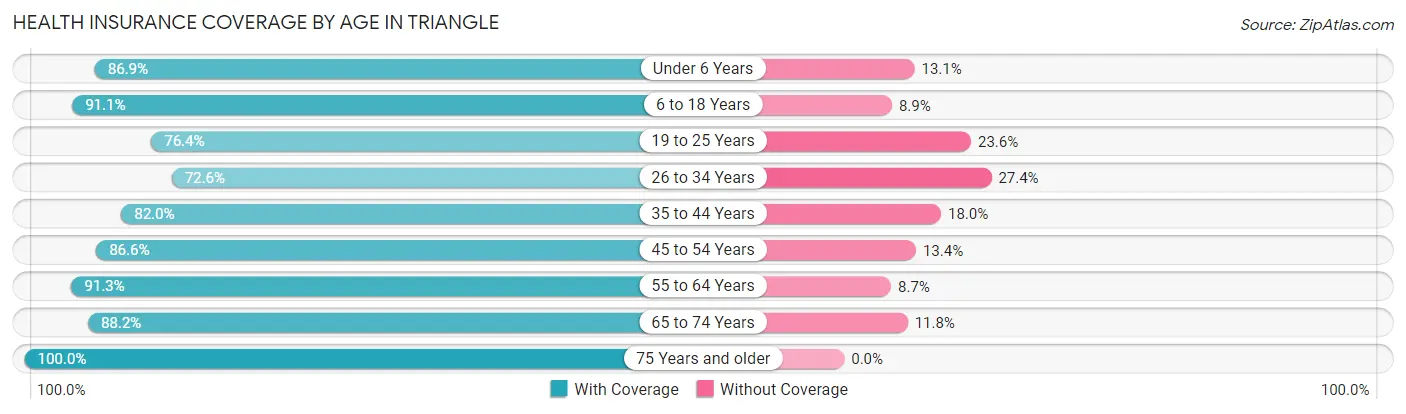
| Age Bracket | With Coverage | Without Coverage |
| Under 6 Years | 856 (86.9%) | 129 (13.1%) |
| 6 to 18 Years | 1,835 (91.1%) | 179 (8.9%) |
| 19 to 25 Years | 756 (76.4%) | 234 (23.6%) |
| 26 to 34 Years | 1,169 (72.6%) | 442 (27.4%) |
| 35 to 44 Years | 1,227 (82.0%) | 270 (18.0%) |
| 45 to 54 Years | 1,328 (86.6%) | 205 (13.4%) |
| 55 to 64 Years | 1,108 (91.3%) | 106 (8.7%) |
| 65 to 74 Years | 373 (88.2%) | 50 (11.8%) |
| 75 Years and older | 400 (100.0%) | 0 (0.0%) |
| Total | 9,052 (84.9%) | 1,615 (15.1%) |
Health Insurance Coverage by Citizenship Status in Triangle
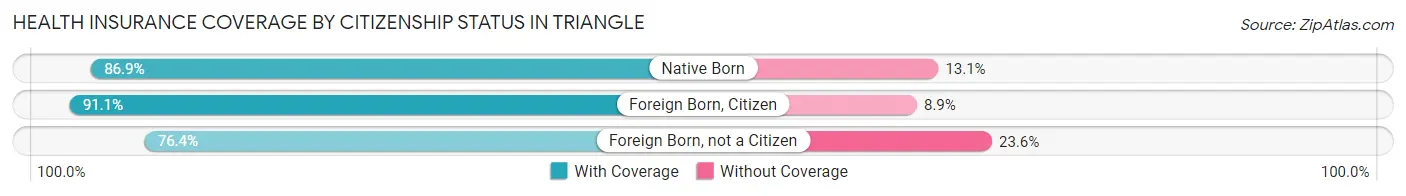
| Citizenship Status | With Coverage | Without Coverage |
| Native Born | 856 (86.9%) | 129 (13.1%) |
| Foreign Born, Citizen | 1,835 (91.1%) | 179 (8.9%) |
| Foreign Born, not a Citizen | 756 (76.4%) | 234 (23.6%) |
Health Insurance Coverage by Household Income in Triangle
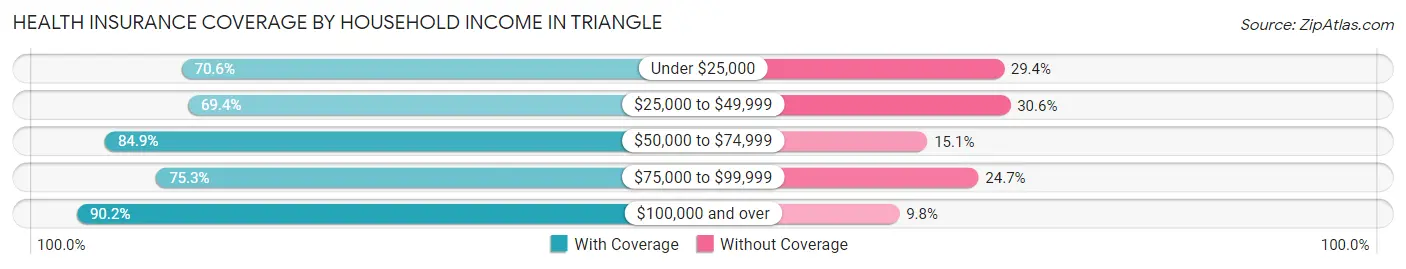
| Household Income | With Coverage | Without Coverage |
| Under $25,000 | 408 (70.6%) | 170 (29.4%) |
| $25,000 to $49,999 | 836 (69.4%) | 369 (30.6%) |
| $50,000 to $74,999 | 778 (84.9%) | 138 (15.1%) |
| $75,000 to $99,999 | 776 (75.3%) | 254 (24.7%) |
| $100,000 and over | 6,237 (90.2%) | 679 (9.8%) |
Public vs Private Health Insurance Coverage by Age in Triangle
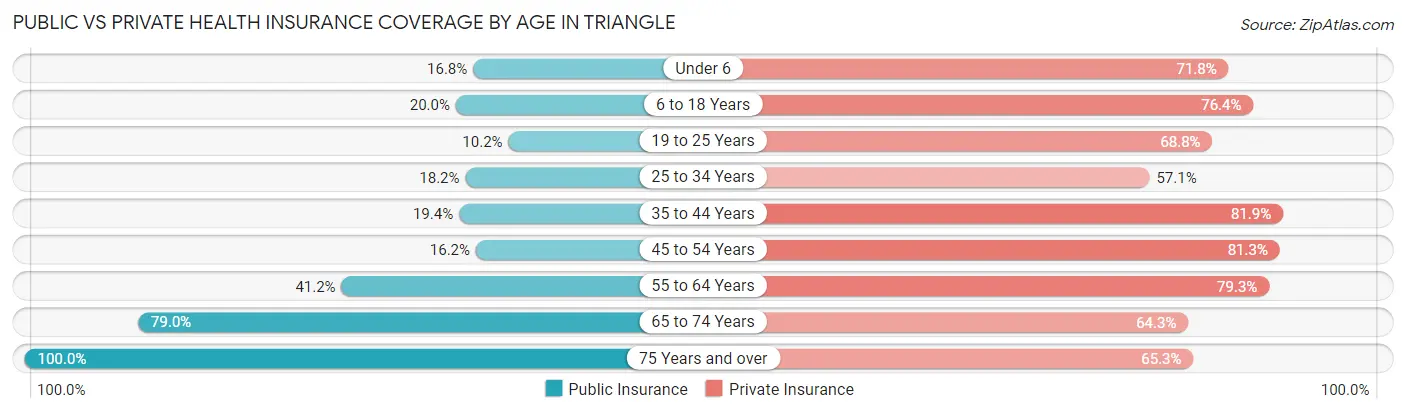
| Age Bracket | Public Insurance | Private Insurance |
| Under 6 | 165 (16.8%) | 707 (71.8%) |
| 6 to 18 Years | 402 (20.0%) | 1,538 (76.4%) |
| 19 to 25 Years | 101 (10.2%) | 681 (68.8%) |
| 25 to 34 Years | 293 (18.2%) | 920 (57.1%) |
| 35 to 44 Years | 290 (19.4%) | 1,226 (81.9%) |
| 45 to 54 Years | 249 (16.2%) | 1,246 (81.3%) |
| 55 to 64 Years | 500 (41.2%) | 963 (79.3%) |
| 65 to 74 Years | 334 (79.0%) | 272 (64.3%) |
| 75 Years and over | 400 (100.0%) | 261 (65.2%) |
| Total | 2,734 (25.6%) | 7,814 (73.3%) |
Disability Status by Sex by Age in Triangle
| Age Bracket | Male | Female |
| Under 5 Years | 0 (0.0%) | 0 (0.0%) |
| 5 to 17 Years | 34 (3.3%) | 58 (6.8%) |
| 18 to 34 Years | 56 (3.9%) | 194 (14.4%) |
| 35 to 64 Years | 430 (19.3%) | 227 (11.3%) |
| 65 to 74 Years | 73 (35.3%) | 25 (11.6%) |
| 75 Years and over | 28 (16.3%) | 75 (32.9%) |
Disability Class by Sex by Age in Triangle
Disability Class: Hearing Difficulty
| Age Bracket | Male | Female |
| Under 5 Years | 0 (0.0%) | 0 (0.0%) |
| 5 to 17 Years | 26 (2.5%) | 18 (2.1%) |
| 18 to 34 Years | 0 (0.0%) | 132 (9.8%) |
| 35 to 64 Years | 212 (9.5%) | 66 (3.3%) |
| 65 to 74 Years | 11 (5.3%) | 0 (0.0%) |
| 75 Years and over | 14 (8.1%) | 8 (3.5%) |
Disability Class: Vision Difficulty
| Age Bracket | Male | Female |
| Under 5 Years | 0 (0.0%) | 0 (0.0%) |
| 5 to 17 Years | 0 (0.0%) | 9 (1.1%) |
| 18 to 34 Years | 0 (0.0%) | 0 (0.0%) |
| 35 to 64 Years | 0 (0.0%) | 11 (0.5%) |
| 65 to 74 Years | 11 (5.3%) | 25 (11.6%) |
| 75 Years and over | 14 (8.1%) | 0 (0.0%) |
Disability Class: Cognitive Difficulty
| Age Bracket | Male | Female |
| 5 to 17 Years | 8 (0.8%) | 31 (3.6%) |
| 18 to 34 Years | 56 (3.9%) | 77 (5.7%) |
| 35 to 64 Years | 236 (10.6%) | 83 (4.1%) |
| 65 to 74 Years | 42 (20.3%) | 0 (0.0%) |
| 75 Years and over | 0 (0.0%) | 7 (3.1%) |
Disability Class: Ambulatory Difficulty
| Age Bracket | Male | Female |
| 5 to 17 Years | 0 (0.0%) | 0 (0.0%) |
| 18 to 34 Years | 0 (0.0%) | 29 (2.1%) |
| 35 to 64 Years | 130 (5.8%) | 146 (7.2%) |
| 65 to 74 Years | 62 (29.9%) | 25 (11.6%) |
| 75 Years and over | 14 (8.1%) | 54 (23.7%) |
Disability Class: Self-Care Difficulty
| Age Bracket | Male | Female |
| 5 to 17 Years | 0 (0.0%) | 0 (0.0%) |
| 18 to 34 Years | 0 (0.0%) | 0 (0.0%) |
| 35 to 64 Years | 0 (0.0%) | 28 (1.4%) |
| 65 to 74 Years | 51 (24.6%) | 0 (0.0%) |
| 75 Years and over | 0 (0.0%) | 21 (9.2%) |
Technology Access in Triangle
Computing Device Access in Triangle
| Device Type | # Households | % Households |
| Desktop or Laptop | 2,896 | 87.9% |
| Smartphone | 2,967 | 90.1% |
| Tablet | 2,475 | 75.2% |
| No Computing Device | 72 | 2.2% |
| Total | 3,293 | 100.0% |
Internet Access in Triangle
| Internet Type | # Households | % Households |
| Dial-Up Internet | 0 | 0.0% |
| Broadband Home | 2,719 | 82.6% |
| Cellular Data Only | 350 | 10.6% |
| Satellite Internet | 159 | 4.8% |
| No Internet | 190 | 5.8% |
| Total | 3,293 | 100.0% |
Triangle Summary
Triangle, Virginia is a census-designated place located in Prince William County, Virginia. It is situated in the Washington Metropolitan Area, approximately 20 miles southwest of Washington, D.C. The population of Triangle was 8,188 as of the 2010 census.
History
The area that is now Triangle was first settled in the early 1700s by European settlers. The area was originally known as “Triangle Crossroads” due to its location at the intersection of three major roads. The area was officially incorporated as the Town of Triangle in 1875.
In the late 1800s, the area was home to a large number of farms and small businesses. The town was also home to a number of churches, including the Triangle United Methodist Church, which was founded in 1876.
In the early 1900s, the town began to experience rapid growth due to its proximity to Washington, D.C. The town was home to a number of businesses, including a post office, a bank, a hotel, and a movie theater.
In the 1950s, the town experienced a period of decline as many of its businesses closed and the population began to decline. In the 1970s, the town began to experience a resurgence as new businesses opened and the population began to increase.
Geography
Triangle is located in Prince William County, Virginia. It is situated in the Washington Metropolitan Area, approximately 20 miles southwest of Washington, D.C. The town is bordered by the Occoquan River to the north and the Quantico Creek to the south.
The town has a total area of 2.2 square miles, all of which is land. The town is located at an elevation of approximately 100 feet above sea level.
Economy
The economy of Triangle is largely based on the service industry. The town is home to a number of businesses, including restaurants, retail stores, and professional services. The town is also home to a number of government agencies, including the Prince William County Police Department and the Prince William County Fire and Rescue Department.
The town is also home to a number of manufacturing companies, including a paper mill and a plastics factory.
Demographics
As of the 2010 census, the population of Triangle was 8,188. The racial makeup of the town was 79.3% White, 11.2% African American, 0.7% Native American, 2.2% Asian, 0.1% Pacific Islander, 4.2% from other races, and 2.4% from two or more races. Hispanic or Latino of any race were 8.3% of the population.
The median household income in Triangle was $68,945, and the median family income was $76,945. The per capita income for the town was $30,945. Approximately 8.3% of the population was below the poverty line.
Common Questions
What is Per Capita Income in Triangle?
Per Capita income in Triangle is $42,772.
What is the Median Family Income in Triangle?
Median Family Income in Triangle is $128,772.
What is the Median Household income in Triangle?
Median Household Income in Triangle is $108,229.
What is Income or Wage Gap in Triangle?
Income or Wage Gap in Triangle is 7.9%.
Women in Triangle earn 92.1 cents for every dollar earned by a man.
What is Inequality or Gini Index in Triangle?
Inequality or Gini Index in Triangle is 0.41.
What is the Total Population of Triangle?
Total Population of Triangle is 10,886.
What is the Total Male Population of Triangle?
Total Male Population of Triangle is 5,959.
What is the Total Female Population of Triangle?
Total Female Population of Triangle is 4,927.
What is the Ratio of Males per 100 Females in Triangle?
There are 120.95 Males per 100 Females in Triangle.
What is the Ratio of Females per 100 Males in Triangle?
There are 82.68 Females per 100 Males in Triangle.
What is the Median Population Age in Triangle?
Median Population Age in Triangle is 33.8 Years.
What is the Average Family Size in Triangle
Average Family Size in Triangle is 3.9 People.
What is the Average Household Size in Triangle
Average Household Size in Triangle is 3.3 People.
How Large is the Labor Force in Triangle?
There are 5,886 People in the Labor Forcein in Triangle.
What is the Percentage of People in the Labor Force in Triangle?
68.7% of People are in the Labor Force in Triangle.
What is the Unemployment Rate in Triangle?
Unemployment Rate in Triangle is 9.4%.