Bethel Manor, VA Map & Demographics
Bethel Manor Map
Bethel Manor Overview
$23,416
PER CAPITA INCOME
$76,333
AVG FAMILY INCOME
$76,083
AVG HOUSEHOLD INCOME
24.3%
WAGE / INCOME GAP [ % ]
75.7¢/ $1
WAGE / INCOME GAP [ $ ]
0.26
INEQUALITY / GINI INDEX
4,422
TOTAL POPULATION
2,023
MALE POPULATION
2,399
FEMALE POPULATION
84.33
MALES / 100 FEMALES
118.59
FEMALES / 100 MALES
22.5
MEDIAN AGE
3.4
AVG FAMILY SIZE
3.4
AVG HOUSEHOLD SIZE
1,945
LABOR FORCE [ PEOPLE ]
78.6%
PERCENT IN LABOR FORCE
Income in Bethel Manor
Income Overview in Bethel Manor
Per Capita Income in Bethel Manor is $23,416, while median incomes of families and households are $76,333 and $76,083 respectively.
| Characteristic | Number | Measure |
| Per Capita Income | 4,422 | $23,416 |
| Median Family Income | 1,312 | $76,333 |
| Mean Family Income | 1,312 | $82,429 |
| Median Household Income | 1,318 | $76,083 |
| Mean Household Income | 1,318 | $82,233 |
| Income Deficit | 1,312 | $0 |
| Wage / Income Gap (%) | 4,422 | 24.34% |
| Wage / Income Gap ($) | 4,422 | 75.66¢ per $1 |
| Gini / Inequality Index | 4,422 | 0.26 |
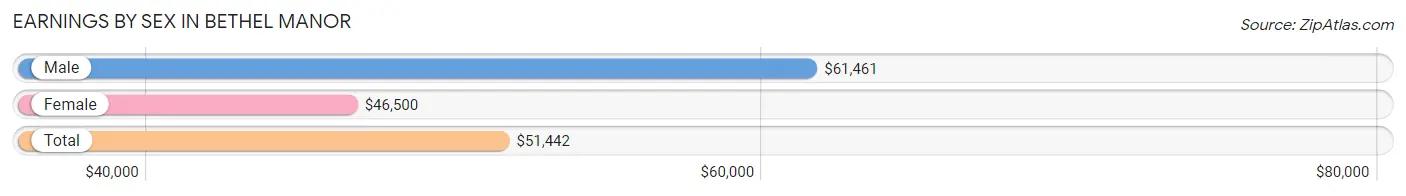
Earnings by Sex in Bethel Manor
Average Earnings in Bethel Manor are $51,442, $61,461 for men and $46,500 for women, a difference of 24.3%.
| Sex | Number | Average Earnings |
| Male | 1,062 (54.1%) | $61,461 |
| Female | 902 (45.9%) | $46,500 |
| Total | 1,964 (100.0%) | $51,442 |
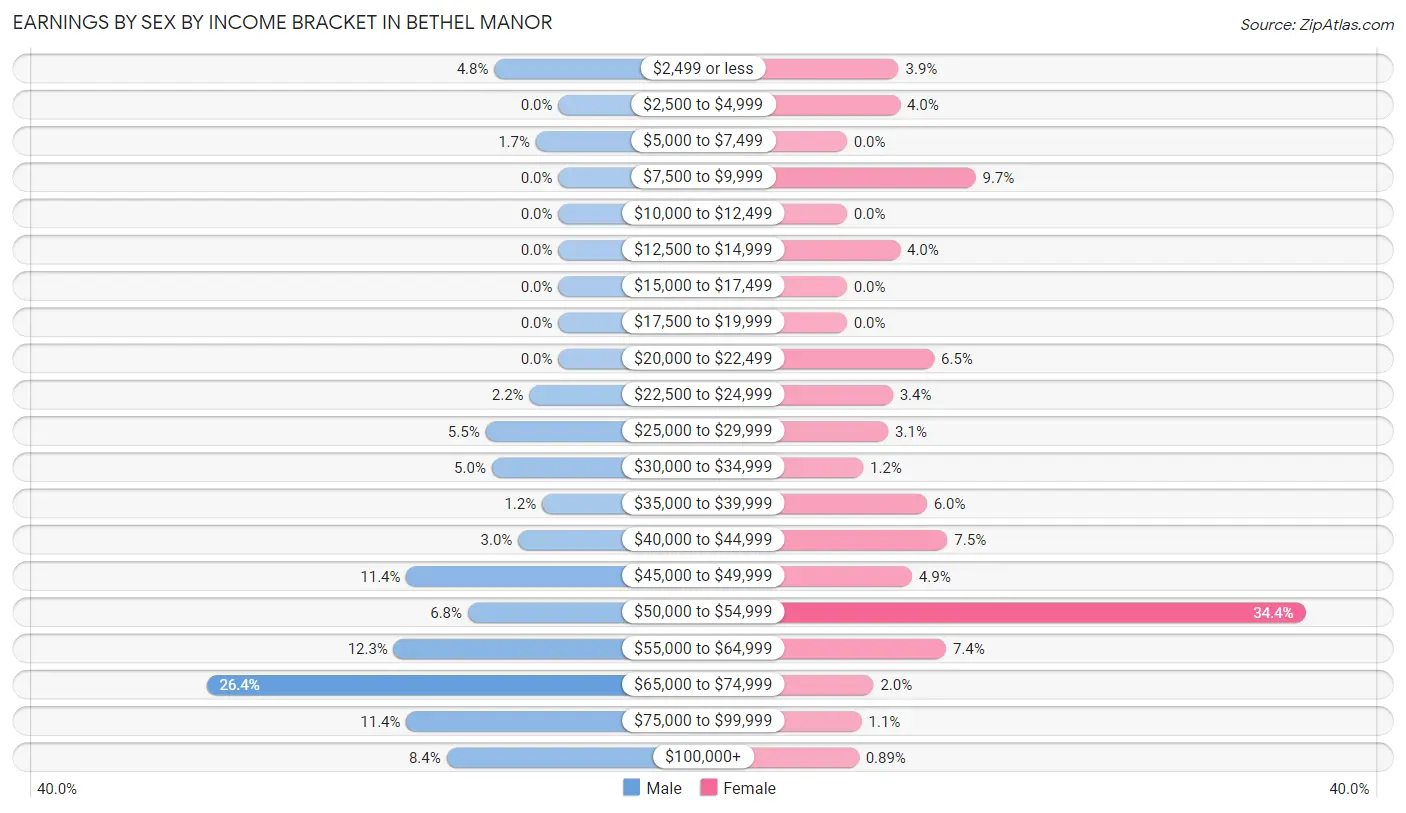
Earnings by Sex by Income Bracket in Bethel Manor
The most common earnings brackets in Bethel Manor are $65,000 to $74,999 for men (280 | 26.4%) and $50,000 to $54,999 for women (310 | 34.4%).
| Income | Male | Female |
| $2,499 or less | 51 (4.8%) | 35 (3.9%) |
| $2,500 to $4,999 | 0 (0.0%) | 36 (4.0%) |
| $5,000 to $7,499 | 18 (1.7%) | 0 (0.0%) |
| $7,500 to $9,999 | 0 (0.0%) | 87 (9.7%) |
| $10,000 to $12,499 | 0 (0.0%) | 0 (0.0%) |
| $12,500 to $14,999 | 0 (0.0%) | 36 (4.0%) |
| $15,000 to $17,499 | 0 (0.0%) | 0 (0.0%) |
| $17,500 to $19,999 | 0 (0.0%) | 0 (0.0%) |
| $20,000 to $22,499 | 0 (0.0%) | 59 (6.5%) |
| $22,500 to $24,999 | 23 (2.2%) | 31 (3.4%) |
| $25,000 to $29,999 | 58 (5.5%) | 28 (3.1%) |
| $30,000 to $34,999 | 53 (5.0%) | 11 (1.2%) |
| $35,000 to $39,999 | 13 (1.2%) | 54 (6.0%) |
| $40,000 to $44,999 | 32 (3.0%) | 68 (7.5%) |
| $45,000 to $49,999 | 121 (11.4%) | 44 (4.9%) |
| $50,000 to $54,999 | 72 (6.8%) | 310 (34.4%) |
| $55,000 to $64,999 | 131 (12.3%) | 67 (7.4%) |
| $65,000 to $74,999 | 280 (26.4%) | 18 (2.0%) |
| $75,000 to $99,999 | 121 (11.4%) | 10 (1.1%) |
| $100,000+ | 89 (8.4%) | 8 (0.9%) |
| Total | 1,062 (100.0%) | 902 (100.0%) |
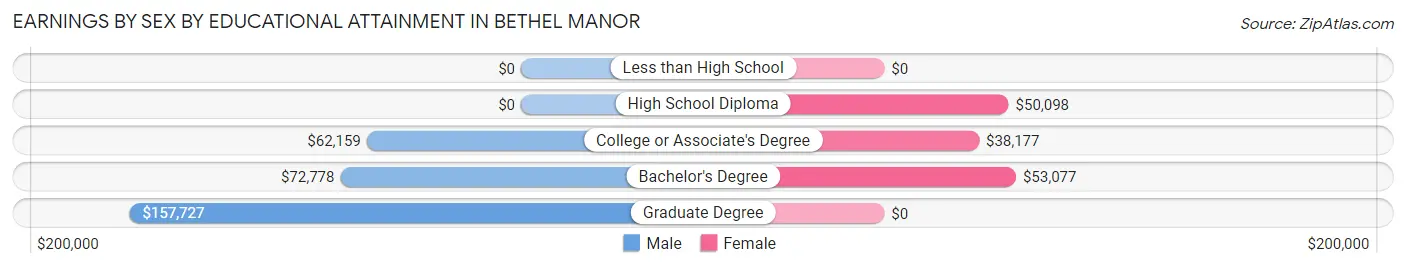
Earnings by Sex by Educational Attainment in Bethel Manor
Average earnings in Bethel Manor are $65,088 for men and $47,868 for women, a difference of 26.5%. Men with an educational attainment of graduate degree enjoy the highest average annual earnings of $157,727, while those with college or associate's degree education earn the least with $62,159. Women with an educational attainment of bachelor's degree earn the most with the average annual earnings of $53,077, while those with college or associate's degree education have the smallest earnings of $38,177.
| Educational Attainment | Male Income | Female Income |
| Less than High School | - | - |
| High School Diploma | - | - |
| College or Associate's Degree | $62,159 | $38,177 |
| Bachelor's Degree | $72,778 | $53,077 |
| Graduate Degree | $157,727 | $0 |
| Total | $65,088 | $47,868 |
Family Income in Bethel Manor
Family Income Brackets in Bethel Manor
According to the Bethel Manor family income data, there are 395 families falling into the $50,000 to $74,999 income range, which is the most common income bracket and makes up 30.1% of all families.
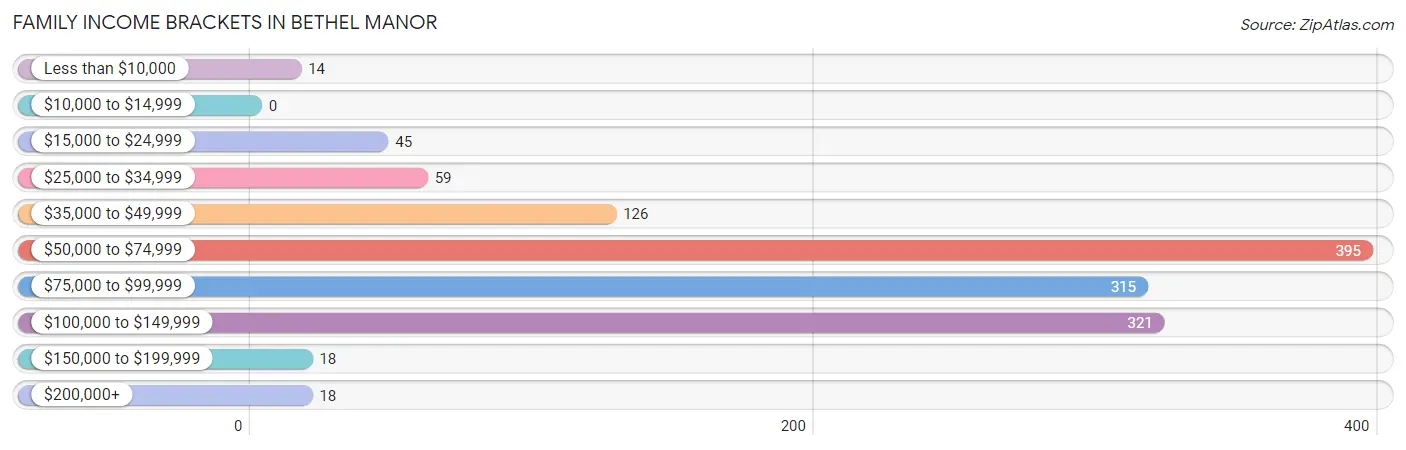
| Income Bracket | # Families | % Families |
| Less than $10,000 | 14 | 1.1% |
| $10,000 to $14,999 | 0 | 0.0% |
| $15,000 to $24,999 | 45 | 3.4% |
| $25,000 to $34,999 | 59 | 4.5% |
| $35,000 to $49,999 | 126 | 9.6% |
| $50,000 to $74,999 | 395 | 30.1% |
| $75,000 to $99,999 | 315 | 24.0% |
| $100,000 to $149,999 | 321 | 24.5% |
| $150,000 to $199,999 | 18 | 1.4% |
| $200,000+ | 18 | 1.4% |
Family Income by Famaliy Size in Bethel Manor
5-person families (217 | 16.5%) account for the highest median family income in Bethel Manor with $97,762 per family, while 2-person families (229 | 17.4%) have the highest median income of $29,438 per family member.
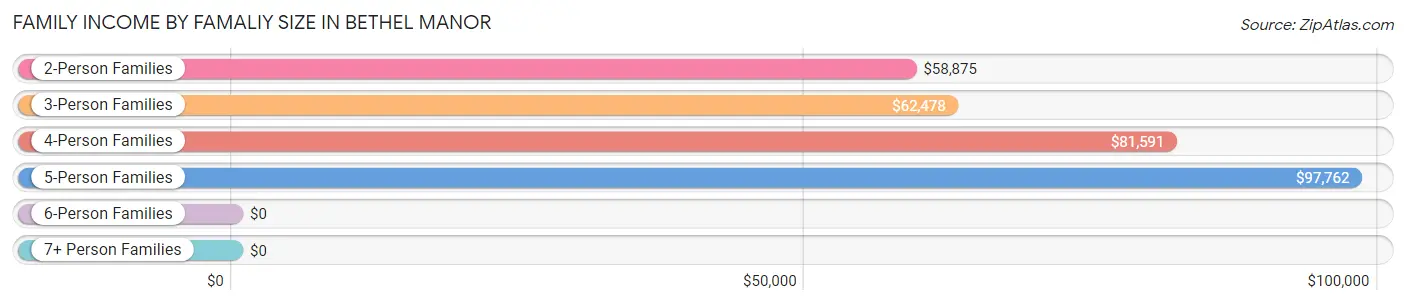
| Income Bracket | # Families | Median Income |
| 2-Person Families | 229 (17.4%) | $58,875 |
| 3-Person Families | 336 (25.6%) | $62,478 |
| 4-Person Families | 464 (35.4%) | $81,591 |
| 5-Person Families | 217 (16.5%) | $97,762 |
| 6-Person Families | 66 (5.0%) | $0 |
| 7+ Person Families | 0 (0.0%) | $0 |
| Total | 1,312 (100.0%) | $76,333 |
Family Income by Number of Earners in Bethel Manor
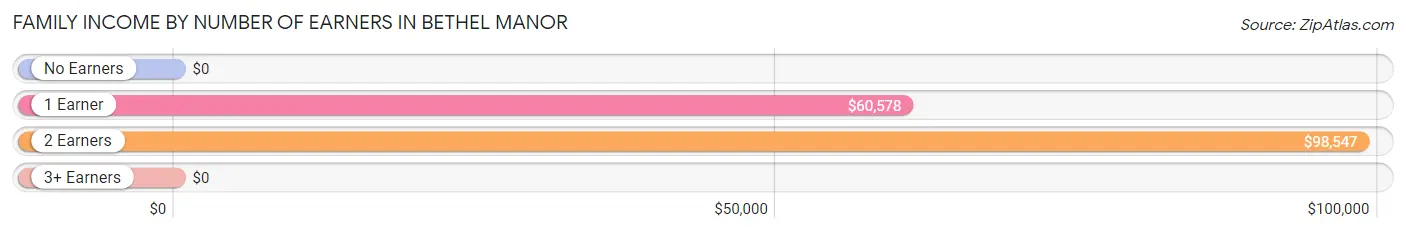
| Number of Earners | # Families | Median Income |
| No Earners | 15 (1.1%) | $0 |
| 1 Earner | 612 (46.7%) | $60,578 |
| 2 Earners | 670 (51.1%) | $98,547 |
| 3+ Earners | 15 (1.1%) | $0 |
| Total | 1,312 (100.0%) | $76,333 |
Household Income in Bethel Manor
Household Income Brackets in Bethel Manor
With 395 households falling in the category, the $50,000 to $74,999 income range is the most frequent in Bethel Manor, accounting for 30.0% of all households.
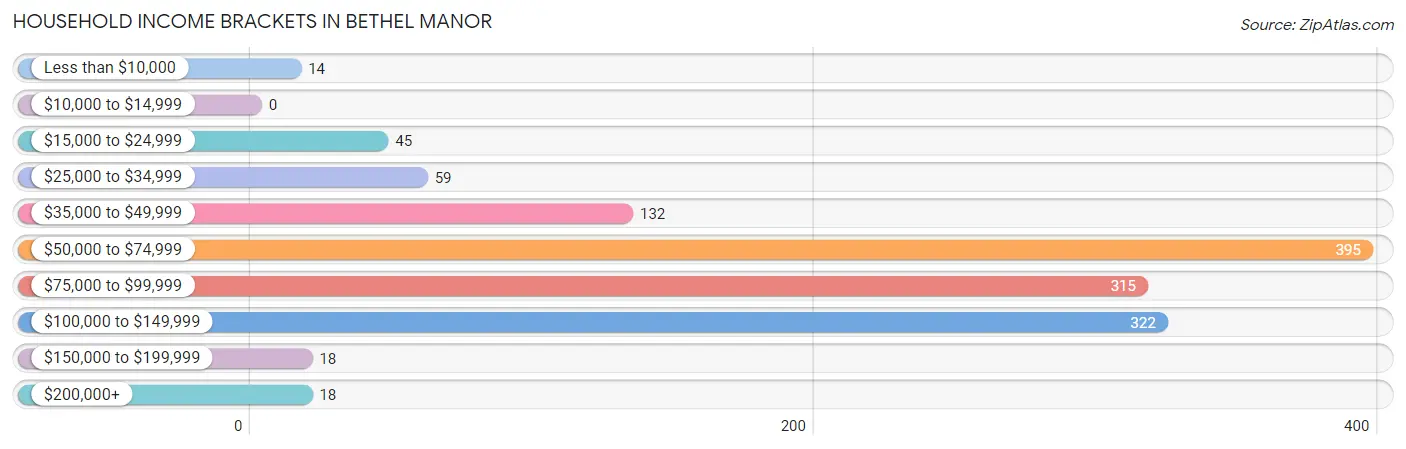
| Income Bracket | # Households | % Households |
| Less than $10,000 | 14 | 1.1% |
| $10,000 to $14,999 | 0 | 0.0% |
| $15,000 to $24,999 | 45 | 3.4% |
| $25,000 to $34,999 | 59 | 4.5% |
| $35,000 to $49,999 | 132 | 10.0% |
| $50,000 to $74,999 | 395 | 30.0% |
| $75,000 to $99,999 | 315 | 23.9% |
| $100,000 to $149,999 | 322 | 24.4% |
| $150,000 to $199,999 | 18 | 1.4% |
| $200,000+ | 18 | 1.4% |
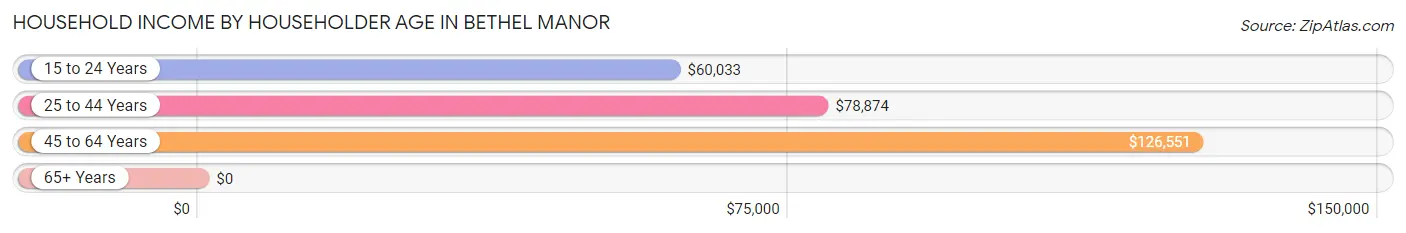
Household Income by Householder Age in Bethel Manor
The median household income in Bethel Manor is $76,083, with the highest median household income of $126,551 found in the 45 to 64 years age bracket for the primary householder. A total of 91 households (6.9%) fall into this category.
| Income Bracket | # Households | Median Income |
| 15 to 24 Years | 225 (17.1%) | $60,033 |
| 25 to 44 Years | 1,002 (76.0%) | $78,874 |
| 45 to 64 Years | 91 (6.9%) | $126,551 |
| 65+ Years | 0 (0.0%) | $0 |
| Total | 1,318 (100.0%) | $76,083 |
Poverty in Bethel Manor
Income Below Poverty by Sex and Age in Bethel Manor
With 6.2% poverty level for males and 7.7% for females among the residents of Bethel Manor, 15 year old males and 18 to 24 year old females are the most vulnerable to poverty, with 32 males (100.0%) and 46 females (14.9%) in their respective age groups living below the poverty level.
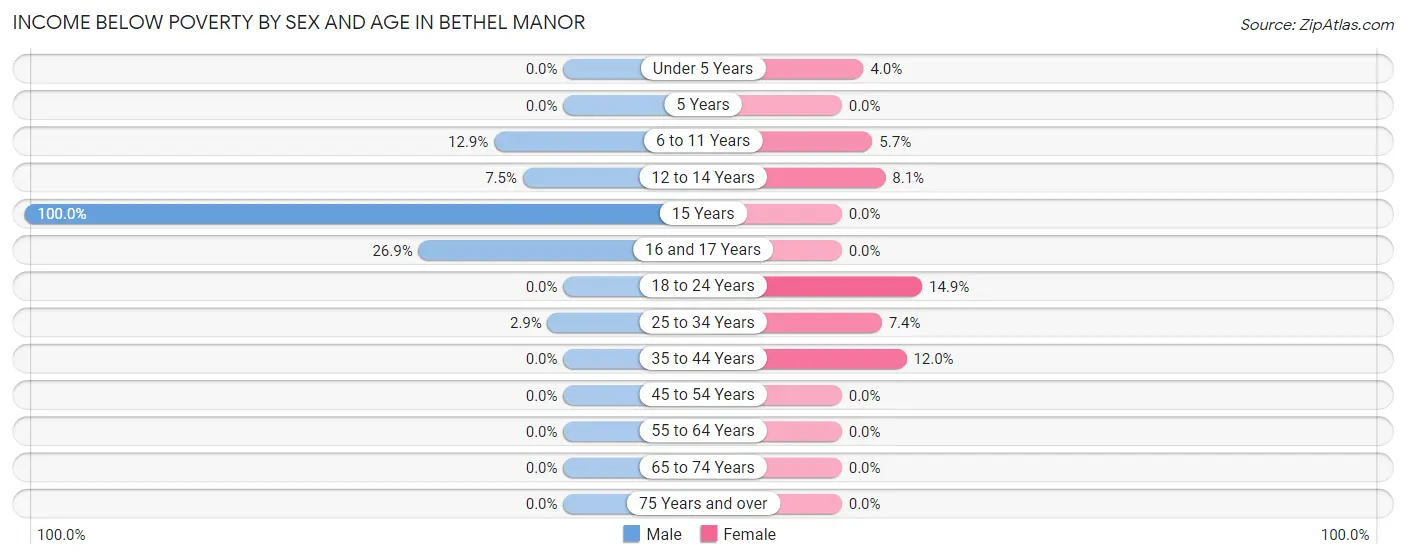
| Age Bracket | Male | Female |
| Under 5 Years | 0 (0.0%) | 17 (4.0%) |
| 5 Years | 0 (0.0%) | 0 (0.0%) |
| 6 to 11 Years | 32 (12.9%) | 27 (5.7%) |
| 12 to 14 Years | 17 (7.5%) | 11 (8.1%) |
| 15 Years | 32 (100.0%) | 0 (0.0%) |
| 16 and 17 Years | 32 (26.9%) | 0 (0.0%) |
| 18 to 24 Years | 0 (0.0%) | 46 (14.9%) |
| 25 to 34 Years | 13 (2.9%) | 38 (7.4%) |
| 35 to 44 Years | 0 (0.0%) | 45 (12.0%) |
| 45 to 54 Years | 0 (0.0%) | 0 (0.0%) |
| 55 to 64 Years | 0 (0.0%) | 0 (0.0%) |
| 65 to 74 Years | 0 (0.0%) | 0 (0.0%) |
| 75 Years and over | 0 (0.0%) | 0 (0.0%) |
| Total | 126 (6.2%) | 184 (7.7%) |
Income Above Poverty by Sex and Age in Bethel Manor
According to the poverty statistics in Bethel Manor, males aged under 5 years and females aged 5 years are the age groups that are most secure financially, with 100.0% of males and 100.0% of females in these age groups living above the poverty line.
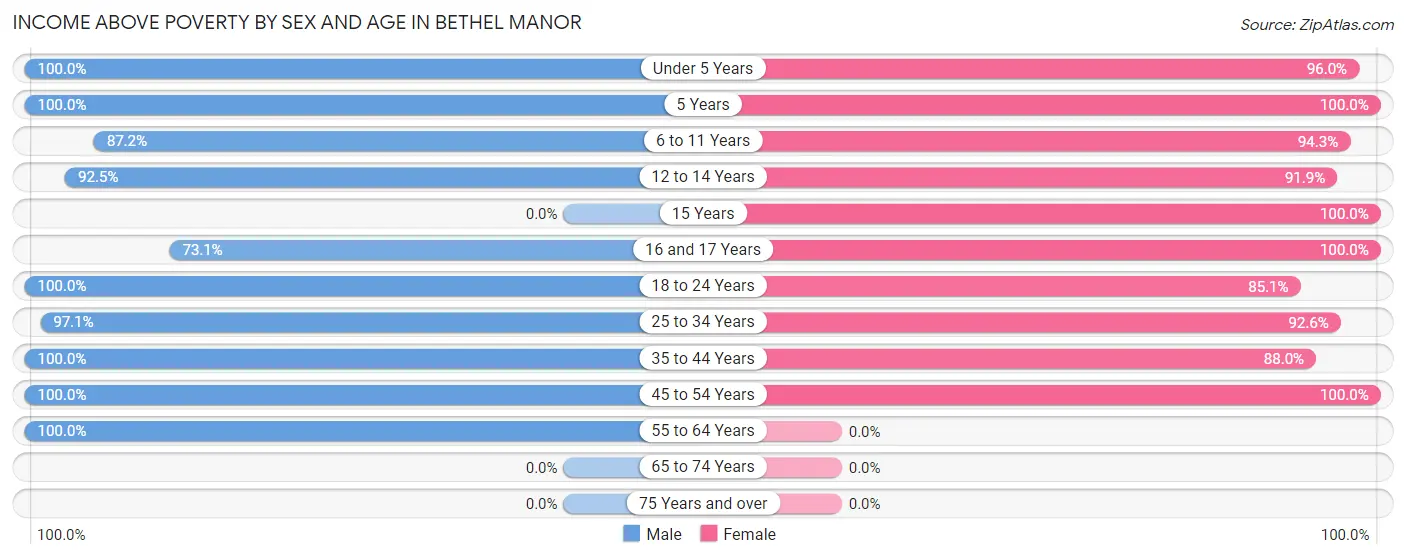
| Age Bracket | Male | Female |
| Under 5 Years | 310 (100.0%) | 406 (96.0%) |
| 5 Years | 20 (100.0%) | 68 (100.0%) |
| 6 to 11 Years | 217 (87.2%) | 448 (94.3%) |
| 12 to 14 Years | 209 (92.5%) | 125 (91.9%) |
| 15 Years | 0 (0.0%) | 9 (100.0%) |
| 16 and 17 Years | 87 (73.1%) | 24 (100.0%) |
| 18 to 24 Years | 83 (100.0%) | 263 (85.1%) |
| 25 to 34 Years | 432 (97.1%) | 475 (92.6%) |
| 35 to 44 Years | 439 (100.0%) | 330 (88.0%) |
| 45 to 54 Years | 93 (100.0%) | 67 (100.0%) |
| 55 to 64 Years | 7 (100.0%) | 0 (0.0%) |
| 65 to 74 Years | 0 (0.0%) | 0 (0.0%) |
| 75 Years and over | 0 (0.0%) | 0 (0.0%) |
| Total | 1,897 (93.8%) | 2,215 (92.3%) |
Income Below Poverty Among Married-Couple Families in Bethel Manor
The poverty statistics for married-couple families in Bethel Manor show that 2.4% or 23 of the total 961 families live below the poverty line. Families with 3 or 4 children have the highest poverty rate of 8.6%, comprising of 23 families. On the other hand, families with no children have the lowest poverty rate of 0.0%, which includes 0 families.
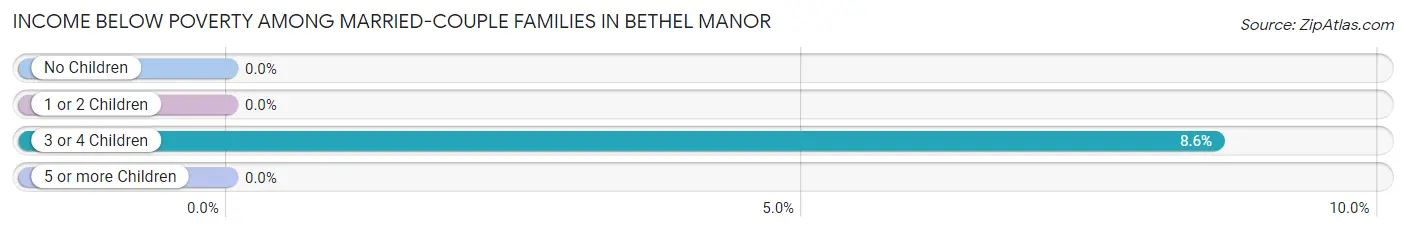
| Children | Above Poverty | Below Poverty |
| No Children | 144 (100.0%) | 0 (0.0%) |
| 1 or 2 Children | 549 (100.0%) | 0 (0.0%) |
| 3 or 4 Children | 245 (91.4%) | 23 (8.6%) |
| 5 or more Children | 0 (0.0%) | 0 (0.0%) |
| Total | 938 (97.6%) | 23 (2.4%) |
Income Below Poverty Among Single-Parent Households in Bethel Manor
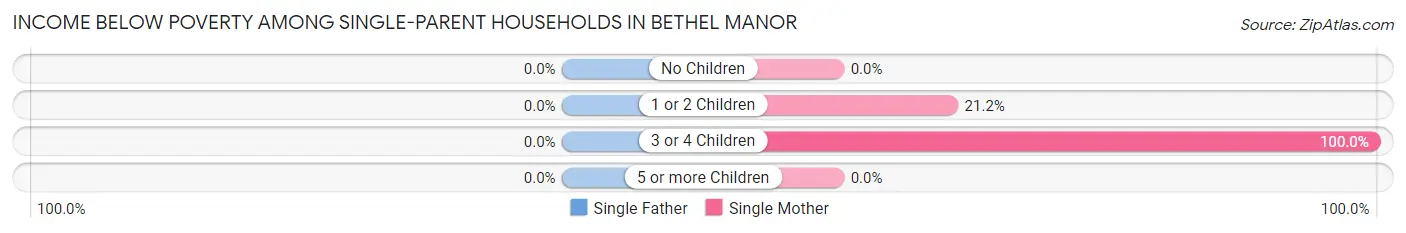
| Children | Single Father | Single Mother |
| No Children | 0 (0.0%) | 0 (0.0%) |
| 1 or 2 Children | 0 (0.0%) | 45 (21.2%) |
| 3 or 4 Children | 0 (0.0%) | 15 (100.0%) |
| 5 or more Children | 0 (0.0%) | 0 (0.0%) |
| Total | 0 (0.0%) | 60 (26.4%) |
Income Below Poverty Among Married-Couple vs Single-Parent Households in Bethel Manor
The poverty data for Bethel Manor shows that 23 of the married-couple family households (2.4%) and 60 of the single-parent households (17.1%) are living below the poverty level. Within the married-couple family households, those with 3 or 4 children have the highest poverty rate, with 23 households (8.6%) falling below the poverty line. Among the single-parent households, those with 3 or 4 children have the highest poverty rate, with 15 household (31.2%) living below poverty.
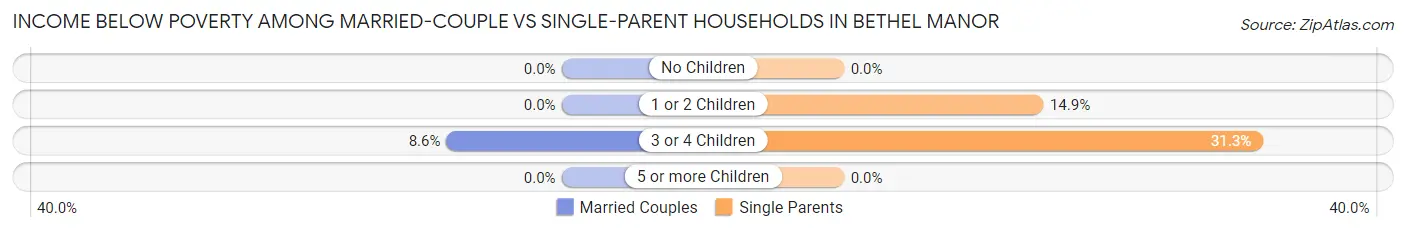
| Children | Married-Couple Families | Single-Parent Households |
| No Children | 0 (0.0%) | 0 (0.0%) |
| 1 or 2 Children | 0 (0.0%) | 45 (14.8%) |
| 3 or 4 Children | 23 (8.6%) | 15 (31.2%) |
| 5 or more Children | 0 (0.0%) | 0 (0.0%) |
| Total | 23 (2.4%) | 60 (17.1%) |
Race in Bethel Manor
The most populous races in Bethel Manor are White / Caucasian (2,603 | 58.9%), Black / African American (1,011 | 22.9%), and Hispanic or Latino (931 | 21.0%).
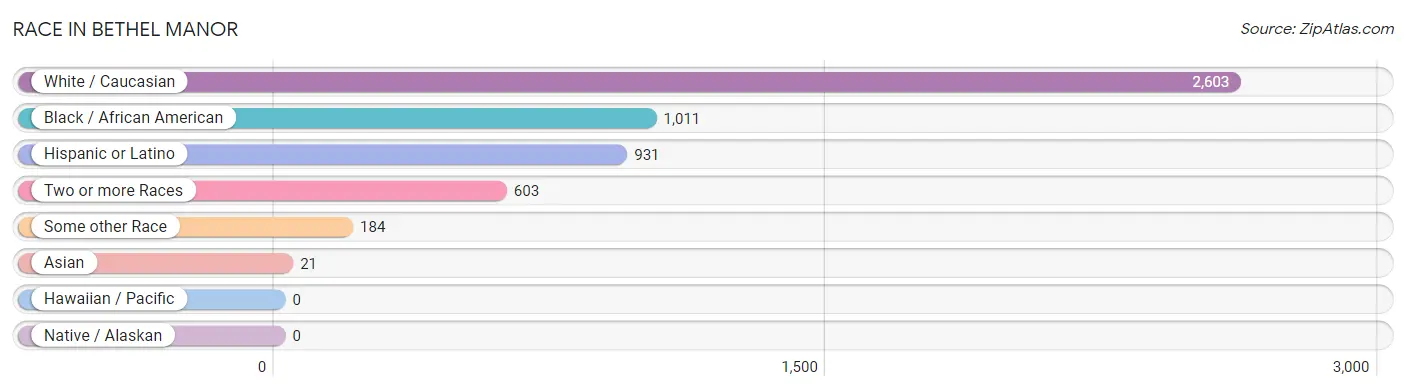
| Race | # Population | % Population |
| Asian | 21 | 0.5% |
| Black / African American | 1,011 | 22.9% |
| Hawaiian / Pacific | 0 | 0.0% |
| Hispanic or Latino | 931 | 21.0% |
| Native / Alaskan | 0 | 0.0% |
| White / Caucasian | 2,603 | 58.9% |
| Two or more Races | 603 | 13.6% |
| Some other Race | 184 | 4.2% |
| Total | 4,422 | 100.0% |
Ancestry in Bethel Manor
The most populous ancestries reported in Bethel Manor are American (538 | 12.2%), Irish (506 | 11.4%), Mexican (449 | 10.2%), English (380 | 8.6%), and Bhutanese (322 | 7.3%), together accounting for 49.6% of all Bethel Manor residents.
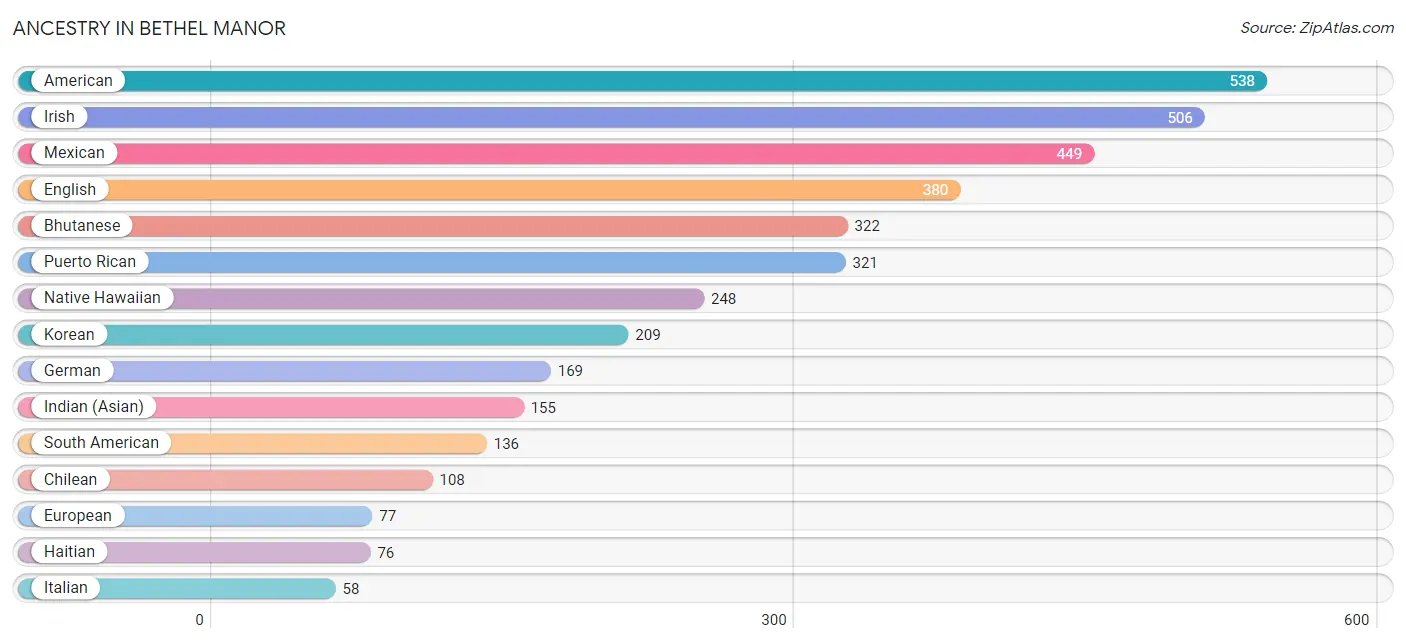
| Ancestry | # Population | % Population |
| American | 538 | 12.2% |
| Bhutanese | 322 | 7.3% |
| Burmese | 13 | 0.3% |
| Chilean | 108 | 2.4% |
| Colombian | 28 | 0.6% |
| Cuban | 25 | 0.6% |
| Dutch | 50 | 1.1% |
| Eastern European | 38 | 0.9% |
| English | 380 | 8.6% |
| European | 77 | 1.7% |
| Finnish | 19 | 0.4% |
| French Canadian | 31 | 0.7% |
| German | 169 | 3.8% |
| Haitian | 76 | 1.7% |
| Hungarian | 22 | 0.5% |
| Indian (Asian) | 155 | 3.5% |
| Irish | 506 | 11.4% |
| Italian | 58 | 1.3% |
| Korean | 209 | 4.7% |
| Mexican | 449 | 10.2% |
| Native Hawaiian | 248 | 5.6% |
| Norwegian | 54 | 1.2% |
| Puerto Rican | 321 | 7.3% |
| Scottish | 32 | 0.7% |
| South American | 136 | 3.1% |
| Subsaharan African | 44 | 1.0% |
| Trinidadian and Tobagonian | 54 | 1.2% | View All 27 Rows |
Immigrants in Bethel Manor
The most numerous immigrant groups reported in Bethel Manor came from Europe (87 | 2.0%), Latin America (44 | 1.0%), Eastern Europe (43 | 1.0%), Hungary (43 | 1.0%), and Asia (29 | 0.7%), together accounting for 5.6% of all Bethel Manor residents.
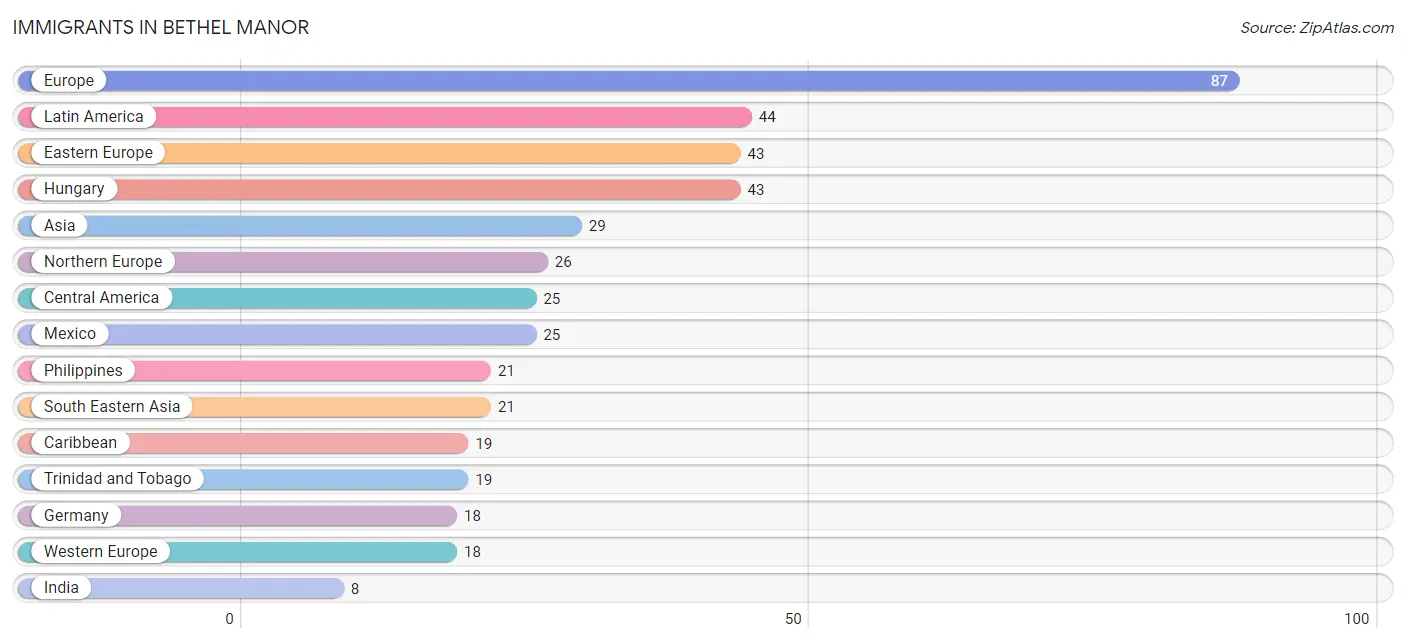
| Immigration Origin | # Population | % Population |
| Asia | 29 | 0.7% |
| Caribbean | 19 | 0.4% |
| Central America | 25 | 0.6% |
| Eastern Europe | 43 | 1.0% |
| Europe | 87 | 2.0% |
| Germany | 18 | 0.4% |
| Hungary | 43 | 1.0% |
| India | 8 | 0.2% |
| Latin America | 44 | 1.0% |
| Mexico | 25 | 0.6% |
| Northern Europe | 26 | 0.6% |
| Philippines | 21 | 0.5% |
| South Central Asia | 8 | 0.2% |
| South Eastern Asia | 21 | 0.5% |
| Trinidad and Tobago | 19 | 0.4% |
| Western Europe | 18 | 0.4% | View All 16 Rows |
Sex and Age in Bethel Manor
Sex and Age in Bethel Manor
The most populous age groups in Bethel Manor are 35 to 39 Years (321 | 15.9%) for men and Under 5 Years (423 | 17.6%) for women.
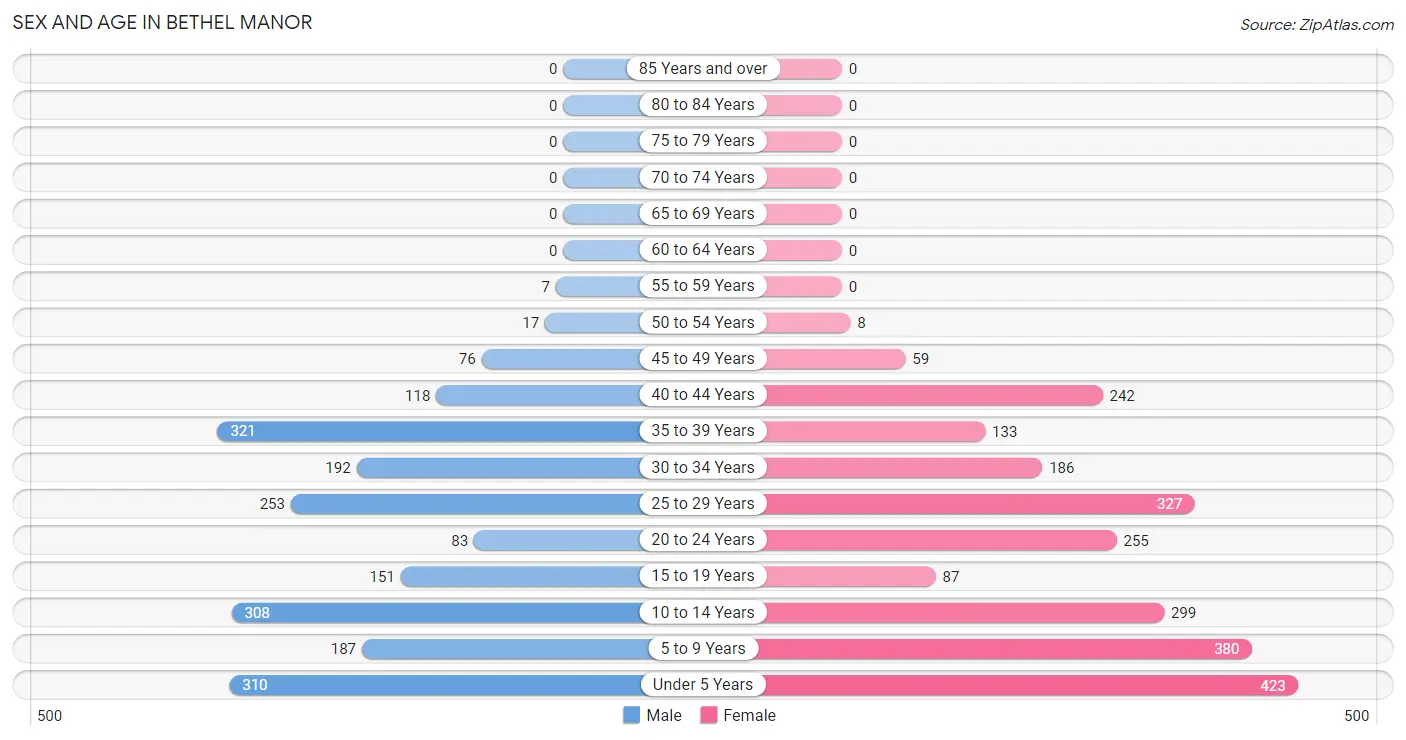
| Age Bracket | Male | Female |
| Under 5 Years | 310 (15.3%) | 423 (17.6%) |
| 5 to 9 Years | 187 (9.2%) | 380 (15.8%) |
| 10 to 14 Years | 308 (15.2%) | 299 (12.5%) |
| 15 to 19 Years | 151 (7.5%) | 87 (3.6%) |
| 20 to 24 Years | 83 (4.1%) | 255 (10.6%) |
| 25 to 29 Years | 253 (12.5%) | 327 (13.6%) |
| 30 to 34 Years | 192 (9.5%) | 186 (7.7%) |
| 35 to 39 Years | 321 (15.9%) | 133 (5.5%) |
| 40 to 44 Years | 118 (5.8%) | 242 (10.1%) |
| 45 to 49 Years | 76 (3.8%) | 59 (2.5%) |
| 50 to 54 Years | 17 (0.8%) | 8 (0.3%) |
| 55 to 59 Years | 7 (0.4%) | 0 (0.0%) |
| 60 to 64 Years | 0 (0.0%) | 0 (0.0%) |
| 65 to 69 Years | 0 (0.0%) | 0 (0.0%) |
| 70 to 74 Years | 0 (0.0%) | 0 (0.0%) |
| 75 to 79 Years | 0 (0.0%) | 0 (0.0%) |
| 80 to 84 Years | 0 (0.0%) | 0 (0.0%) |
| 85 Years and over | 0 (0.0%) | 0 (0.0%) |
| Total | 2,023 (100.0%) | 2,399 (100.0%) |
Families and Households in Bethel Manor
Median Family Size in Bethel Manor
The median family size in Bethel Manor is 3.35 persons per family, with married-couple families (961 | 73.3%) accounting for the largest median family size of 3.66 persons per family. On the other hand, single female/mother families (227 | 17.3%) represent the smallest median family size with 2.45 persons per family.
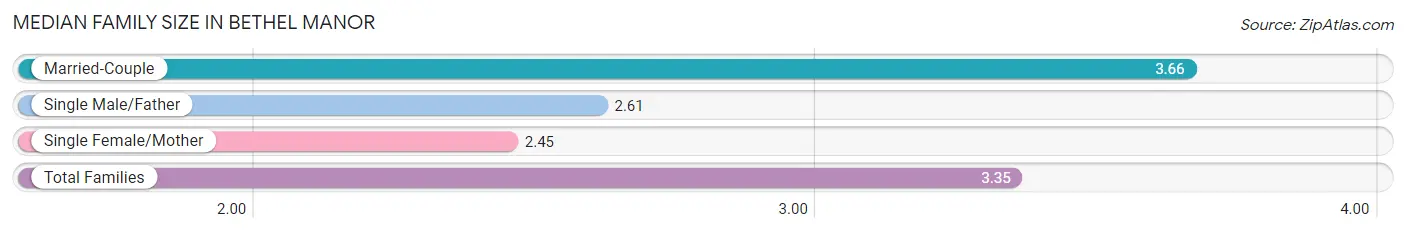
| Family Type | # Families | Family Size |
| Married-Couple | 961 (73.3%) | 3.66 |
| Single Male/Father | 124 (9.5%) | 2.61 |
| Single Female/Mother | 227 (17.3%) | 2.45 |
| Total Families | 1,312 (100.0%) | 3.35 |
Median Household Size in Bethel Manor
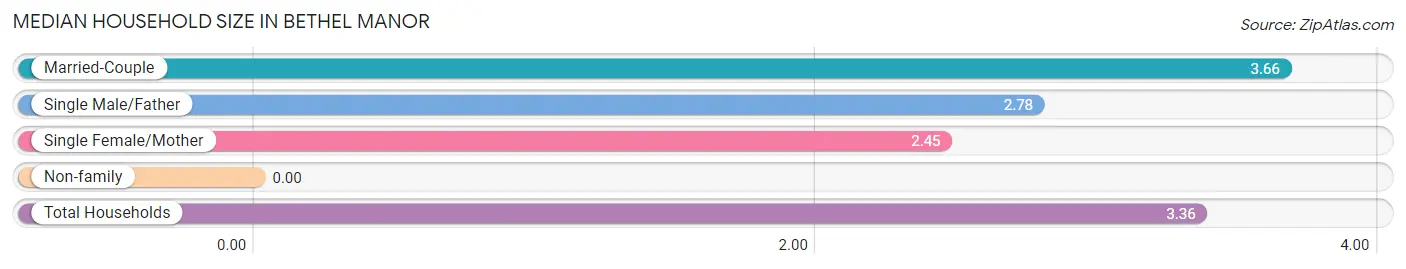
| Household Type | # Households | Household Size |
| Married-Couple | 961 (72.9%) | 3.66 |
| Single Male/Father | 124 (9.4%) | 2.78 |
| Single Female/Mother | 227 (17.2%) | 2.45 |
| Non-family | 6 (0.5%) | - |
| Total Households | 1,318 (100.0%) | 3.36 |
Household Size by Marriage Status in Bethel Manor
Out of a total of 1,318 households in Bethel Manor, 1,312 (99.5%) are family households, while 6 (0.5%) are nonfamily households. The most numerous type of family households are 4-person households, comprising 464, and the most common type of nonfamily households are 1-person households, comprising 6.
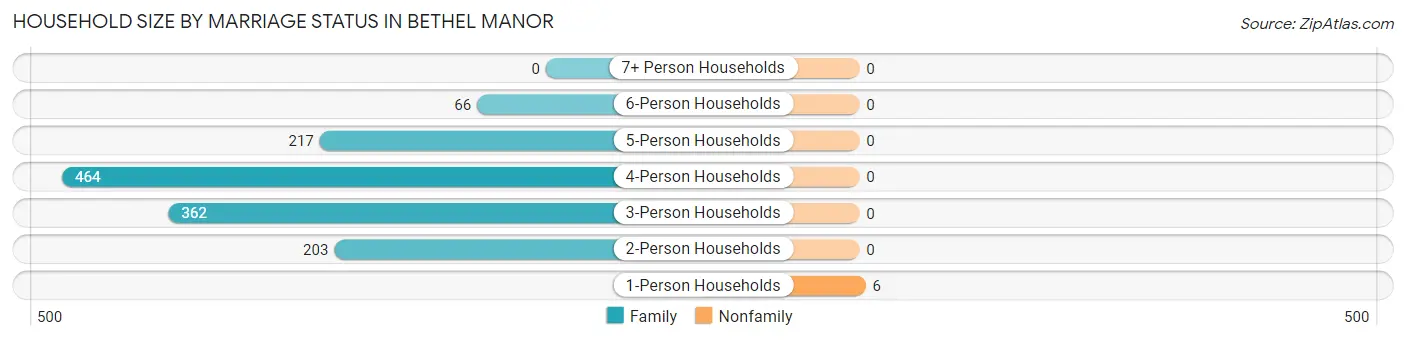
| Household Size | Family Households | Nonfamily Households |
| 1-Person Households | - | 6 (0.5%) |
| 2-Person Households | 203 (15.4%) | 0 (0.0%) |
| 3-Person Households | 362 (27.5%) | 0 (0.0%) |
| 4-Person Households | 464 (35.2%) | 0 (0.0%) |
| 5-Person Households | 217 (16.5%) | 0 (0.0%) |
| 6-Person Households | 66 (5.0%) | 0 (0.0%) |
| 7+ Person Households | 0 (0.0%) | 0 (0.0%) |
| Total | 1,312 (99.5%) | 6 (0.5%) |
Female Fertility in Bethel Manor
Fertility by Age in Bethel Manor
Average fertility rate in Bethel Manor is 116.0 births per 1,000 women. Women in the age bracket of 20 to 34 years have the highest fertility rate with 139.0 births per 1,000 women. Women in the age bracket of 20 to 34 years acount for 71.3% of all women with births.
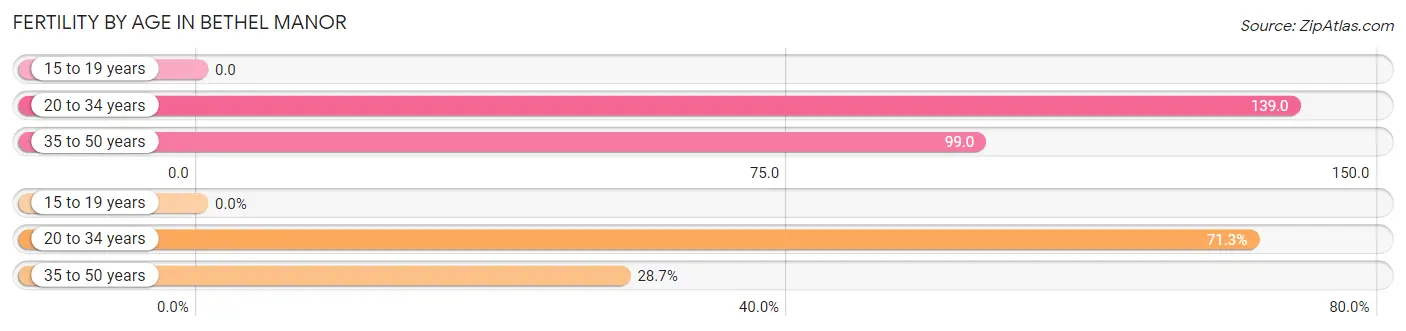
| Age Bracket | Women with Births | Births / 1,000 Women |
| 15 to 19 years | 0 (0.0%) | 0.0 |
| 20 to 34 years | 107 (71.3%) | 139.0 |
| 35 to 50 years | 43 (28.7%) | 99.0 |
| Total | 150 (100.0%) | 116.0 |
Fertility by Age by Marriage Status in Bethel Manor
76.7% of women with births (150) in Bethel Manor are married. The highest percentage of unmarried women with births falls into 20 to 34 years age bracket with 32.7% of them unmarried at the time of birth, while the lowest percentage of unmarried women with births belong to 35 to 50 years age bracket with 0.0% of them unmarried.
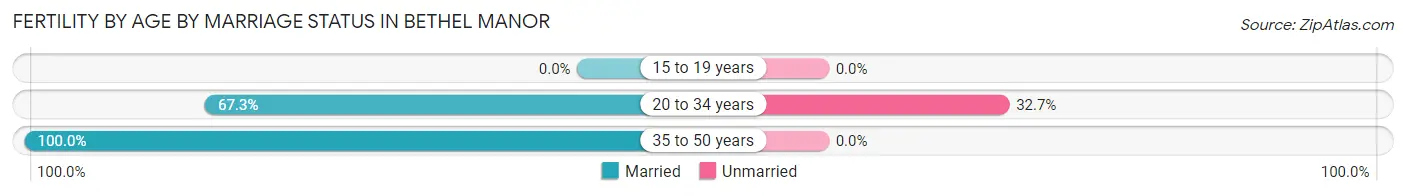
| Age Bracket | Married | Unmarried |
| 15 to 19 years | 0 (0.0%) | 0 (0.0%) |
| 20 to 34 years | 72 (67.3%) | 35 (32.7%) |
| 35 to 50 years | 43 (100.0%) | 0 (0.0%) |
| Total | 115 (76.7%) | 35 (23.3%) |
Fertility by Education in Bethel Manor
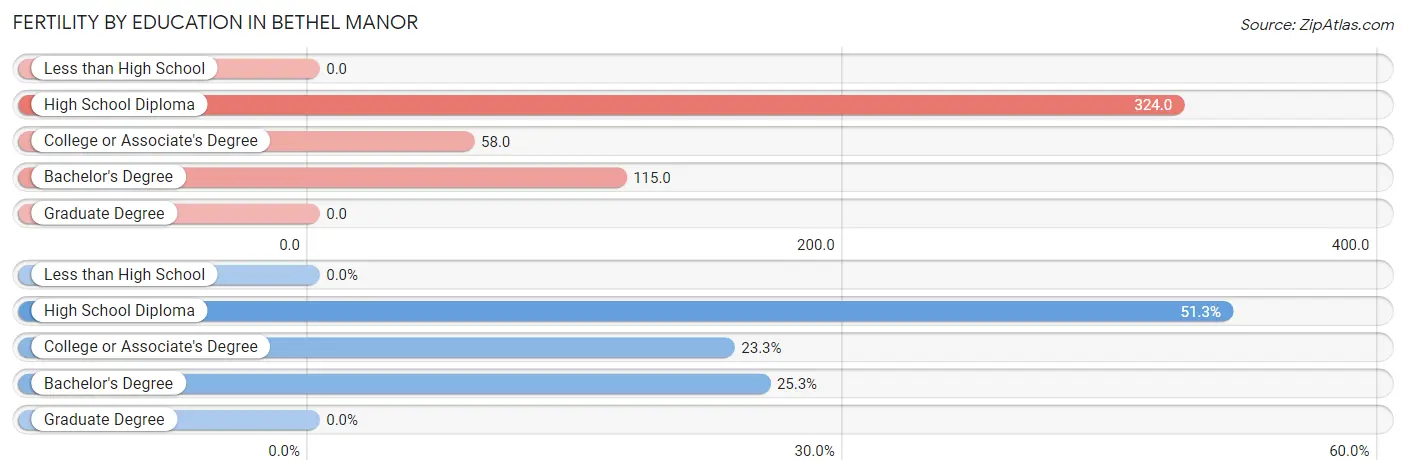
| Educational Attainment | Women with Births | Births / 1,000 Women |
| Less than High School | 0 (0.0%) | 0.0 |
| High School Diploma | 77 (51.3%) | 324.0 |
| College or Associate's Degree | 35 (23.3%) | 58.0 |
| Bachelor's Degree | 38 (25.3%) | 115.0 |
| Graduate Degree | 0 (0.0%) | 0.0 |
| Total | 150 (100.0%) | 116.0 |
Fertility by Education by Marriage Status in Bethel Manor
23.3% of women with births in Bethel Manor are unmarried. Women with the educational attainment of college or associate's degree are most likely to be married with 100.0% of them married at childbirth, while women with the educational attainment of high school diploma are least likely to be married with 45.5% of them unmarried at childbirth.
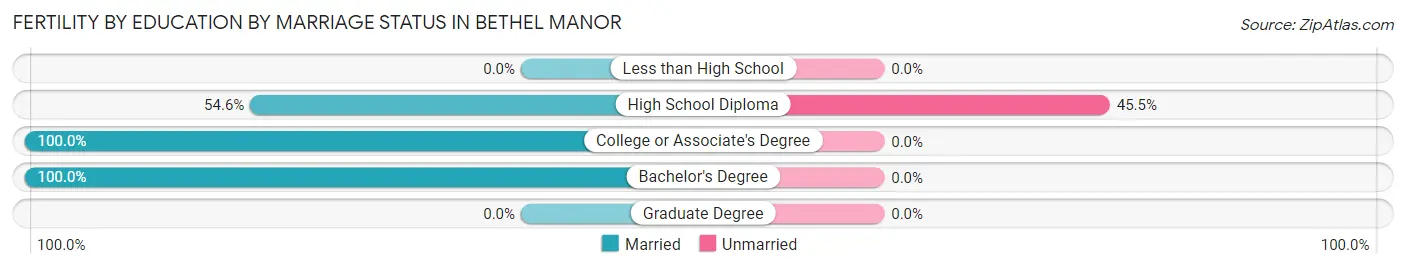
| Educational Attainment | Married | Unmarried |
| Less than High School | 0 (0.0%) | 0 (0.0%) |
| High School Diploma | 42 (54.5%) | 35 (45.5%) |
| College or Associate's Degree | 35 (100.0%) | 0 (0.0%) |
| Bachelor's Degree | 38 (100.0%) | 0 (0.0%) |
| Graduate Degree | 0 (0.0%) | 0 (0.0%) |
| Total | 115 (76.7%) | 35 (23.3%) |
Employment Characteristics in Bethel Manor
Employment by Class of Employer in Bethel Manor
Among the 1,945 employed individuals in Bethel Manor, federal government employees (1,022 | 52.5%), private company employees (699 | 35.9%), and local government employees (157 | 8.1%) make up the most common classes of employment.
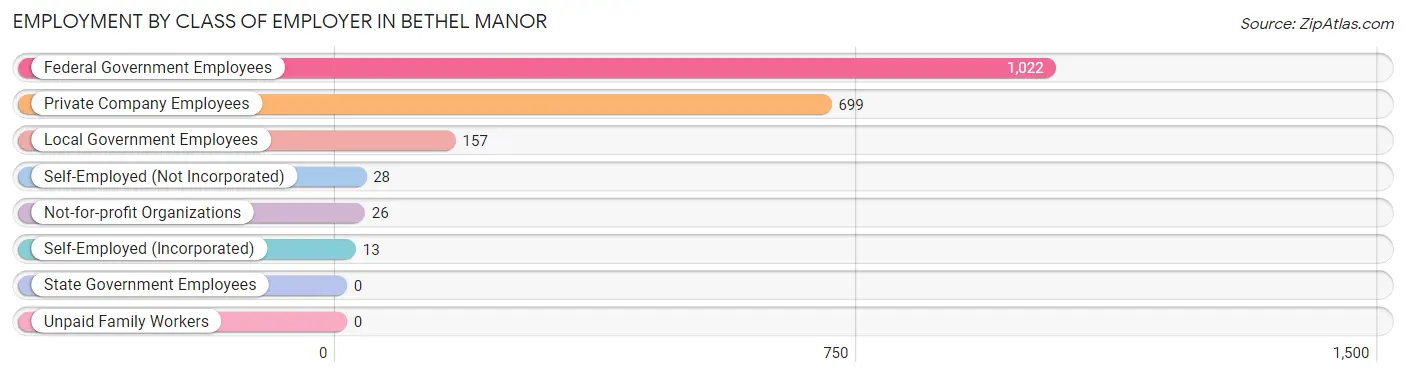
| Employer Class | # Employees | % Employees |
| Private Company Employees | 699 | 35.9% |
| Self-Employed (Incorporated) | 13 | 0.7% |
| Self-Employed (Not Incorporated) | 28 | 1.4% |
| Not-for-profit Organizations | 26 | 1.3% |
| Local Government Employees | 157 | 8.1% |
| State Government Employees | 0 | 0.0% |
| Federal Government Employees | 1,022 | 52.5% |
| Unpaid Family Workers | 0 | 0.0% |
| Total | 1,945 | 100.0% |
Employment Status by Age in Bethel Manor
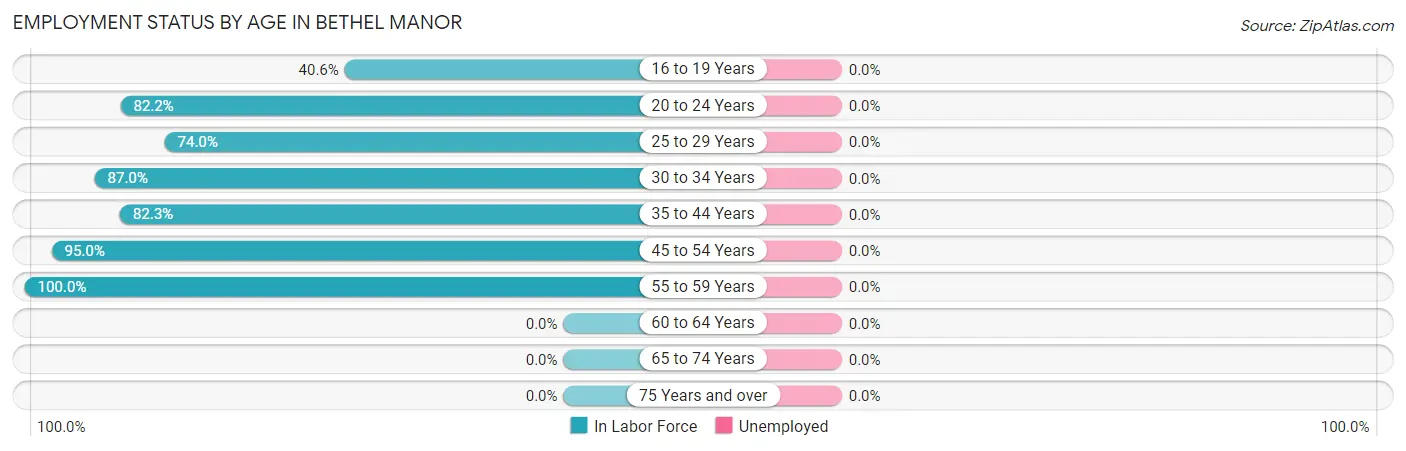
| Age Bracket | In Labor Force | Unemployed |
| 16 to 19 Years | 80 (40.6%) | 0 (0.0%) |
| 20 to 24 Years | 278 (82.2%) | 0 (0.0%) |
| 25 to 29 Years | 429 (74.0%) | 0 (0.0%) |
| 30 to 34 Years | 329 (87.0%) | 0 (0.0%) |
| 35 to 44 Years | 670 (82.3%) | 0 (0.0%) |
| 45 to 54 Years | 152 (95.0%) | 0 (0.0%) |
| 55 to 59 Years | 7 (100.0%) | 0 (0.0%) |
| 60 to 64 Years | 0 (0.0%) | 0 (0.0%) |
| 65 to 74 Years | 0 (0.0%) | 0 (0.0%) |
| 75 Years and over | 0 (0.0%) | 0 (0.0%) |
| Total | 1,945 (78.6%) | 0 (0.0%) |
Employment Status by Educational Attainment in Bethel Manor
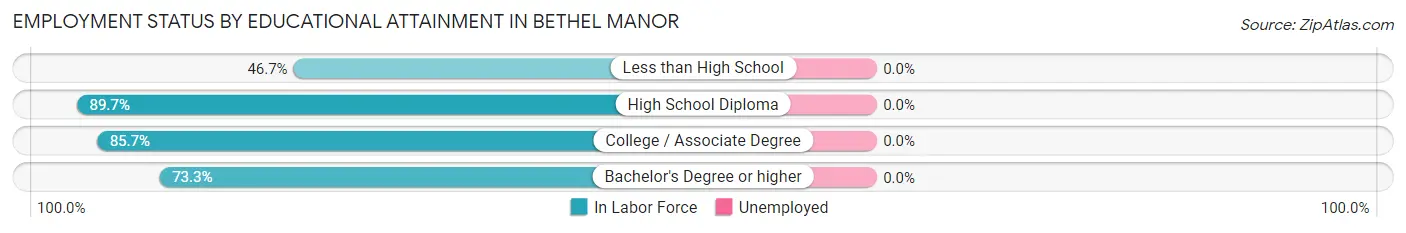
| Educational Attainment | In Labor Force | Unemployed |
| Less than High School | 7 (46.7%) | 0 (0.0%) |
| High School Diploma | 218 (89.7%) | 0 (0.0%) |
| College / Associate Degree | 899 (85.7%) | 0 (0.0%) |
| Bachelor's Degree or higher | 463 (73.3%) | 0 (0.0%) |
| Total | 1,586 (81.8%) | 0 (0.0%) |
Employment Occupations by Sex in Bethel Manor
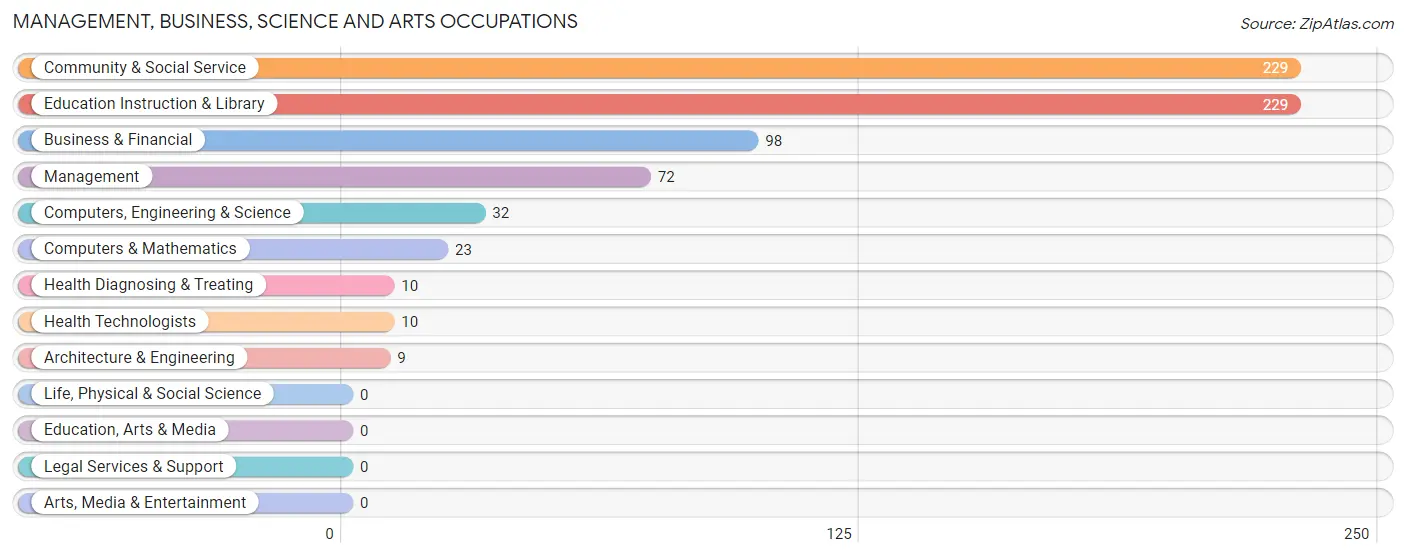
Management, Business, Science and Arts Occupations
The most common Management, Business, Science and Arts occupations in Bethel Manor are Community & Social Service (229 | 22.8%), Education Instruction & Library (229 | 22.8%), Business & Financial (98 | 9.7%), Management (72 | 7.2%), and Computers, Engineering & Science (32 | 3.2%).
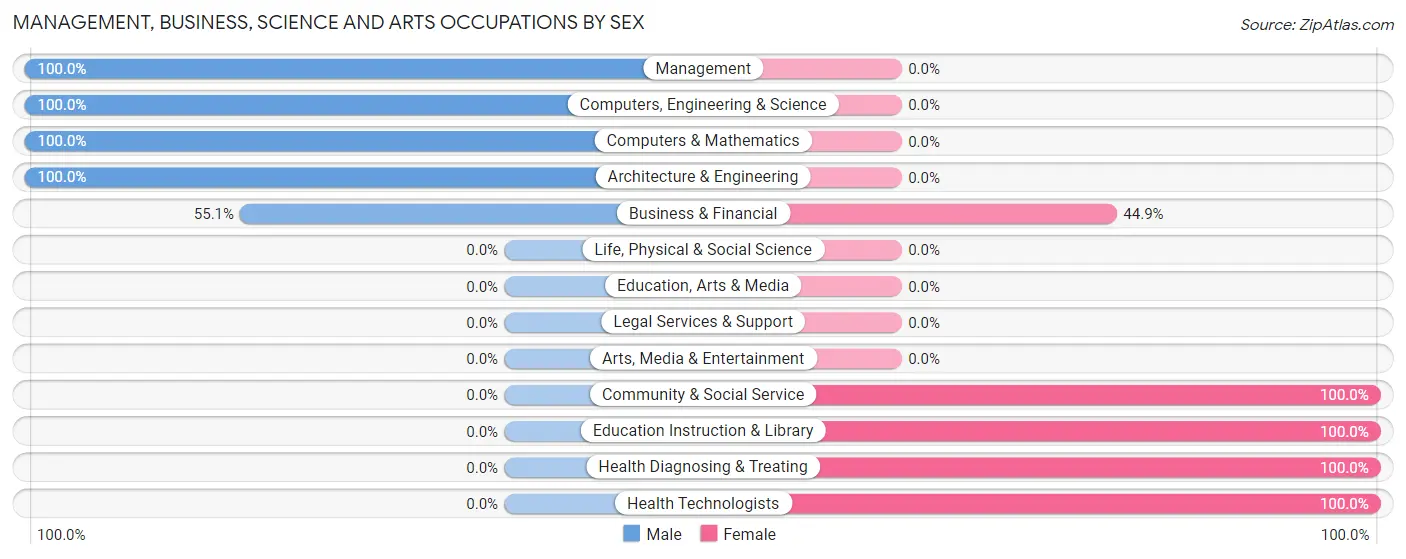
Management, Business, Science and Arts Occupations by Sex
Within the Management, Business, Science and Arts occupations in Bethel Manor, the most male-oriented occupations are Management (100.0%), Computers, Engineering & Science (100.0%), and Computers & Mathematics (100.0%), while the most female-oriented occupations are Community & Social Service (100.0%), Education Instruction & Library (100.0%), and Health Diagnosing & Treating (100.0%).
| Occupation | Male | Female |
| Management | 72 (100.0%) | 0 (0.0%) |
| Business & Financial | 54 (55.1%) | 44 (44.9%) |
| Computers, Engineering & Science | 32 (100.0%) | 0 (0.0%) |
| Computers & Mathematics | 23 (100.0%) | 0 (0.0%) |
| Architecture & Engineering | 9 (100.0%) | 0 (0.0%) |
| Life, Physical & Social Science | 0 (0.0%) | 0 (0.0%) |
| Community & Social Service | 0 (0.0%) | 229 (100.0%) |
| Education, Arts & Media | 0 (0.0%) | 0 (0.0%) |
| Legal Services & Support | 0 (0.0%) | 0 (0.0%) |
| Education Instruction & Library | 0 (0.0%) | 229 (100.0%) |
| Arts, Media & Entertainment | 0 (0.0%) | 0 (0.0%) |
| Health Diagnosing & Treating | 0 (0.0%) | 10 (100.0%) |
| Health Technologists | 0 (0.0%) | 10 (100.0%) |
| Total (Category) | 158 (35.8%) | 283 (64.2%) |
| Total (Overall) | 408 (40.6%) | 598 (59.4%) |
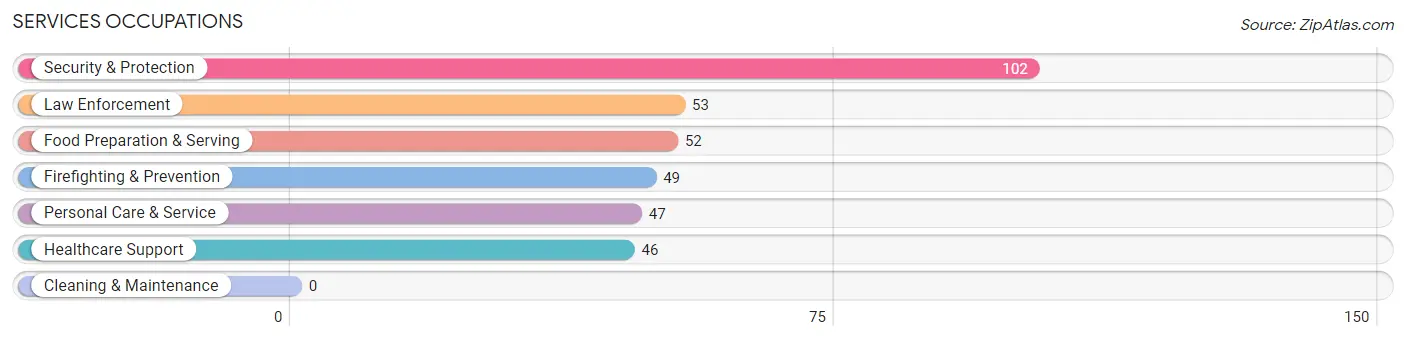
Services Occupations
The most common Services occupations in Bethel Manor are Security & Protection (102 | 10.1%), Law Enforcement (53 | 5.3%), Food Preparation & Serving (52 | 5.2%), Firefighting & Prevention (49 | 4.9%), and Personal Care & Service (47 | 4.7%).
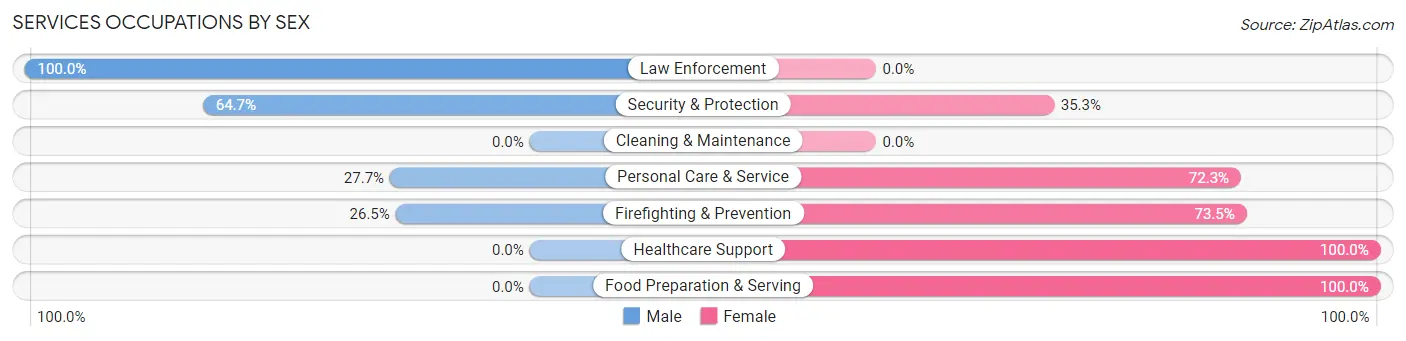
Services Occupations by Sex
Within the Services occupations in Bethel Manor, the most male-oriented occupations are Law Enforcement (100.0%), Security & Protection (64.7%), and Personal Care & Service (27.7%), while the most female-oriented occupations are Healthcare Support (100.0%), Food Preparation & Serving (100.0%), and Firefighting & Prevention (73.5%).
| Occupation | Male | Female |
| Healthcare Support | 0 (0.0%) | 46 (100.0%) |
| Security & Protection | 66 (64.7%) | 36 (35.3%) |
| Firefighting & Prevention | 13 (26.5%) | 36 (73.5%) |
| Law Enforcement | 53 (100.0%) | 0 (0.0%) |
| Food Preparation & Serving | 0 (0.0%) | 52 (100.0%) |
| Cleaning & Maintenance | 0 (0.0%) | 0 (0.0%) |
| Personal Care & Service | 13 (27.7%) | 34 (72.3%) |
| Total (Category) | 79 (32.0%) | 168 (68.0%) |
| Total (Overall) | 408 (40.6%) | 598 (59.4%) |
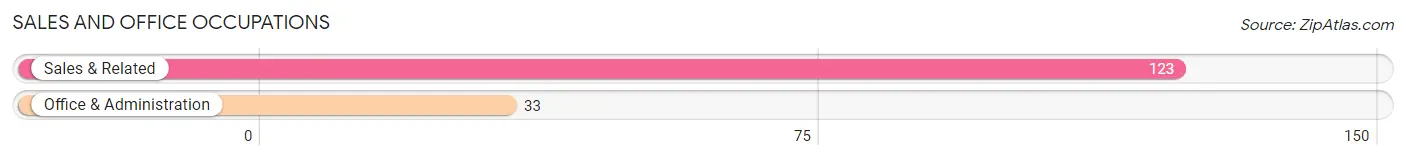
Sales and Office Occupations
The most common Sales and Office occupations in Bethel Manor are Sales & Related (123 | 12.2%), and Office & Administration (33 | 3.3%).
Sales and Office Occupations by Sex
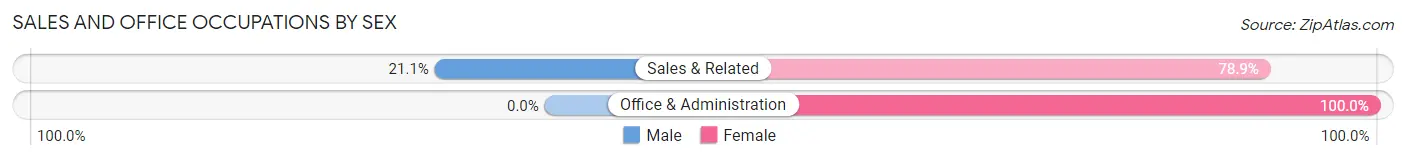
| Occupation | Male | Female |
| Sales & Related | 26 (21.1%) | 97 (78.9%) |
| Office & Administration | 0 (0.0%) | 33 (100.0%) |
| Total (Category) | 26 (16.7%) | 130 (83.3%) |
| Total (Overall) | 408 (40.6%) | 598 (59.4%) |
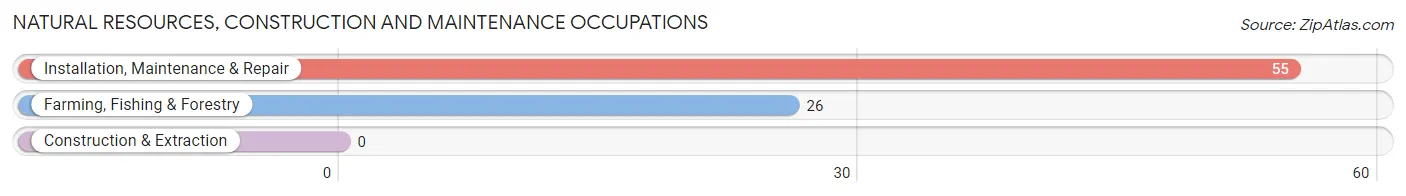
Natural Resources, Construction and Maintenance Occupations
The most common Natural Resources, Construction and Maintenance occupations in Bethel Manor are Installation, Maintenance & Repair (55 | 5.5%), and Farming, Fishing & Forestry (26 | 2.6%).
Natural Resources, Construction and Maintenance Occupations by Sex
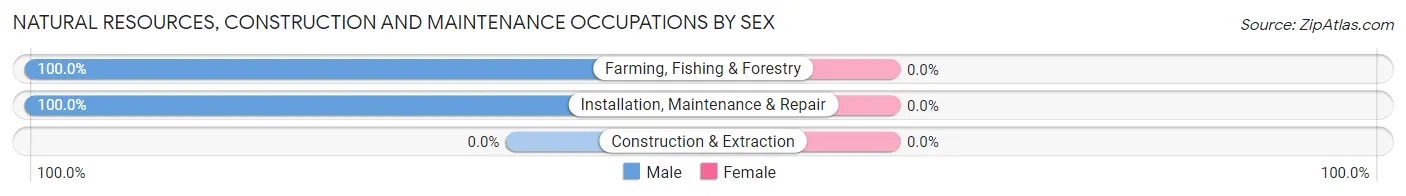
| Occupation | Male | Female |
| Farming, Fishing & Forestry | 26 (100.0%) | 0 (0.0%) |
| Construction & Extraction | 0 (0.0%) | 0 (0.0%) |
| Installation, Maintenance & Repair | 55 (100.0%) | 0 (0.0%) |
| Total (Category) | 81 (100.0%) | 0 (0.0%) |
| Total (Overall) | 408 (40.6%) | 598 (59.4%) |
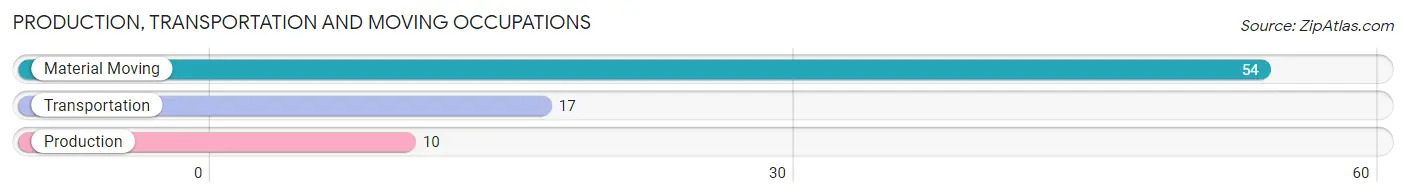
Production, Transportation and Moving Occupations
The most common Production, Transportation and Moving occupations in Bethel Manor are Material Moving (54 | 5.4%), Transportation (17 | 1.7%), and Production (10 | 1.0%).
Production, Transportation and Moving Occupations by Sex
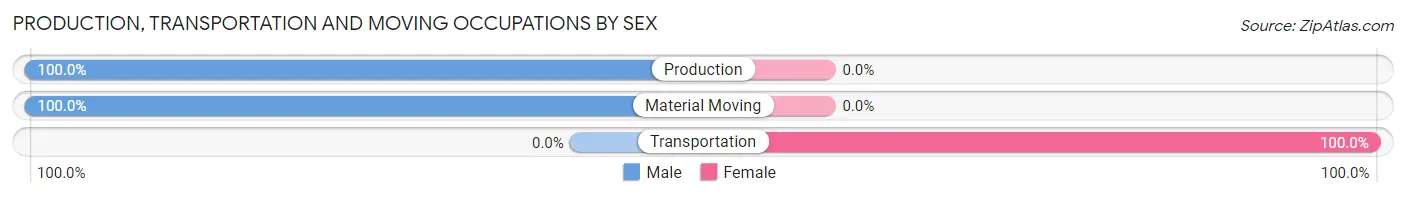
| Occupation | Male | Female |
| Production | 10 (100.0%) | 0 (0.0%) |
| Transportation | 0 (0.0%) | 17 (100.0%) |
| Material Moving | 54 (100.0%) | 0 (0.0%) |
| Total (Category) | 64 (79.0%) | 17 (21.0%) |
| Total (Overall) | 408 (40.6%) | 598 (59.4%) |
Employment Industries by Sex in Bethel Manor
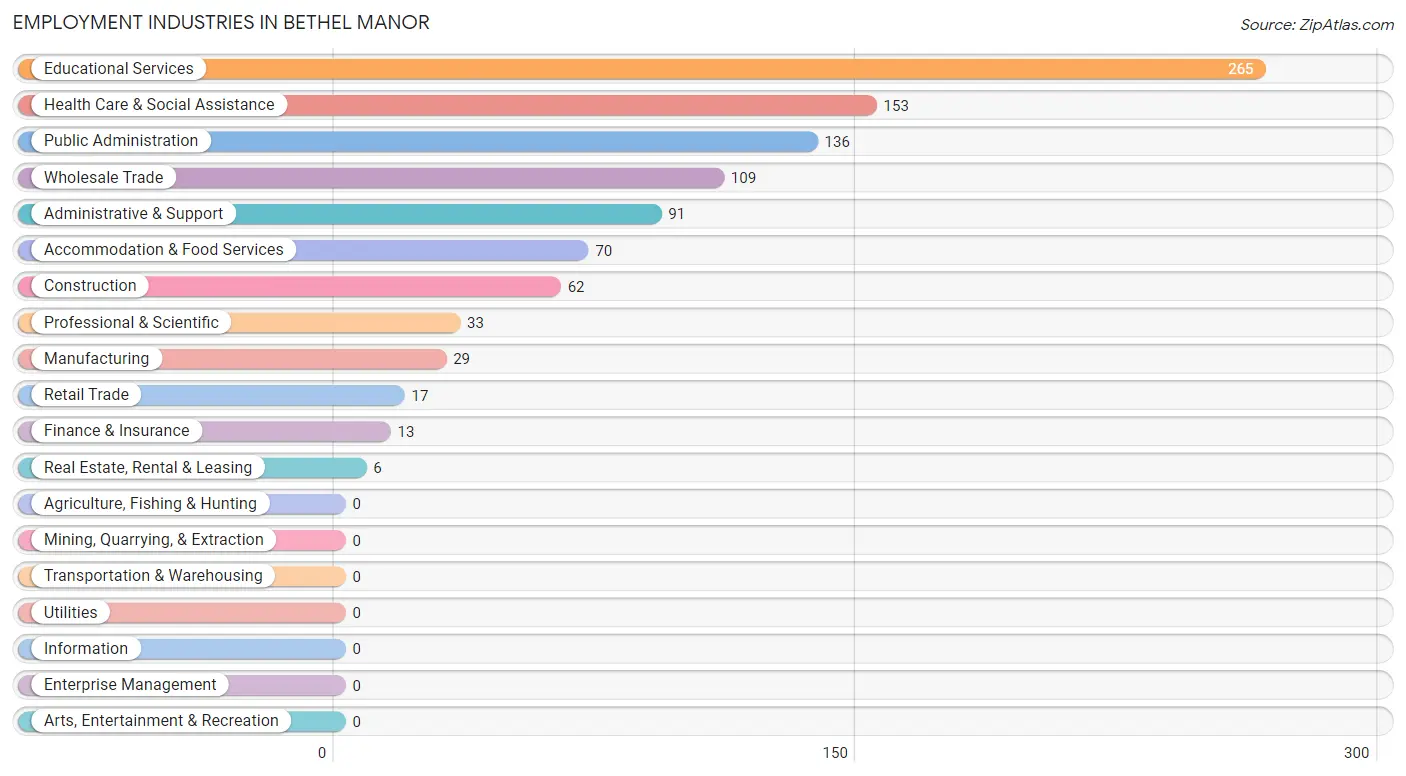
Employment Industries in Bethel Manor
The major employment industries in Bethel Manor include Educational Services (265 | 26.3%), Health Care & Social Assistance (153 | 15.2%), Public Administration (136 | 13.5%), Wholesale Trade (109 | 10.8%), and Administrative & Support (91 | 9.0%).
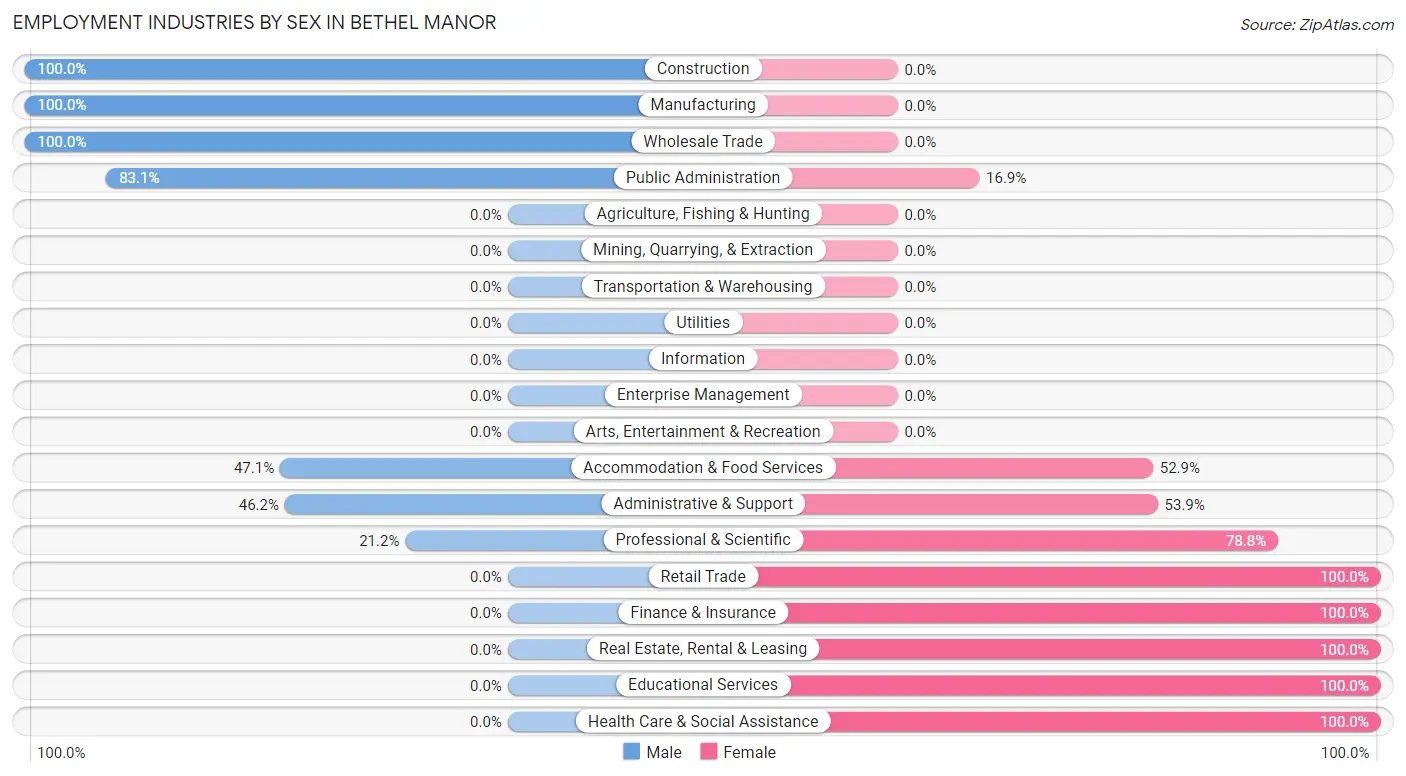
Employment Industries by Sex in Bethel Manor
The Bethel Manor industries that see more men than women are Construction (100.0%), Manufacturing (100.0%), and Wholesale Trade (100.0%), whereas the industries that tend to have a higher number of women are Retail Trade (100.0%), Finance & Insurance (100.0%), and Real Estate, Rental & Leasing (100.0%).
| Industry | Male | Female |
| Agriculture, Fishing & Hunting | 0 (0.0%) | 0 (0.0%) |
| Mining, Quarrying, & Extraction | 0 (0.0%) | 0 (0.0%) |
| Construction | 62 (100.0%) | 0 (0.0%) |
| Manufacturing | 29 (100.0%) | 0 (0.0%) |
| Wholesale Trade | 109 (100.0%) | 0 (0.0%) |
| Retail Trade | 0 (0.0%) | 17 (100.0%) |
| Transportation & Warehousing | 0 (0.0%) | 0 (0.0%) |
| Utilities | 0 (0.0%) | 0 (0.0%) |
| Information | 0 (0.0%) | 0 (0.0%) |
| Finance & Insurance | 0 (0.0%) | 13 (100.0%) |
| Real Estate, Rental & Leasing | 0 (0.0%) | 6 (100.0%) |
| Professional & Scientific | 7 (21.2%) | 26 (78.8%) |
| Enterprise Management | 0 (0.0%) | 0 (0.0%) |
| Administrative & Support | 42 (46.2%) | 49 (53.8%) |
| Educational Services | 0 (0.0%) | 265 (100.0%) |
| Health Care & Social Assistance | 0 (0.0%) | 153 (100.0%) |
| Arts, Entertainment & Recreation | 0 (0.0%) | 0 (0.0%) |
| Accommodation & Food Services | 33 (47.1%) | 37 (52.9%) |
| Public Administration | 113 (83.1%) | 23 (16.9%) |
| Total | 408 (40.6%) | 598 (59.4%) |
Education in Bethel Manor
School Enrollment in Bethel Manor
The most common levels of schooling among the 2,173 students in Bethel Manor are college / undergraduate (570 | 26.2%), middle school (553 | 25.5%), and elementary school (397 | 18.3%).

| School Level | # Students | % Students |
| Nursery / Preschool | 103 | 4.7% |
| Kindergarten | 183 | 8.4% |
| Elementary School | 397 | 18.3% |
| Middle School | 553 | 25.5% |
| High School | 227 | 10.4% |
| College / Undergraduate | 570 | 26.2% |
| Graduate / Professional | 140 | 6.4% |
| Total | 2,173 | 100.0% |
School Enrollment by Age by Funding Source in Bethel Manor
Out of a total of 2,173 students who are enrolled in schools in Bethel Manor, 176 (8.1%) attend a private institution, while the remaining 1,997 (91.9%) are enrolled in public schools. The age group of 25 to 34 year olds has the highest likelihood of being enrolled in private schools, with 61 (18.9% in the age bracket) enrolled. Conversely, the age group of 15 to 17 year olds has the lowest likelihood of being enrolled in a private school, with 184 (100.0% in the age bracket) attending a public institution.
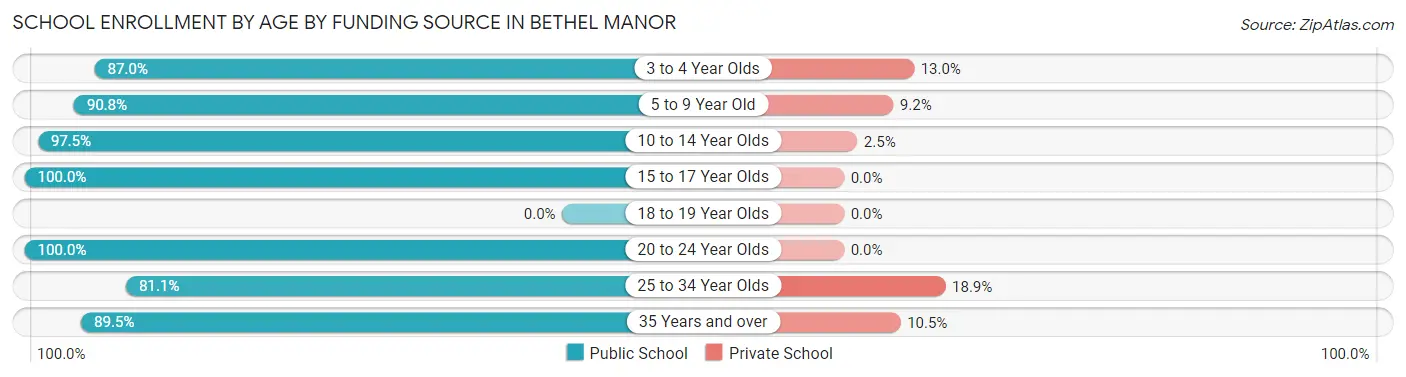
| Age Bracket | Public School | Private School |
| 3 to 4 Year Olds | 80 (87.0%) | 12 (13.0%) |
| 5 to 9 Year Old | 515 (90.8%) | 52 (9.2%) |
| 10 to 14 Year Olds | 592 (97.5%) | 15 (2.5%) |
| 15 to 17 Year Olds | 184 (100.0%) | 0 (0.0%) |
| 18 to 19 Year Olds | 0 (0.0%) | 0 (0.0%) |
| 20 to 24 Year Olds | 58 (100.0%) | 0 (0.0%) |
| 25 to 34 Year Olds | 262 (81.1%) | 61 (18.9%) |
| 35 Years and over | 306 (89.5%) | 36 (10.5%) |
| Total | 1,997 (91.9%) | 176 (8.1%) |
Educational Attainment by Field of Study in Bethel Manor
Social sciences (145 | 20.5%), business (128 | 18.1%), psychology (127 | 17.9%), education (72 | 10.2%), and liberal arts & history (56 | 7.9%) are the most common fields of study among 708 individuals in Bethel Manor who have obtained a bachelor's degree or higher.
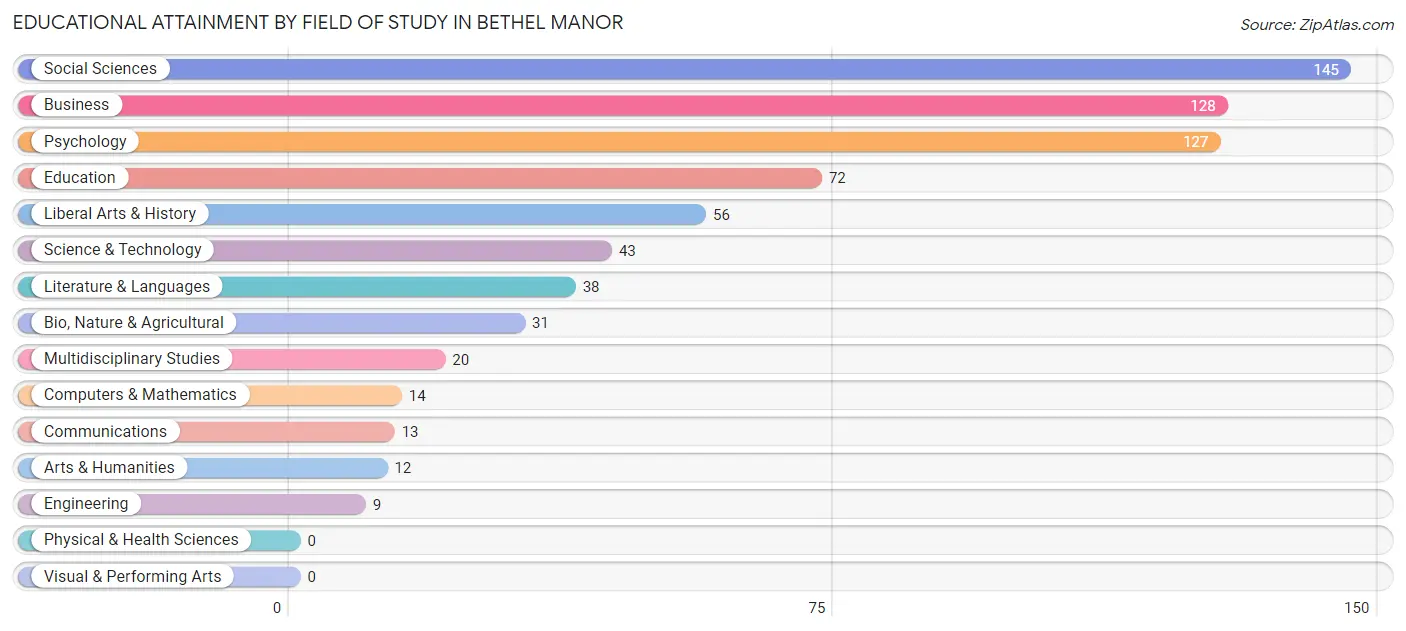
| Field of Study | # Graduates | % Graduates |
| Computers & Mathematics | 14 | 2.0% |
| Bio, Nature & Agricultural | 31 | 4.4% |
| Physical & Health Sciences | 0 | 0.0% |
| Psychology | 127 | 17.9% |
| Social Sciences | 145 | 20.5% |
| Engineering | 9 | 1.3% |
| Multidisciplinary Studies | 20 | 2.8% |
| Science & Technology | 43 | 6.1% |
| Business | 128 | 18.1% |
| Education | 72 | 10.2% |
| Literature & Languages | 38 | 5.4% |
| Liberal Arts & History | 56 | 7.9% |
| Visual & Performing Arts | 0 | 0.0% |
| Communications | 13 | 1.8% |
| Arts & Humanities | 12 | 1.7% |
| Total | 708 | 100.0% |
Transportation & Commute in Bethel Manor
Vehicle Availability by Sex in Bethel Manor
The most prevalent vehicle ownership categories in Bethel Manor are males with 2 vehicles (614, accounting for 57.8%) and females with 2 vehicles (442, making up 69.5%).
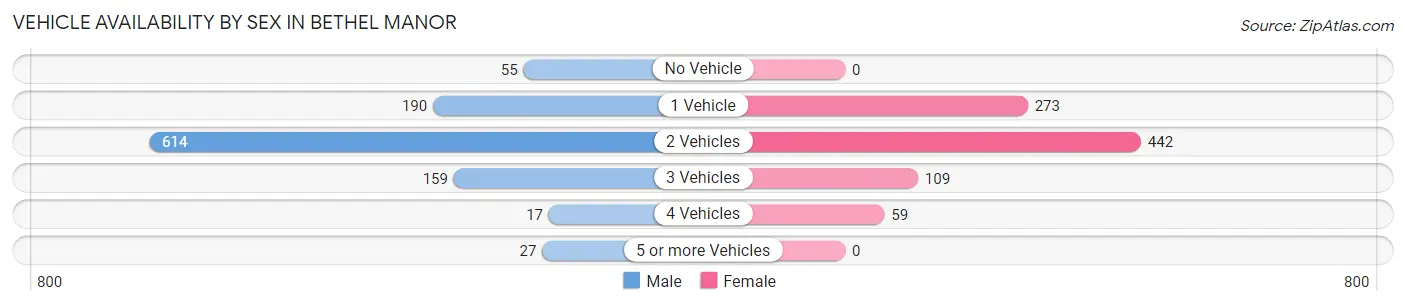
| Vehicles Available | Male | Female |
| No Vehicle | 55 (5.2%) | 0 (0.0%) |
| 1 Vehicle | 190 (17.9%) | 273 (30.9%) |
| 2 Vehicles | 614 (57.8%) | 442 (50.1%) |
| 3 Vehicles | 159 (15.0%) | 109 (12.3%) |
| 4 Vehicles | 17 (1.6%) | 59 (6.7%) |
| 5 or more Vehicles | 27 (2.5%) | 0 (0.0%) |
| Total | 1,062 (100.0%) | 883 (100.0%) |
Commute Time in Bethel Manor
The most frequently occuring commute durations in Bethel Manor are 15 to 19 minutes (640 commuters, 33.7%), 20 to 24 minutes (364 commuters, 19.2%), and 10 to 14 minutes (299 commuters, 15.7%).
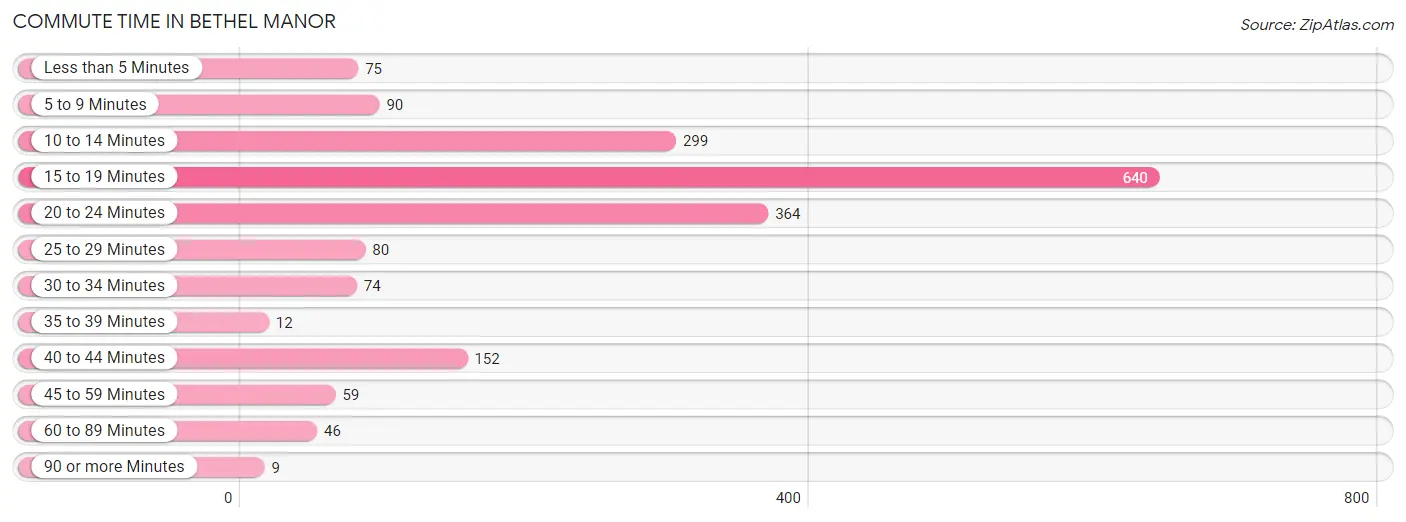
| Commute Time | # Commuters | % Commuters |
| Less than 5 Minutes | 75 | 4.0% |
| 5 to 9 Minutes | 90 | 4.7% |
| 10 to 14 Minutes | 299 | 15.7% |
| 15 to 19 Minutes | 640 | 33.7% |
| 20 to 24 Minutes | 364 | 19.2% |
| 25 to 29 Minutes | 80 | 4.2% |
| 30 to 34 Minutes | 74 | 3.9% |
| 35 to 39 Minutes | 12 | 0.6% |
| 40 to 44 Minutes | 152 | 8.0% |
| 45 to 59 Minutes | 59 | 3.1% |
| 60 to 89 Minutes | 46 | 2.4% |
| 90 or more Minutes | 9 | 0.5% |
Commute Time by Sex in Bethel Manor
The most common commute times in Bethel Manor are 15 to 19 minutes (482 commuters, 46.5%) for males and 10 to 14 minutes (192 commuters, 22.3%) for females.
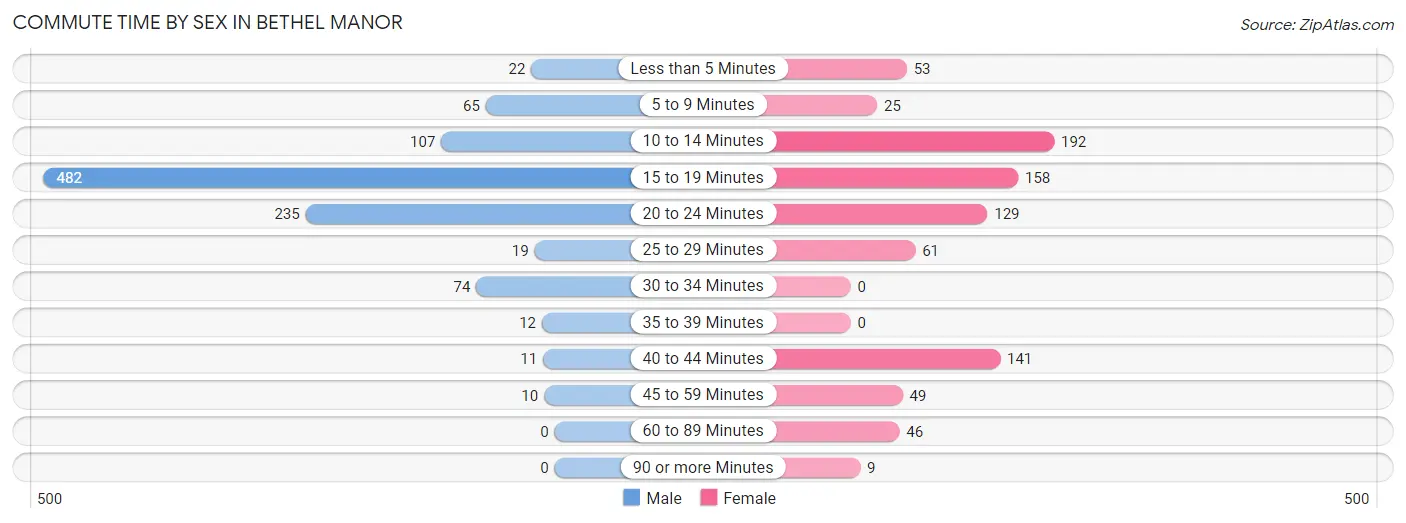
| Commute Time | Male | Female |
| Less than 5 Minutes | 22 (2.1%) | 53 (6.1%) |
| 5 to 9 Minutes | 65 (6.3%) | 25 (2.9%) |
| 10 to 14 Minutes | 107 (10.3%) | 192 (22.3%) |
| 15 to 19 Minutes | 482 (46.5%) | 158 (18.3%) |
| 20 to 24 Minutes | 235 (22.7%) | 129 (14.9%) |
| 25 to 29 Minutes | 19 (1.8%) | 61 (7.1%) |
| 30 to 34 Minutes | 74 (7.1%) | 0 (0.0%) |
| 35 to 39 Minutes | 12 (1.2%) | 0 (0.0%) |
| 40 to 44 Minutes | 11 (1.1%) | 141 (16.3%) |
| 45 to 59 Minutes | 10 (1.0%) | 49 (5.7%) |
| 60 to 89 Minutes | 0 (0.0%) | 46 (5.3%) |
| 90 or more Minutes | 0 (0.0%) | 9 (1.0%) |
Time of Departure to Work by Sex in Bethel Manor
The most frequent times of departure to work in Bethel Manor are 7:30 AM to 7:59 AM (264, 25.5%) for males and 6:30 AM to 6:59 AM (239, 27.7%) for females.
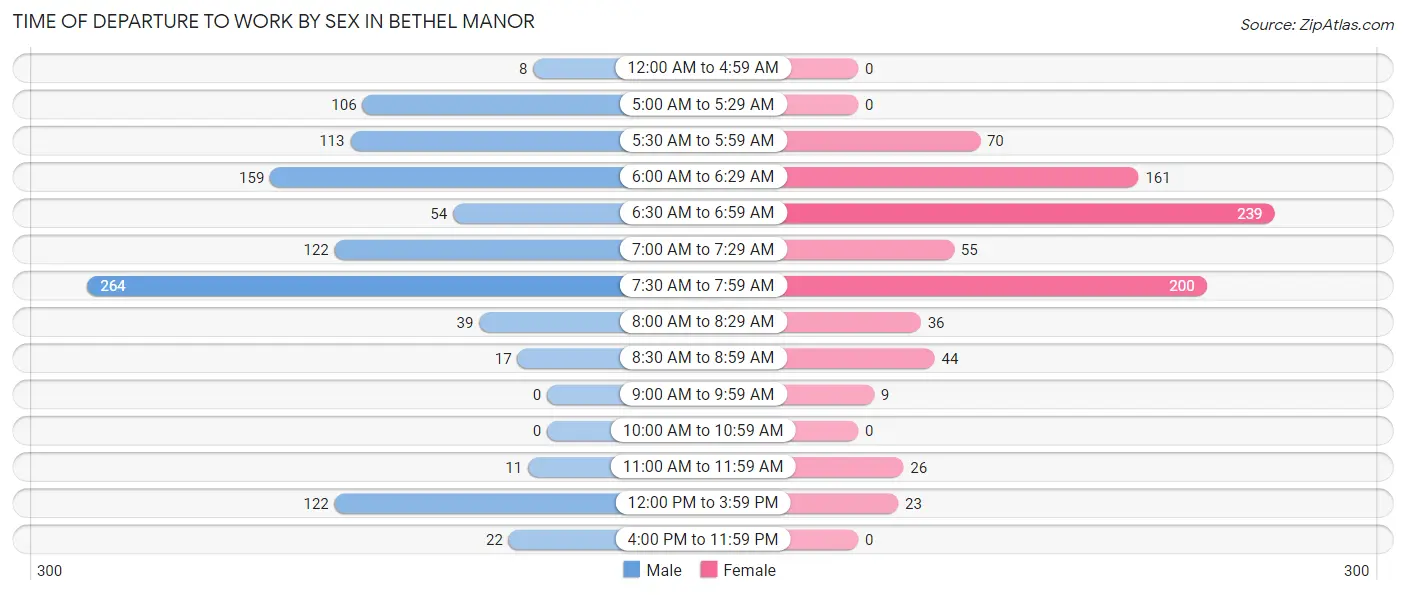
| Time of Departure | Male | Female |
| 12:00 AM to 4:59 AM | 8 (0.8%) | 0 (0.0%) |
| 5:00 AM to 5:29 AM | 106 (10.2%) | 0 (0.0%) |
| 5:30 AM to 5:59 AM | 113 (10.9%) | 70 (8.1%) |
| 6:00 AM to 6:29 AM | 159 (15.3%) | 161 (18.7%) |
| 6:30 AM to 6:59 AM | 54 (5.2%) | 239 (27.7%) |
| 7:00 AM to 7:29 AM | 122 (11.8%) | 55 (6.4%) |
| 7:30 AM to 7:59 AM | 264 (25.5%) | 200 (23.2%) |
| 8:00 AM to 8:29 AM | 39 (3.8%) | 36 (4.2%) |
| 8:30 AM to 8:59 AM | 17 (1.6%) | 44 (5.1%) |
| 9:00 AM to 9:59 AM | 0 (0.0%) | 9 (1.0%) |
| 10:00 AM to 10:59 AM | 0 (0.0%) | 0 (0.0%) |
| 11:00 AM to 11:59 AM | 11 (1.1%) | 26 (3.0%) |
| 12:00 PM to 3:59 PM | 122 (11.8%) | 23 (2.7%) |
| 4:00 PM to 11:59 PM | 22 (2.1%) | 0 (0.0%) |
| Total | 1,037 (100.0%) | 863 (100.0%) |
Housing Occupancy in Bethel Manor
Occupancy by Ownership in Bethel Manor
Of the total 1,318 dwellings in Bethel Manor, owner-occupied units account for 28 (2.1%), while renter-occupied units make up 1,290 (97.9%).
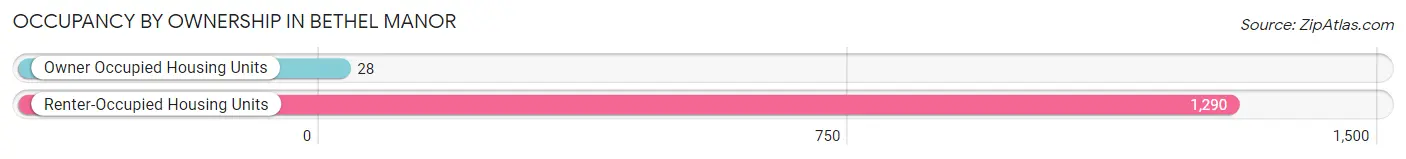
| Occupancy | # Housing Units | % Housing Units |
| Owner Occupied Housing Units | 28 | 2.1% |
| Renter-Occupied Housing Units | 1,290 | 97.9% |
| Total Occupied Housing Units | 1,318 | 100.0% |
Occupancy by Household Size in Bethel Manor
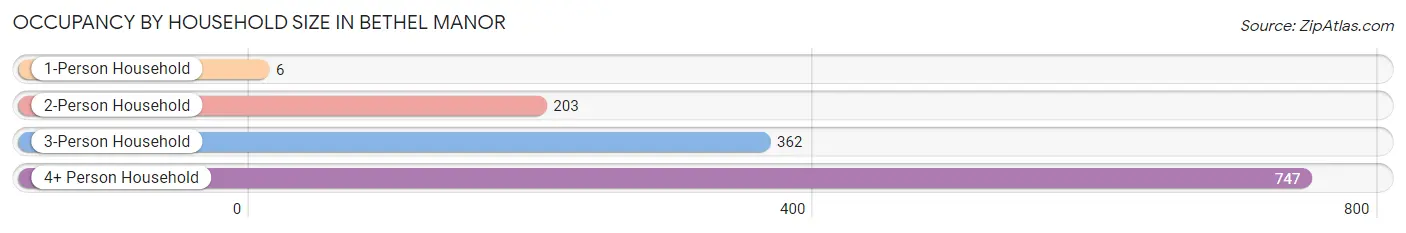
| Household Size | # Housing Units | % Housing Units |
| 1-Person Household | 6 | 0.5% |
| 2-Person Household | 203 | 15.4% |
| 3-Person Household | 362 | 27.5% |
| 4+ Person Household | 747 | 56.7% |
| Total Housing Units | 1,318 | 100.0% |
Occupancy by Ownership by Household Size in Bethel Manor
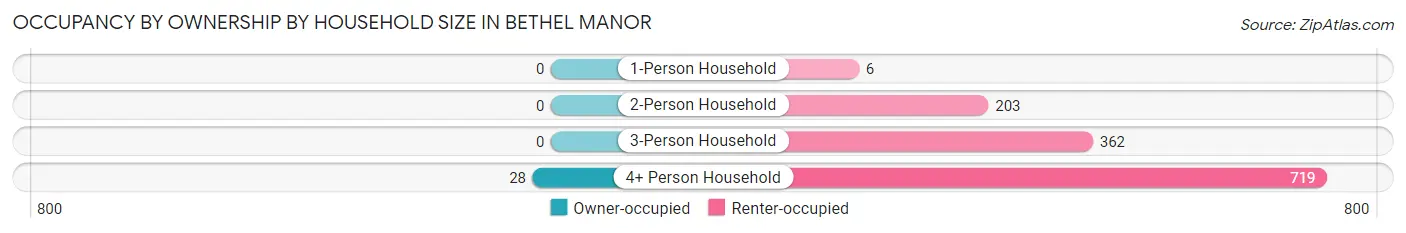
| Household Size | Owner-occupied | Renter-occupied |
| 1-Person Household | 0 (0.0%) | 6 (100.0%) |
| 2-Person Household | 0 (0.0%) | 203 (100.0%) |
| 3-Person Household | 0 (0.0%) | 362 (100.0%) |
| 4+ Person Household | 28 (3.7%) | 719 (96.3%) |
| Total Housing Units | 28 (2.1%) | 1,290 (97.9%) |
Occupancy by Educational Attainment in Bethel Manor
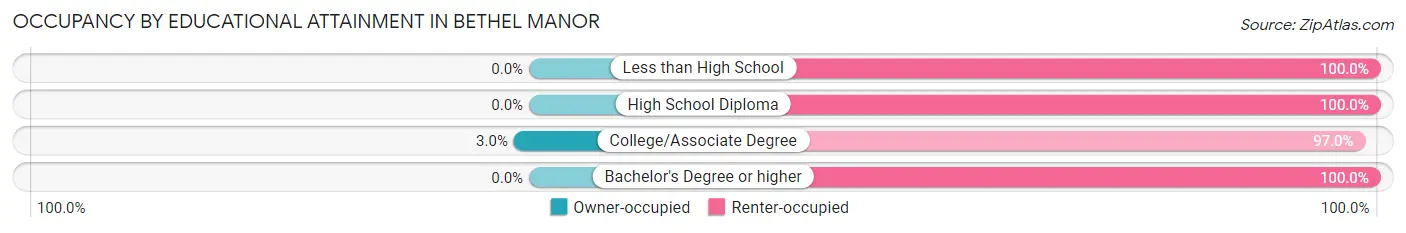
| Household Size | Owner-occupied | Renter-occupied |
| Less than High School | 0 (0.0%) | 7 (100.0%) |
| High School Diploma | 0 (0.0%) | 126 (100.0%) |
| College/Associate Degree | 28 (3.0%) | 900 (97.0%) |
| Bachelor's Degree or higher | 0 (0.0%) | 257 (100.0%) |
Occupancy by Age of Householder in Bethel Manor
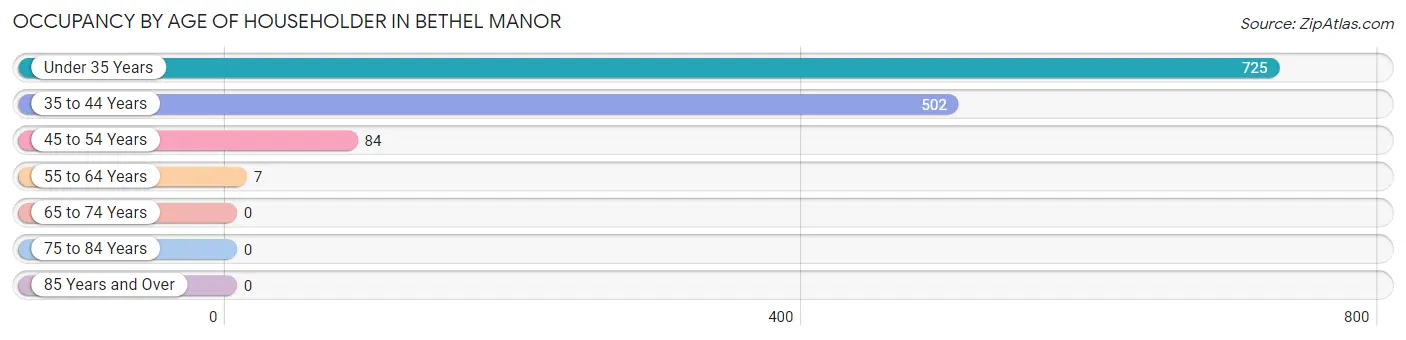
| Age Bracket | # Households | % Households |
| Under 35 Years | 725 | 55.0% |
| 35 to 44 Years | 502 | 38.1% |
| 45 to 54 Years | 84 | 6.4% |
| 55 to 64 Years | 7 | 0.5% |
| 65 to 74 Years | 0 | 0.0% |
| 75 to 84 Years | 0 | 0.0% |
| 85 Years and Over | 0 | 0.0% |
| Total | 1,318 | 100.0% |
Housing Finances in Bethel Manor
Median Income by Occupancy in Bethel Manor
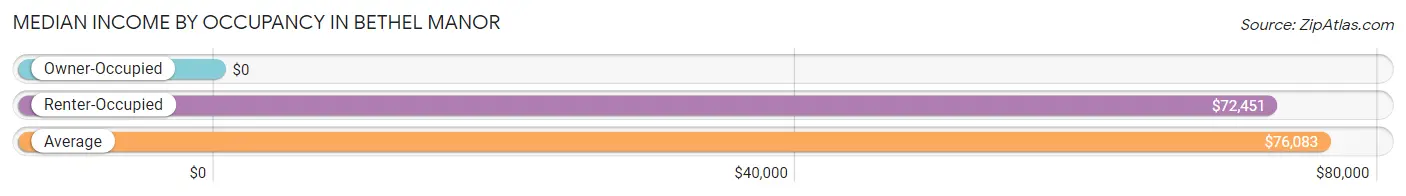
| Occupancy Type | # Households | Median Income |
| Owner-Occupied | 28 (2.1%) | $0 |
| Renter-Occupied | 1,290 (97.9%) | $72,451 |
| Average | 1,318 (100.0%) | $76,083 |
Occupancy by Householder Income Bracket in Bethel Manor
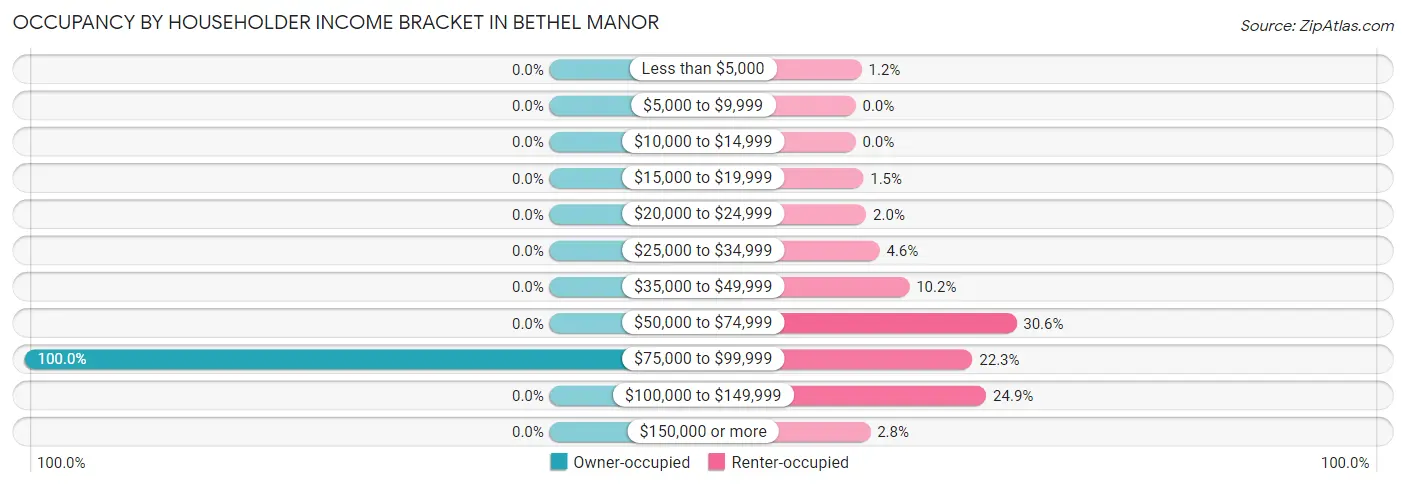
| Income Bracket | Owner-occupied | Renter-occupied |
| Less than $5,000 | 0 (0.0%) | 15 (1.2%) |
| $5,000 to $9,999 | 0 (0.0%) | 0 (0.0%) |
| $10,000 to $14,999 | 0 (0.0%) | 0 (0.0%) |
| $15,000 to $19,999 | 0 (0.0%) | 19 (1.5%) |
| $20,000 to $24,999 | 0 (0.0%) | 26 (2.0%) |
| $25,000 to $34,999 | 0 (0.0%) | 59 (4.6%) |
| $35,000 to $49,999 | 0 (0.0%) | 132 (10.2%) |
| $50,000 to $74,999 | 0 (0.0%) | 395 (30.6%) |
| $75,000 to $99,999 | 28 (100.0%) | 287 (22.3%) |
| $100,000 to $149,999 | 0 (0.0%) | 321 (24.9%) |
| $150,000 or more | 0 (0.0%) | 36 (2.8%) |
| Total | 28 (100.0%) | 1,290 (100.0%) |
Monthly Housing Cost Tiers in Bethel Manor
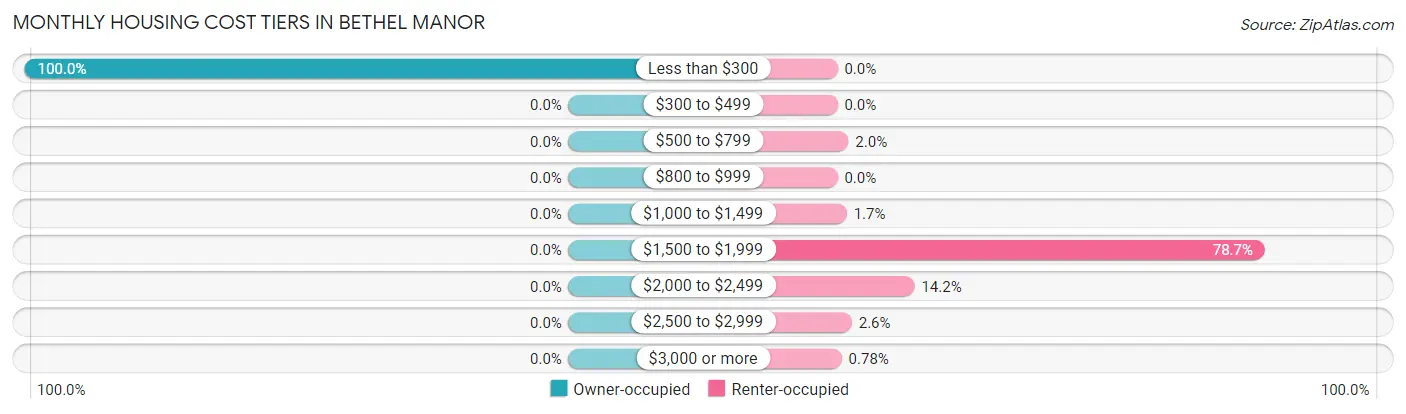
| Monthly Cost | Owner-occupied | Renter-occupied |
| Less than $300 | 28 (100.0%) | 0 (0.0%) |
| $300 to $499 | 0 (0.0%) | 0 (0.0%) |
| $500 to $799 | 0 (0.0%) | 26 (2.0%) |
| $800 to $999 | 0 (0.0%) | 0 (0.0%) |
| $1,000 to $1,499 | 0 (0.0%) | 22 (1.7%) |
| $1,500 to $1,999 | 0 (0.0%) | 1,015 (78.7%) |
| $2,000 to $2,499 | 0 (0.0%) | 183 (14.2%) |
| $2,500 to $2,999 | 0 (0.0%) | 34 (2.6%) |
| $3,000 or more | 0 (0.0%) | 10 (0.8%) |
| Total | 28 (100.0%) | 1,290 (100.0%) |
Physical Housing Characteristics in Bethel Manor
Housing Structures in Bethel Manor
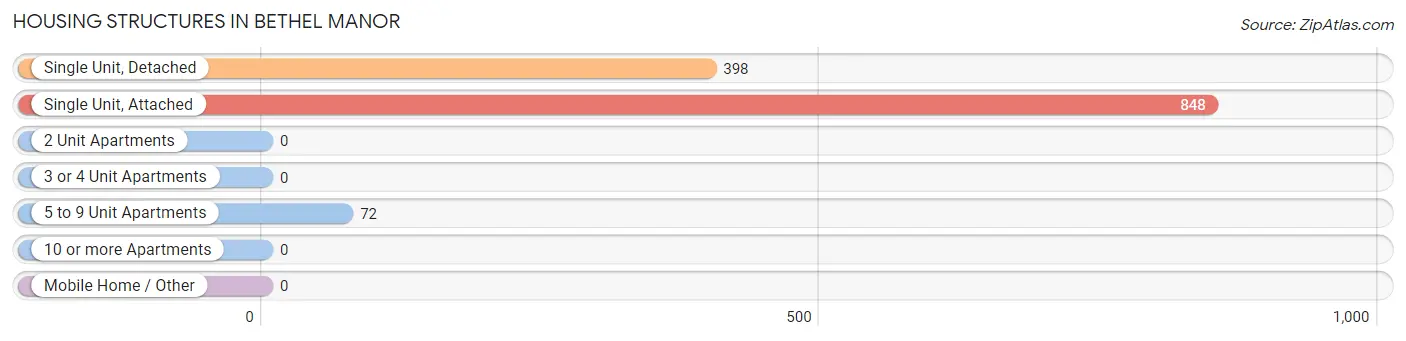
| Structure Type | # Housing Units | % Housing Units |
| Single Unit, Detached | 398 | 30.2% |
| Single Unit, Attached | 848 | 64.3% |
| 2 Unit Apartments | 0 | 0.0% |
| 3 or 4 Unit Apartments | 0 | 0.0% |
| 5 to 9 Unit Apartments | 72 | 5.5% |
| 10 or more Apartments | 0 | 0.0% |
| Mobile Home / Other | 0 | 0.0% |
| Total | 1,318 | 100.0% |
Housing Structures by Occupancy in Bethel Manor
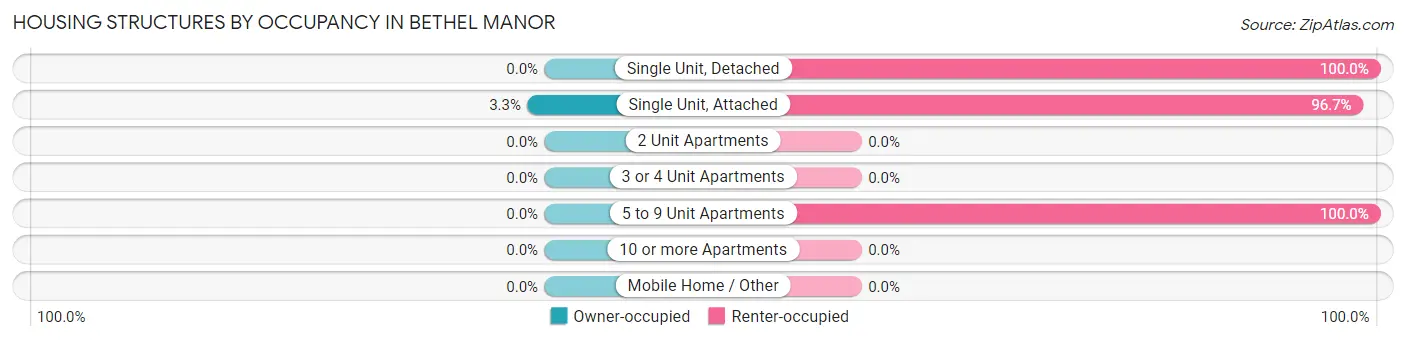
| Structure Type | Owner-occupied | Renter-occupied |
| Single Unit, Detached | 0 (0.0%) | 398 (100.0%) |
| Single Unit, Attached | 28 (3.3%) | 820 (96.7%) |
| 2 Unit Apartments | 0 (0.0%) | 0 (0.0%) |
| 3 or 4 Unit Apartments | 0 (0.0%) | 0 (0.0%) |
| 5 to 9 Unit Apartments | 0 (0.0%) | 72 (100.0%) |
| 10 or more Apartments | 0 (0.0%) | 0 (0.0%) |
| Mobile Home / Other | 0 (0.0%) | 0 (0.0%) |
| Total | 28 (2.1%) | 1,290 (97.9%) |
Housing Structures by Number of Rooms in Bethel Manor
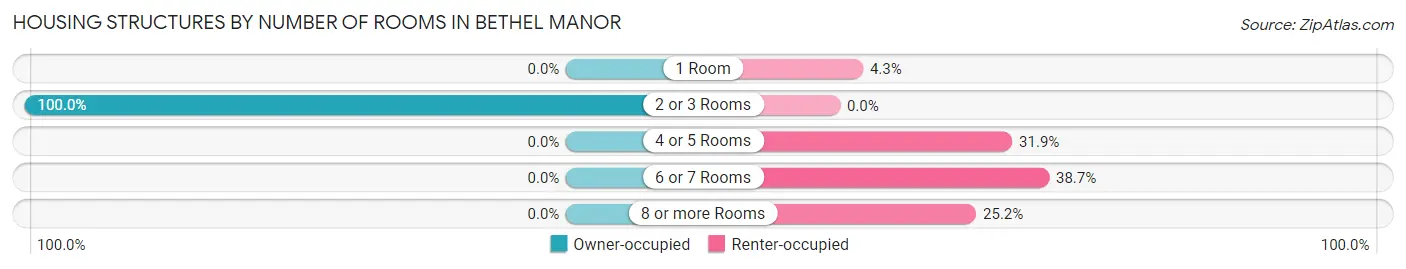
| Number of Rooms | Owner-occupied | Renter-occupied |
| 1 Room | 0 (0.0%) | 55 (4.3%) |
| 2 or 3 Rooms | 28 (100.0%) | 0 (0.0%) |
| 4 or 5 Rooms | 0 (0.0%) | 411 (31.9%) |
| 6 or 7 Rooms | 0 (0.0%) | 499 (38.7%) |
| 8 or more Rooms | 0 (0.0%) | 325 (25.2%) |
| Total | 28 (100.0%) | 1,290 (100.0%) |
Housing Structure by Heating Type in Bethel Manor
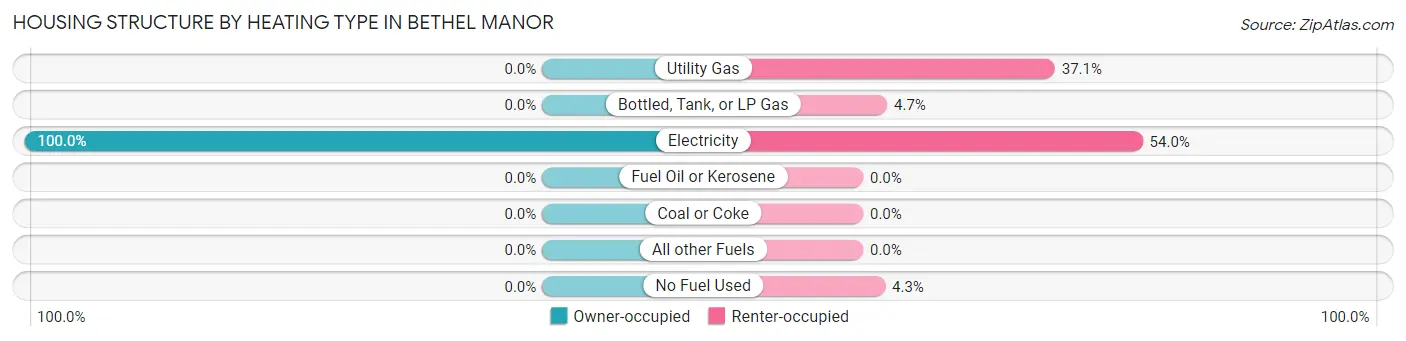
| Heating Type | Owner-occupied | Renter-occupied |
| Utility Gas | 0 (0.0%) | 478 (37.0%) |
| Bottled, Tank, or LP Gas | 0 (0.0%) | 60 (4.6%) |
| Electricity | 28 (100.0%) | 697 (54.0%) |
| Fuel Oil or Kerosene | 0 (0.0%) | 0 (0.0%) |
| Coal or Coke | 0 (0.0%) | 0 (0.0%) |
| All other Fuels | 0 (0.0%) | 0 (0.0%) |
| No Fuel Used | 0 (0.0%) | 55 (4.3%) |
| Total | 28 (100.0%) | 1,290 (100.0%) |
Household Vehicle Usage in Bethel Manor
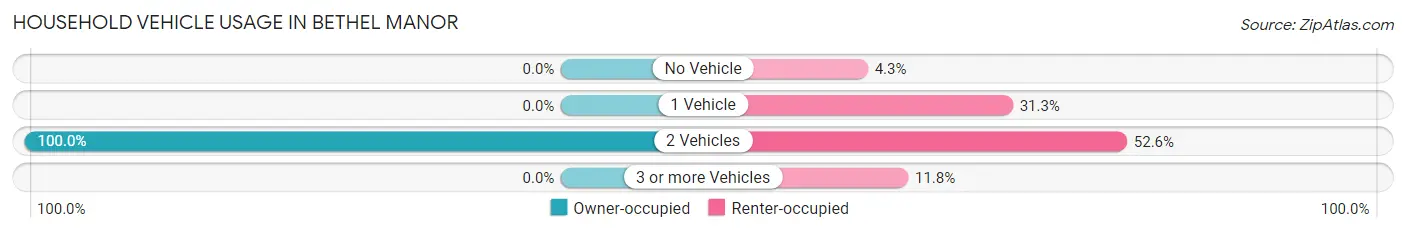
| Vehicles per Household | Owner-occupied | Renter-occupied |
| No Vehicle | 0 (0.0%) | 55 (4.3%) |
| 1 Vehicle | 0 (0.0%) | 404 (31.3%) |
| 2 Vehicles | 28 (100.0%) | 679 (52.6%) |
| 3 or more Vehicles | 0 (0.0%) | 152 (11.8%) |
| Total | 28 (100.0%) | 1,290 (100.0%) |
Real Estate & Mortgages in Bethel Manor
Real Estate and Mortgage Overview in Bethel Manor
| Characteristic | Without Mortgage | With Mortgage |
| Housing Units | 0 | 28 |
| Median Property Value | - | - |
| Median Household Income | - | - |
| Monthly Housing Costs | - | - |
| Real Estate Taxes | - | - |
Property Value by Mortgage Status in Bethel Manor
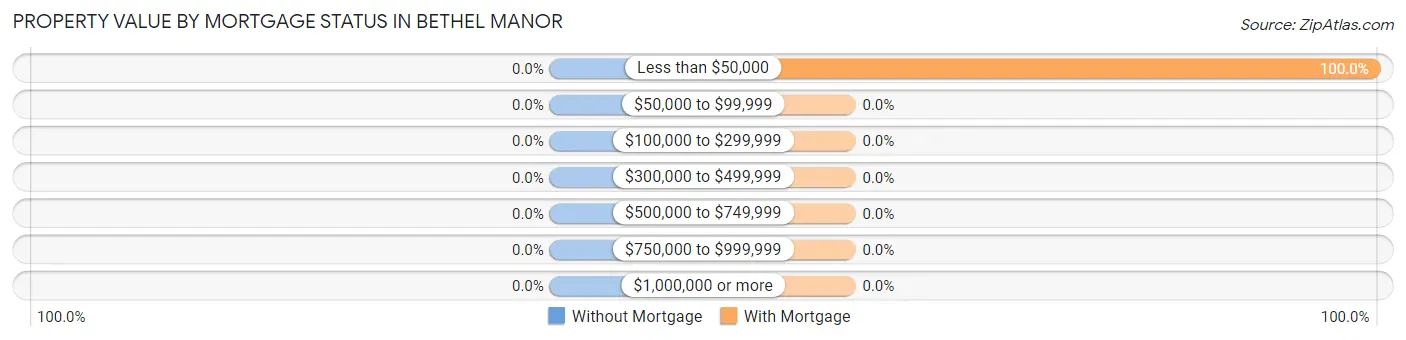
| Property Value | Without Mortgage | With Mortgage |
| Less than $50,000 | 0 (0.0%) | 28 (100.0%) |
| $50,000 to $99,999 | 0 (0.0%) | 0 (0.0%) |
| $100,000 to $299,999 | 0 (0.0%) | 0 (0.0%) |
| $300,000 to $499,999 | 0 (0.0%) | 0 (0.0%) |
| $500,000 to $749,999 | 0 (0.0%) | 0 (0.0%) |
| $750,000 to $999,999 | 0 (0.0%) | 0 (0.0%) |
| $1,000,000 or more | 0 (0.0%) | 0 (0.0%) |
| Total | 0 (0.0%) | 28 (100.0%) |
Household Income by Mortgage Status in Bethel Manor
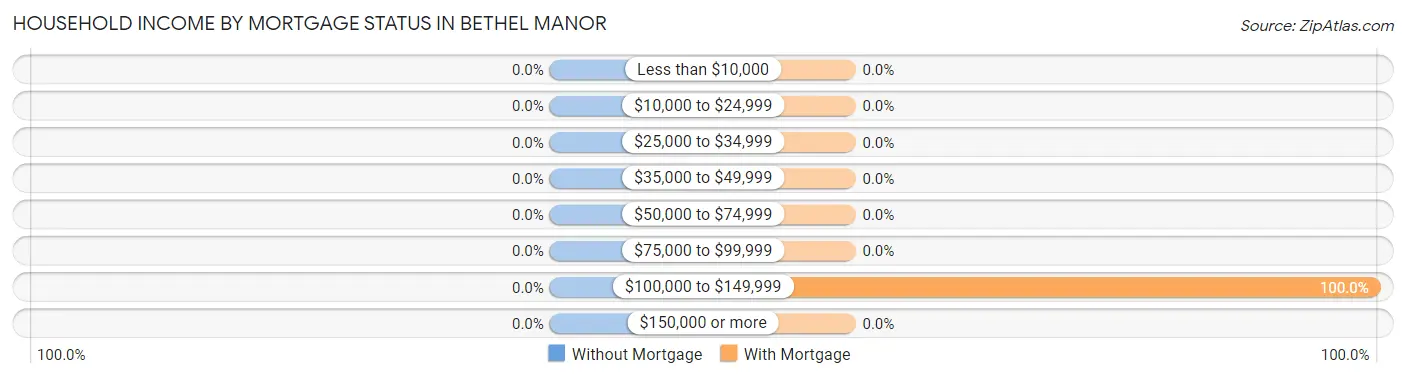
| Household Income | Without Mortgage | With Mortgage |
| Less than $10,000 | 0 (0.0%) | 0 (0.0%) |
| $10,000 to $24,999 | 0 (0.0%) | 0 (0.0%) |
| $25,000 to $34,999 | 0 (0.0%) | 0 (0.0%) |
| $35,000 to $49,999 | 0 (0.0%) | 0 (0.0%) |
| $50,000 to $74,999 | 0 (0.0%) | 0 (0.0%) |
| $75,000 to $99,999 | 0 (0.0%) | 0 (0.0%) |
| $100,000 to $149,999 | 0 (0.0%) | 28 (100.0%) |
| $150,000 or more | 0 (0.0%) | 0 (0.0%) |
| Total | 0 (0.0%) | 28 (100.0%) |
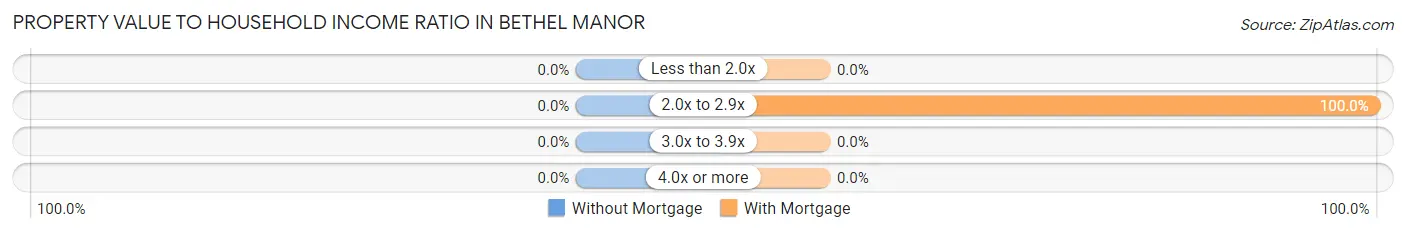
Property Value to Household Income Ratio in Bethel Manor
| Value-to-Income Ratio | Without Mortgage | With Mortgage |
| Less than 2.0x | 0 (0.0%) | 0 (0.0%) |
| 2.0x to 2.9x | 0 (0.0%) | 28 (100.0%) |
| 3.0x to 3.9x | 0 (0.0%) | 0 (0.0%) |
| 4.0x or more | 0 (0.0%) | 0 (0.0%) |
| Total | 0 (0.0%) | 28 (100.0%) |
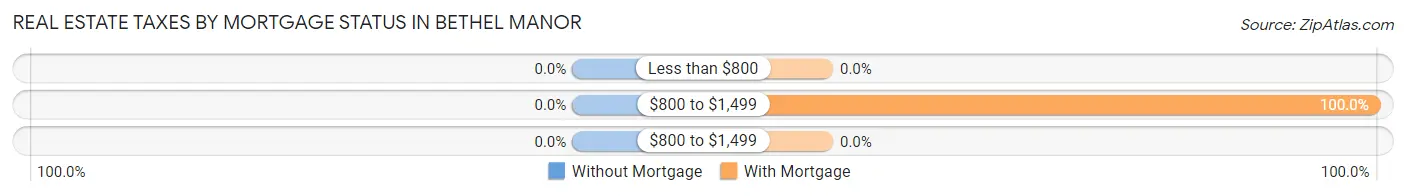
Real Estate Taxes by Mortgage Status in Bethel Manor
| Property Taxes | Without Mortgage | With Mortgage |
| Less than $800 | 0 (0.0%) | 0 (0.0%) |
| $800 to $1,499 | 0 (0.0%) | 28 (100.0%) |
| $800 to $1,499 | 0 (0.0%) | 0 (0.0%) |
| Total | 0 (0.0%) | 28 (100.0%) |
Health & Disability in Bethel Manor
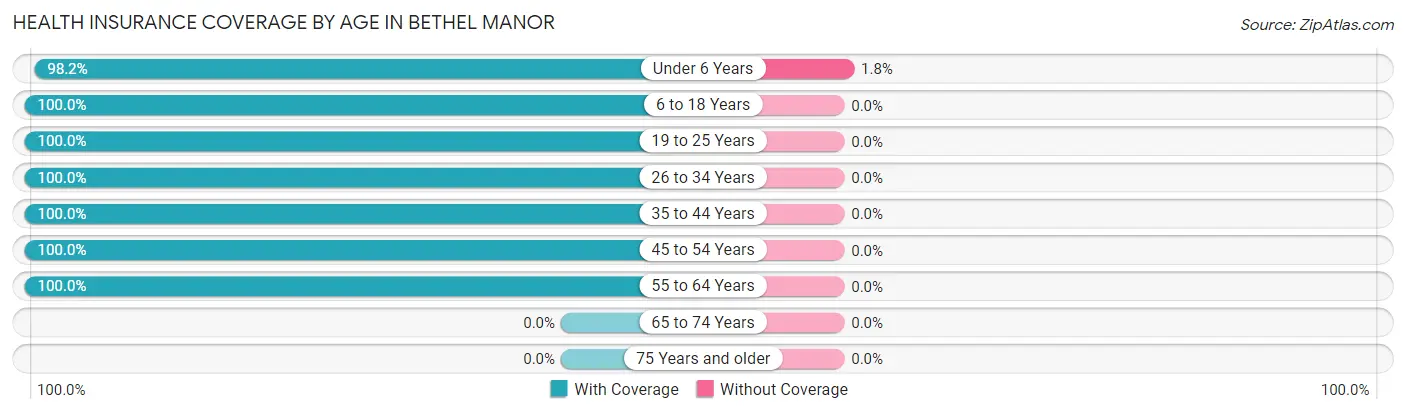
Health Insurance Coverage by Age in Bethel Manor
| Age Bracket | With Coverage | Without Coverage |
| Under 6 Years | 806 (98.2%) | 15 (1.8%) |
| 6 to 18 Years | 1,324 (100.0%) | 0 (0.0%) |
| 19 to 25 Years | 258 (100.0%) | 0 (0.0%) |
| 26 to 34 Years | 558 (100.0%) | 0 (0.0%) |
| 35 to 44 Years | 375 (100.0%) | 0 (0.0%) |
| 45 to 54 Years | 140 (100.0%) | 0 (0.0%) |
| 55 to 64 Years | 7 (100.0%) | 0 (0.0%) |
| 65 to 74 Years | 0 (0.0%) | 0 (0.0%) |
| 75 Years and older | 0 (0.0%) | 0 (0.0%) |
| Total | 3,468 (99.6%) | 15 (0.4%) |
Health Insurance Coverage by Citizenship Status in Bethel Manor
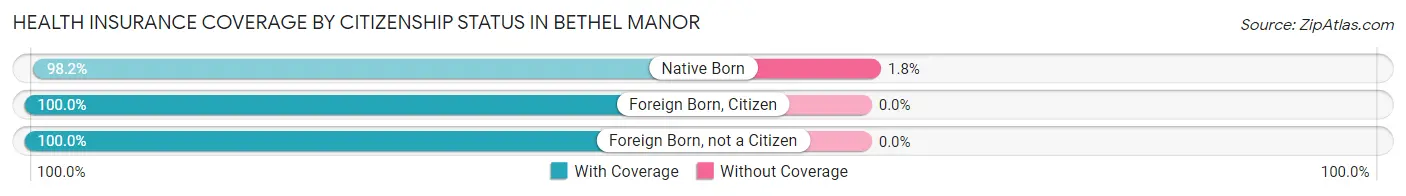
| Citizenship Status | With Coverage | Without Coverage |
| Native Born | 806 (98.2%) | 15 (1.8%) |
| Foreign Born, Citizen | 1,324 (100.0%) | 0 (0.0%) |
| Foreign Born, not a Citizen | 258 (100.0%) | 0 (0.0%) |
Health Insurance Coverage by Household Income in Bethel Manor
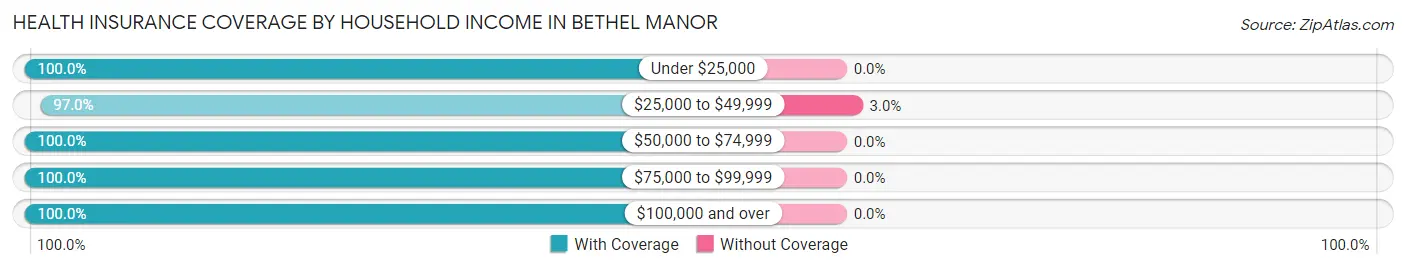
| Household Income | With Coverage | Without Coverage |
| Under $25,000 | 228 (100.0%) | 0 (0.0%) |
| $25,000 to $49,999 | 492 (97.0%) | 15 (3.0%) |
| $50,000 to $74,999 | 619 (100.0%) | 0 (0.0%) |
| $75,000 to $99,999 | 1,146 (100.0%) | 0 (0.0%) |
| $100,000 and over | 983 (100.0%) | 0 (0.0%) |
Public vs Private Health Insurance Coverage by Age in Bethel Manor
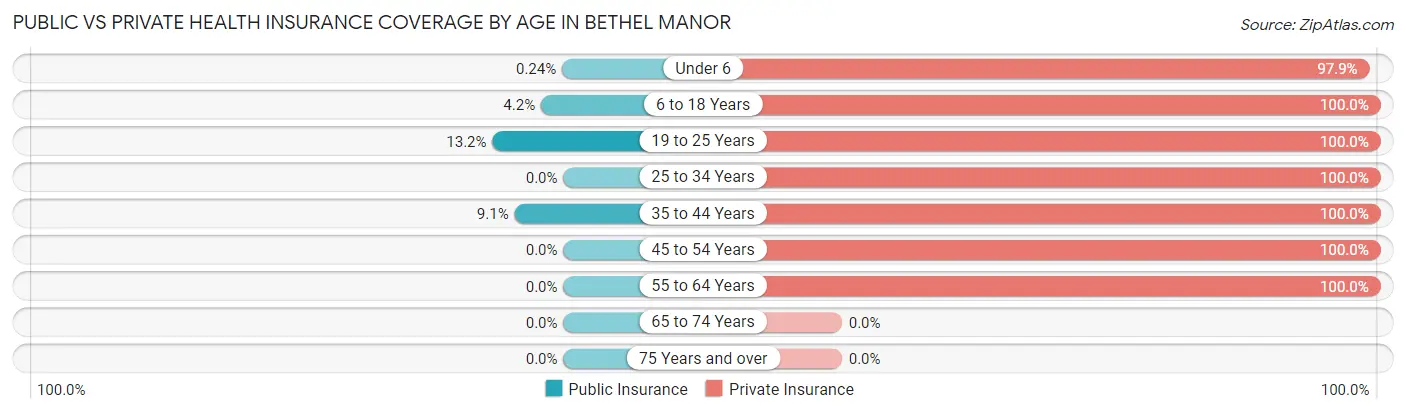
| Age Bracket | Public Insurance | Private Insurance |
| Under 6 | 2 (0.2%) | 804 (97.9%) |
| 6 to 18 Years | 55 (4.2%) | 1,324 (100.0%) |
| 19 to 25 Years | 34 (13.2%) | 258 (100.0%) |
| 25 to 34 Years | 0 (0.0%) | 558 (100.0%) |
| 35 to 44 Years | 34 (9.1%) | 375 (100.0%) |
| 45 to 54 Years | 0 (0.0%) | 140 (100.0%) |
| 55 to 64 Years | 0 (0.0%) | 7 (100.0%) |
| 65 to 74 Years | 0 (0.0%) | 0 (0.0%) |
| 75 Years and over | 0 (0.0%) | 0 (0.0%) |
| Total | 125 (3.6%) | 3,466 (99.5%) |
Disability Status by Sex by Age in Bethel Manor
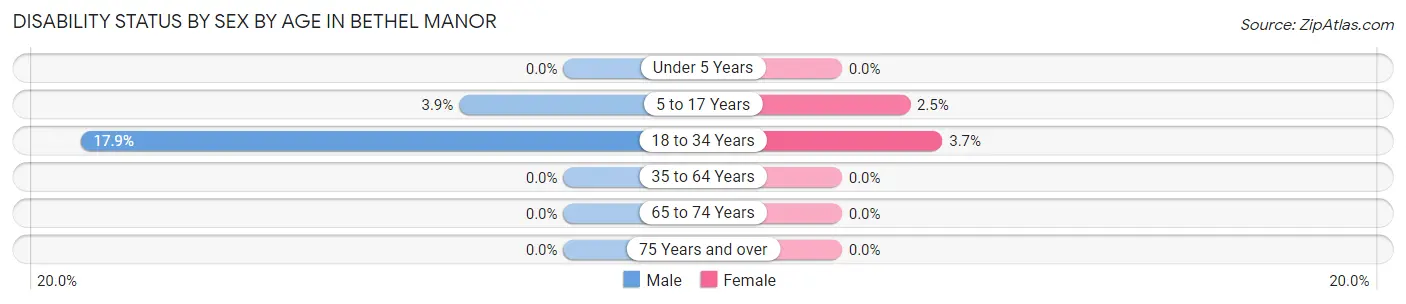
| Age Bracket | Male | Female |
| Under 5 Years | 0 (0.0%) | 0 (0.0%) |
| 5 to 17 Years | 25 (3.9%) | 18 (2.5%) |
| 18 to 34 Years | 55 (17.9%) | 21 (3.7%) |
| 35 to 64 Years | 0 (0.0%) | 0 (0.0%) |
| 65 to 74 Years | 0 (0.0%) | 0 (0.0%) |
| 75 Years and over | 0 (0.0%) | 0 (0.0%) |
Disability Class by Sex by Age in Bethel Manor
Disability Class: Hearing Difficulty
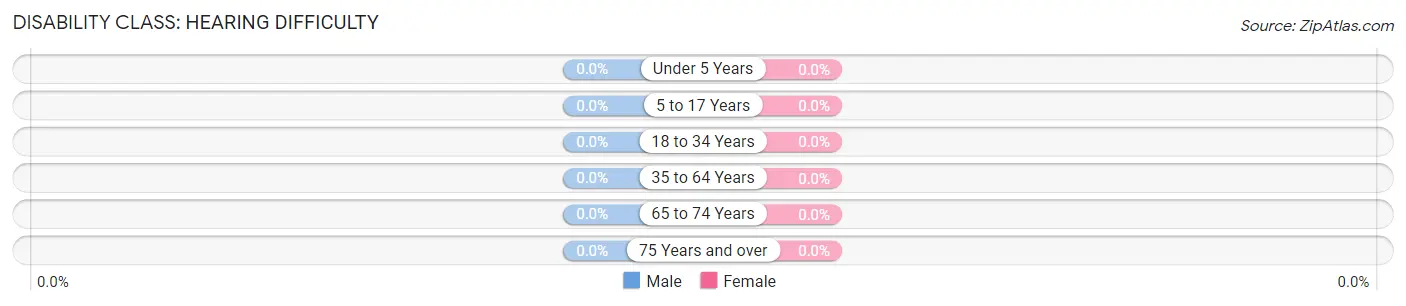
| Age Bracket | Male | Female |
| Under 5 Years | 0 (0.0%) | 0 (0.0%) |
| 5 to 17 Years | 0 (0.0%) | 0 (0.0%) |
| 18 to 34 Years | 0 (0.0%) | 0 (0.0%) |
| 35 to 64 Years | 0 (0.0%) | 0 (0.0%) |
| 65 to 74 Years | 0 (0.0%) | 0 (0.0%) |
| 75 Years and over | 0 (0.0%) | 0 (0.0%) |
Disability Class: Vision Difficulty
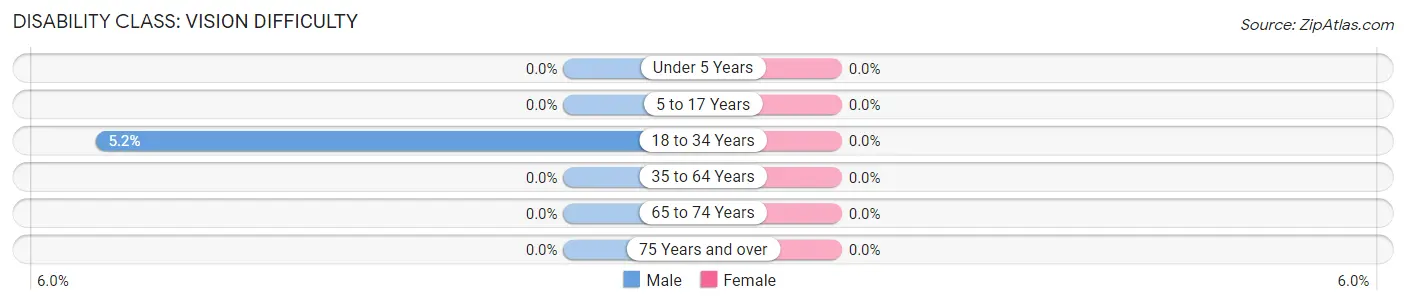
| Age Bracket | Male | Female |
| Under 5 Years | 0 (0.0%) | 0 (0.0%) |
| 5 to 17 Years | 0 (0.0%) | 0 (0.0%) |
| 18 to 34 Years | 16 (5.2%) | 0 (0.0%) |
| 35 to 64 Years | 0 (0.0%) | 0 (0.0%) |
| 65 to 74 Years | 0 (0.0%) | 0 (0.0%) |
| 75 Years and over | 0 (0.0%) | 0 (0.0%) |
Disability Class: Cognitive Difficulty
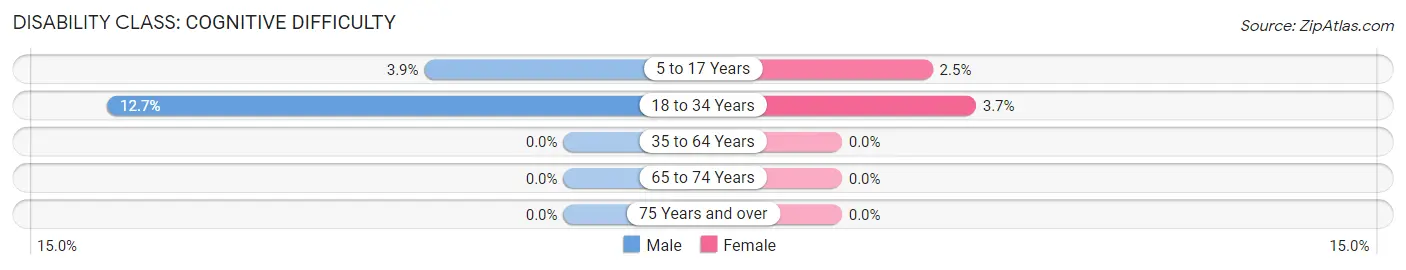
| Age Bracket | Male | Female |
| 5 to 17 Years | 25 (3.9%) | 18 (2.5%) |
| 18 to 34 Years | 39 (12.7%) | 21 (3.7%) |
| 35 to 64 Years | 0 (0.0%) | 0 (0.0%) |
| 65 to 74 Years | 0 (0.0%) | 0 (0.0%) |
| 75 Years and over | 0 (0.0%) | 0 (0.0%) |
Disability Class: Ambulatory Difficulty
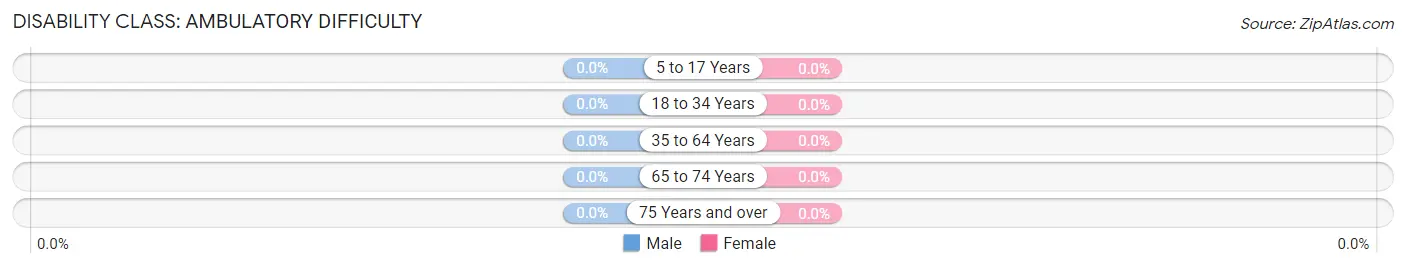
| Age Bracket | Male | Female |
| 5 to 17 Years | 0 (0.0%) | 0 (0.0%) |
| 18 to 34 Years | 0 (0.0%) | 0 (0.0%) |
| 35 to 64 Years | 0 (0.0%) | 0 (0.0%) |
| 65 to 74 Years | 0 (0.0%) | 0 (0.0%) |
| 75 Years and over | 0 (0.0%) | 0 (0.0%) |
Disability Class: Self-Care Difficulty
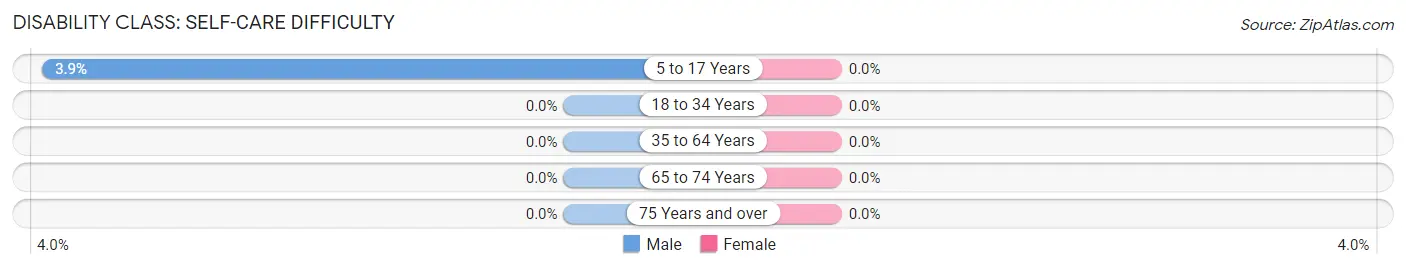
| Age Bracket | Male | Female |
| 5 to 17 Years | 25 (3.9%) | 0 (0.0%) |
| 18 to 34 Years | 0 (0.0%) | 0 (0.0%) |
| 35 to 64 Years | 0 (0.0%) | 0 (0.0%) |
| 65 to 74 Years | 0 (0.0%) | 0 (0.0%) |
| 75 Years and over | 0 (0.0%) | 0 (0.0%) |
Technology Access in Bethel Manor
Computing Device Access in Bethel Manor
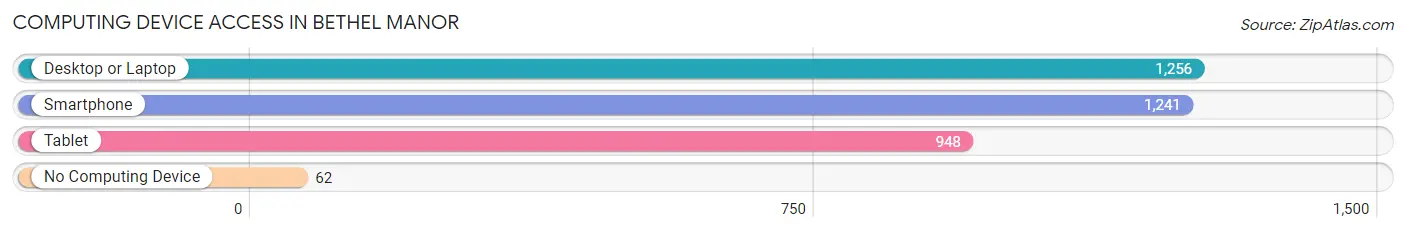
| Device Type | # Households | % Households |
| Desktop or Laptop | 1,256 | 95.3% |
| Smartphone | 1,241 | 94.2% |
| Tablet | 948 | 71.9% |
| No Computing Device | 62 | 4.7% |
| Total | 1,318 | 100.0% |
Internet Access in Bethel Manor
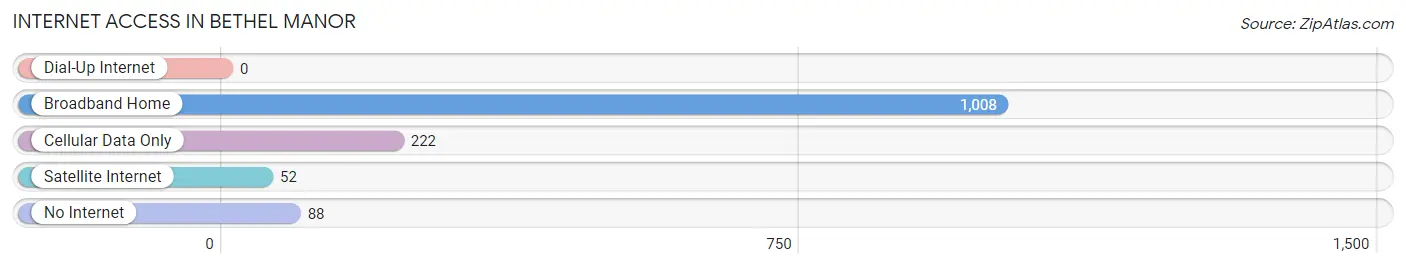
| Internet Type | # Households | % Households |
| Dial-Up Internet | 0 | 0.0% |
| Broadband Home | 1,008 | 76.5% |
| Cellular Data Only | 222 | 16.8% |
| Satellite Internet | 52 | 4.0% |
| No Internet | 88 | 6.7% |
| Total | 1,318 | 100.0% |
Bethel Manor Summary
Bethel Manor is a census-designated place (CDP) located in York County, Virginia. It is situated in the Hampton Roads metropolitan area, and is part of the Virginia Beach-Norfolk-Newport News, VA-NC Metropolitan Statistical Area. The population of Bethel Manor was 2,845 at the 2010 census.
Geography
Bethel Manor is located at 37°09'45" North, 76°37'45" West (37.1625, -76.6292). It is bordered by the city of Hampton to the north, the city of Newport News to the east, and the city of Yorktown to the south. The CDP has a total area of 4.2 square miles, all of which is land.
History
Bethel Manor was first settled in the early 1700s by English colonists. The area was originally known as Bethel Church, named after the Bethel Church of England, which was established in 1710. The church was located on the site of the present-day Bethel Manor Elementary School.
In 1781, during the American Revolutionary War, the Battle of Bethel Church was fought in the area. The battle was a victory for the American forces, and resulted in the British retreat from the area.
In the late 1800s, the area was developed as a farming community. The Bethel Manor Post Office was established in 1891, and the Bethel Manor School was established in 1895.
In the early 1900s, the area began to experience rapid growth due to the development of the nearby Langley Air Force Base. The base was established in 1917, and has since become one of the largest military installations in the United States.
Economy
The economy of Bethel Manor is largely based on the military presence in the area. The Langley Air Force Base is the largest employer in the area, and provides jobs for many of the residents of Bethel Manor. Other major employers in the area include the Newport News Shipbuilding and Drydock Company, the Hampton Roads Naval Shipyard, and the Norfolk Naval Shipyard.
In addition to the military presence, Bethel Manor is home to several small businesses, including restaurants, retail stores, and professional services. The area is also home to several large shopping centers, including the Peninsula Town Center and the Williamsburg Premium Outlets.
Demographics
As of the 2010 census, the population of Bethel Manor was 2,845. The racial makeup of the CDP was 79.3% White, 13.2% African American, 0.7% Native American, 2.2% Asian, 0.1% Pacific Islander, 1.7% from other races, and 2.8% from two or more races. Hispanic or Latino of any race were 4.2% of the population.
The median household income in Bethel Manor was $63,958, and the median family income was $71,917. The per capita income for the CDP was $27,945. About 5.2% of families and 6.7% of the population were below the poverty line, including 8.2% of those under age 18 and 4.2% of those age 65 or over.
Common Questions
What is Per Capita Income in Bethel Manor?
Per Capita income in Bethel Manor is $23,416.
What is the Median Family Income in Bethel Manor?
Median Family Income in Bethel Manor is $76,333.
What is the Median Household income in Bethel Manor?
Median Household Income in Bethel Manor is $76,083.
What is Income or Wage Gap in Bethel Manor?
Income or Wage Gap in Bethel Manor is 24.3%.
Women in Bethel Manor earn 75.7 cents for every dollar earned by a man.
What is Inequality or Gini Index in Bethel Manor?
Inequality or Gini Index in Bethel Manor is 0.26.
What is the Total Population of Bethel Manor?
Total Population of Bethel Manor is 4,422.
What is the Total Male Population of Bethel Manor?
Total Male Population of Bethel Manor is 2,023.
What is the Total Female Population of Bethel Manor?
Total Female Population of Bethel Manor is 2,399.
What is the Ratio of Males per 100 Females in Bethel Manor?
There are 84.33 Males per 100 Females in Bethel Manor.
What is the Ratio of Females per 100 Males in Bethel Manor?
There are 118.59 Females per 100 Males in Bethel Manor.
What is the Median Population Age in Bethel Manor?
Median Population Age in Bethel Manor is 22.5 Years.
What is the Average Family Size in Bethel Manor
Average Family Size in Bethel Manor is 3.4 People.
What is the Average Household Size in Bethel Manor
Average Household Size in Bethel Manor is 3.4 People.
How Large is the Labor Force in Bethel Manor?
There are 1,945 People in the Labor Forcein in Bethel Manor.
What is the Percentage of People in the Labor Force in Bethel Manor?
78.6% of People are in the Labor Force in Bethel Manor.