Alberta, VA Map & Demographics
Alberta Map
Alberta Overview
$30,327
PER CAPITA INCOME
$67,143
AVG FAMILY INCOME
$51,250
AVG HOUSEHOLD INCOME
4.0%
WAGE / INCOME GAP [ % ]
96.0¢/ $1
WAGE / INCOME GAP [ $ ]
0.39
INEQUALITY / GINI INDEX
297
TOTAL POPULATION
155
MALE POPULATION
142
FEMALE POPULATION
109.15
MALES / 100 FEMALES
91.61
FEMALES / 100 MALES
55.2
MEDIAN AGE
2.5
AVG FAMILY SIZE
2.0
AVG HOUSEHOLD SIZE
163
LABOR FORCE [ PEOPLE ]
60.1%
PERCENT IN LABOR FORCE
4.3%
UNEMPLOYMENT RATE
Alberta Zip Codes
Alberta Area Codes
Income in Alberta
Income Overview in Alberta
Per Capita Income in Alberta is $30,327, while median incomes of families and households are $67,143 and $51,250 respectively.
| Characteristic | Number | Measure |
| Per Capita Income | 297 | $30,327 |
| Median Family Income | 86 | $67,143 |
| Mean Family Income | 86 | $74,402 |
| Median Household Income | 149 | $51,250 |
| Mean Household Income | 149 | $56,522 |
| Income Deficit | 86 | $0 |
| Wage / Income Gap (%) | 297 | 4.02% |
| Wage / Income Gap ($) | 297 | 95.98¢ per $1 |
| Gini / Inequality Index | 297 | 0.39 |
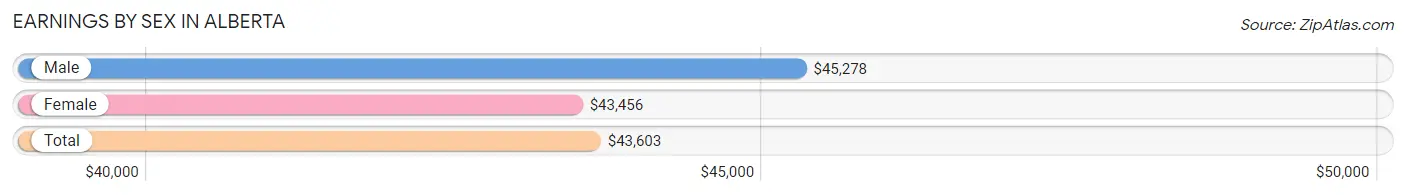
Earnings by Sex in Alberta
Average Earnings in Alberta are $43,603, $45,278 for men and $43,456 for women, a difference of 4.0%.
| Sex | Number | Average Earnings |
| Male | 92 (53.2%) | $45,278 |
| Female | 81 (46.8%) | $43,456 |
| Total | 173 (100.0%) | $43,603 |
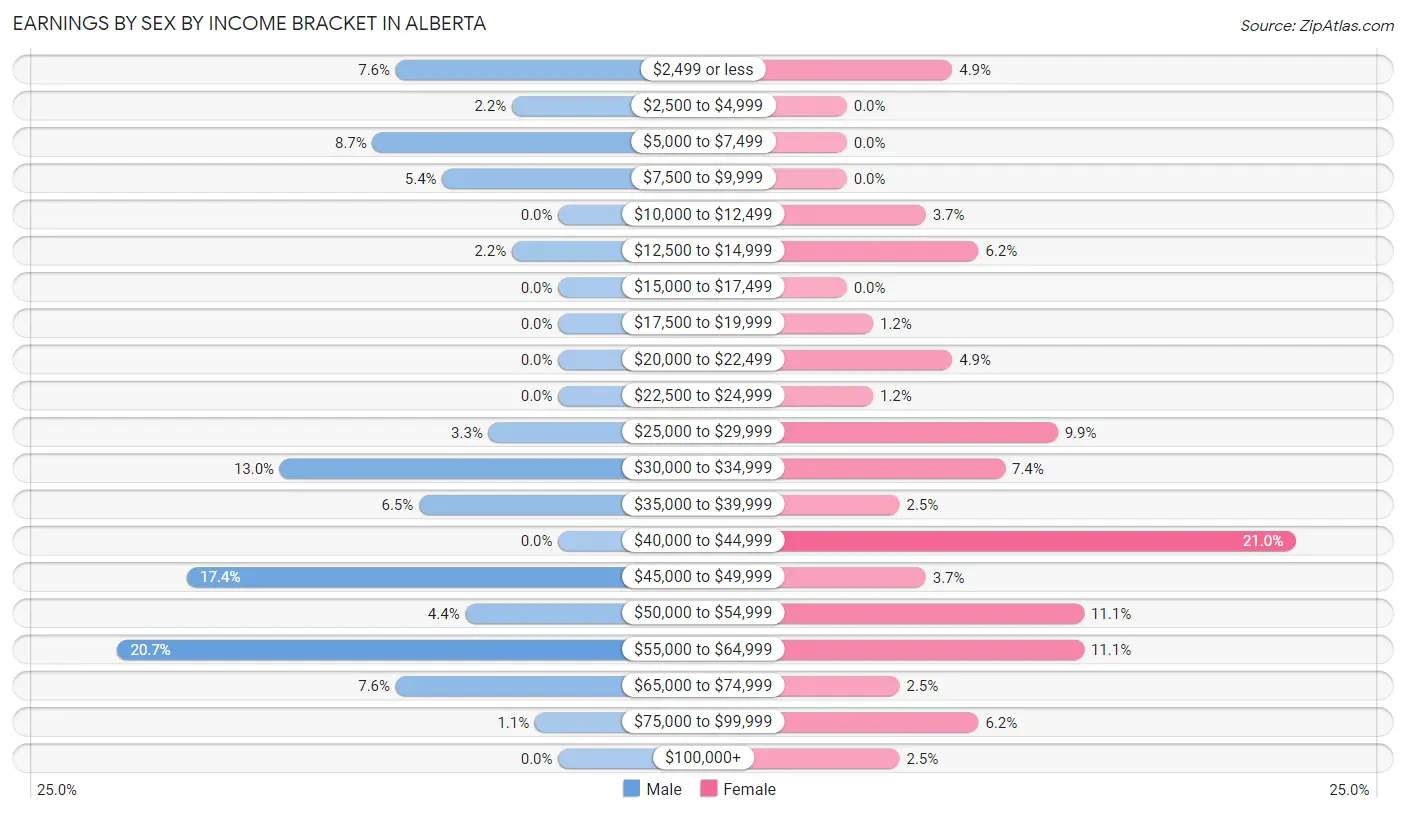
Earnings by Sex by Income Bracket in Alberta
The most common earnings brackets in Alberta are $55,000 to $64,999 for men (19 | 20.6%) and $40,000 to $44,999 for women (17 | 21.0%).
| Income | Male | Female |
| $2,499 or less | 7 (7.6%) | 4 (4.9%) |
| $2,500 to $4,999 | 2 (2.2%) | 0 (0.0%) |
| $5,000 to $7,499 | 8 (8.7%) | 0 (0.0%) |
| $7,500 to $9,999 | 5 (5.4%) | 0 (0.0%) |
| $10,000 to $12,499 | 0 (0.0%) | 3 (3.7%) |
| $12,500 to $14,999 | 2 (2.2%) | 5 (6.2%) |
| $15,000 to $17,499 | 0 (0.0%) | 0 (0.0%) |
| $17,500 to $19,999 | 0 (0.0%) | 1 (1.2%) |
| $20,000 to $22,499 | 0 (0.0%) | 4 (4.9%) |
| $22,500 to $24,999 | 0 (0.0%) | 1 (1.2%) |
| $25,000 to $29,999 | 3 (3.3%) | 8 (9.9%) |
| $30,000 to $34,999 | 12 (13.0%) | 6 (7.4%) |
| $35,000 to $39,999 | 6 (6.5%) | 2 (2.5%) |
| $40,000 to $44,999 | 0 (0.0%) | 17 (21.0%) |
| $45,000 to $49,999 | 16 (17.4%) | 3 (3.7%) |
| $50,000 to $54,999 | 4 (4.3%) | 9 (11.1%) |
| $55,000 to $64,999 | 19 (20.6%) | 9 (11.1%) |
| $65,000 to $74,999 | 7 (7.6%) | 2 (2.5%) |
| $75,000 to $99,999 | 1 (1.1%) | 5 (6.2%) |
| $100,000+ | 0 (0.0%) | 2 (2.5%) |
| Total | 92 (100.0%) | 81 (100.0%) |
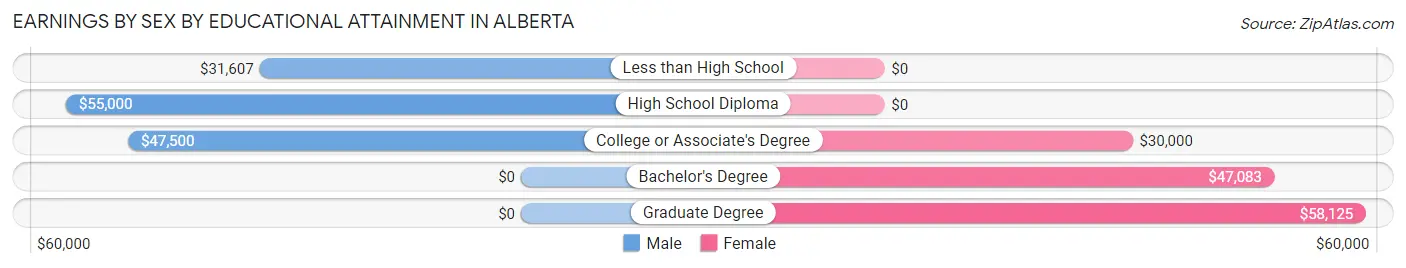
Earnings by Sex by Educational Attainment in Alberta
Average earnings in Alberta are $46,250 for men and $43,333 for women, a difference of 6.3%. Men with an educational attainment of high school diploma enjoy the highest average annual earnings of $55,000, while those with less than high school education earn the least with $31,607. Women with an educational attainment of graduate degree earn the most with the average annual earnings of $58,125, while those with college or associate's degree education have the smallest earnings of $30,000.
| Educational Attainment | Male Income | Female Income |
| Less than High School | $31,607 | $0 |
| High School Diploma | $55,000 | $0 |
| College or Associate's Degree | $47,500 | $30,000 |
| Bachelor's Degree | - | - |
| Graduate Degree | - | - |
| Total | $46,250 | $43,333 |
Family Income in Alberta
Family Income Brackets in Alberta
According to the Alberta family income data, there are 27 families falling into the $50,000 to $74,999 income range, which is the most common income bracket and makes up 31.4% of all families.
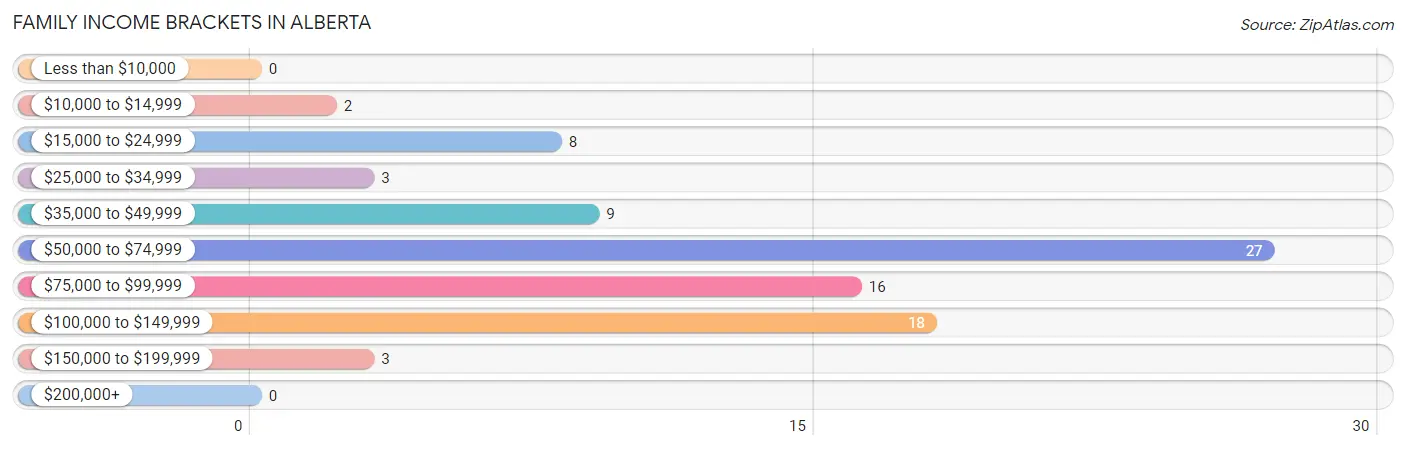
| Income Bracket | # Families | % Families |
| Less than $10,000 | 0 | 0.0% |
| $10,000 to $14,999 | 2 | 2.3% |
| $15,000 to $24,999 | 8 | 9.3% |
| $25,000 to $34,999 | 3 | 3.5% |
| $35,000 to $49,999 | 9 | 10.5% |
| $50,000 to $74,999 | 27 | 31.4% |
| $75,000 to $99,999 | 16 | 18.6% |
| $100,000 to $149,999 | 18 | 20.9% |
| $150,000 to $199,999 | 3 | 3.5% |
| $200,000+ | 0 | 0.0% |
Family Income by Famaliy Size in Alberta
3-person families (17 | 19.8%) account for the highest median family income in Alberta with $93,125 per family, while 2-person families (57 | 66.3%) have the highest median income of $32,590 per family member.
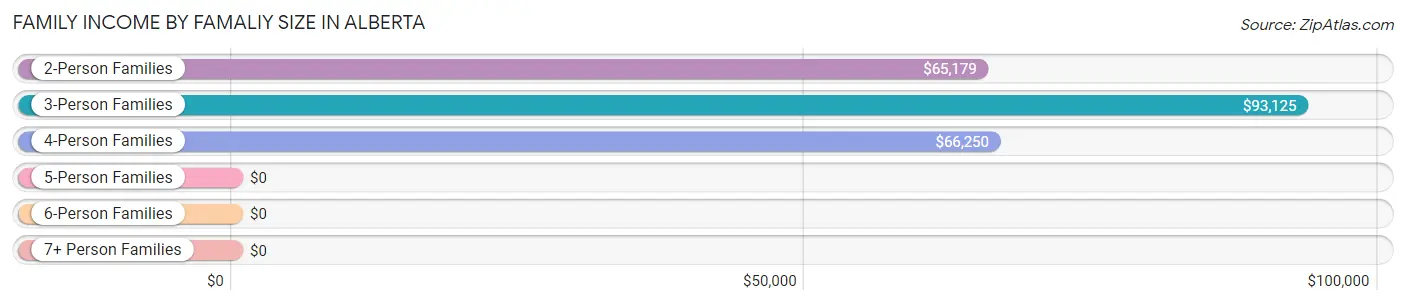
| Income Bracket | # Families | Median Income |
| 2-Person Families | 57 (66.3%) | $65,179 |
| 3-Person Families | 17 (19.8%) | $93,125 |
| 4-Person Families | 8 (9.3%) | $66,250 |
| 5-Person Families | 0 (0.0%) | $0 |
| 6-Person Families | 4 (4.6%) | $0 |
| 7+ Person Families | 0 (0.0%) | $0 |
| Total | 86 (100.0%) | $67,143 |
Family Income by Number of Earners in Alberta
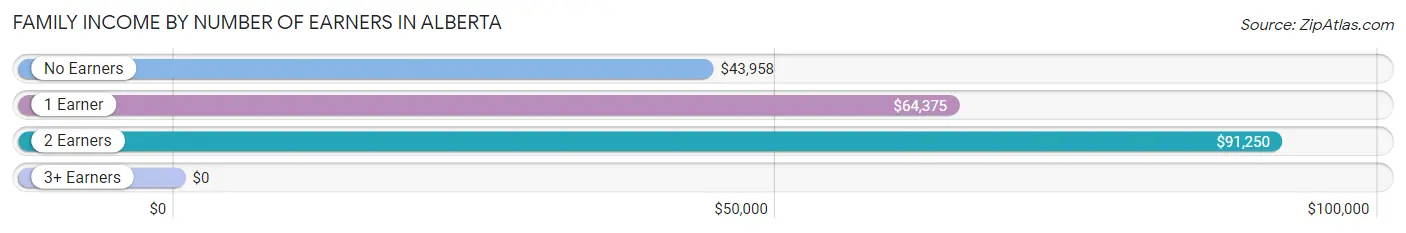
| Number of Earners | # Families | Median Income |
| No Earners | 17 (19.8%) | $43,958 |
| 1 Earner | 25 (29.1%) | $64,375 |
| 2 Earners | 44 (51.2%) | $91,250 |
| 3+ Earners | 0 (0.0%) | $0 |
| Total | 86 (100.0%) | $67,143 |
Household Income in Alberta
Household Income Brackets in Alberta
With 36 households falling in the category, the $50,000 to $74,999 income range is the most frequent in Alberta, accounting for 24.2% of all households.
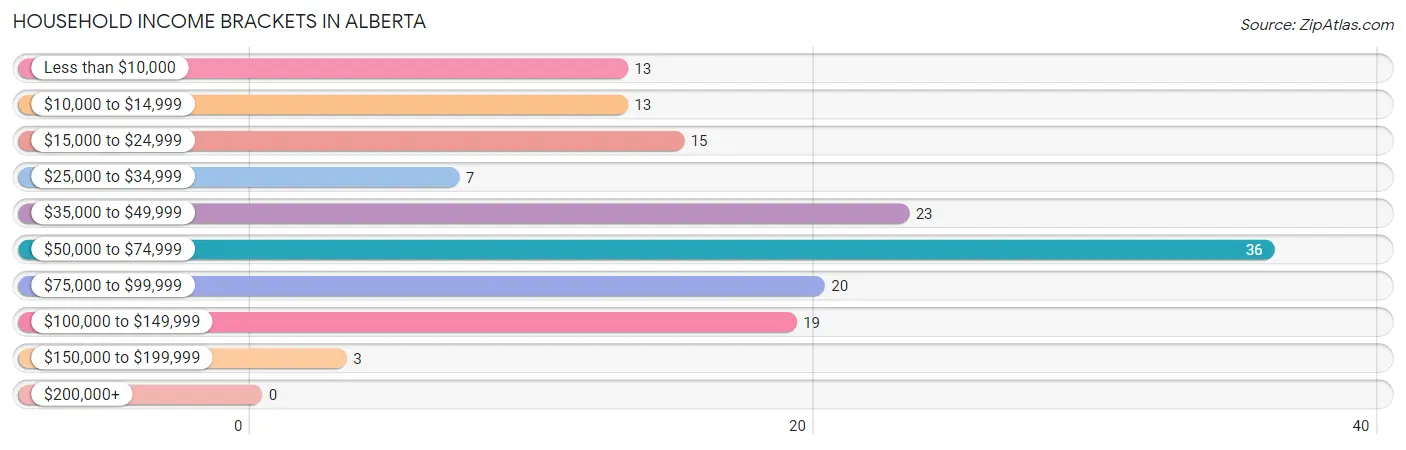
| Income Bracket | # Households | % Households |
| Less than $10,000 | 13 | 8.7% |
| $10,000 to $14,999 | 13 | 8.7% |
| $15,000 to $24,999 | 15 | 10.1% |
| $25,000 to $34,999 | 7 | 4.7% |
| $35,000 to $49,999 | 23 | 15.4% |
| $50,000 to $74,999 | 36 | 24.2% |
| $75,000 to $99,999 | 20 | 13.4% |
| $100,000 to $149,999 | 19 | 12.8% |
| $150,000 to $199,999 | 3 | 2.0% |
| $200,000+ | 0 | 0.0% |
Household Income by Householder Age in Alberta
The median household income in Alberta is $51,250, with the highest median household income of $64,375 found in the 25 to 44 years age bracket for the primary householder. A total of 25 households (16.8%) fall into this category. Meanwhile, the 15 to 24 years age bracket for the primary householder has the lowest median household income of $0, with 3 households (2.0%) in this group.
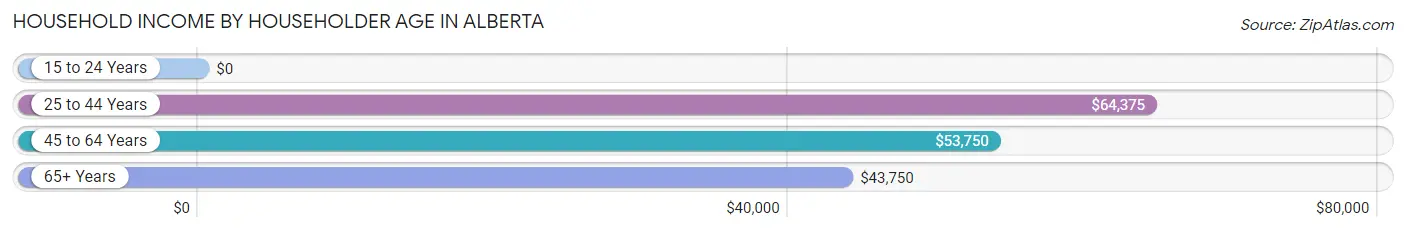
| Income Bracket | # Households | Median Income |
| 15 to 24 Years | 3 (2.0%) | $0 |
| 25 to 44 Years | 25 (16.8%) | $64,375 |
| 45 to 64 Years | 68 (45.6%) | $53,750 |
| 65+ Years | 53 (35.6%) | $43,750 |
| Total | 149 (100.0%) | $51,250 |
Poverty in Alberta
Income Below Poverty by Sex and Age in Alberta
With 18.1% poverty level for males and 16.9% for females among the residents of Alberta, 45 to 54 year old males and 55 to 64 year old females are the most vulnerable to poverty, with 5 males (31.2%) and 14 females (41.2%) in their respective age groups living below the poverty level.
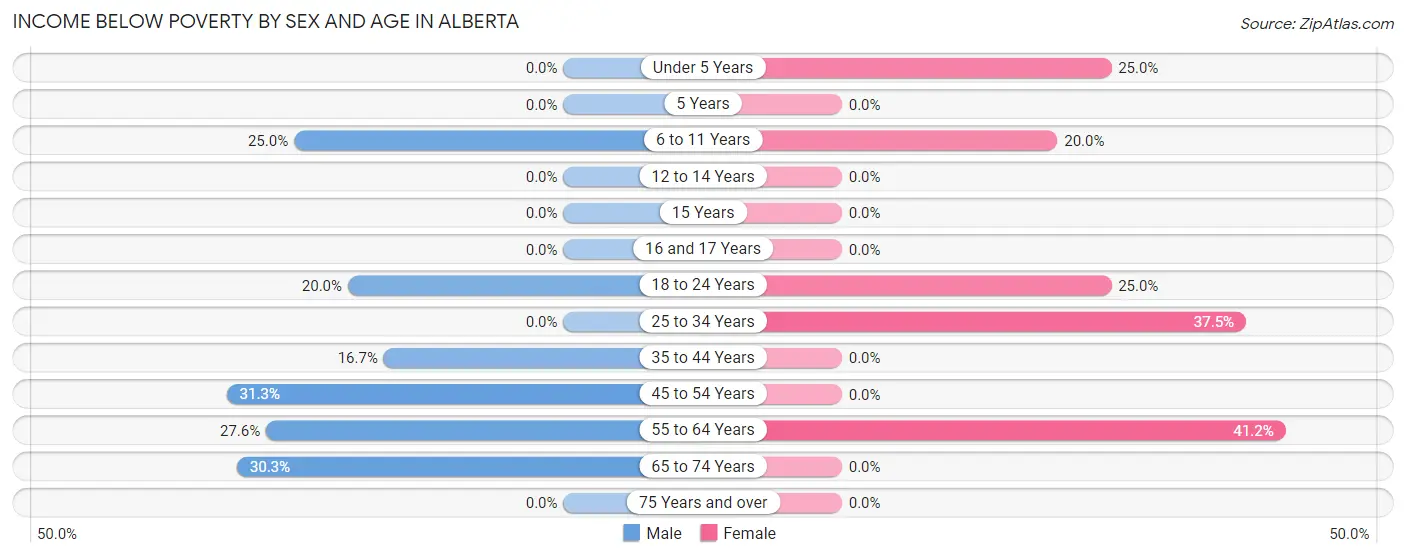
| Age Bracket | Male | Female |
| Under 5 Years | 0 (0.0%) | 1 (25.0%) |
| 5 Years | 0 (0.0%) | 0 (0.0%) |
| 6 to 11 Years | 1 (25.0%) | 1 (20.0%) |
| 12 to 14 Years | 0 (0.0%) | 0 (0.0%) |
| 15 Years | 0 (0.0%) | 0 (0.0%) |
| 16 and 17 Years | 0 (0.0%) | 0 (0.0%) |
| 18 to 24 Years | 3 (20.0%) | 2 (25.0%) |
| 25 to 34 Years | 0 (0.0%) | 6 (37.5%) |
| 35 to 44 Years | 1 (16.7%) | 0 (0.0%) |
| 45 to 54 Years | 5 (31.2%) | 0 (0.0%) |
| 55 to 64 Years | 8 (27.6%) | 14 (41.2%) |
| 65 to 74 Years | 10 (30.3%) | 0 (0.0%) |
| 75 Years and over | 0 (0.0%) | 0 (0.0%) |
| Total | 28 (18.1%) | 24 (16.9%) |
Income Above Poverty by Sex and Age in Alberta
According to the poverty statistics in Alberta, males aged under 5 years and females aged 12 to 14 years are the age groups that are most secure financially, with 100.0% of males and 100.0% of females in these age groups living above the poverty line.
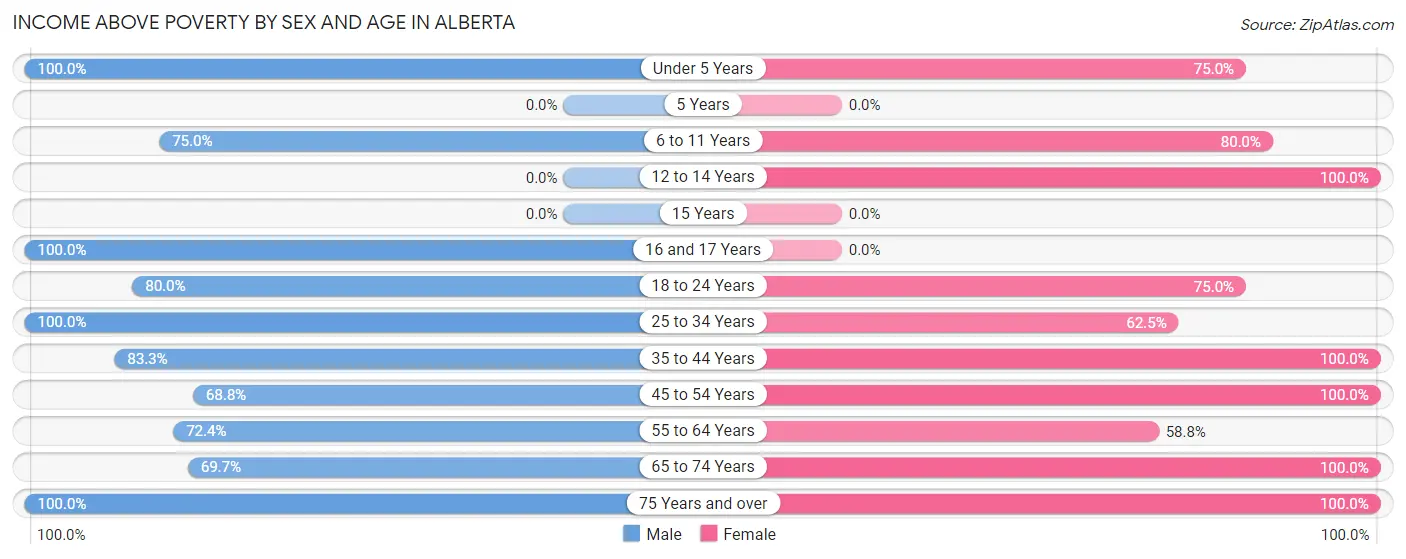
| Age Bracket | Male | Female |
| Under 5 Years | 11 (100.0%) | 3 (75.0%) |
| 5 Years | 0 (0.0%) | 0 (0.0%) |
| 6 to 11 Years | 3 (75.0%) | 4 (80.0%) |
| 12 to 14 Years | 0 (0.0%) | 2 (100.0%) |
| 15 Years | 0 (0.0%) | 0 (0.0%) |
| 16 and 17 Years | 3 (100.0%) | 0 (0.0%) |
| 18 to 24 Years | 12 (80.0%) | 6 (75.0%) |
| 25 to 34 Years | 25 (100.0%) | 10 (62.5%) |
| 35 to 44 Years | 5 (83.3%) | 9 (100.0%) |
| 45 to 54 Years | 11 (68.8%) | 24 (100.0%) |
| 55 to 64 Years | 21 (72.4%) | 20 (58.8%) |
| 65 to 74 Years | 23 (69.7%) | 16 (100.0%) |
| 75 Years and over | 13 (100.0%) | 24 (100.0%) |
| Total | 127 (81.9%) | 118 (83.1%) |
Income Below Poverty Among Married-Couple Families in Alberta
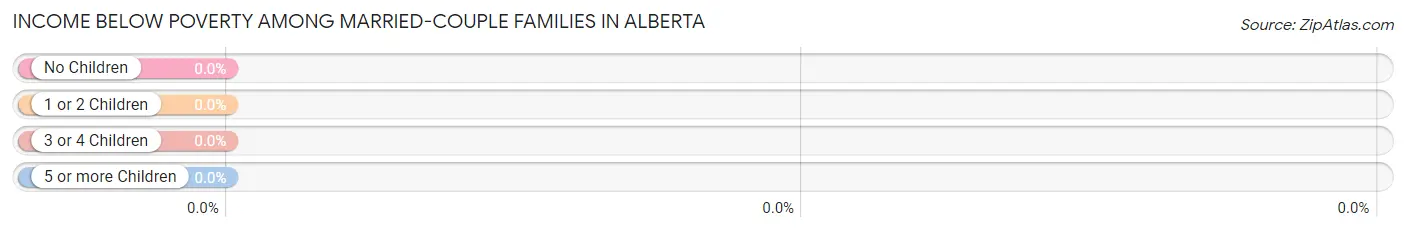
| Children | Above Poverty | Below Poverty |
| No Children | 34 (100.0%) | 0 (0.0%) |
| 1 or 2 Children | 14 (100.0%) | 0 (0.0%) |
| 3 or 4 Children | 0 (0.0%) | 0 (0.0%) |
| 5 or more Children | 0 (0.0%) | 0 (0.0%) |
| Total | 48 (100.0%) | 0 (0.0%) |
Income Below Poverty Among Single-Parent Households in Alberta
According to the poverty data in Alberta, 18.2% or 2 single-father households and 11.1% or 3 single-mother households are living below the poverty line. Among single-father households, those with 1 or 2 children have the highest poverty rate, with 2 households (33.3%) experiencing poverty. Likewise, among single-mother households, those with 1 or 2 children have the highest poverty rate, with 1 households (33.3%) falling below the poverty line.
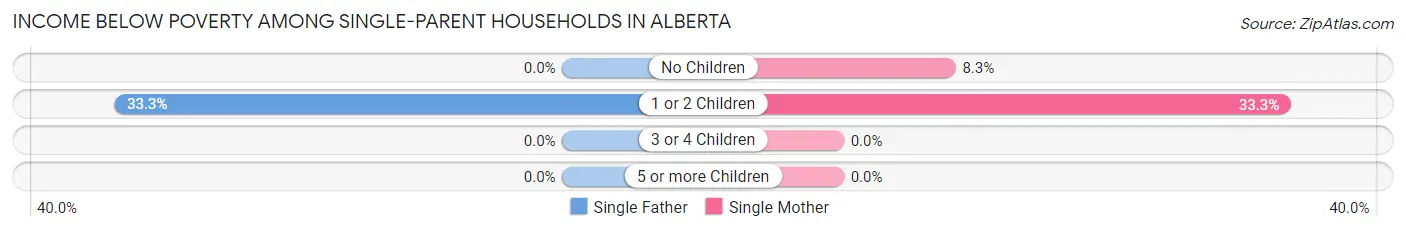
| Children | Single Father | Single Mother |
| No Children | 0 (0.0%) | 2 (8.3%) |
| 1 or 2 Children | 2 (33.3%) | 1 (33.3%) |
| 3 or 4 Children | 0 (0.0%) | 0 (0.0%) |
| 5 or more Children | 0 (0.0%) | 0 (0.0%) |
| Total | 2 (18.2%) | 3 (11.1%) |
Income Below Poverty Among Married-Couple vs Single-Parent Households in Alberta
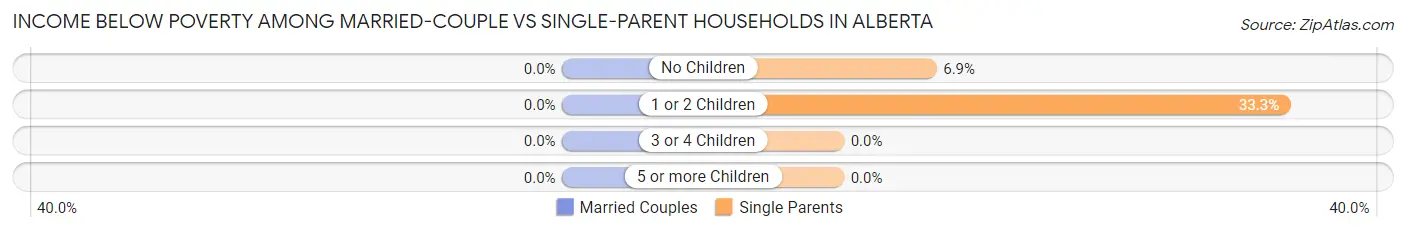
| Children | Married-Couple Families | Single-Parent Households |
| No Children | 0 (0.0%) | 2 (6.9%) |
| 1 or 2 Children | 0 (0.0%) | 3 (33.3%) |
| 3 or 4 Children | 0 (0.0%) | 0 (0.0%) |
| 5 or more Children | 0 (0.0%) | 0 (0.0%) |
| Total | 0 (0.0%) | 5 (13.2%) |
Race in Alberta
The most populous races in Alberta are White / Caucasian (142 | 47.8%), Black / African American (132 | 44.4%), and Two or more Races (21 | 7.1%).
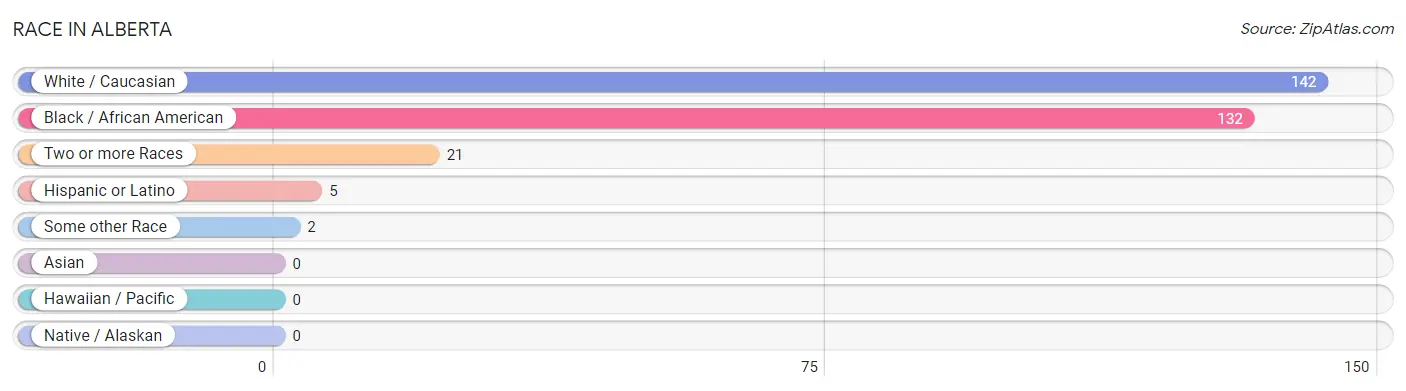
| Race | # Population | % Population |
| Asian | 0 | 0.0% |
| Black / African American | 132 | 44.4% |
| Hawaiian / Pacific | 0 | 0.0% |
| Hispanic or Latino | 5 | 1.7% |
| Native / Alaskan | 0 | 0.0% |
| White / Caucasian | 142 | 47.8% |
| Two or more Races | 21 | 7.1% |
| Some other Race | 2 | 0.7% |
| Total | 297 | 100.0% |
Ancestry in Alberta
The most populous ancestries reported in Alberta are African (40 | 13.5%), Subsaharan African (40 | 13.5%), English (32 | 10.8%), American (22 | 7.4%), and German (16 | 5.4%), together accounting for 50.5% of all Alberta residents.
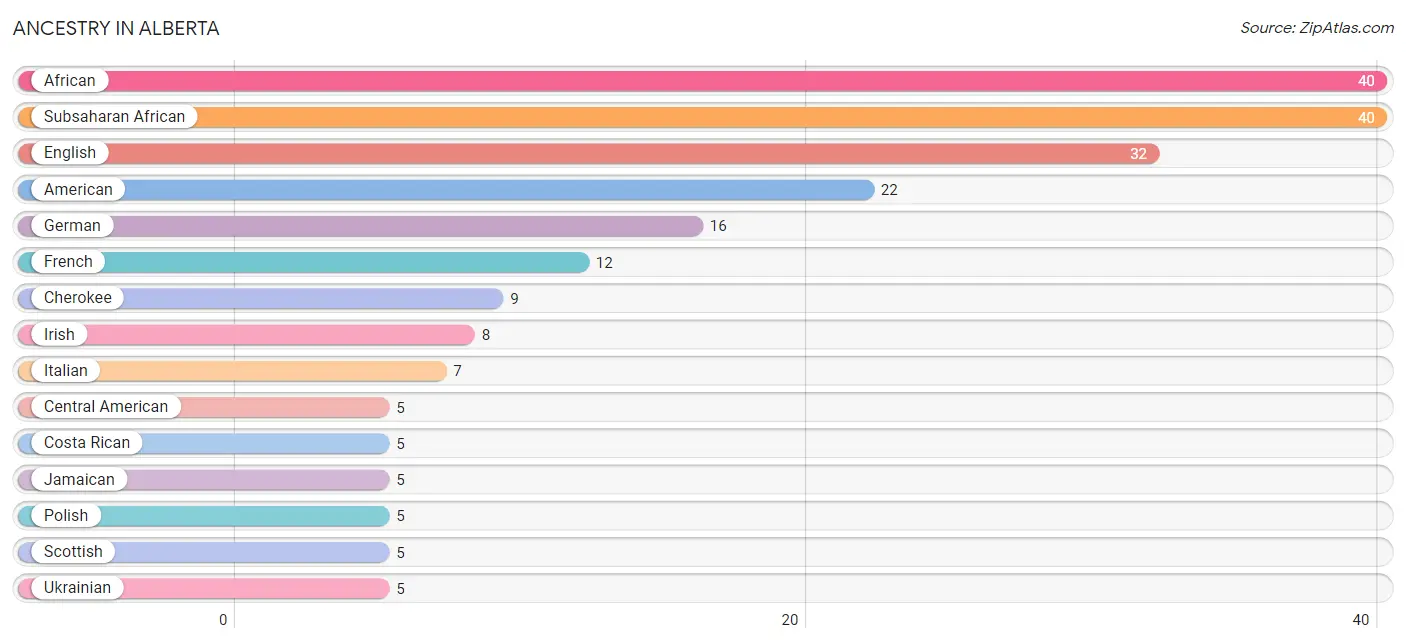
| Ancestry | # Population | % Population |
| African | 40 | 13.5% |
| American | 22 | 7.4% |
| Blackfeet | 1 | 0.3% |
| British | 1 | 0.3% |
| Central American | 5 | 1.7% |
| Cherokee | 9 | 3.0% |
| Costa Rican | 5 | 1.7% |
| English | 32 | 10.8% |
| European | 2 | 0.7% |
| Finnish | 2 | 0.7% |
| French | 12 | 4.0% |
| French Canadian | 1 | 0.3% |
| German | 16 | 5.4% |
| Irish | 8 | 2.7% |
| Italian | 7 | 2.4% |
| Jamaican | 5 | 1.7% |
| Polish | 5 | 1.7% |
| Scotch-Irish | 4 | 1.3% |
| Scottish | 5 | 1.7% |
| Sioux | 1 | 0.3% |
| Subsaharan African | 40 | 13.5% |
| Swedish | 2 | 0.7% |
| Ukrainian | 5 | 1.7% |
| Welsh | 3 | 1.0% | View All 24 Rows |
Immigrants in Alberta
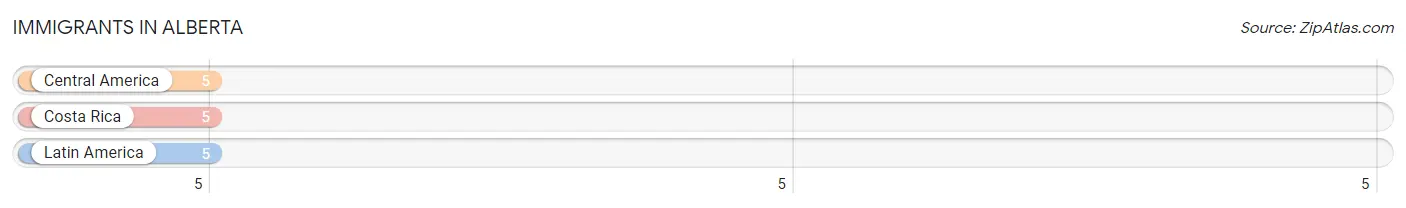
The most numerous immigrant groups reported in Alberta came from Central America (5 | 1.7%), Costa Rica (5 | 1.7%), and Latin America (5 | 1.7%), together accounting for 5.0% of all Alberta residents.
| Immigration Origin | # Population | % Population |
| Central America | 5 | 1.7% |
| Costa Rica | 5 | 1.7% |
| Latin America | 5 | 1.7% | View All 3 Rows |
Sex and Age in Alberta
Sex and Age in Alberta
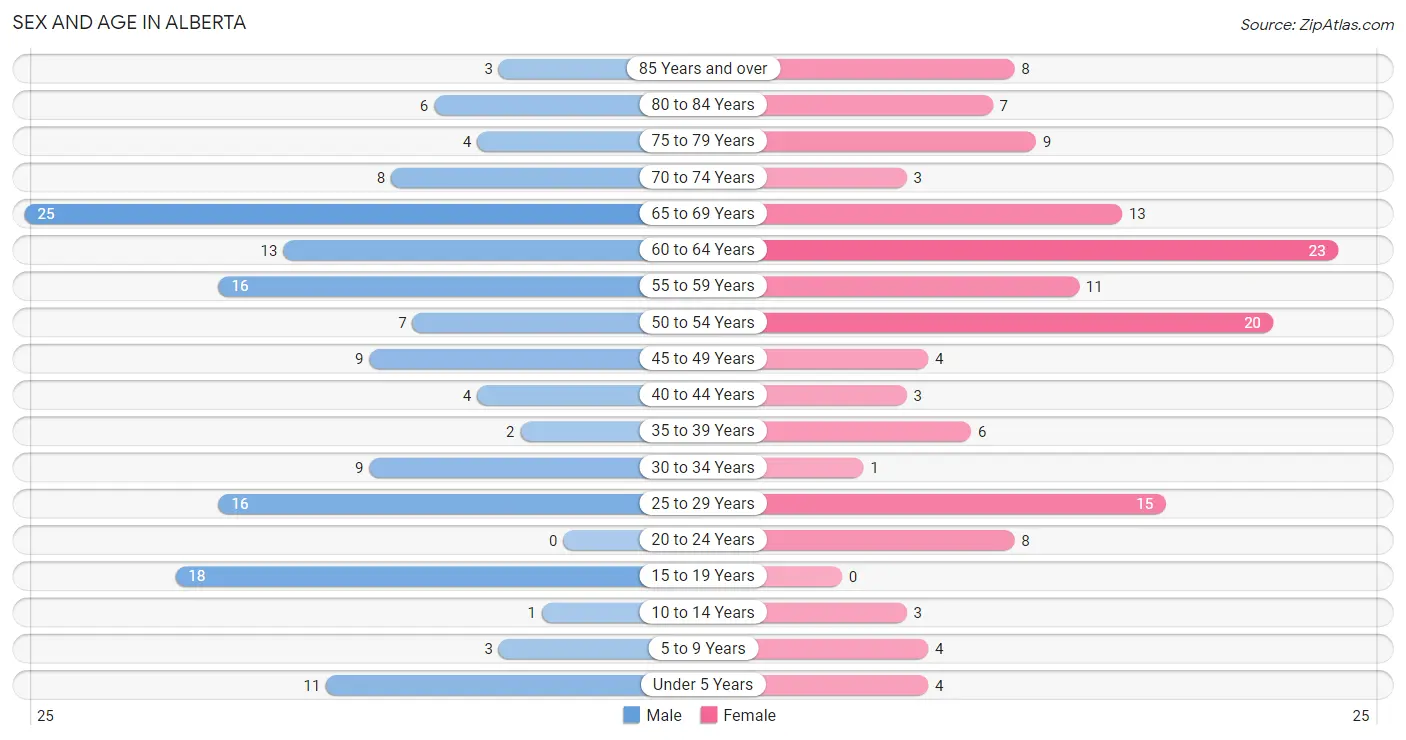
The most populous age groups in Alberta are 65 to 69 Years (25 | 16.1%) for men and 60 to 64 Years (23 | 16.2%) for women.
| Age Bracket | Male | Female |
| Under 5 Years | 11 (7.1%) | 4 (2.8%) |
| 5 to 9 Years | 3 (1.9%) | 4 (2.8%) |
| 10 to 14 Years | 1 (0.6%) | 3 (2.1%) |
| 15 to 19 Years | 18 (11.6%) | 0 (0.0%) |
| 20 to 24 Years | 0 (0.0%) | 8 (5.6%) |
| 25 to 29 Years | 16 (10.3%) | 15 (10.6%) |
| 30 to 34 Years | 9 (5.8%) | 1 (0.7%) |
| 35 to 39 Years | 2 (1.3%) | 6 (4.2%) |
| 40 to 44 Years | 4 (2.6%) | 3 (2.1%) |
| 45 to 49 Years | 9 (5.8%) | 4 (2.8%) |
| 50 to 54 Years | 7 (4.5%) | 20 (14.1%) |
| 55 to 59 Years | 16 (10.3%) | 11 (7.7%) |
| 60 to 64 Years | 13 (8.4%) | 23 (16.2%) |
| 65 to 69 Years | 25 (16.1%) | 13 (9.1%) |
| 70 to 74 Years | 8 (5.2%) | 3 (2.1%) |
| 75 to 79 Years | 4 (2.6%) | 9 (6.3%) |
| 80 to 84 Years | 6 (3.9%) | 7 (4.9%) |
| 85 Years and over | 3 (1.9%) | 8 (5.6%) |
| Total | 155 (100.0%) | 142 (100.0%) |
Families and Households in Alberta
Median Family Size in Alberta
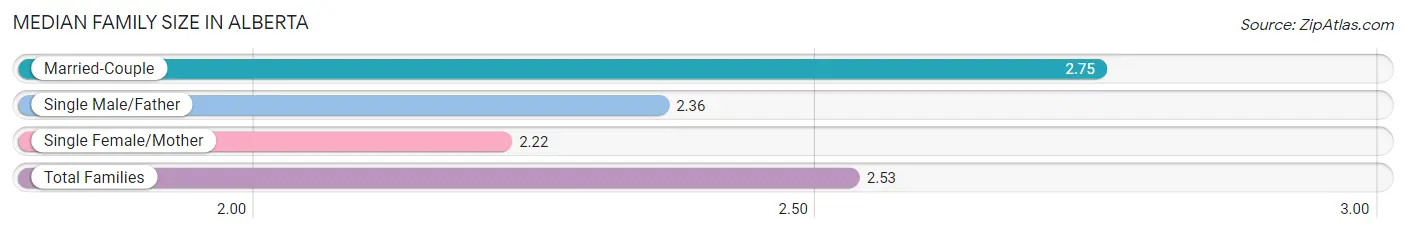
The median family size in Alberta is 2.53 persons per family, with married-couple families (48 | 55.8%) accounting for the largest median family size of 2.75 persons per family. On the other hand, single female/mother families (27 | 31.4%) represent the smallest median family size with 2.22 persons per family.
| Family Type | # Families | Family Size |
| Married-Couple | 48 (55.8%) | 2.75 |
| Single Male/Father | 11 (12.8%) | 2.36 |
| Single Female/Mother | 27 (31.4%) | 2.22 |
| Total Families | 86 (100.0%) | 2.53 |
Median Household Size in Alberta
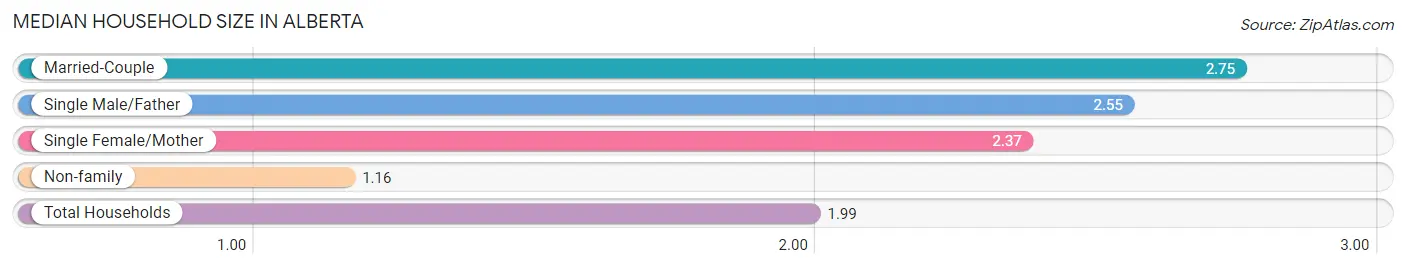
The median household size in Alberta is 1.99 persons per household, with married-couple households (48 | 32.2%) accounting for the largest median household size of 2.75 persons per household. non-family households (63 | 42.3%) represent the smallest median household size with 1.16 persons per household.
| Household Type | # Households | Household Size |
| Married-Couple | 48 (32.2%) | 2.75 |
| Single Male/Father | 11 (7.4%) | 2.55 |
| Single Female/Mother | 27 (18.1%) | 2.37 |
| Non-family | 63 (42.3%) | 1.16 |
| Total Households | 149 (100.0%) | 1.99 |
Household Size by Marriage Status in Alberta
Out of a total of 149 households in Alberta, 86 (57.7%) are family households, while 63 (42.3%) are nonfamily households. The most numerous type of family households are 2-person households, comprising 55, and the most common type of nonfamily households are 1-person households, comprising 51.
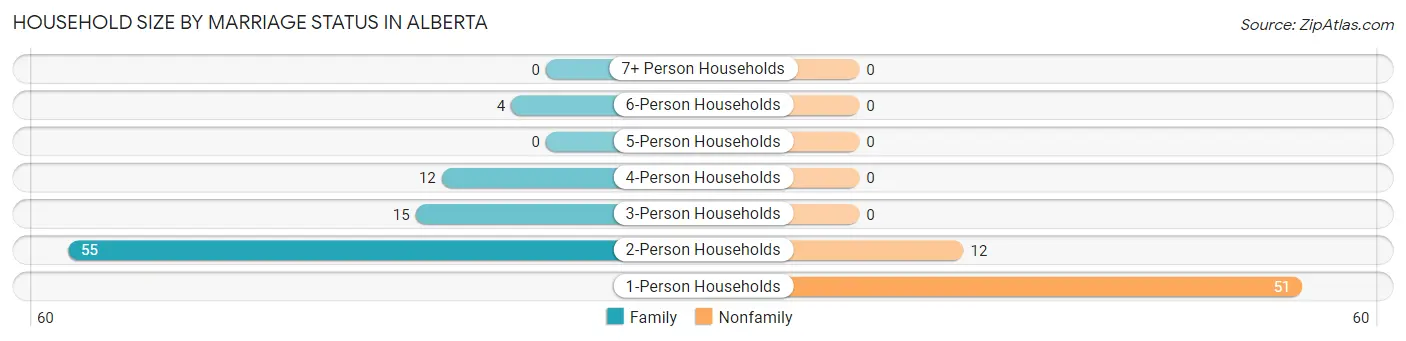
| Household Size | Family Households | Nonfamily Households |
| 1-Person Households | - | 51 (34.2%) |
| 2-Person Households | 55 (36.9%) | 12 (8.1%) |
| 3-Person Households | 15 (10.1%) | 0 (0.0%) |
| 4-Person Households | 12 (8.1%) | 0 (0.0%) |
| 5-Person Households | 0 (0.0%) | 0 (0.0%) |
| 6-Person Households | 4 (2.7%) | 0 (0.0%) |
| 7+ Person Households | 0 (0.0%) | 0 (0.0%) |
| Total | 86 (57.7%) | 63 (42.3%) |
Female Fertility in Alberta
Fertility by Age in Alberta
| Age Bracket | Women with Births | Births / 1,000 Women |
| 15 to 19 years | 0 (0.0%) | 0.0 |
| 20 to 34 years | 0 (0.0%) | 0.0 |
| 35 to 50 years | 0 (0.0%) | 0.0 |
| Total | 0 (0.0%) | 0.0 |
Fertility by Age by Marriage Status in Alberta
| Age Bracket | Married | Unmarried |
| 15 to 19 years | 0 (0.0%) | 0 (0.0%) |
| 20 to 34 years | 0 (0.0%) | 0 (0.0%) |
| 35 to 50 years | 0 (0.0%) | 0 (0.0%) |
| Total | 0 (0.0%) | 0 (0.0%) |
Fertility by Education in Alberta
| Educational Attainment | Women with Births | Births / 1,000 Women |
| Less than High School | 0 (0.0%) | 0.0 |
| High School Diploma | 0 (0.0%) | 0.0 |
| College or Associate's Degree | 0 (0.0%) | 0.0 |
| Bachelor's Degree | 0 (0.0%) | 0.0 |
| Graduate Degree | 0 (0.0%) | 0.0 |
| Total | 0 (0.0%) | 0.0 |
Fertility by Education by Marriage Status in Alberta
| Educational Attainment | Married | Unmarried |
| Less than High School | 0 (0.0%) | 0 (0.0%) |
| High School Diploma | 0 (0.0%) | 0 (0.0%) |
| College or Associate's Degree | 0 (0.0%) | 0 (0.0%) |
| Bachelor's Degree | 0 (0.0%) | 0 (0.0%) |
| Graduate Degree | 0 (0.0%) | 0 (0.0%) |
| Total | 0 (0.0%) | 0 (0.0%) |
Employment Characteristics in Alberta
Employment by Class of Employer in Alberta
Among the 149 employed individuals in Alberta, private company employees (79 | 53.0%), local government employees (23 | 15.4%), and state government employees (16 | 10.7%) make up the most common classes of employment.
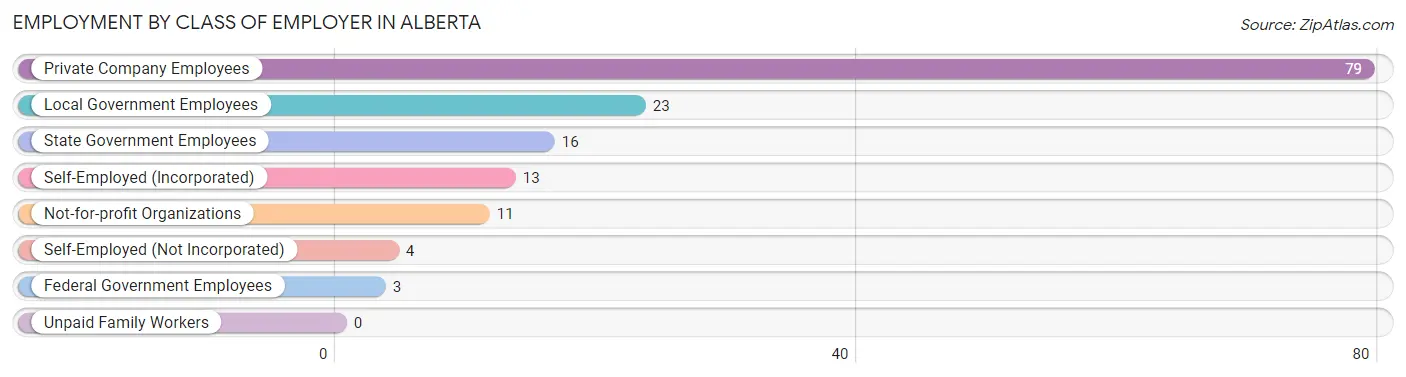
| Employer Class | # Employees | % Employees |
| Private Company Employees | 79 | 53.0% |
| Self-Employed (Incorporated) | 13 | 8.7% |
| Self-Employed (Not Incorporated) | 4 | 2.7% |
| Not-for-profit Organizations | 11 | 7.4% |
| Local Government Employees | 23 | 15.4% |
| State Government Employees | 16 | 10.7% |
| Federal Government Employees | 3 | 2.0% |
| Unpaid Family Workers | 0 | 0.0% |
| Total | 149 | 100.0% |
Employment Status by Age in Alberta
According to the labor force statistics for Alberta, out of the total population over 16 years of age (271), 60.1% or 163 individuals are in the labor force, with 4.3% or 7 of them unemployed. The age group with the highest labor force participation rate is 30 to 34 years, with 100.0% or 10 individuals in the labor force. Within the labor force, the 45 to 54 years age range has the highest percentage of unemployed individuals, with 13.9% or 5 of them being unemployed.
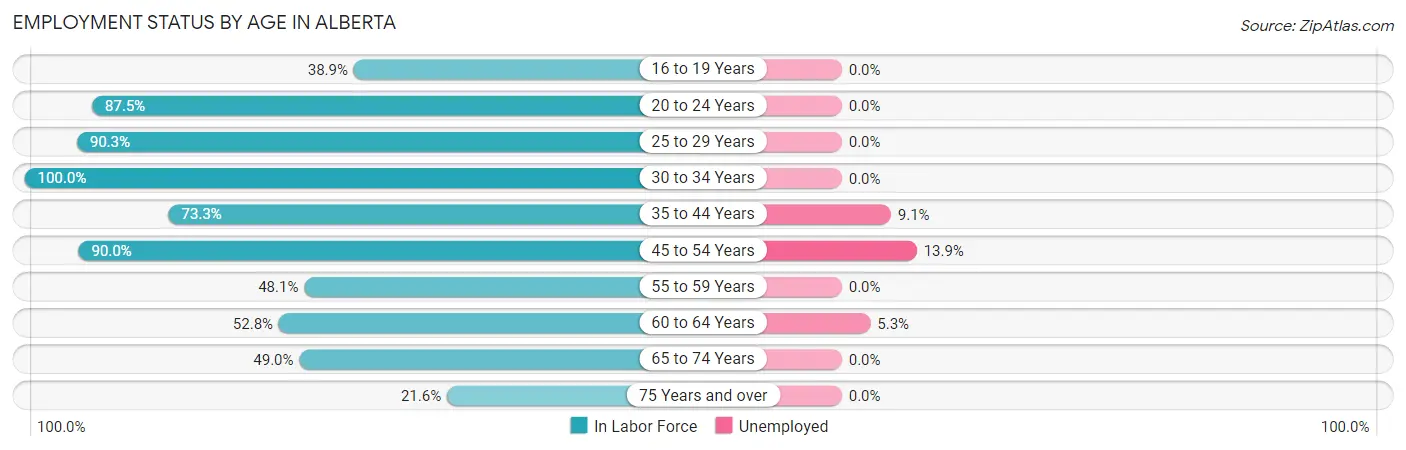
| Age Bracket | In Labor Force | Unemployed |
| 16 to 19 Years | 7 (38.9%) | 0 (0.0%) |
| 20 to 24 Years | 7 (87.5%) | 0 (0.0%) |
| 25 to 29 Years | 28 (90.3%) | 0 (0.0%) |
| 30 to 34 Years | 10 (100.0%) | 0 (0.0%) |
| 35 to 44 Years | 11 (73.3%) | 1 (9.1%) |
| 45 to 54 Years | 36 (90.0%) | 5 (13.9%) |
| 55 to 59 Years | 13 (48.1%) | 0 (0.0%) |
| 60 to 64 Years | 19 (52.8%) | 1 (5.3%) |
| 65 to 74 Years | 24 (49.0%) | 0 (0.0%) |
| 75 Years and over | 8 (21.6%) | 0 (0.0%) |
| Total | 163 (60.1%) | 7 (4.3%) |
Employment Status by Educational Attainment in Alberta
According to labor force statistics for Alberta, 73.6% of individuals (117) out of the total population between 25 and 64 years of age (159) are in the labor force, with 6.0% or 7 of them being unemployed. The group with the highest labor force participation rate are those with the educational attainment of bachelor's degree or higher, with 90.6% or 29 individuals in the labor force. Within the labor force, individuals with high school diploma education have the highest percentage of unemployment, with 22.7% or 5 of them being unemployed.
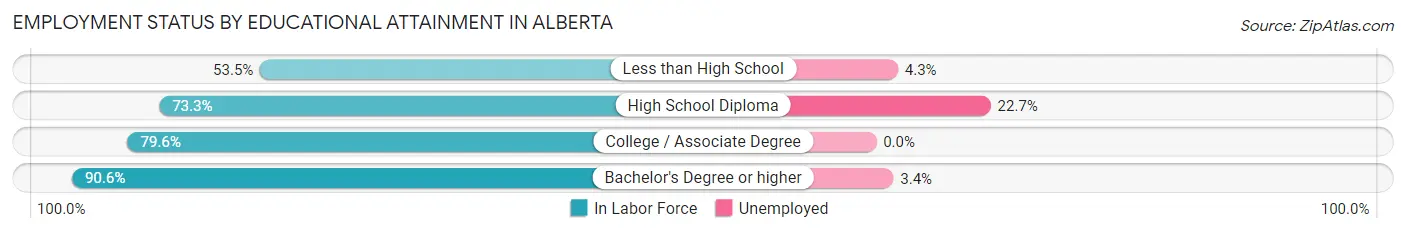
| Educational Attainment | In Labor Force | Unemployed |
| Less than High School | 23 (53.5%) | 2 (4.3%) |
| High School Diploma | 22 (73.3%) | 7 (22.7%) |
| College / Associate Degree | 43 (79.6%) | 0 (0.0%) |
| Bachelor's Degree or higher | 29 (90.6%) | 1 (3.4%) |
| Total | 117 (73.6%) | 10 (6.0%) |
Employment Occupations by Sex in Alberta
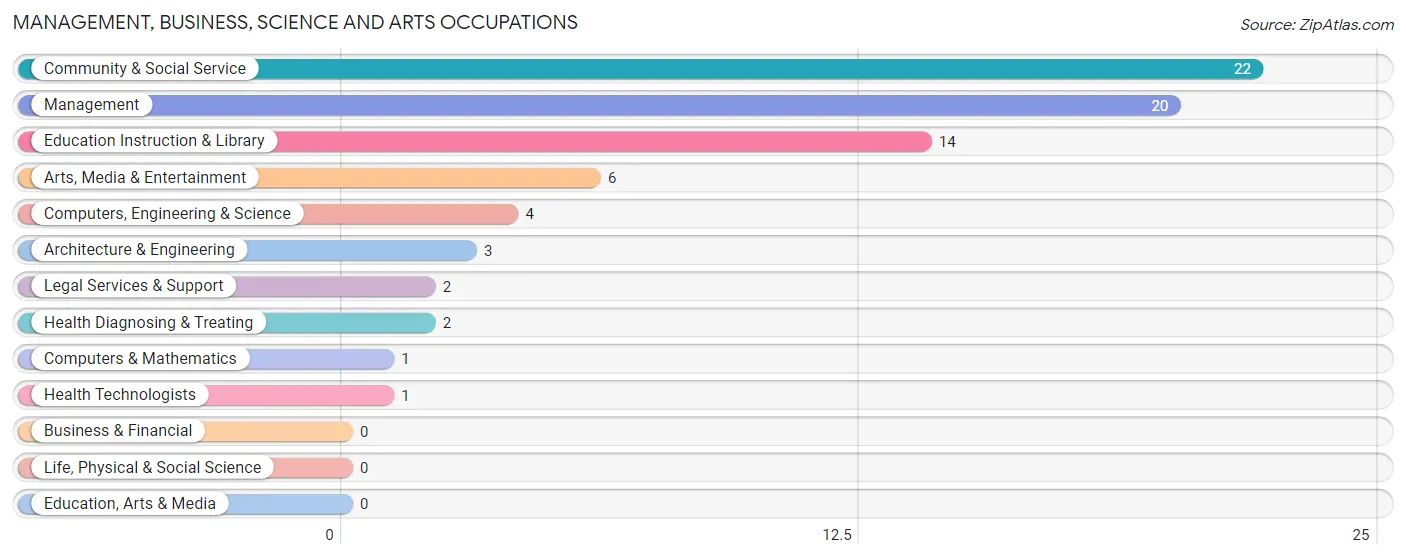
Management, Business, Science and Arts Occupations
The most common Management, Business, Science and Arts occupations in Alberta are Community & Social Service (22 | 14.1%), Management (20 | 12.8%), Education Instruction & Library (14 | 9.0%), Arts, Media & Entertainment (6 | 3.8%), and Computers, Engineering & Science (4 | 2.6%).
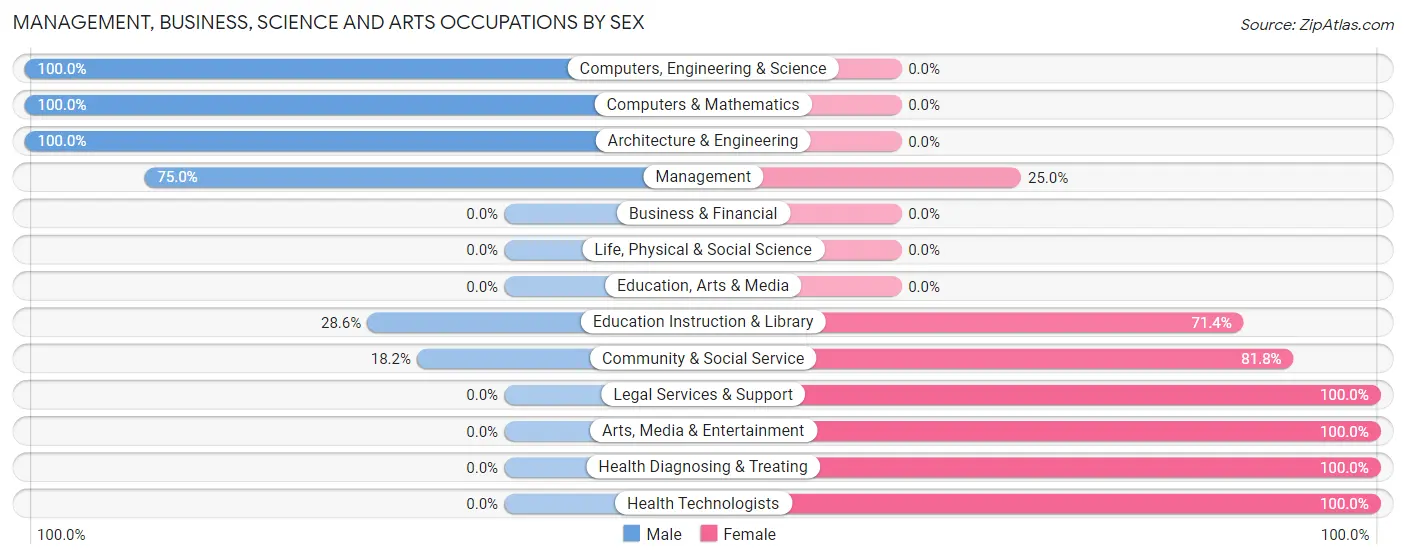
Management, Business, Science and Arts Occupations by Sex
Within the Management, Business, Science and Arts occupations in Alberta, the most male-oriented occupations are Computers, Engineering & Science (100.0%), Computers & Mathematics (100.0%), and Architecture & Engineering (100.0%), while the most female-oriented occupations are Legal Services & Support (100.0%), Arts, Media & Entertainment (100.0%), and Health Diagnosing & Treating (100.0%).
| Occupation | Male | Female |
| Management | 15 (75.0%) | 5 (25.0%) |
| Business & Financial | 0 (0.0%) | 0 (0.0%) |
| Computers, Engineering & Science | 4 (100.0%) | 0 (0.0%) |
| Computers & Mathematics | 1 (100.0%) | 0 (0.0%) |
| Architecture & Engineering | 3 (100.0%) | 0 (0.0%) |
| Life, Physical & Social Science | 0 (0.0%) | 0 (0.0%) |
| Community & Social Service | 4 (18.2%) | 18 (81.8%) |
| Education, Arts & Media | 0 (0.0%) | 0 (0.0%) |
| Legal Services & Support | 0 (0.0%) | 2 (100.0%) |
| Education Instruction & Library | 4 (28.6%) | 10 (71.4%) |
| Arts, Media & Entertainment | 0 (0.0%) | 6 (100.0%) |
| Health Diagnosing & Treating | 0 (0.0%) | 2 (100.0%) |
| Health Technologists | 0 (0.0%) | 1 (100.0%) |
| Total (Category) | 23 (47.9%) | 25 (52.1%) |
| Total (Overall) | 81 (51.9%) | 75 (48.1%) |
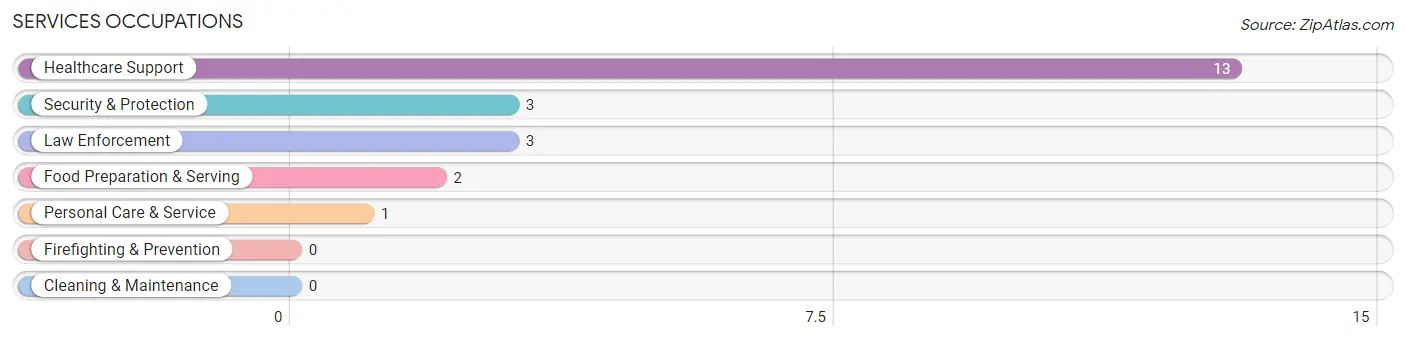
Services Occupations
The most common Services occupations in Alberta are Healthcare Support (13 | 8.3%), Security & Protection (3 | 1.9%), Law Enforcement (3 | 1.9%), Food Preparation & Serving (2 | 1.3%), and Personal Care & Service (1 | 0.6%).
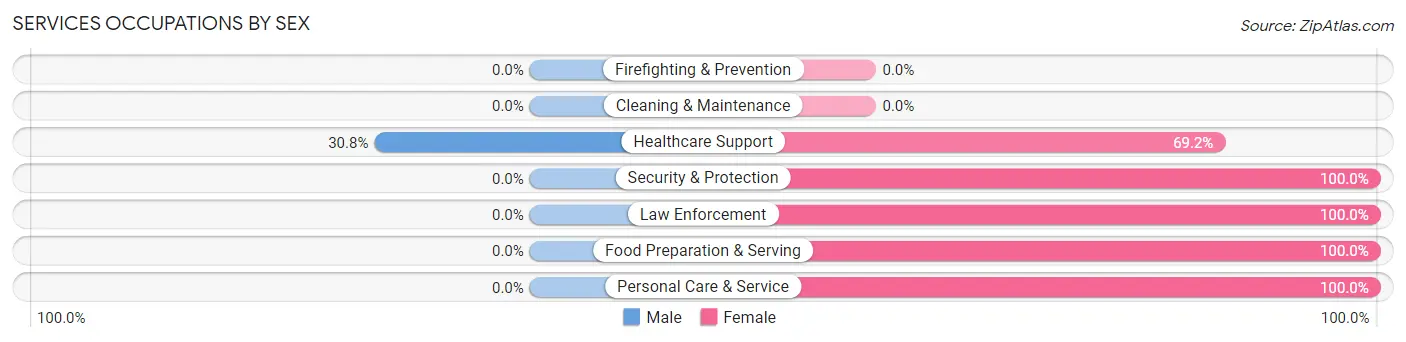
Services Occupations by Sex
| Occupation | Male | Female |
| Healthcare Support | 4 (30.8%) | 9 (69.2%) |
| Security & Protection | 0 (0.0%) | 3 (100.0%) |
| Firefighting & Prevention | 0 (0.0%) | 0 (0.0%) |
| Law Enforcement | 0 (0.0%) | 3 (100.0%) |
| Food Preparation & Serving | 0 (0.0%) | 2 (100.0%) |
| Cleaning & Maintenance | 0 (0.0%) | 0 (0.0%) |
| Personal Care & Service | 0 (0.0%) | 1 (100.0%) |
| Total (Category) | 4 (21.0%) | 15 (78.9%) |
| Total (Overall) | 81 (51.9%) | 75 (48.1%) |
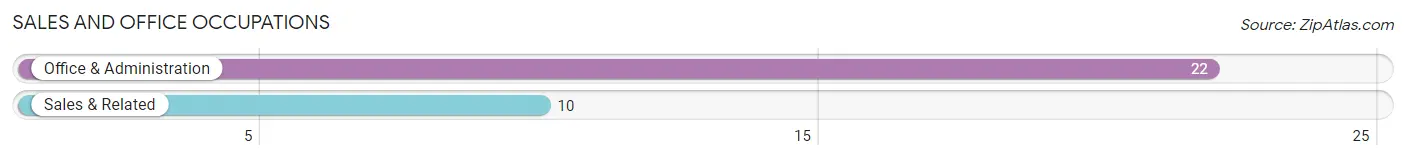
Sales and Office Occupations
The most common Sales and Office occupations in Alberta are Office & Administration (22 | 14.1%), and Sales & Related (10 | 6.4%).
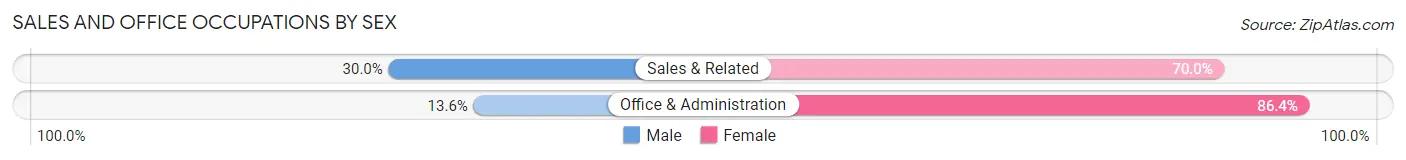
Sales and Office Occupations by Sex
| Occupation | Male | Female |
| Sales & Related | 3 (30.0%) | 7 (70.0%) |
| Office & Administration | 3 (13.6%) | 19 (86.4%) |
| Total (Category) | 6 (18.8%) | 26 (81.2%) |
| Total (Overall) | 81 (51.9%) | 75 (48.1%) |
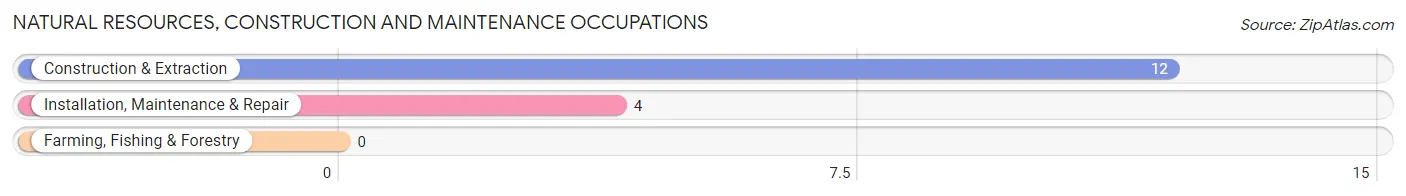
Natural Resources, Construction and Maintenance Occupations
The most common Natural Resources, Construction and Maintenance occupations in Alberta are Construction & Extraction (12 | 7.7%), and Installation, Maintenance & Repair (4 | 2.6%).
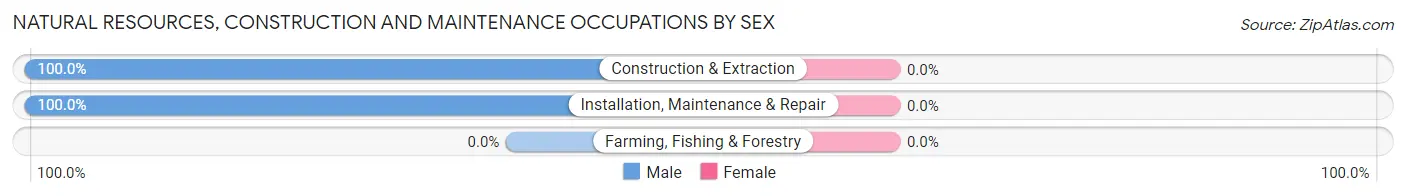
Natural Resources, Construction and Maintenance Occupations by Sex
| Occupation | Male | Female |
| Farming, Fishing & Forestry | 0 (0.0%) | 0 (0.0%) |
| Construction & Extraction | 12 (100.0%) | 0 (0.0%) |
| Installation, Maintenance & Repair | 4 (100.0%) | 0 (0.0%) |
| Total (Category) | 16 (100.0%) | 0 (0.0%) |
| Total (Overall) | 81 (51.9%) | 75 (48.1%) |
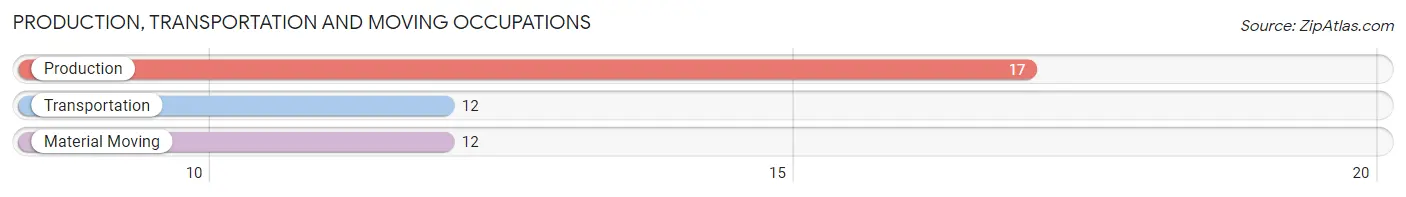
Production, Transportation and Moving Occupations
The most common Production, Transportation and Moving occupations in Alberta are Production (17 | 10.9%), Transportation (12 | 7.7%), and Material Moving (12 | 7.7%).
Production, Transportation and Moving Occupations by Sex
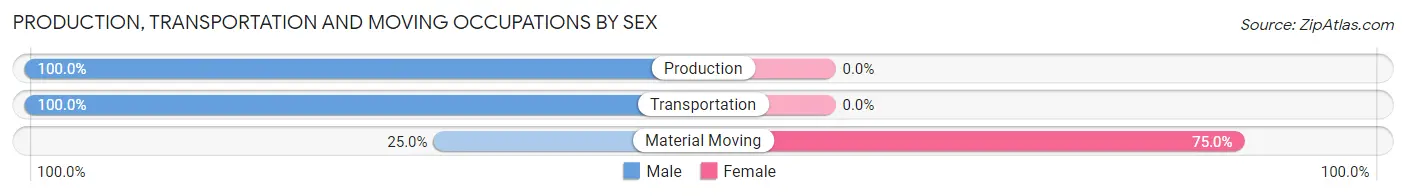
| Occupation | Male | Female |
| Production | 17 (100.0%) | 0 (0.0%) |
| Transportation | 12 (100.0%) | 0 (0.0%) |
| Material Moving | 3 (25.0%) | 9 (75.0%) |
| Total (Category) | 32 (78.0%) | 9 (22.0%) |
| Total (Overall) | 81 (51.9%) | 75 (48.1%) |
Employment Industries by Sex in Alberta
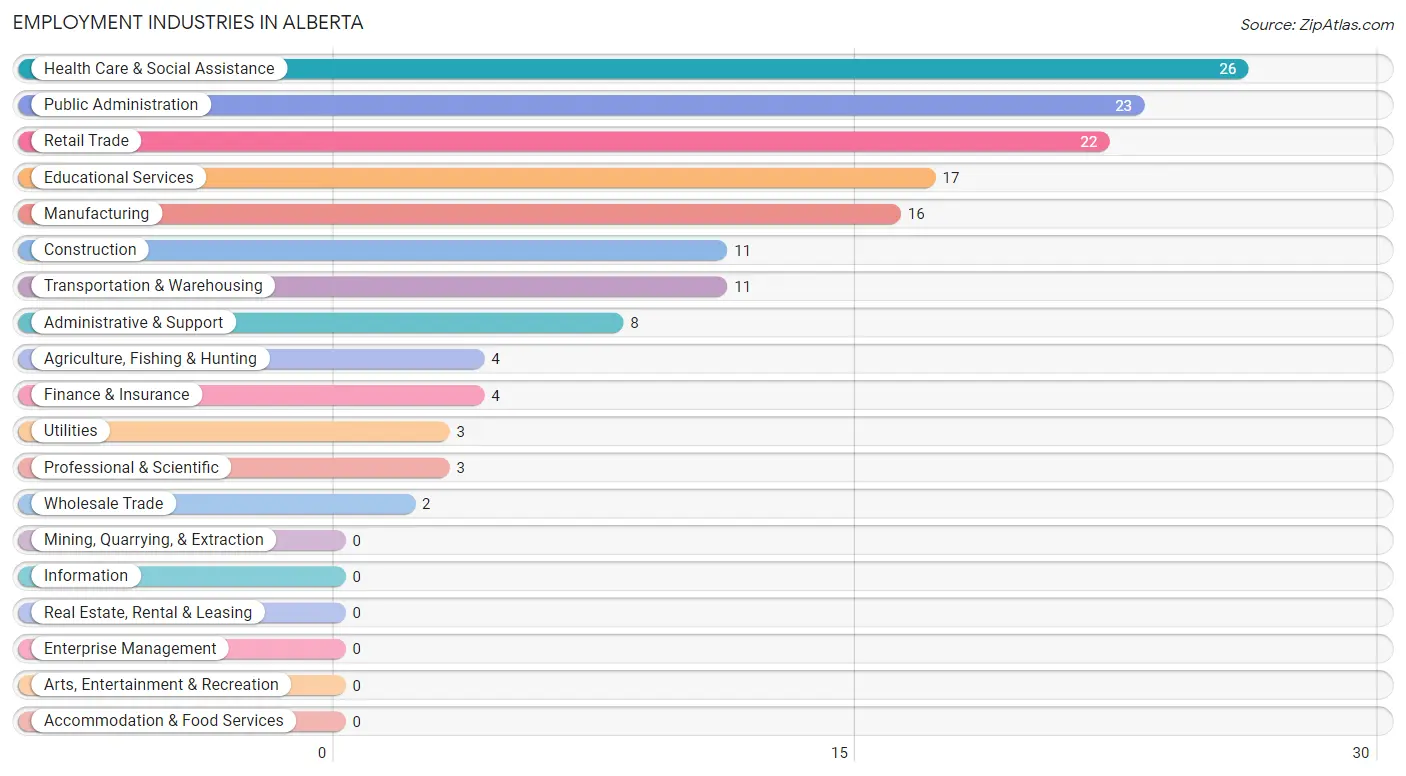
Employment Industries in Alberta
The major employment industries in Alberta include Health Care & Social Assistance (26 | 16.7%), Public Administration (23 | 14.7%), Retail Trade (22 | 14.1%), Educational Services (17 | 10.9%), and Manufacturing (16 | 10.3%).
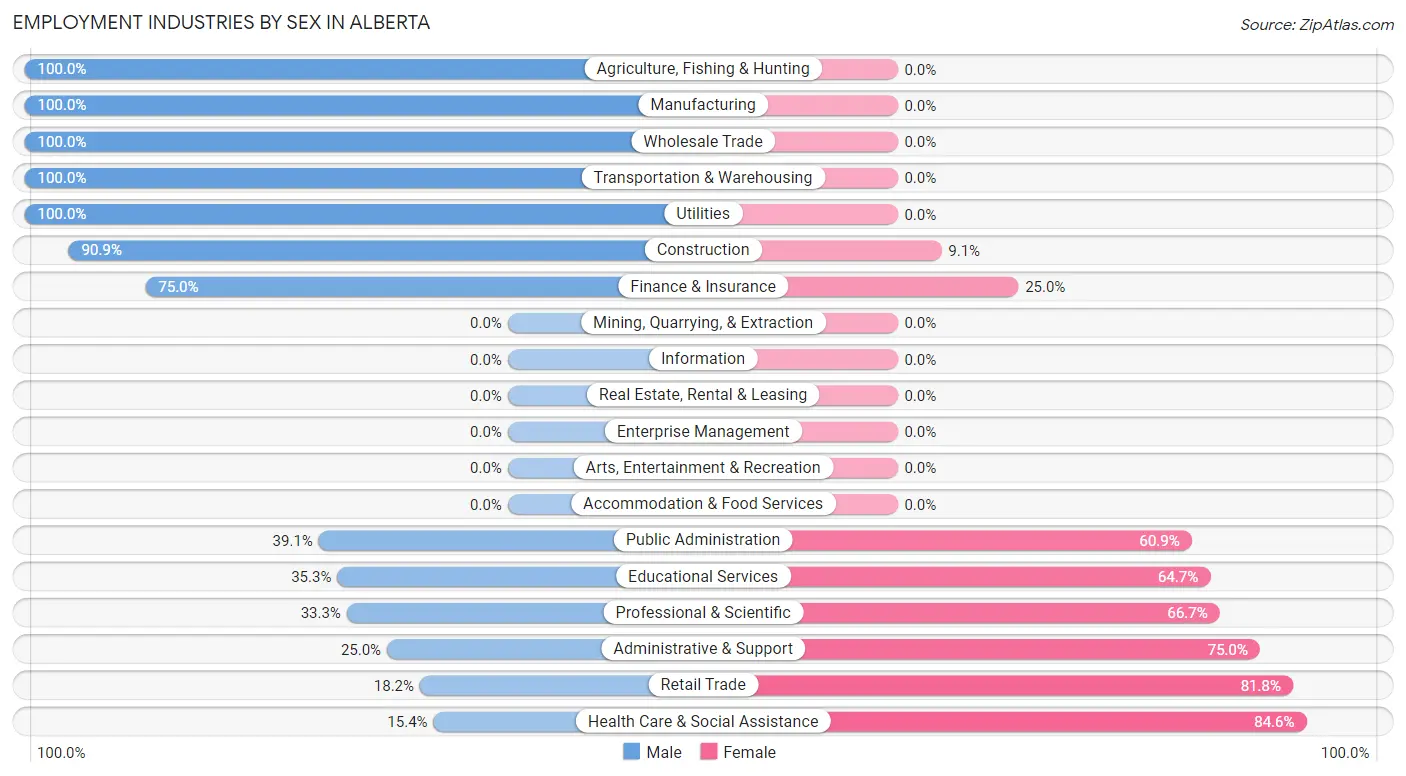
Employment Industries by Sex in Alberta
The Alberta industries that see more men than women are Agriculture, Fishing & Hunting (100.0%), Manufacturing (100.0%), and Wholesale Trade (100.0%), whereas the industries that tend to have a higher number of women are Health Care & Social Assistance (84.6%), Retail Trade (81.8%), and Administrative & Support (75.0%).
| Industry | Male | Female |
| Agriculture, Fishing & Hunting | 4 (100.0%) | 0 (0.0%) |
| Mining, Quarrying, & Extraction | 0 (0.0%) | 0 (0.0%) |
| Construction | 10 (90.9%) | 1 (9.1%) |
| Manufacturing | 16 (100.0%) | 0 (0.0%) |
| Wholesale Trade | 2 (100.0%) | 0 (0.0%) |
| Retail Trade | 4 (18.2%) | 18 (81.8%) |
| Transportation & Warehousing | 11 (100.0%) | 0 (0.0%) |
| Utilities | 3 (100.0%) | 0 (0.0%) |
| Information | 0 (0.0%) | 0 (0.0%) |
| Finance & Insurance | 3 (75.0%) | 1 (25.0%) |
| Real Estate, Rental & Leasing | 0 (0.0%) | 0 (0.0%) |
| Professional & Scientific | 1 (33.3%) | 2 (66.7%) |
| Enterprise Management | 0 (0.0%) | 0 (0.0%) |
| Administrative & Support | 2 (25.0%) | 6 (75.0%) |
| Educational Services | 6 (35.3%) | 11 (64.7%) |
| Health Care & Social Assistance | 4 (15.4%) | 22 (84.6%) |
| Arts, Entertainment & Recreation | 0 (0.0%) | 0 (0.0%) |
| Accommodation & Food Services | 0 (0.0%) | 0 (0.0%) |
| Public Administration | 9 (39.1%) | 14 (60.9%) |
| Total | 81 (51.9%) | 75 (48.1%) |
Education in Alberta
School Enrollment in Alberta
The most common levels of schooling among the 33 students in Alberta are high school (10 | 30.3%), elementary school (8 | 24.2%), and college / undergraduate (8 | 24.2%).
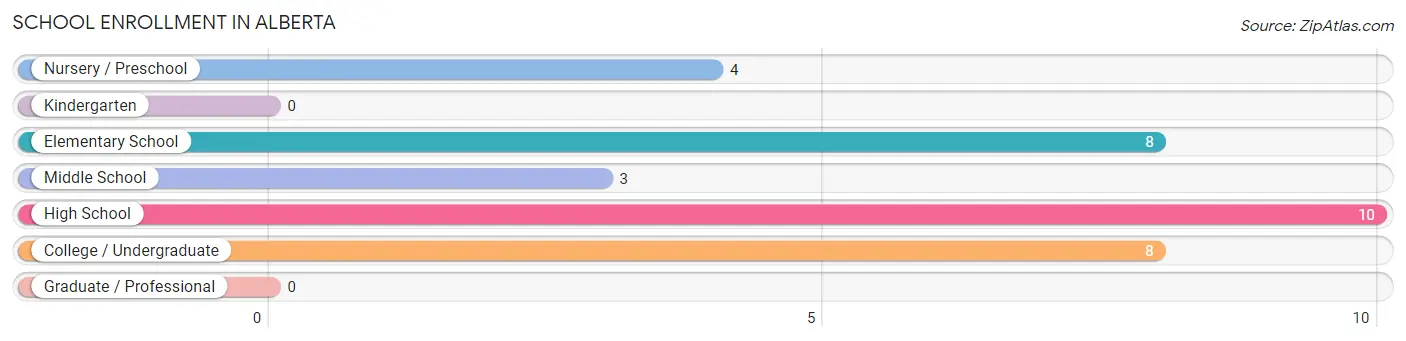
| School Level | # Students | % Students |
| Nursery / Preschool | 4 | 12.1% |
| Kindergarten | 0 | 0.0% |
| Elementary School | 8 | 24.2% |
| Middle School | 3 | 9.1% |
| High School | 10 | 30.3% |
| College / Undergraduate | 8 | 24.2% |
| Graduate / Professional | 0 | 0.0% |
| Total | 33 | 100.0% |
School Enrollment by Age by Funding Source in Alberta
Out of a total of 33 students who are enrolled in schools in Alberta, 3 (9.1%) attend a private institution, while the remaining 30 (90.9%) are enrolled in public schools. The age group of 35 years and over has the highest likelihood of being enrolled in private schools, with 3 (100.0% in the age bracket) enrolled. Conversely, the age group of 3 to 4 year olds has the lowest likelihood of being enrolled in a private school, with 4 (100.0% in the age bracket) attending a public institution.
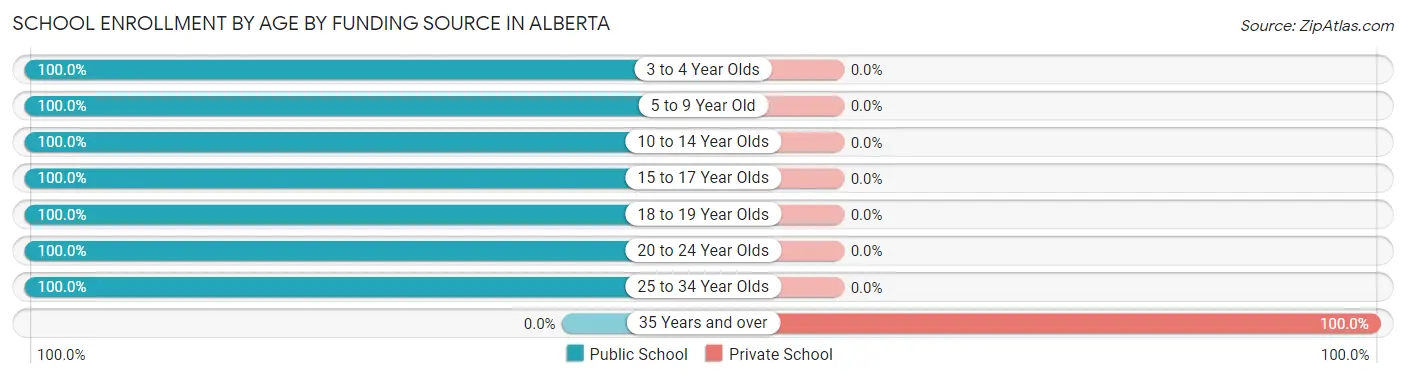
| Age Bracket | Public School | Private School |
| 3 to 4 Year Olds | 4 (100.0%) | 0 (0.0%) |
| 5 to 9 Year Old | 7 (100.0%) | 0 (0.0%) |
| 10 to 14 Year Olds | 4 (100.0%) | 0 (0.0%) |
| 15 to 17 Year Olds | 3 (100.0%) | 0 (0.0%) |
| 18 to 19 Year Olds | 3 (100.0%) | 0 (0.0%) |
| 20 to 24 Year Olds | 3 (100.0%) | 0 (0.0%) |
| 25 to 34 Year Olds | 6 (100.0%) | 0 (0.0%) |
| 35 Years and over | 0 (0.0%) | 3 (100.0%) |
| Total | 30 (90.9%) | 3 (9.1%) |
Educational Attainment by Field of Study in Alberta
Education (11 | 26.2%), business (9 | 21.4%), liberal arts & history (9 | 21.4%), arts & humanities (7 | 16.7%), and science & technology (3 | 7.1%) are the most common fields of study among 42 individuals in Alberta who have obtained a bachelor's degree or higher.
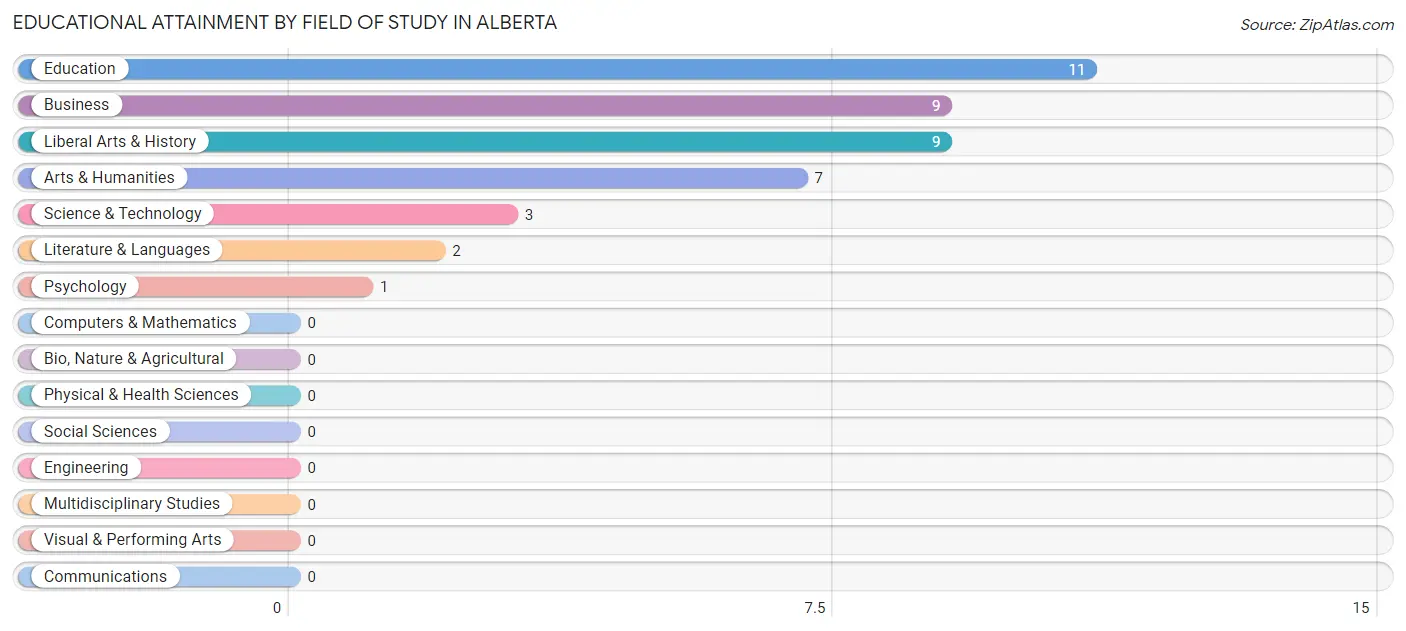
| Field of Study | # Graduates | % Graduates |
| Computers & Mathematics | 0 | 0.0% |
| Bio, Nature & Agricultural | 0 | 0.0% |
| Physical & Health Sciences | 0 | 0.0% |
| Psychology | 1 | 2.4% |
| Social Sciences | 0 | 0.0% |
| Engineering | 0 | 0.0% |
| Multidisciplinary Studies | 0 | 0.0% |
| Science & Technology | 3 | 7.1% |
| Business | 9 | 21.4% |
| Education | 11 | 26.2% |
| Literature & Languages | 2 | 4.8% |
| Liberal Arts & History | 9 | 21.4% |
| Visual & Performing Arts | 0 | 0.0% |
| Communications | 0 | 0.0% |
| Arts & Humanities | 7 | 16.7% |
| Total | 42 | 100.0% |
Transportation & Commute in Alberta
Vehicle Availability by Sex in Alberta
The most prevalent vehicle ownership categories in Alberta are males with 2 vehicles (37, accounting for 50.0%) and females with 2 vehicles (32, making up 49.3%).
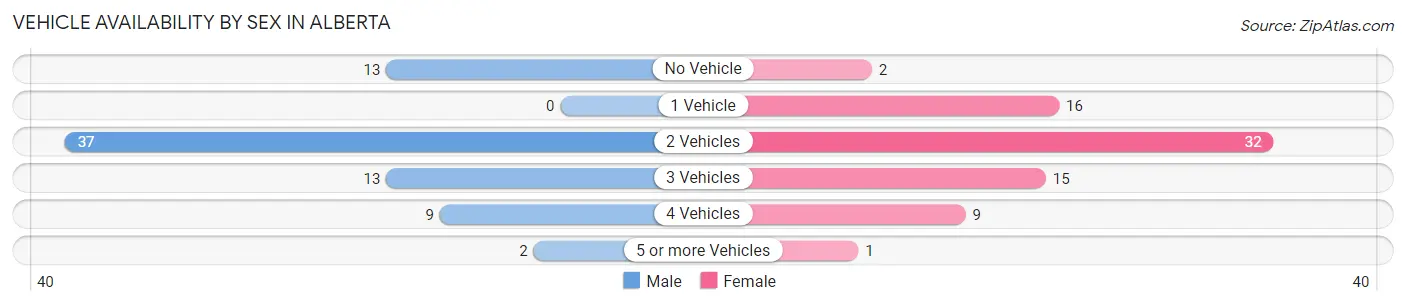
| Vehicles Available | Male | Female |
| No Vehicle | 13 (17.6%) | 2 (2.7%) |
| 1 Vehicle | 0 (0.0%) | 16 (21.3%) |
| 2 Vehicles | 37 (50.0%) | 32 (42.7%) |
| 3 Vehicles | 13 (17.6%) | 15 (20.0%) |
| 4 Vehicles | 9 (12.2%) | 9 (12.0%) |
| 5 or more Vehicles | 2 (2.7%) | 1 (1.3%) |
| Total | 74 (100.0%) | 75 (100.0%) |
Commute Time in Alberta
The most frequently occuring commute durations in Alberta are 30 to 34 minutes (27 commuters, 20.0%), 15 to 19 minutes (24 commuters, 17.8%), and 20 to 24 minutes (22 commuters, 16.3%).
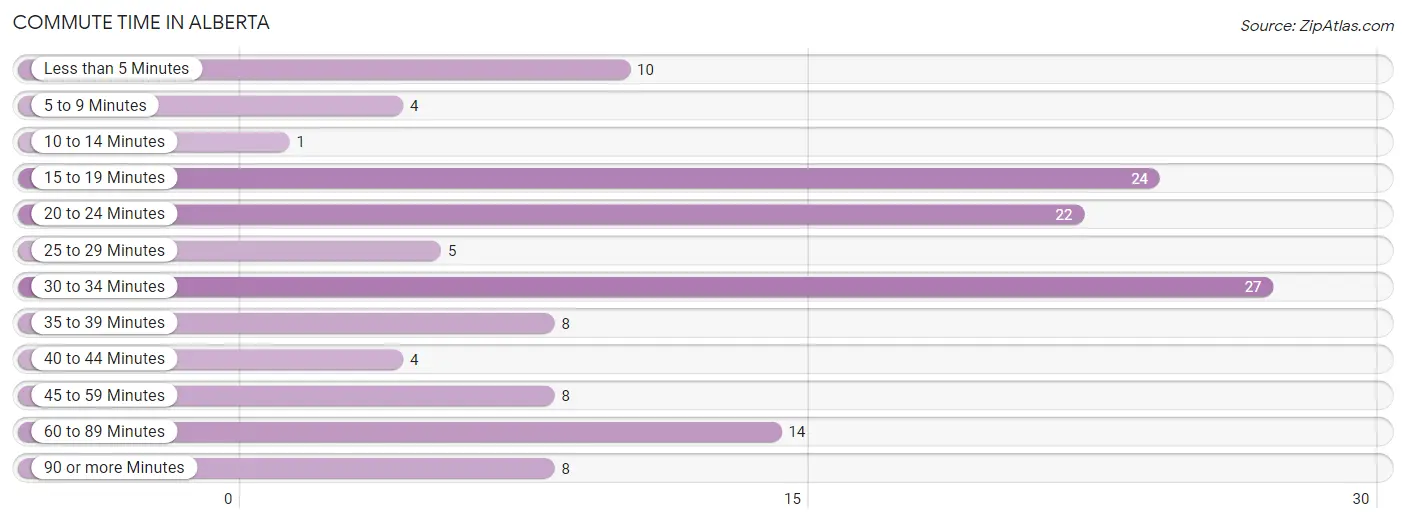
| Commute Time | # Commuters | % Commuters |
| Less than 5 Minutes | 10 | 7.4% |
| 5 to 9 Minutes | 4 | 3.0% |
| 10 to 14 Minutes | 1 | 0.7% |
| 15 to 19 Minutes | 24 | 17.8% |
| 20 to 24 Minutes | 22 | 16.3% |
| 25 to 29 Minutes | 5 | 3.7% |
| 30 to 34 Minutes | 27 | 20.0% |
| 35 to 39 Minutes | 8 | 5.9% |
| 40 to 44 Minutes | 4 | 3.0% |
| 45 to 59 Minutes | 8 | 5.9% |
| 60 to 89 Minutes | 14 | 10.4% |
| 90 or more Minutes | 8 | 5.9% |
Commute Time by Sex in Alberta
The most common commute times in Alberta are 20 to 24 minutes (15 commuters, 20.3%) for males and 30 to 34 minutes (24 commuters, 39.3%) for females.
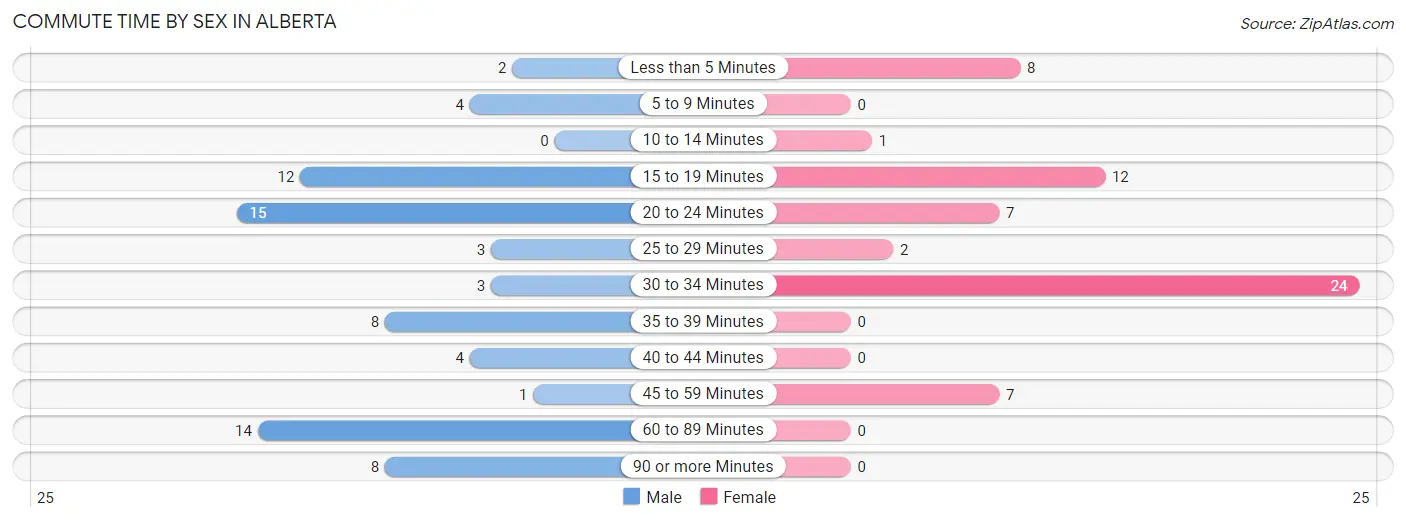
| Commute Time | Male | Female |
| Less than 5 Minutes | 2 (2.7%) | 8 (13.1%) |
| 5 to 9 Minutes | 4 (5.4%) | 0 (0.0%) |
| 10 to 14 Minutes | 0 (0.0%) | 1 (1.6%) |
| 15 to 19 Minutes | 12 (16.2%) | 12 (19.7%) |
| 20 to 24 Minutes | 15 (20.3%) | 7 (11.5%) |
| 25 to 29 Minutes | 3 (4.1%) | 2 (3.3%) |
| 30 to 34 Minutes | 3 (4.1%) | 24 (39.3%) |
| 35 to 39 Minutes | 8 (10.8%) | 0 (0.0%) |
| 40 to 44 Minutes | 4 (5.4%) | 0 (0.0%) |
| 45 to 59 Minutes | 1 (1.3%) | 7 (11.5%) |
| 60 to 89 Minutes | 14 (18.9%) | 0 (0.0%) |
| 90 or more Minutes | 8 (10.8%) | 0 (0.0%) |
Time of Departure to Work by Sex in Alberta
The most frequent times of departure to work in Alberta are 6:00 AM to 6:29 AM (15, 20.3%) for males and 7:00 AM to 7:29 AM (16, 26.2%) for females.
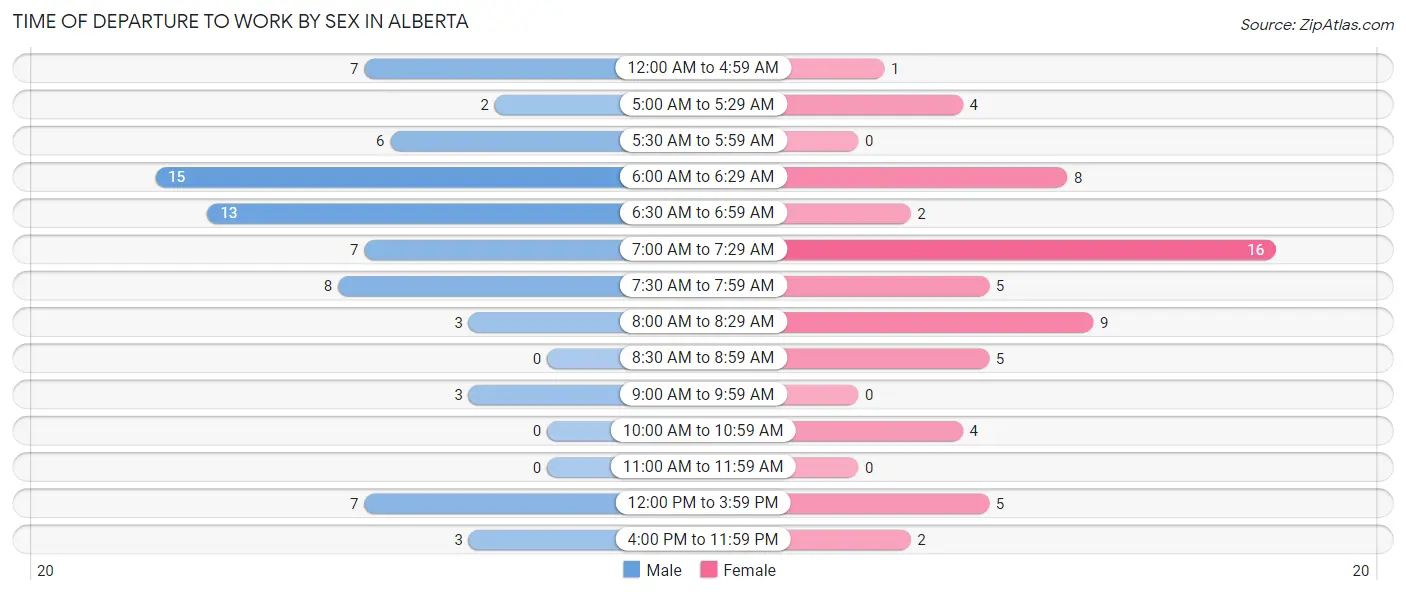
| Time of Departure | Male | Female |
| 12:00 AM to 4:59 AM | 7 (9.5%) | 1 (1.6%) |
| 5:00 AM to 5:29 AM | 2 (2.7%) | 4 (6.6%) |
| 5:30 AM to 5:59 AM | 6 (8.1%) | 0 (0.0%) |
| 6:00 AM to 6:29 AM | 15 (20.3%) | 8 (13.1%) |
| 6:30 AM to 6:59 AM | 13 (17.6%) | 2 (3.3%) |
| 7:00 AM to 7:29 AM | 7 (9.5%) | 16 (26.2%) |
| 7:30 AM to 7:59 AM | 8 (10.8%) | 5 (8.2%) |
| 8:00 AM to 8:29 AM | 3 (4.1%) | 9 (14.7%) |
| 8:30 AM to 8:59 AM | 0 (0.0%) | 5 (8.2%) |
| 9:00 AM to 9:59 AM | 3 (4.1%) | 0 (0.0%) |
| 10:00 AM to 10:59 AM | 0 (0.0%) | 4 (6.6%) |
| 11:00 AM to 11:59 AM | 0 (0.0%) | 0 (0.0%) |
| 12:00 PM to 3:59 PM | 7 (9.5%) | 5 (8.2%) |
| 4:00 PM to 11:59 PM | 3 (4.1%) | 2 (3.3%) |
| Total | 74 (100.0%) | 61 (100.0%) |
Housing Occupancy in Alberta
Occupancy by Ownership in Alberta
Of the total 149 dwellings in Alberta, owner-occupied units account for 96 (64.4%), while renter-occupied units make up 53 (35.6%).
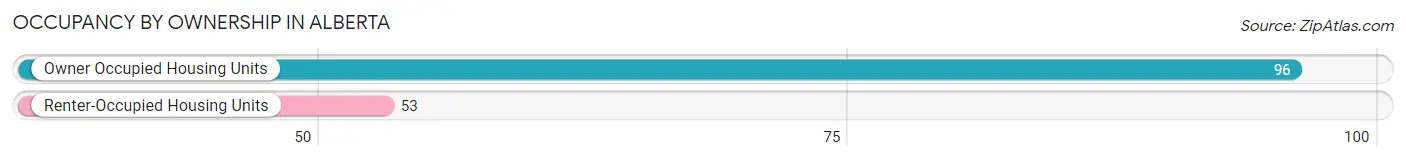
| Occupancy | # Housing Units | % Housing Units |
| Owner Occupied Housing Units | 96 | 64.4% |
| Renter-Occupied Housing Units | 53 | 35.6% |
| Total Occupied Housing Units | 149 | 100.0% |
Occupancy by Household Size in Alberta
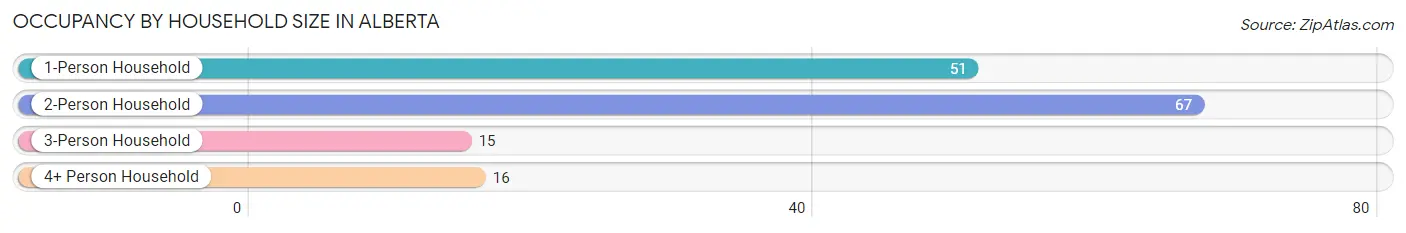
| Household Size | # Housing Units | % Housing Units |
| 1-Person Household | 51 | 34.2% |
| 2-Person Household | 67 | 45.0% |
| 3-Person Household | 15 | 10.1% |
| 4+ Person Household | 16 | 10.7% |
| Total Housing Units | 149 | 100.0% |
Occupancy by Ownership by Household Size in Alberta
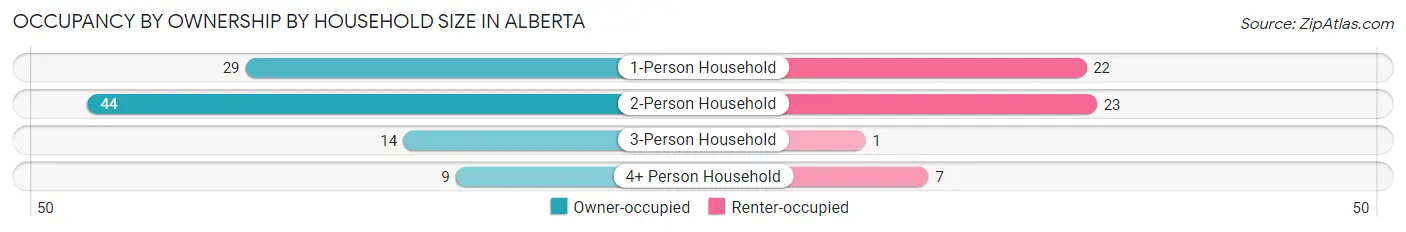
| Household Size | Owner-occupied | Renter-occupied |
| 1-Person Household | 29 (56.9%) | 22 (43.1%) |
| 2-Person Household | 44 (65.7%) | 23 (34.3%) |
| 3-Person Household | 14 (93.3%) | 1 (6.7%) |
| 4+ Person Household | 9 (56.2%) | 7 (43.8%) |
| Total Housing Units | 96 (64.4%) | 53 (35.6%) |
Occupancy by Educational Attainment in Alberta
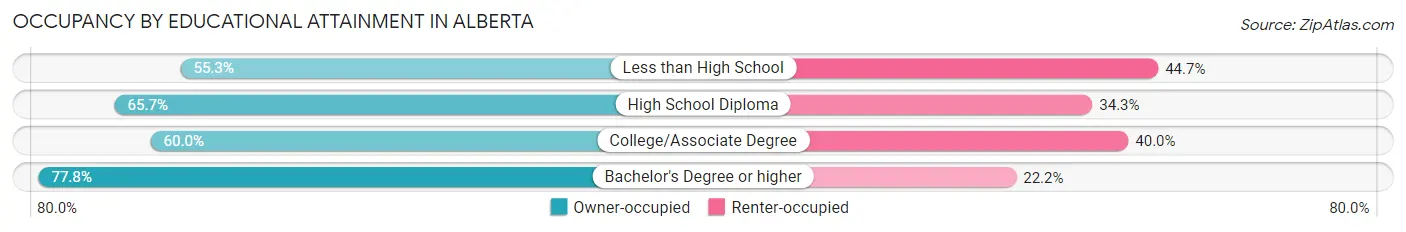
| Household Size | Owner-occupied | Renter-occupied |
| Less than High School | 21 (55.3%) | 17 (44.7%) |
| High School Diploma | 23 (65.7%) | 12 (34.3%) |
| College/Associate Degree | 24 (60.0%) | 16 (40.0%) |
| Bachelor's Degree or higher | 28 (77.8%) | 8 (22.2%) |
Occupancy by Age of Householder in Alberta
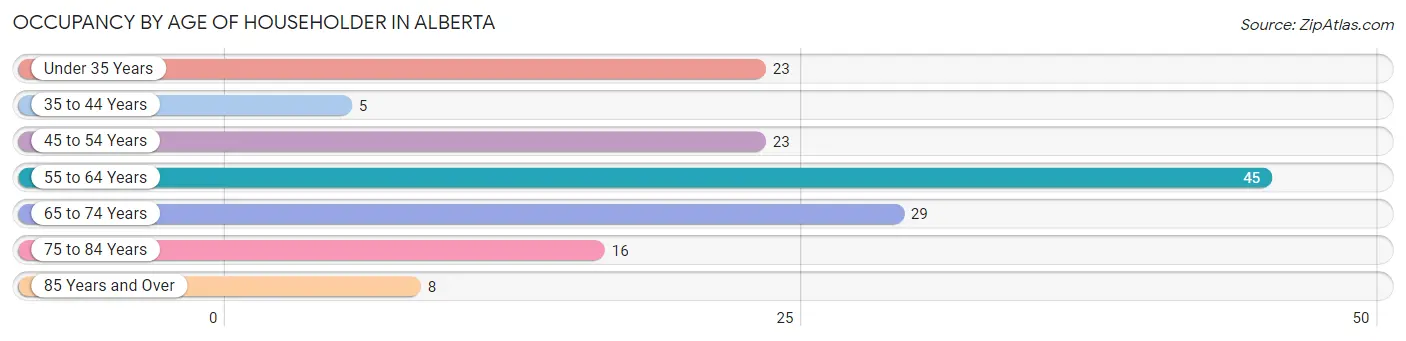
| Age Bracket | # Households | % Households |
| Under 35 Years | 23 | 15.4% |
| 35 to 44 Years | 5 | 3.4% |
| 45 to 54 Years | 23 | 15.4% |
| 55 to 64 Years | 45 | 30.2% |
| 65 to 74 Years | 29 | 19.5% |
| 75 to 84 Years | 16 | 10.7% |
| 85 Years and Over | 8 | 5.4% |
| Total | 149 | 100.0% |
Housing Finances in Alberta
Median Income by Occupancy in Alberta
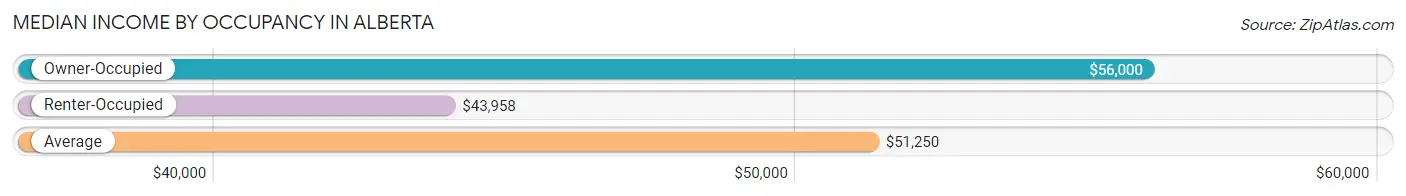
| Occupancy Type | # Households | Median Income |
| Owner-Occupied | 96 (64.4%) | $56,000 |
| Renter-Occupied | 53 (35.6%) | $43,958 |
| Average | 149 (100.0%) | $51,250 |
Occupancy by Householder Income Bracket in Alberta
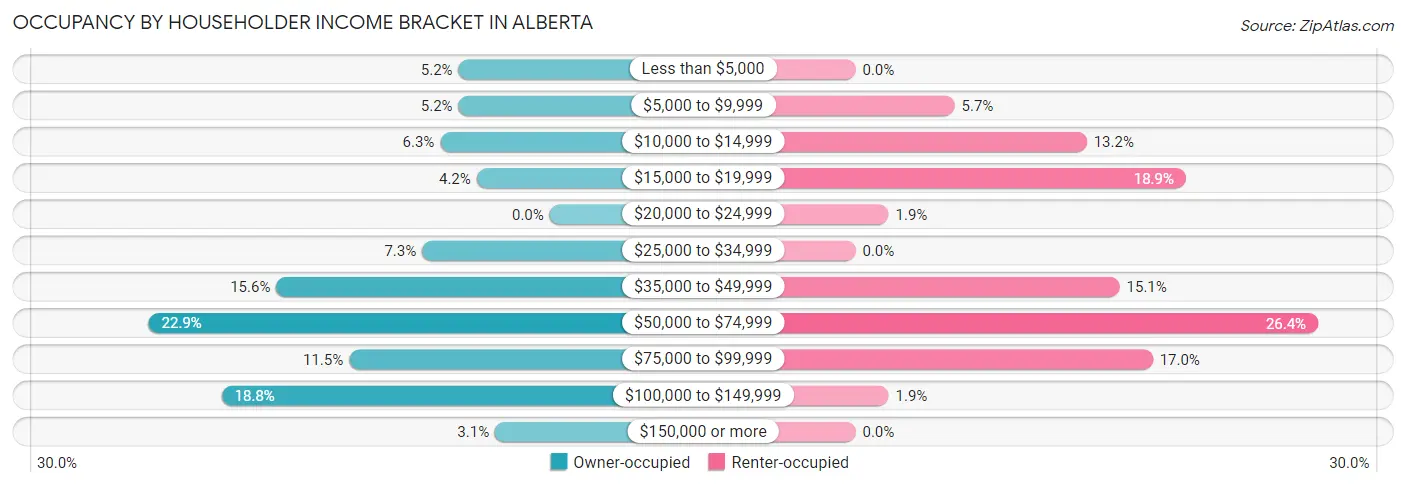
| Income Bracket | Owner-occupied | Renter-occupied |
| Less than $5,000 | 5 (5.2%) | 0 (0.0%) |
| $5,000 to $9,999 | 5 (5.2%) | 3 (5.7%) |
| $10,000 to $14,999 | 6 (6.2%) | 7 (13.2%) |
| $15,000 to $19,999 | 4 (4.2%) | 10 (18.9%) |
| $20,000 to $24,999 | 0 (0.0%) | 1 (1.9%) |
| $25,000 to $34,999 | 7 (7.3%) | 0 (0.0%) |
| $35,000 to $49,999 | 15 (15.6%) | 8 (15.1%) |
| $50,000 to $74,999 | 22 (22.9%) | 14 (26.4%) |
| $75,000 to $99,999 | 11 (11.5%) | 9 (17.0%) |
| $100,000 to $149,999 | 18 (18.8%) | 1 (1.9%) |
| $150,000 or more | 3 (3.1%) | 0 (0.0%) |
| Total | 96 (100.0%) | 53 (100.0%) |
Monthly Housing Cost Tiers in Alberta
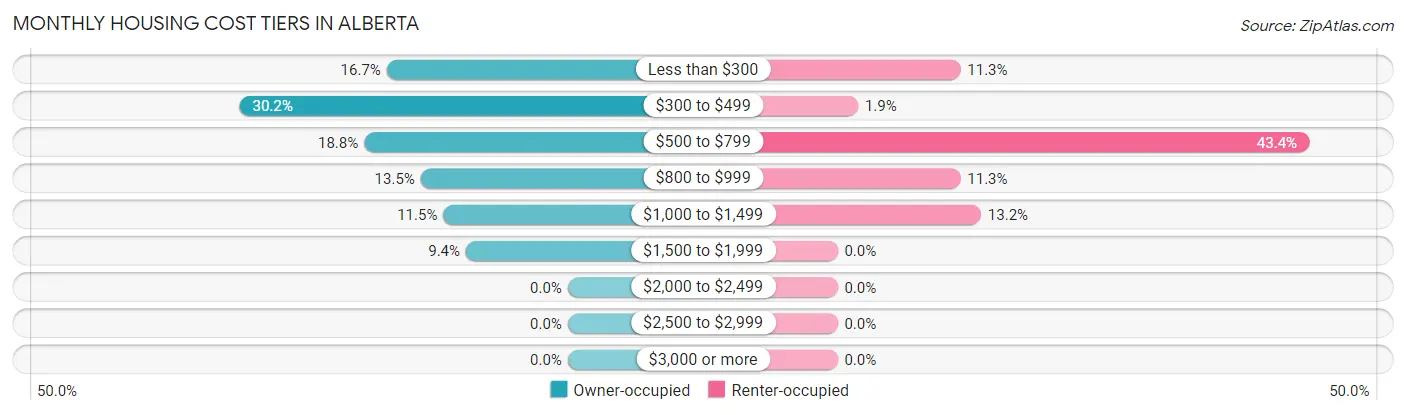
| Monthly Cost | Owner-occupied | Renter-occupied |
| Less than $300 | 16 (16.7%) | 6 (11.3%) |
| $300 to $499 | 29 (30.2%) | 1 (1.9%) |
| $500 to $799 | 18 (18.8%) | 23 (43.4%) |
| $800 to $999 | 13 (13.5%) | 6 (11.3%) |
| $1,000 to $1,499 | 11 (11.5%) | 7 (13.2%) |
| $1,500 to $1,999 | 9 (9.4%) | 0 (0.0%) |
| $2,000 to $2,499 | 0 (0.0%) | 0 (0.0%) |
| $2,500 to $2,999 | 0 (0.0%) | 0 (0.0%) |
| $3,000 or more | 0 (0.0%) | 0 (0.0%) |
| Total | 96 (100.0%) | 53 (100.0%) |
Physical Housing Characteristics in Alberta
Housing Structures in Alberta
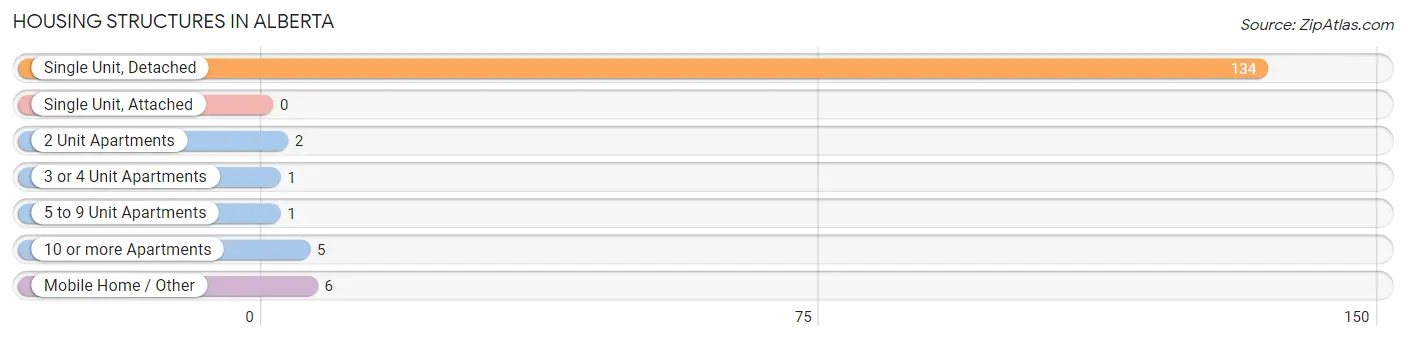
| Structure Type | # Housing Units | % Housing Units |
| Single Unit, Detached | 134 | 89.9% |
| Single Unit, Attached | 0 | 0.0% |
| 2 Unit Apartments | 2 | 1.3% |
| 3 or 4 Unit Apartments | 1 | 0.7% |
| 5 to 9 Unit Apartments | 1 | 0.7% |
| 10 or more Apartments | 5 | 3.4% |
| Mobile Home / Other | 6 | 4.0% |
| Total | 149 | 100.0% |
Housing Structures by Occupancy in Alberta
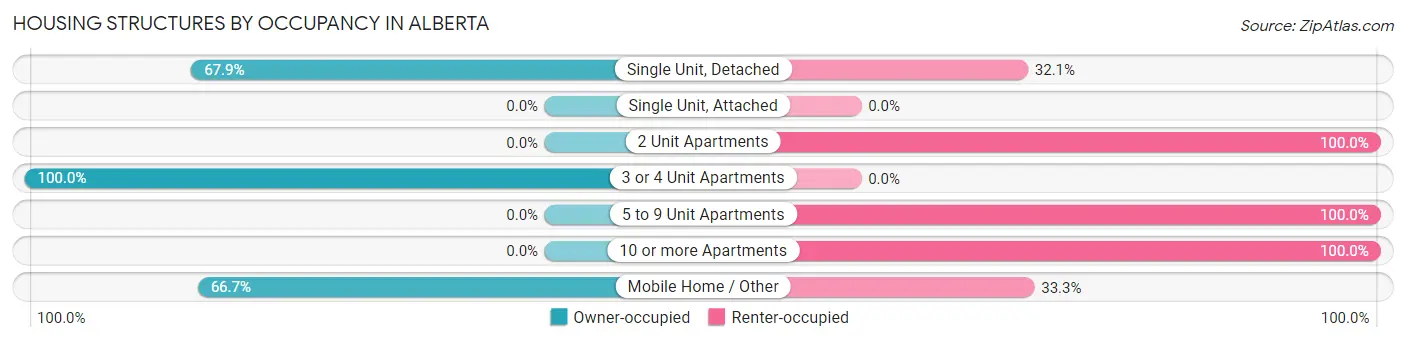
| Structure Type | Owner-occupied | Renter-occupied |
| Single Unit, Detached | 91 (67.9%) | 43 (32.1%) |
| Single Unit, Attached | 0 (0.0%) | 0 (0.0%) |
| 2 Unit Apartments | 0 (0.0%) | 2 (100.0%) |
| 3 or 4 Unit Apartments | 1 (100.0%) | 0 (0.0%) |
| 5 to 9 Unit Apartments | 0 (0.0%) | 1 (100.0%) |
| 10 or more Apartments | 0 (0.0%) | 5 (100.0%) |
| Mobile Home / Other | 4 (66.7%) | 2 (33.3%) |
| Total | 96 (64.4%) | 53 (35.6%) |
Housing Structures by Number of Rooms in Alberta
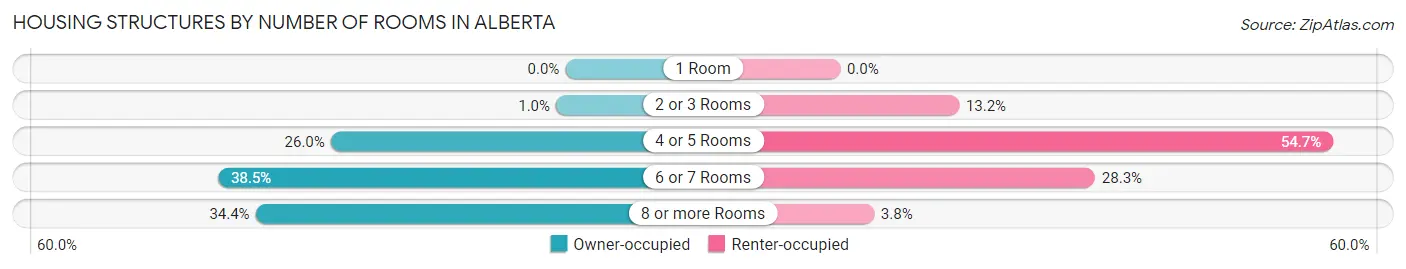
| Number of Rooms | Owner-occupied | Renter-occupied |
| 1 Room | 0 (0.0%) | 0 (0.0%) |
| 2 or 3 Rooms | 1 (1.0%) | 7 (13.2%) |
| 4 or 5 Rooms | 25 (26.0%) | 29 (54.7%) |
| 6 or 7 Rooms | 37 (38.5%) | 15 (28.3%) |
| 8 or more Rooms | 33 (34.4%) | 2 (3.8%) |
| Total | 96 (100.0%) | 53 (100.0%) |
Housing Structure by Heating Type in Alberta
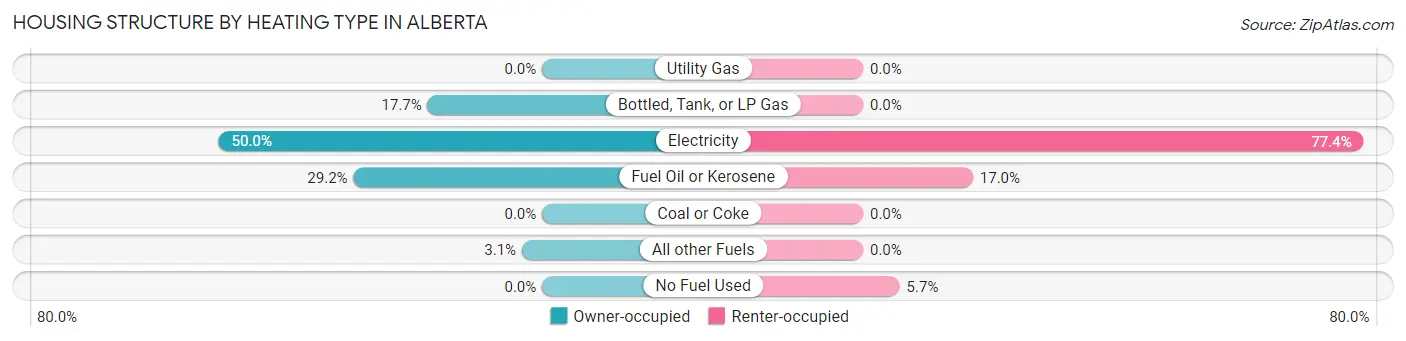
| Heating Type | Owner-occupied | Renter-occupied |
| Utility Gas | 0 (0.0%) | 0 (0.0%) |
| Bottled, Tank, or LP Gas | 17 (17.7%) | 0 (0.0%) |
| Electricity | 48 (50.0%) | 41 (77.4%) |
| Fuel Oil or Kerosene | 28 (29.2%) | 9 (17.0%) |
| Coal or Coke | 0 (0.0%) | 0 (0.0%) |
| All other Fuels | 3 (3.1%) | 0 (0.0%) |
| No Fuel Used | 0 (0.0%) | 3 (5.7%) |
| Total | 96 (100.0%) | 53 (100.0%) |
Household Vehicle Usage in Alberta
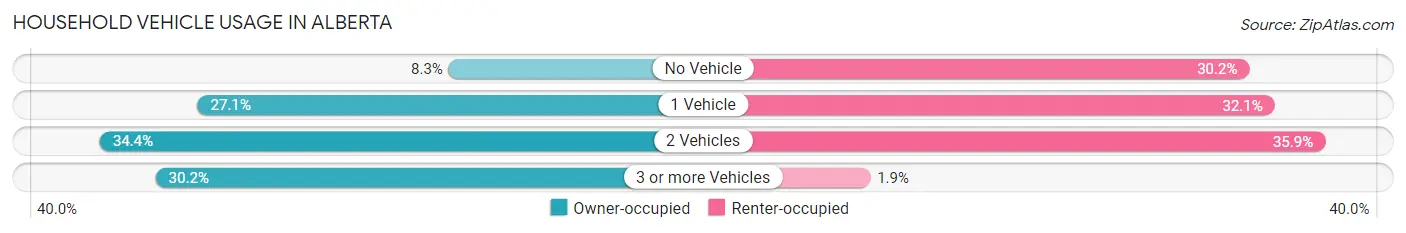
| Vehicles per Household | Owner-occupied | Renter-occupied |
| No Vehicle | 8 (8.3%) | 16 (30.2%) |
| 1 Vehicle | 26 (27.1%) | 17 (32.1%) |
| 2 Vehicles | 33 (34.4%) | 19 (35.8%) |
| 3 or more Vehicles | 29 (30.2%) | 1 (1.9%) |
| Total | 96 (100.0%) | 53 (100.0%) |
Real Estate & Mortgages in Alberta
Real Estate and Mortgage Overview in Alberta
| Characteristic | Without Mortgage | With Mortgage |
| Housing Units | 60 | 36 |
| Median Property Value | $94,000 | $133,300 |
| Median Household Income | $43,125 | $2 |
| Monthly Housing Costs | $375 | $0 |
| Real Estate Taxes | $522 | $3 |
Property Value by Mortgage Status in Alberta
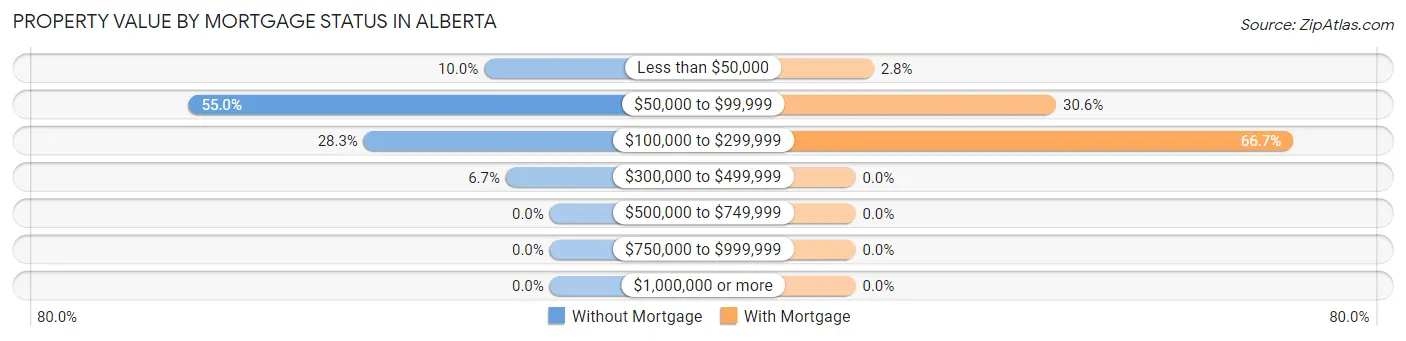
| Property Value | Without Mortgage | With Mortgage |
| Less than $50,000 | 6 (10.0%) | 1 (2.8%) |
| $50,000 to $99,999 | 33 (55.0%) | 11 (30.6%) |
| $100,000 to $299,999 | 17 (28.3%) | 24 (66.7%) |
| $300,000 to $499,999 | 4 (6.7%) | 0 (0.0%) |
| $500,000 to $749,999 | 0 (0.0%) | 0 (0.0%) |
| $750,000 to $999,999 | 0 (0.0%) | 0 (0.0%) |
| $1,000,000 or more | 0 (0.0%) | 0 (0.0%) |
| Total | 60 (100.0%) | 36 (100.0%) |
Household Income by Mortgage Status in Alberta
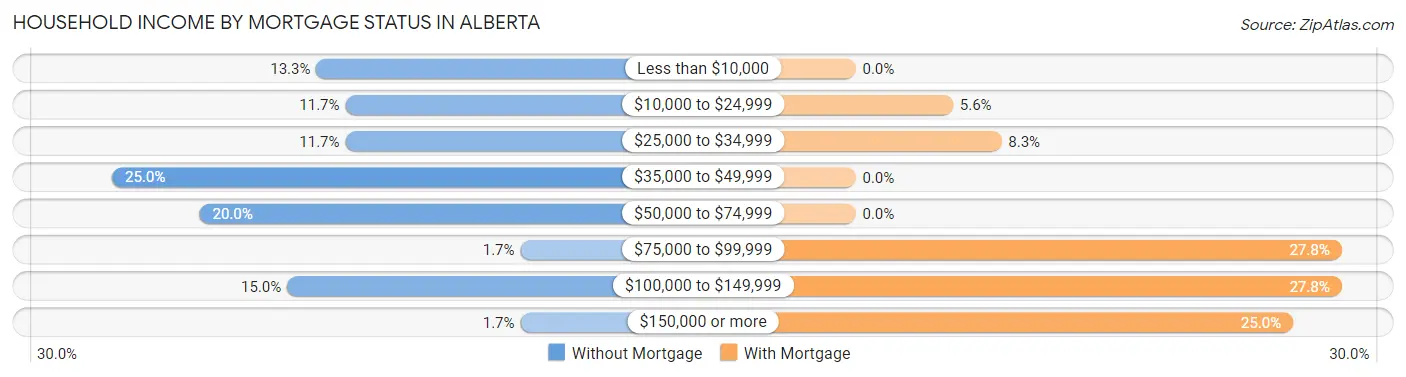
| Household Income | Without Mortgage | With Mortgage |
| Less than $10,000 | 8 (13.3%) | 0 (0.0%) |
| $10,000 to $24,999 | 7 (11.7%) | 2 (5.6%) |
| $25,000 to $34,999 | 7 (11.7%) | 3 (8.3%) |
| $35,000 to $49,999 | 15 (25.0%) | 0 (0.0%) |
| $50,000 to $74,999 | 12 (20.0%) | 0 (0.0%) |
| $75,000 to $99,999 | 1 (1.7%) | 10 (27.8%) |
| $100,000 to $149,999 | 9 (15.0%) | 10 (27.8%) |
| $150,000 or more | 1 (1.7%) | 9 (25.0%) |
| Total | 60 (100.0%) | 36 (100.0%) |
Property Value to Household Income Ratio in Alberta
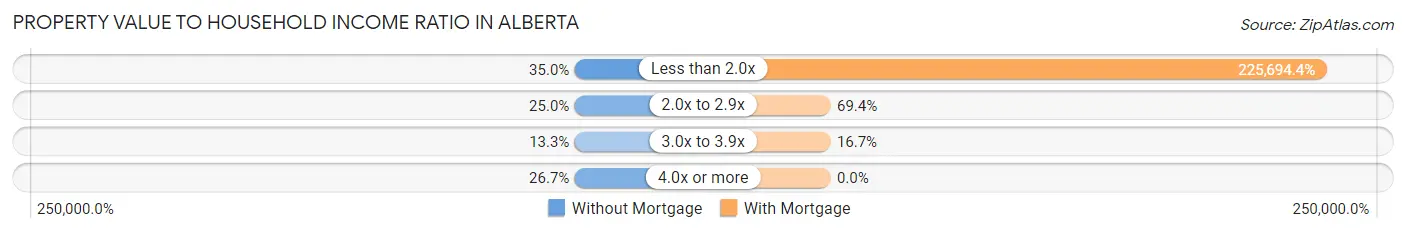
| Value-to-Income Ratio | Without Mortgage | With Mortgage |
| Less than 2.0x | 21 (35.0%) | 81,250 (225,694.4%) |
| 2.0x to 2.9x | 15 (25.0%) | 25 (69.4%) |
| 3.0x to 3.9x | 8 (13.3%) | 6 (16.7%) |
| 4.0x or more | 16 (26.7%) | 0 (0.0%) |
| Total | 60 (100.0%) | 36 (100.0%) |
Real Estate Taxes by Mortgage Status in Alberta
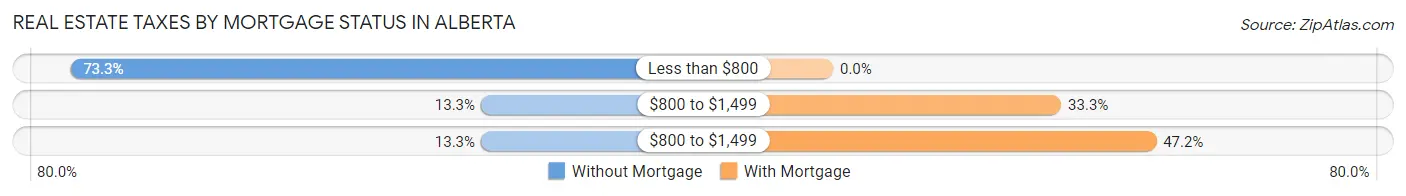
| Property Taxes | Without Mortgage | With Mortgage |
| Less than $800 | 44 (73.3%) | 0 (0.0%) |
| $800 to $1,499 | 8 (13.3%) | 12 (33.3%) |
| $800 to $1,499 | 8 (13.3%) | 17 (47.2%) |
| Total | 60 (100.0%) | 36 (100.0%) |
Health & Disability in Alberta
Health Insurance Coverage by Age in Alberta
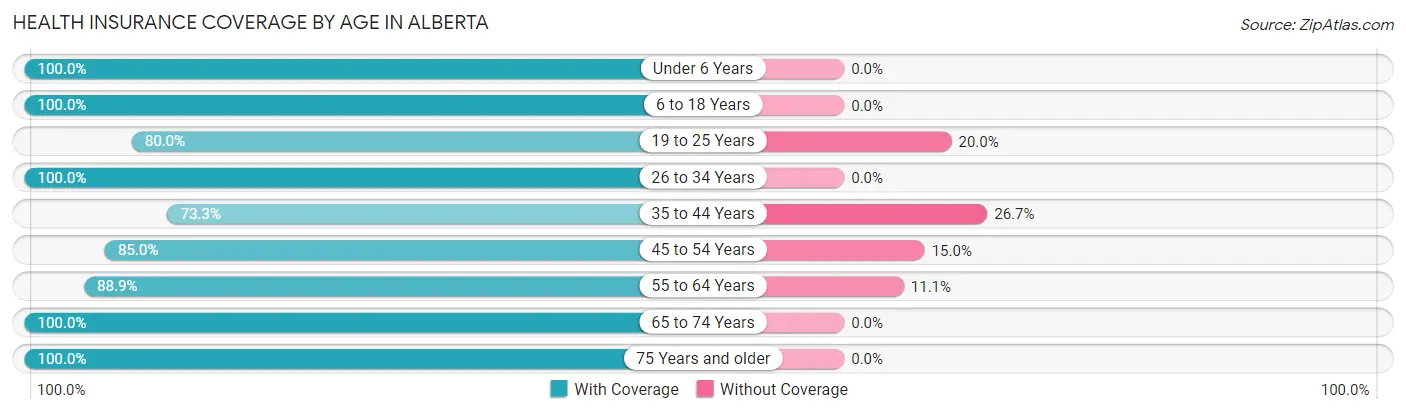
| Age Bracket | With Coverage | Without Coverage |
| Under 6 Years | 15 (100.0%) | 0 (0.0%) |
| 6 to 18 Years | 17 (100.0%) | 0 (0.0%) |
| 19 to 25 Years | 20 (80.0%) | 5 (20.0%) |
| 26 to 34 Years | 36 (100.0%) | 0 (0.0%) |
| 35 to 44 Years | 11 (73.3%) | 4 (26.7%) |
| 45 to 54 Years | 34 (85.0%) | 6 (15.0%) |
| 55 to 64 Years | 56 (88.9%) | 7 (11.1%) |
| 65 to 74 Years | 49 (100.0%) | 0 (0.0%) |
| 75 Years and older | 37 (100.0%) | 0 (0.0%) |
| Total | 275 (92.6%) | 22 (7.4%) |
Health Insurance Coverage by Citizenship Status in Alberta
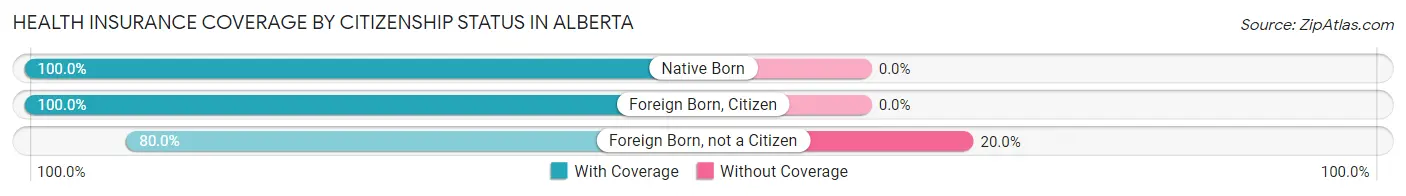
| Citizenship Status | With Coverage | Without Coverage |
| Native Born | 15 (100.0%) | 0 (0.0%) |
| Foreign Born, Citizen | 17 (100.0%) | 0 (0.0%) |
| Foreign Born, not a Citizen | 20 (80.0%) | 5 (20.0%) |
Health Insurance Coverage by Household Income in Alberta
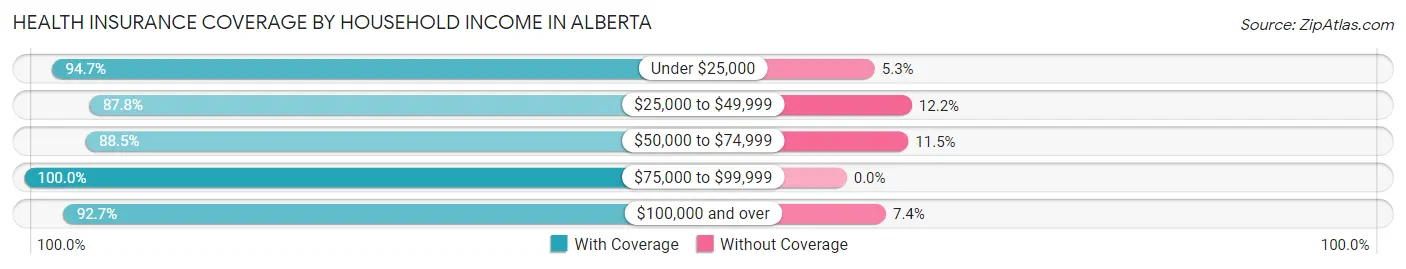
| Household Income | With Coverage | Without Coverage |
| Under $25,000 | 54 (94.7%) | 3 (5.3%) |
| $25,000 to $49,999 | 36 (87.8%) | 5 (12.2%) |
| $50,000 to $74,999 | 69 (88.5%) | 9 (11.5%) |
| $75,000 to $99,999 | 53 (100.0%) | 0 (0.0%) |
| $100,000 and over | 63 (92.6%) | 5 (7.3%) |
Public vs Private Health Insurance Coverage by Age in Alberta
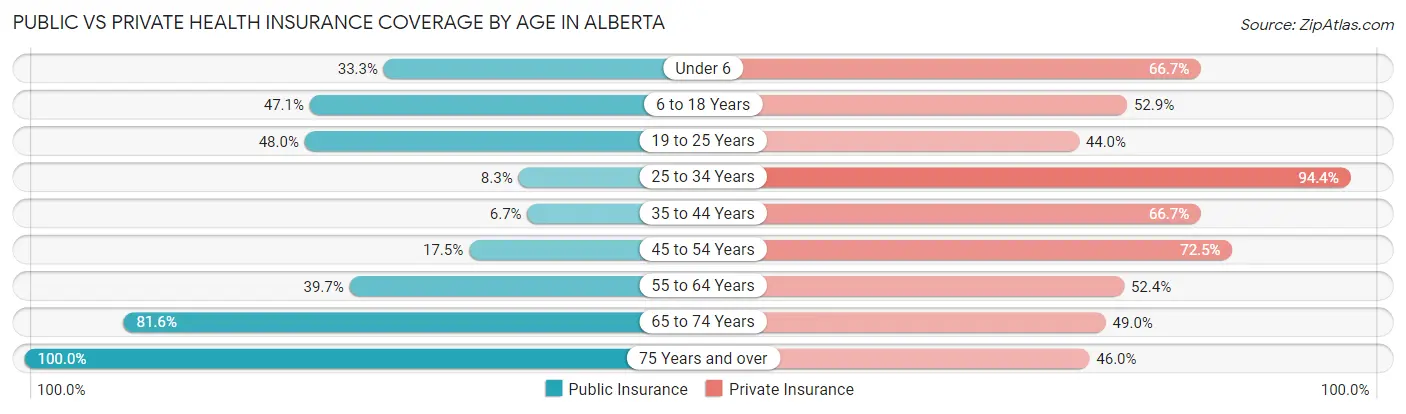
| Age Bracket | Public Insurance | Private Insurance |
| Under 6 | 5 (33.3%) | 10 (66.7%) |
| 6 to 18 Years | 8 (47.1%) | 9 (52.9%) |
| 19 to 25 Years | 12 (48.0%) | 11 (44.0%) |
| 25 to 34 Years | 3 (8.3%) | 34 (94.4%) |
| 35 to 44 Years | 1 (6.7%) | 10 (66.7%) |
| 45 to 54 Years | 7 (17.5%) | 29 (72.5%) |
| 55 to 64 Years | 25 (39.7%) | 33 (52.4%) |
| 65 to 74 Years | 40 (81.6%) | 24 (49.0%) |
| 75 Years and over | 37 (100.0%) | 17 (46.0%) |
| Total | 138 (46.5%) | 177 (59.6%) |
Disability Status by Sex by Age in Alberta
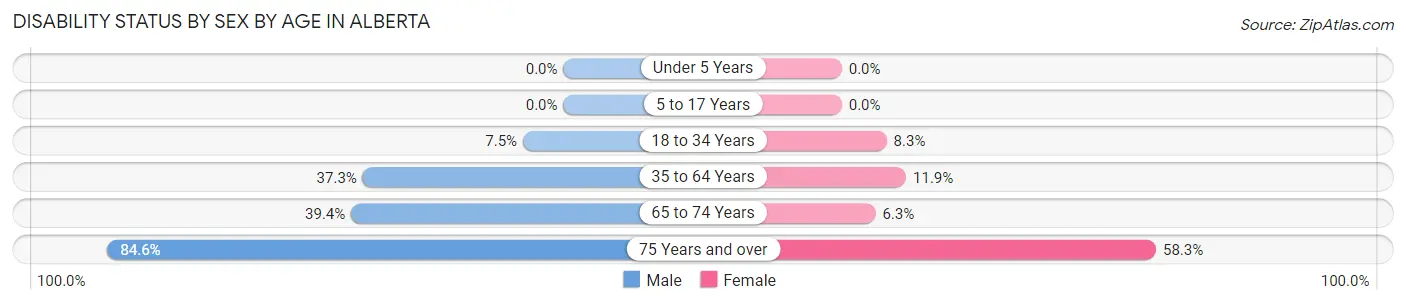
| Age Bracket | Male | Female |
| Under 5 Years | 0 (0.0%) | 0 (0.0%) |
| 5 to 17 Years | 0 (0.0%) | 0 (0.0%) |
| 18 to 34 Years | 3 (7.5%) | 2 (8.3%) |
| 35 to 64 Years | 19 (37.2%) | 8 (11.9%) |
| 65 to 74 Years | 13 (39.4%) | 1 (6.2%) |
| 75 Years and over | 11 (84.6%) | 14 (58.3%) |
Disability Class by Sex by Age in Alberta
Disability Class: Hearing Difficulty
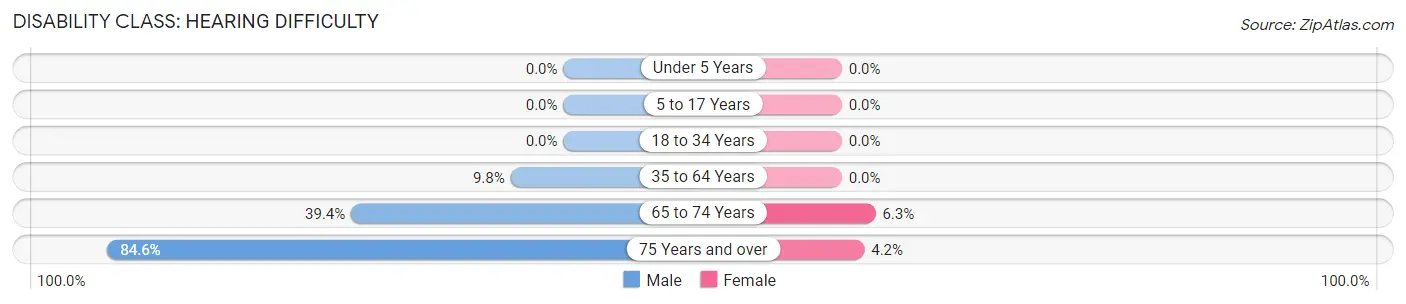
| Age Bracket | Male | Female |
| Under 5 Years | 0 (0.0%) | 0 (0.0%) |
| 5 to 17 Years | 0 (0.0%) | 0 (0.0%) |
| 18 to 34 Years | 0 (0.0%) | 0 (0.0%) |
| 35 to 64 Years | 5 (9.8%) | 0 (0.0%) |
| 65 to 74 Years | 13 (39.4%) | 1 (6.2%) |
| 75 Years and over | 11 (84.6%) | 1 (4.2%) |
Disability Class: Vision Difficulty
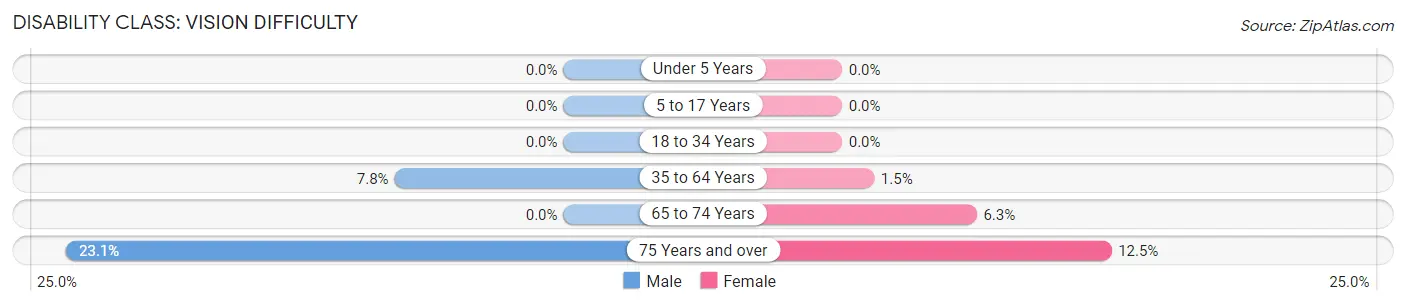
| Age Bracket | Male | Female |
| Under 5 Years | 0 (0.0%) | 0 (0.0%) |
| 5 to 17 Years | 0 (0.0%) | 0 (0.0%) |
| 18 to 34 Years | 0 (0.0%) | 0 (0.0%) |
| 35 to 64 Years | 4 (7.8%) | 1 (1.5%) |
| 65 to 74 Years | 0 (0.0%) | 1 (6.2%) |
| 75 Years and over | 3 (23.1%) | 3 (12.5%) |
Disability Class: Cognitive Difficulty
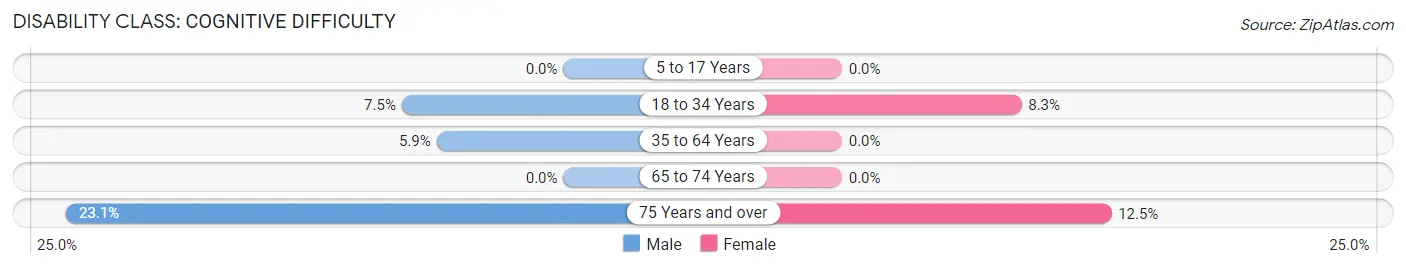
| Age Bracket | Male | Female |
| 5 to 17 Years | 0 (0.0%) | 0 (0.0%) |
| 18 to 34 Years | 3 (7.5%) | 2 (8.3%) |
| 35 to 64 Years | 3 (5.9%) | 0 (0.0%) |
| 65 to 74 Years | 0 (0.0%) | 0 (0.0%) |
| 75 Years and over | 3 (23.1%) | 3 (12.5%) |
Disability Class: Ambulatory Difficulty
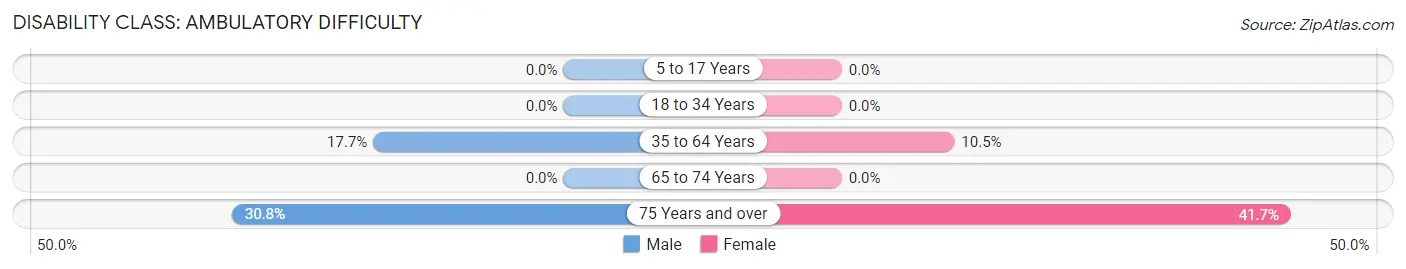
| Age Bracket | Male | Female |
| 5 to 17 Years | 0 (0.0%) | 0 (0.0%) |
| 18 to 34 Years | 0 (0.0%) | 0 (0.0%) |
| 35 to 64 Years | 9 (17.6%) | 7 (10.4%) |
| 65 to 74 Years | 0 (0.0%) | 0 (0.0%) |
| 75 Years and over | 4 (30.8%) | 10 (41.7%) |
Disability Class: Self-Care Difficulty
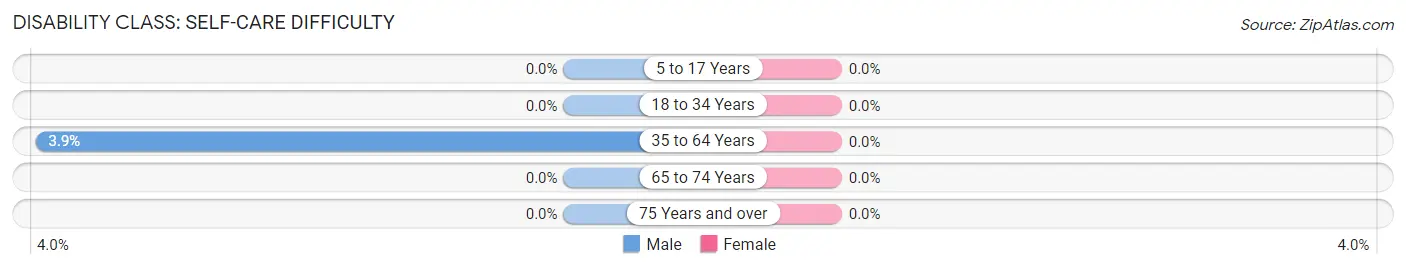
| Age Bracket | Male | Female |
| 5 to 17 Years | 0 (0.0%) | 0 (0.0%) |
| 18 to 34 Years | 0 (0.0%) | 0 (0.0%) |
| 35 to 64 Years | 2 (3.9%) | 0 (0.0%) |
| 65 to 74 Years | 0 (0.0%) | 0 (0.0%) |
| 75 Years and over | 0 (0.0%) | 0 (0.0%) |
Technology Access in Alberta
Computing Device Access in Alberta
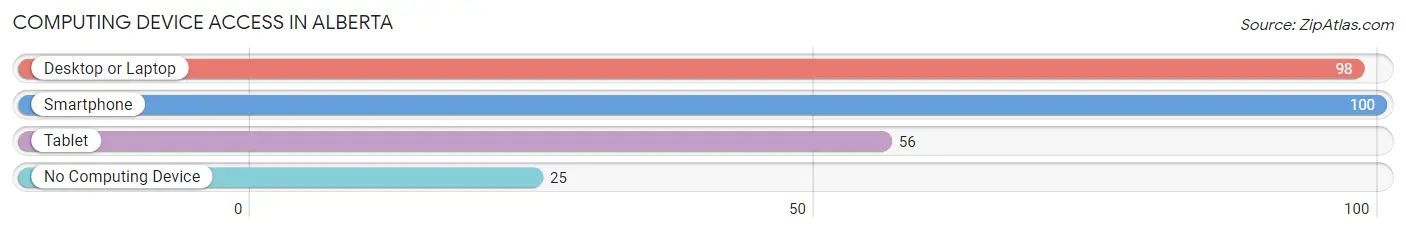
| Device Type | # Households | % Households |
| Desktop or Laptop | 98 | 65.8% |
| Smartphone | 100 | 67.1% |
| Tablet | 56 | 37.6% |
| No Computing Device | 25 | 16.8% |
| Total | 149 | 100.0% |
Internet Access in Alberta
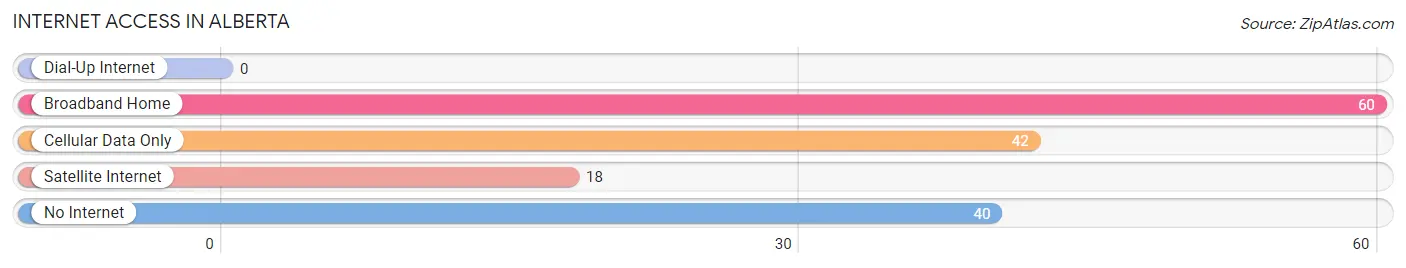
| Internet Type | # Households | % Households |
| Dial-Up Internet | 0 | 0.0% |
| Broadband Home | 60 | 40.3% |
| Cellular Data Only | 42 | 28.2% |
| Satellite Internet | 18 | 12.1% |
| No Internet | 40 | 26.9% |
| Total | 149 | 100.0% |
Alberta Summary
Alberta is a small town located in the state of Virginia in the United States. It is situated in the northern part of the state, in the Shenandoah Valley region. The town is located in Rockingham County, and is part of the Harrisonburg Metropolitan Statistical Area. As of the 2010 census, the population of Alberta was 1,845.
History
The town of Alberta was founded in 1854 by a group of settlers from Pennsylvania. The town was named after the daughter of one of the settlers, who was named Alberta. The town was originally a farming community, and the main crops grown were wheat, corn, and hay. The town also had a number of small businesses, including a general store, a blacksmith shop, and a sawmill.
In the late 19th century, the town began to grow and develop. The railroad was extended to Alberta in 1881, and this allowed for the town to become more connected to the outside world. The railroad also allowed for the transportation of goods and services to and from the town.
In the early 20th century, the town began to experience a period of growth and prosperity. The population of Alberta increased from 1,000 in 1900 to 1,500 in 1920. During this time, the town was home to a number of businesses, including a bank, a hotel, a movie theater, and a number of stores.
Geography
Alberta is located in the northern part of the state of Virginia, in the Shenandoah Valley region. The town is situated in Rockingham County, and is part of the Harrisonburg Metropolitan Statistical Area. The town is located at the intersection of U.S. Route 11 and Virginia State Route 42.
The town is situated in a valley, and is surrounded by the Blue Ridge Mountains to the east and the Allegheny Mountains to the west. The town is located at an elevation of 1,000 feet above sea level. The climate in Alberta is humid subtropical, with hot, humid summers and mild winters.
Economy
The economy of Alberta is largely based on agriculture and tourism. The town is home to a number of farms, which produce a variety of crops, including wheat, corn, hay, and soybeans. The town is also home to a number of small businesses, including restaurants, stores, and other services.
The town is also a popular tourist destination, due to its proximity to the Shenandoah National Park and the Appalachian Trail. The town is home to a number of bed and breakfasts, as well as a number of outdoor activities, such as hiking, fishing, and camping.
Demographics
As of the 2010 census, the population of Alberta was 1,845. The population is largely white (94.3%), with a small percentage of African Americans (2.3%) and Hispanics (2.2%). The median household income in Alberta is $41,250, and the median age is 41.7 years. The town has a high rate of homeownership (77.2%), and the unemployment rate is 4.2%.
Common Questions
What is Per Capita Income in Alberta?
Per Capita income in Alberta is $30,327.
What is the Median Family Income in Alberta?
Median Family Income in Alberta is $67,143.
What is the Median Household income in Alberta?
Median Household Income in Alberta is $51,250.
What is Income or Wage Gap in Alberta?
Income or Wage Gap in Alberta is 4.0%.
Women in Alberta earn 96.0 cents for every dollar earned by a man.
What is Inequality or Gini Index in Alberta?
Inequality or Gini Index in Alberta is 0.39.
What is the Total Population of Alberta?
Total Population of Alberta is 297.
What is the Total Male Population of Alberta?
Total Male Population of Alberta is 155.
What is the Total Female Population of Alberta?
Total Female Population of Alberta is 142.
What is the Ratio of Males per 100 Females in Alberta?
There are 109.15 Males per 100 Females in Alberta.
What is the Ratio of Females per 100 Males in Alberta?
There are 91.61 Females per 100 Males in Alberta.
What is the Median Population Age in Alberta?
Median Population Age in Alberta is 55.2 Years.
What is the Average Family Size in Alberta
Average Family Size in Alberta is 2.5 People.
What is the Average Household Size in Alberta
Average Household Size in Alberta is 2.0 People.
How Large is the Labor Force in Alberta?
There are 163 People in the Labor Forcein in Alberta.
What is the Percentage of People in the Labor Force in Alberta?
60.1% of People are in the Labor Force in Alberta.
What is the Unemployment Rate in Alberta?
Unemployment Rate in Alberta is 4.3%.