Enon, VA Map & Demographics
Enon Map
Enon Overview
$42,237
PER CAPITA INCOME
$79,833
AVG FAMILY INCOME
$72,852
AVG HOUSEHOLD INCOME
34.0%
WAGE / INCOME GAP [ % ]
66.0¢/ $1
WAGE / INCOME GAP [ $ ]
$11,733
FAMILY INCOME DEFICIT
0.38
INEQUALITY / GINI INDEX
4,087
TOTAL POPULATION
2,148
MALE POPULATION
1,939
FEMALE POPULATION
110.78
MALES / 100 FEMALES
90.27
FEMALES / 100 MALES
39.9
MEDIAN AGE
3.2
AVG FAMILY SIZE
2.4
AVG HOUSEHOLD SIZE
2,065
LABOR FORCE [ PEOPLE ]
61.3%
PERCENT IN LABOR FORCE
4.1%
UNEMPLOYMENT RATE
Income in Enon
Income Overview in Enon
Per Capita Income in Enon is $42,237, while median incomes of families and households are $79,833 and $72,852 respectively.
| Characteristic | Number | Measure |
| Per Capita Income | 4,087 | $42,237 |
| Median Family Income | 946 | $79,833 |
| Mean Family Income | 946 | $118,166 |
| Median Household Income | 1,690 | $72,852 |
| Mean Household Income | 1,690 | $100,031 |
| Income Deficit | 946 | $11,733 |
| Wage / Income Gap (%) | 4,087 | 33.95% |
| Wage / Income Gap ($) | 4,087 | 66.05¢ per $1 |
| Gini / Inequality Index | 4,087 | 0.38 |
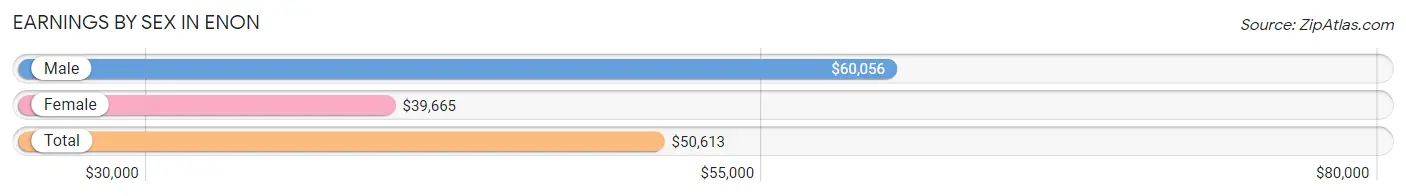
Earnings by Sex in Enon
Average Earnings in Enon are $50,613, $60,056 for men and $39,665 for women, a difference of 34.0%.
| Sex | Number | Average Earnings |
| Male | 1,162 (53.4%) | $60,056 |
| Female | 1,013 (46.6%) | $39,665 |
| Total | 2,175 (100.0%) | $50,613 |
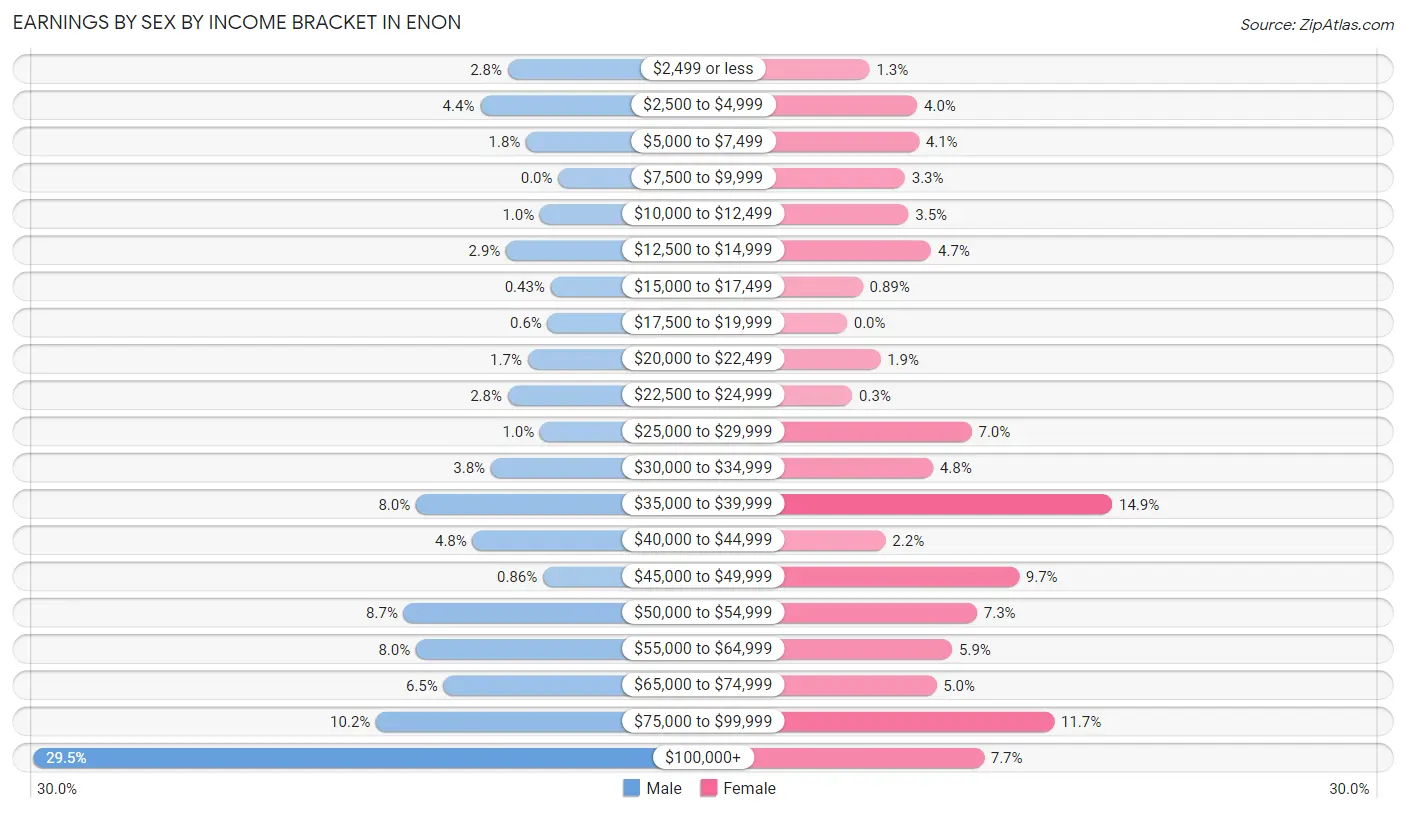
Earnings by Sex by Income Bracket in Enon
The most common earnings brackets in Enon are $100,000+ for men (343 | 29.5%) and $35,000 to $39,999 for women (151 | 14.9%).
| Income | Male | Female |
| $2,499 or less | 33 (2.8%) | 13 (1.3%) |
| $2,500 to $4,999 | 51 (4.4%) | 40 (4.0%) |
| $5,000 to $7,499 | 21 (1.8%) | 41 (4.1%) |
| $7,500 to $9,999 | 0 (0.0%) | 33 (3.3%) |
| $10,000 to $12,499 | 12 (1.0%) | 35 (3.5%) |
| $12,500 to $14,999 | 34 (2.9%) | 48 (4.7%) |
| $15,000 to $17,499 | 5 (0.4%) | 9 (0.9%) |
| $17,500 to $19,999 | 7 (0.6%) | 0 (0.0%) |
| $20,000 to $22,499 | 20 (1.7%) | 19 (1.9%) |
| $22,500 to $24,999 | 33 (2.8%) | 3 (0.3%) |
| $25,000 to $29,999 | 12 (1.0%) | 71 (7.0%) |
| $30,000 to $34,999 | 44 (3.8%) | 49 (4.8%) |
| $35,000 to $39,999 | 93 (8.0%) | 151 (14.9%) |
| $40,000 to $44,999 | 56 (4.8%) | 22 (2.2%) |
| $45,000 to $49,999 | 10 (0.9%) | 98 (9.7%) |
| $50,000 to $54,999 | 101 (8.7%) | 74 (7.3%) |
| $55,000 to $64,999 | 93 (8.0%) | 60 (5.9%) |
| $65,000 to $74,999 | 75 (6.5%) | 51 (5.0%) |
| $75,000 to $99,999 | 119 (10.2%) | 118 (11.7%) |
| $100,000+ | 343 (29.5%) | 78 (7.7%) |
| Total | 1,162 (100.0%) | 1,013 (100.0%) |
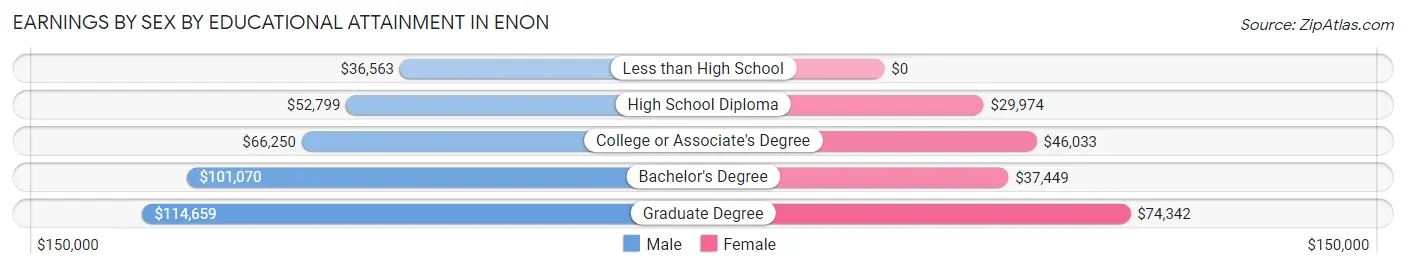
Earnings by Sex by Educational Attainment in Enon
Average earnings in Enon are $65,037 for men and $45,486 for women, a difference of 30.1%. Men with an educational attainment of graduate degree enjoy the highest average annual earnings of $114,659, while those with less than high school education earn the least with $36,563. Women with an educational attainment of graduate degree earn the most with the average annual earnings of $74,342, while those with high school diploma education have the smallest earnings of $29,974.
| Educational Attainment | Male Income | Female Income |
| Less than High School | $36,563 | $0 |
| High School Diploma | $52,799 | $29,974 |
| College or Associate's Degree | $66,250 | $46,033 |
| Bachelor's Degree | $101,070 | $37,449 |
| Graduate Degree | $114,659 | $74,342 |
| Total | $65,037 | $45,486 |
Family Income in Enon
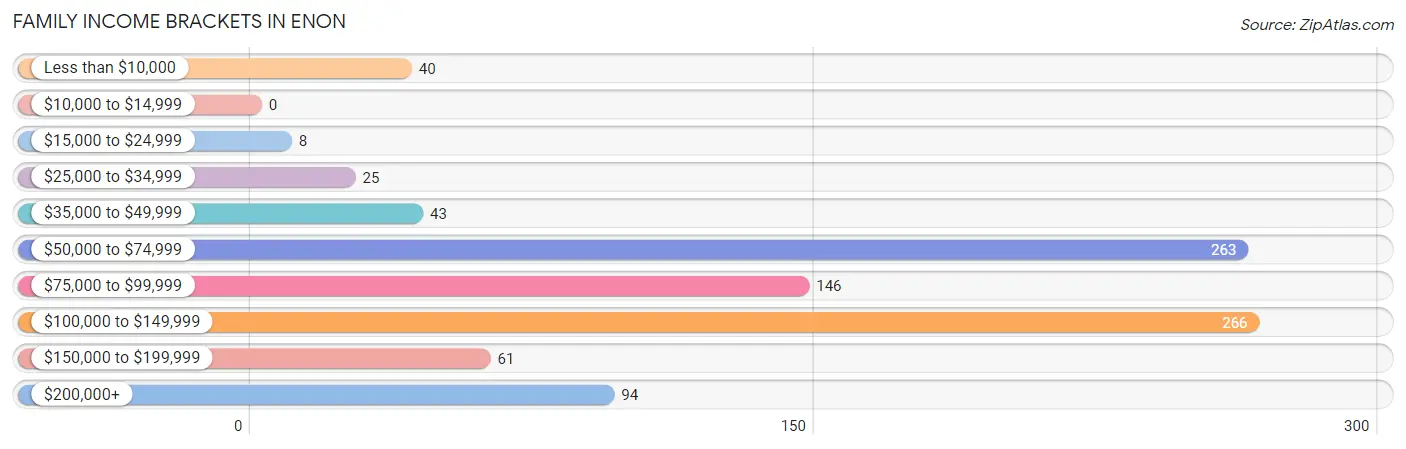
Family Income Brackets in Enon
According to the Enon family income data, there are 266 families falling into the $100,000 to $149,999 income range, which is the most common income bracket and makes up 28.1% of all families.
| Income Bracket | # Families | % Families |
| Less than $10,000 | 40 | 4.2% |
| $10,000 to $14,999 | 0 | 0.0% |
| $15,000 to $24,999 | 8 | 0.8% |
| $25,000 to $34,999 | 25 | 2.6% |
| $35,000 to $49,999 | 43 | 4.5% |
| $50,000 to $74,999 | 263 | 27.8% |
| $75,000 to $99,999 | 146 | 15.4% |
| $100,000 to $149,999 | 266 | 28.1% |
| $150,000 to $199,999 | 61 | 6.4% |
| $200,000+ | 94 | 9.9% |
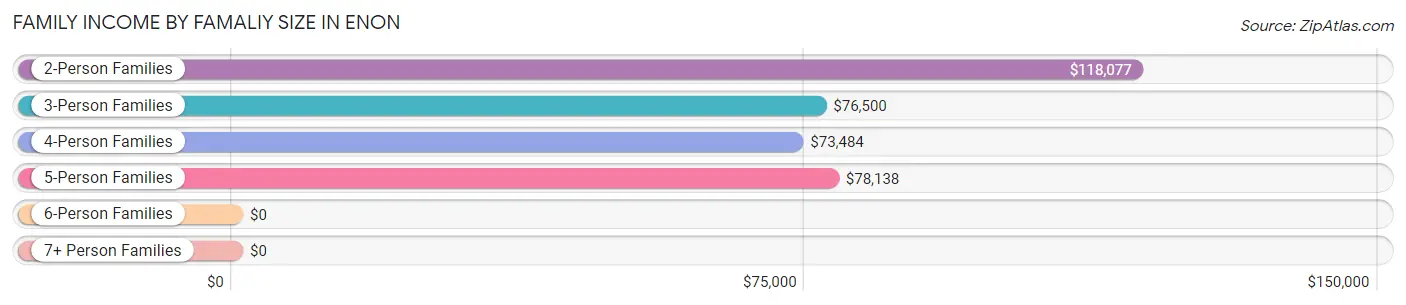
Family Income by Famaliy Size in Enon
2-person families (404 | 42.7%) account for the highest median family income in Enon with $118,077 per family, while 2-person families (404 | 42.7%) have the highest median income of $59,038 per family member.
| Income Bracket | # Families | Median Income |
| 2-Person Families | 404 (42.7%) | $118,077 |
| 3-Person Families | 190 (20.1%) | $76,500 |
| 4-Person Families | 212 (22.4%) | $73,484 |
| 5-Person Families | 112 (11.8%) | $78,138 |
| 6-Person Families | 9 (0.9%) | $0 |
| 7+ Person Families | 19 (2.0%) | $0 |
| Total | 946 (100.0%) | $79,833 |
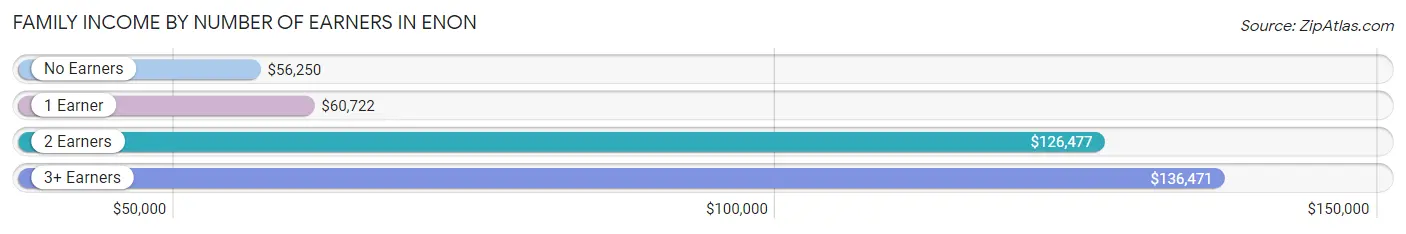
Family Income by Number of Earners in Enon
The median family income in Enon is $79,833, with families comprising 3+ earners (82) having the highest median family income of $136,471, while families with no earners (69) have the lowest median family income of $56,250, accounting for 8.7% and 7.3% of families, respectively.
| Number of Earners | # Families | Median Income |
| No Earners | 69 (7.3%) | $56,250 |
| 1 Earner | 350 (37.0%) | $60,722 |
| 2 Earners | 445 (47.0%) | $126,477 |
| 3+ Earners | 82 (8.7%) | $136,471 |
| Total | 946 (100.0%) | $79,833 |
Household Income in Enon
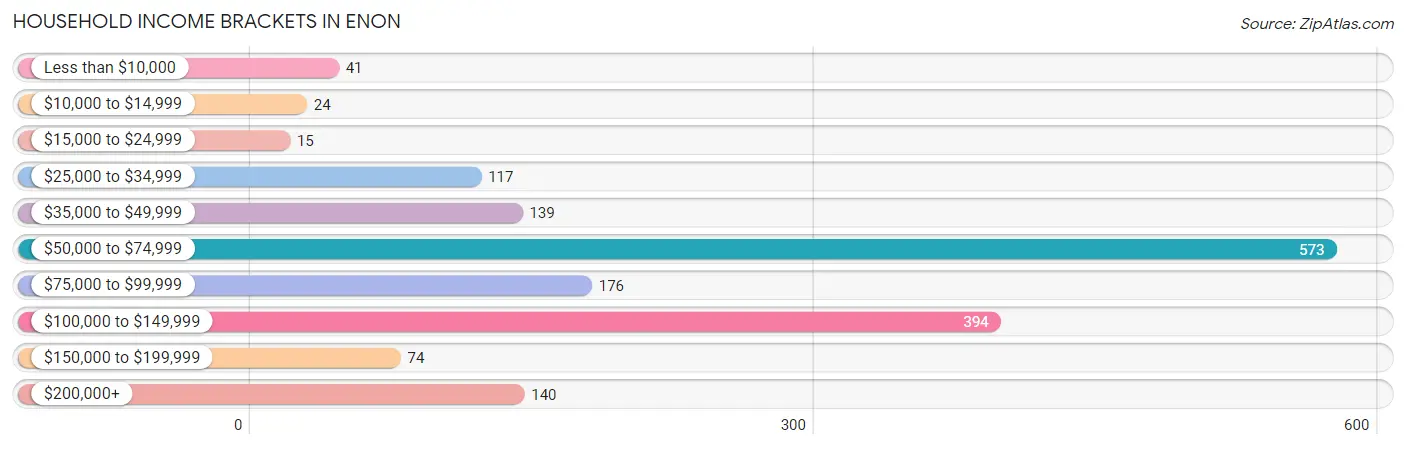
Household Income Brackets in Enon
With 573 households falling in the category, the $50,000 to $74,999 income range is the most frequent in Enon, accounting for 33.9% of all households. In contrast, only 15 households (0.9%) fall into the $15,000 to $24,999 income bracket, making it the least populous group.
| Income Bracket | # Households | % Households |
| Less than $10,000 | 41 | 2.4% |
| $10,000 to $14,999 | 24 | 1.4% |
| $15,000 to $24,999 | 15 | 0.9% |
| $25,000 to $34,999 | 117 | 6.9% |
| $35,000 to $49,999 | 139 | 8.2% |
| $50,000 to $74,999 | 573 | 33.9% |
| $75,000 to $99,999 | 176 | 10.4% |
| $100,000 to $149,999 | 394 | 23.3% |
| $150,000 to $199,999 | 74 | 4.4% |
| $200,000+ | 140 | 8.3% |
Household Income by Householder Age in Enon
The median household income in Enon is $72,852, with the highest median household income of $118,782 found in the 45 to 64 years age bracket for the primary householder. A total of 596 households (35.3%) fall into this category. Meanwhile, the 15 to 24 years age bracket for the primary householder has the lowest median household income of $58,491, with 73 households (4.3%) in this group.

| Income Bracket | # Households | Median Income |
| 15 to 24 Years | 73 (4.3%) | $58,491 |
| 25 to 44 Years | 599 (35.4%) | $73,463 |
| 45 to 64 Years | 596 (35.3%) | $118,782 |
| 65+ Years | 422 (25.0%) | $67,654 |
| Total | 1,690 (100.0%) | $72,852 |
Poverty in Enon
Income Below Poverty by Sex and Age in Enon
With 4.8% poverty level for males and 10.5% for females among the residents of Enon, 65 to 74 year old males and 16 and 17 year old females are the most vulnerable to poverty, with 51 males (16.1%) and 53 females (54.6%) in their respective age groups living below the poverty level.
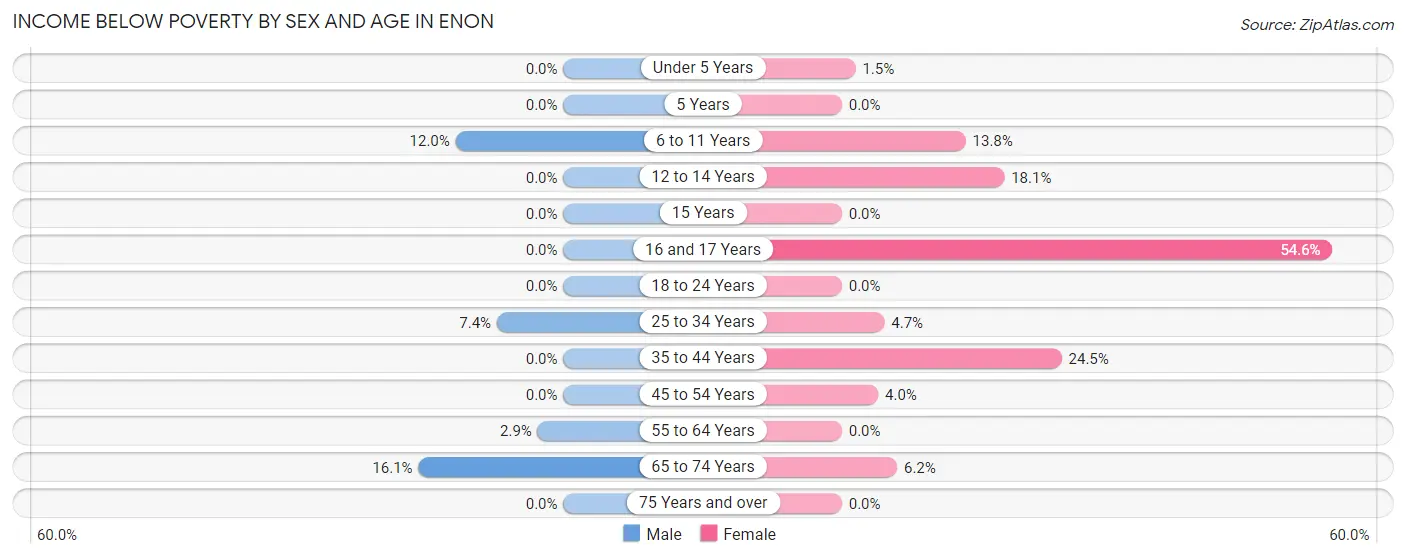
| Age Bracket | Male | Female |
| Under 5 Years | 0 (0.0%) | 1 (1.5%) |
| 5 Years | 0 (0.0%) | 0 (0.0%) |
| 6 to 11 Years | 21 (12.0%) | 20 (13.8%) |
| 12 to 14 Years | 0 (0.0%) | 17 (18.1%) |
| 15 Years | 0 (0.0%) | 0 (0.0%) |
| 16 and 17 Years | 0 (0.0%) | 53 (54.6%) |
| 18 to 24 Years | 0 (0.0%) | 0 (0.0%) |
| 25 to 34 Years | 23 (7.4%) | 12 (4.7%) |
| 35 to 44 Years | 0 (0.0%) | 83 (24.5%) |
| 45 to 54 Years | 0 (0.0%) | 9 (4.0%) |
| 55 to 64 Years | 7 (2.9%) | 0 (0.0%) |
| 65 to 74 Years | 51 (16.1%) | 8 (6.1%) |
| 75 Years and over | 0 (0.0%) | 0 (0.0%) |
| Total | 102 (4.8%) | 203 (10.5%) |
Income Above Poverty by Sex and Age in Enon
According to the poverty statistics in Enon, males aged under 5 years and females aged 5 years are the age groups that are most secure financially, with 100.0% of males and 100.0% of females in these age groups living above the poverty line.
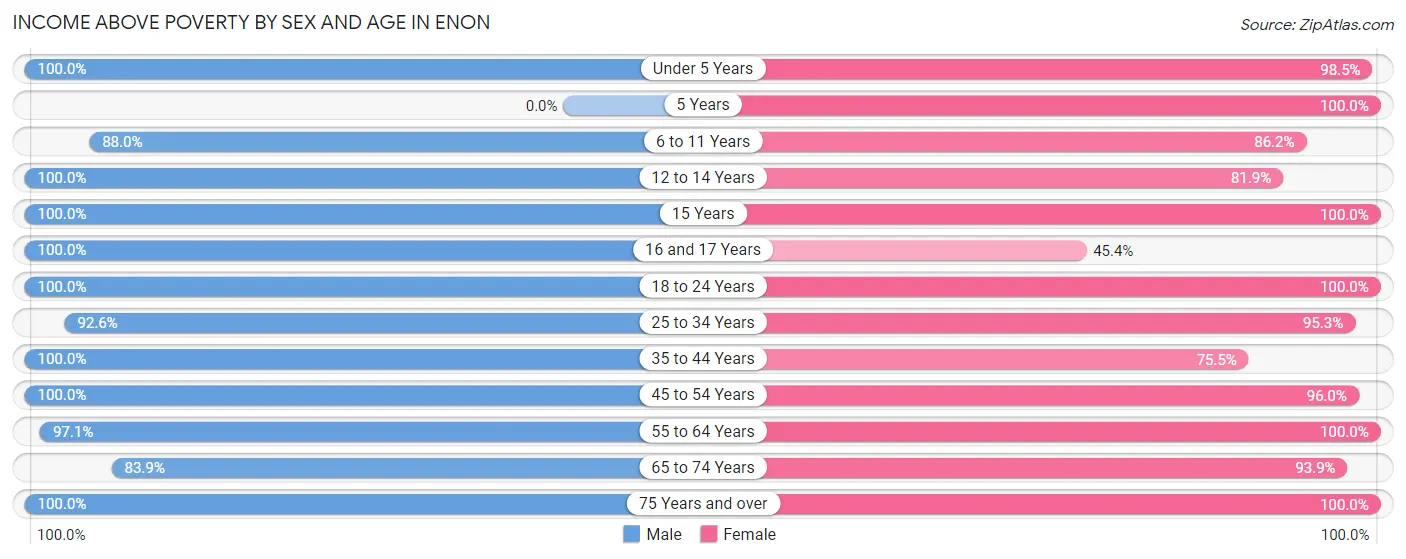
| Age Bracket | Male | Female |
| Under 5 Years | 136 (100.0%) | 65 (98.5%) |
| 5 Years | 0 (0.0%) | 8 (100.0%) |
| 6 to 11 Years | 154 (88.0%) | 125 (86.2%) |
| 12 to 14 Years | 63 (100.0%) | 77 (81.9%) |
| 15 Years | 12 (100.0%) | 20 (100.0%) |
| 16 and 17 Years | 106 (100.0%) | 44 (45.4%) |
| 18 to 24 Years | 173 (100.0%) | 106 (100.0%) |
| 25 to 34 Years | 288 (92.6%) | 241 (95.3%) |
| 35 to 44 Years | 267 (100.0%) | 256 (75.5%) |
| 45 to 54 Years | 270 (100.0%) | 214 (96.0%) |
| 55 to 64 Years | 238 (97.1%) | 318 (100.0%) |
| 65 to 74 Years | 265 (83.9%) | 122 (93.9%) |
| 75 Years and over | 74 (100.0%) | 140 (100.0%) |
| Total | 2,046 (95.3%) | 1,736 (89.5%) |
Income Below Poverty Among Married-Couple Families in Enon
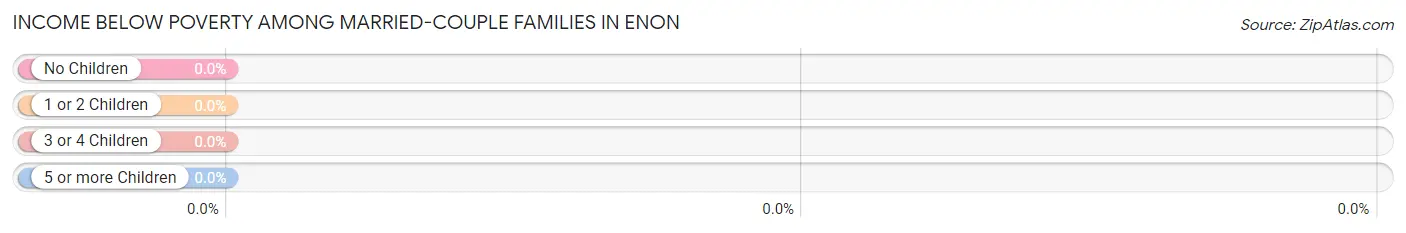
| Children | Above Poverty | Below Poverty |
| No Children | 411 (100.0%) | 0 (0.0%) |
| 1 or 2 Children | 166 (100.0%) | 0 (0.0%) |
| 3 or 4 Children | 46 (100.0%) | 0 (0.0%) |
| 5 or more Children | 19 (100.0%) | 0 (0.0%) |
| Total | 642 (100.0%) | 0 (0.0%) |
Income Below Poverty Among Single-Parent Households in Enon
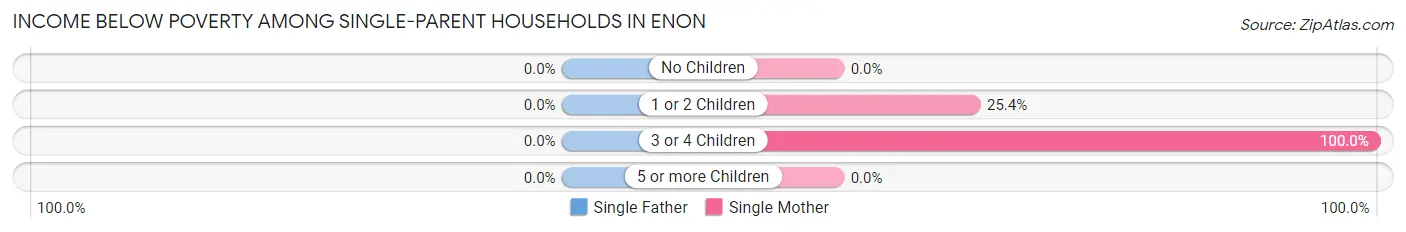
| Children | Single Father | Single Mother |
| No Children | 0 (0.0%) | 0 (0.0%) |
| 1 or 2 Children | 0 (0.0%) | 48 (25.4%) |
| 3 or 4 Children | 0 (0.0%) | 12 (100.0%) |
| 5 or more Children | 0 (0.0%) | 0 (0.0%) |
| Total | 0 (0.0%) | 60 (24.5%) |
Income Below Poverty Among Married-Couple vs Single-Parent Households in Enon
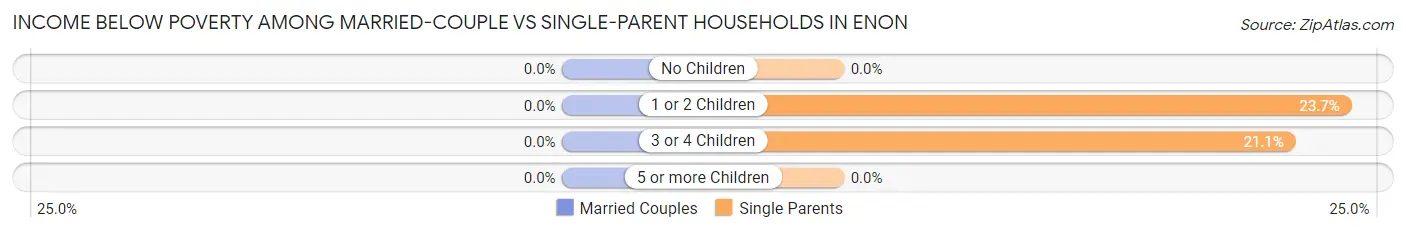
| Children | Married-Couple Families | Single-Parent Households |
| No Children | 0 (0.0%) | 0 (0.0%) |
| 1 or 2 Children | 0 (0.0%) | 48 (23.6%) |
| 3 or 4 Children | 0 (0.0%) | 12 (21.0%) |
| 5 or more Children | 0 (0.0%) | 0 (0.0%) |
| Total | 0 (0.0%) | 60 (19.7%) |
Race in Enon
The most populous races in Enon are White / Caucasian (2,448 | 59.9%), Black / African American (769 | 18.8%), and Hispanic or Latino (501 | 12.3%).
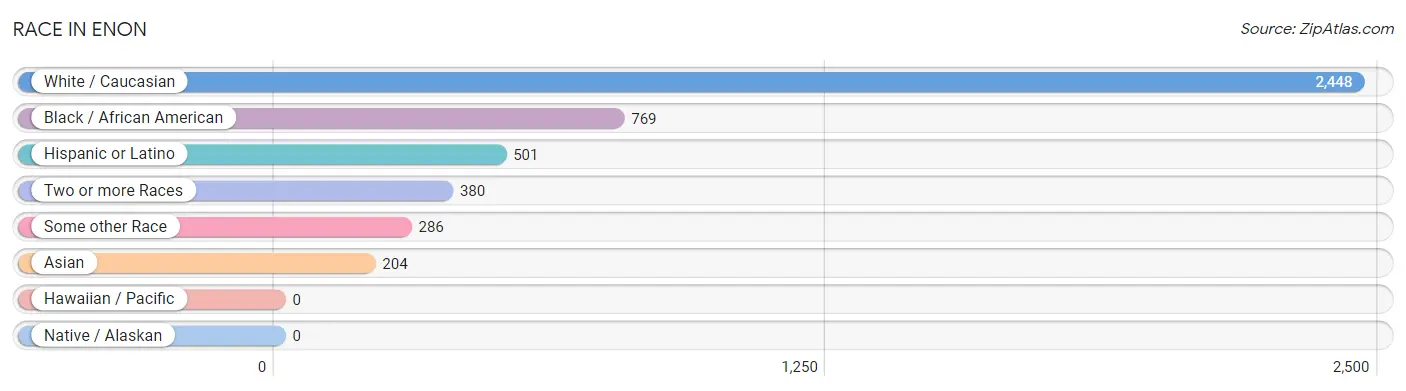
| Race | # Population | % Population |
| Asian | 204 | 5.0% |
| Black / African American | 769 | 18.8% |
| Hawaiian / Pacific | 0 | 0.0% |
| Hispanic or Latino | 501 | 12.3% |
| Native / Alaskan | 0 | 0.0% |
| White / Caucasian | 2,448 | 59.9% |
| Two or more Races | 380 | 9.3% |
| Some other Race | 286 | 7.0% |
| Total | 4,087 | 100.0% |
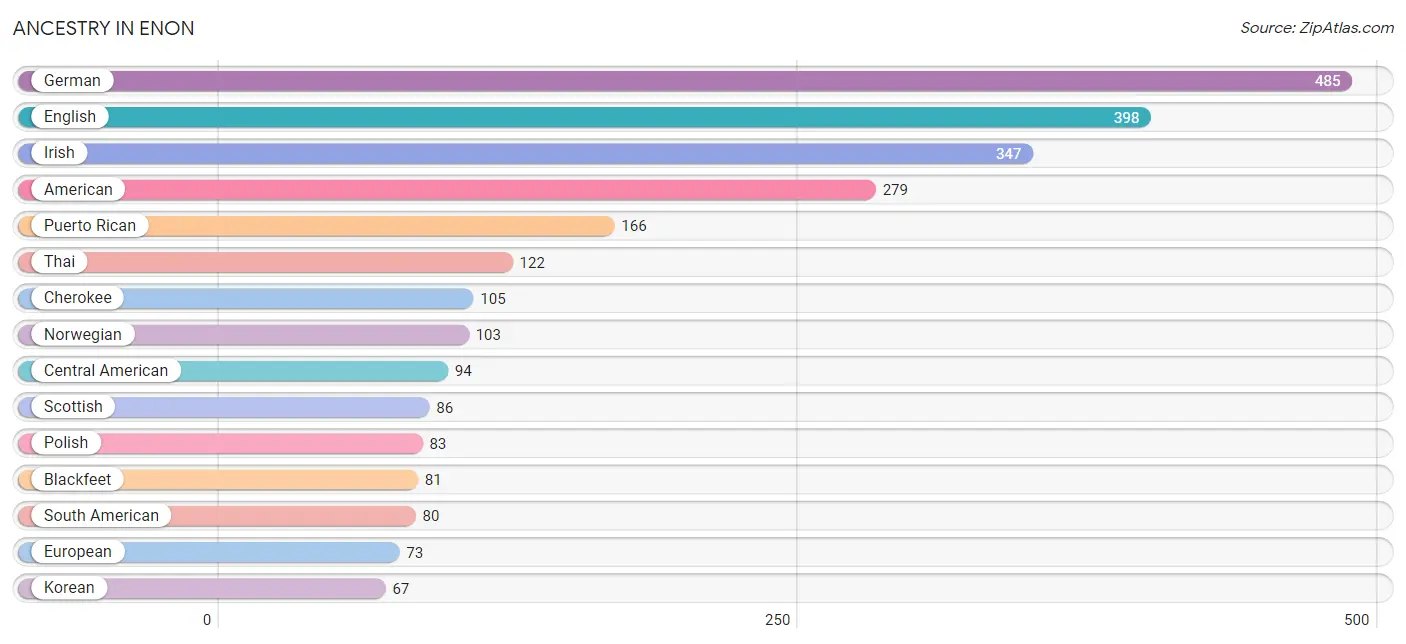
Ancestry in Enon
The most populous ancestries reported in Enon are German (485 | 11.9%), English (398 | 9.7%), Irish (347 | 8.5%), American (279 | 6.8%), and Puerto Rican (166 | 4.1%), together accounting for 41.0% of all Enon residents.
| Ancestry | # Population | % Population |
| American | 279 | 6.8% |
| Arab | 26 | 0.6% |
| Blackfeet | 81 | 2.0% |
| British | 18 | 0.4% |
| Central American | 94 | 2.3% |
| Cherokee | 105 | 2.6% |
| Costa Rican | 25 | 0.6% |
| Cuban | 66 | 1.6% |
| English | 398 | 9.7% |
| European | 73 | 1.8% |
| French | 60 | 1.5% |
| French Canadian | 24 | 0.6% |
| German | 485 | 11.9% |
| Honduran | 43 | 1.1% |
| Irish | 347 | 8.5% |
| Italian | 30 | 0.7% |
| Japanese | 51 | 1.3% |
| Korean | 67 | 1.6% |
| Lebanese | 9 | 0.2% |
| Mexican | 51 | 1.3% |
| Norwegian | 103 | 2.5% |
| Paraguayan | 35 | 0.9% |
| Peruvian | 45 | 1.1% |
| Polish | 83 | 2.0% |
| Puerto Rican | 166 | 4.1% |
| Salvadoran | 26 | 0.6% |
| Scotch-Irish | 62 | 1.5% |
| Scottish | 86 | 2.1% |
| Slavic | 21 | 0.5% |
| South American | 80 | 2.0% |
| Swedish | 18 | 0.4% |
| Thai | 122 | 3.0% |
| Welsh | 7 | 0.2% | View All 33 Rows |
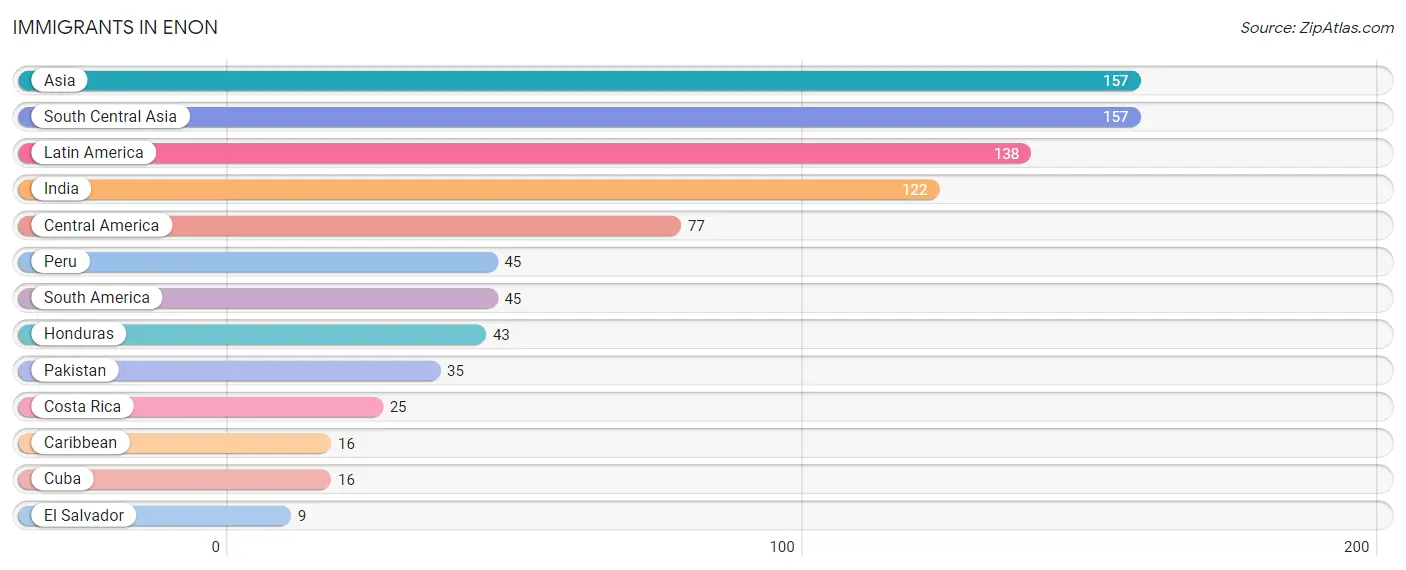
Immigrants in Enon
The most numerous immigrant groups reported in Enon came from Asia (157 | 3.8%), South Central Asia (157 | 3.8%), Latin America (138 | 3.4%), India (122 | 3.0%), and Central America (77 | 1.9%), together accounting for 15.9% of all Enon residents.
| Immigration Origin | # Population | % Population |
| Asia | 157 | 3.8% |
| Caribbean | 16 | 0.4% |
| Central America | 77 | 1.9% |
| Costa Rica | 25 | 0.6% |
| Cuba | 16 | 0.4% |
| El Salvador | 9 | 0.2% |
| Honduras | 43 | 1.1% |
| India | 122 | 3.0% |
| Latin America | 138 | 3.4% |
| Pakistan | 35 | 0.9% |
| Peru | 45 | 1.1% |
| South America | 45 | 1.1% |
| South Central Asia | 157 | 3.8% | View All 13 Rows |
Sex and Age in Enon
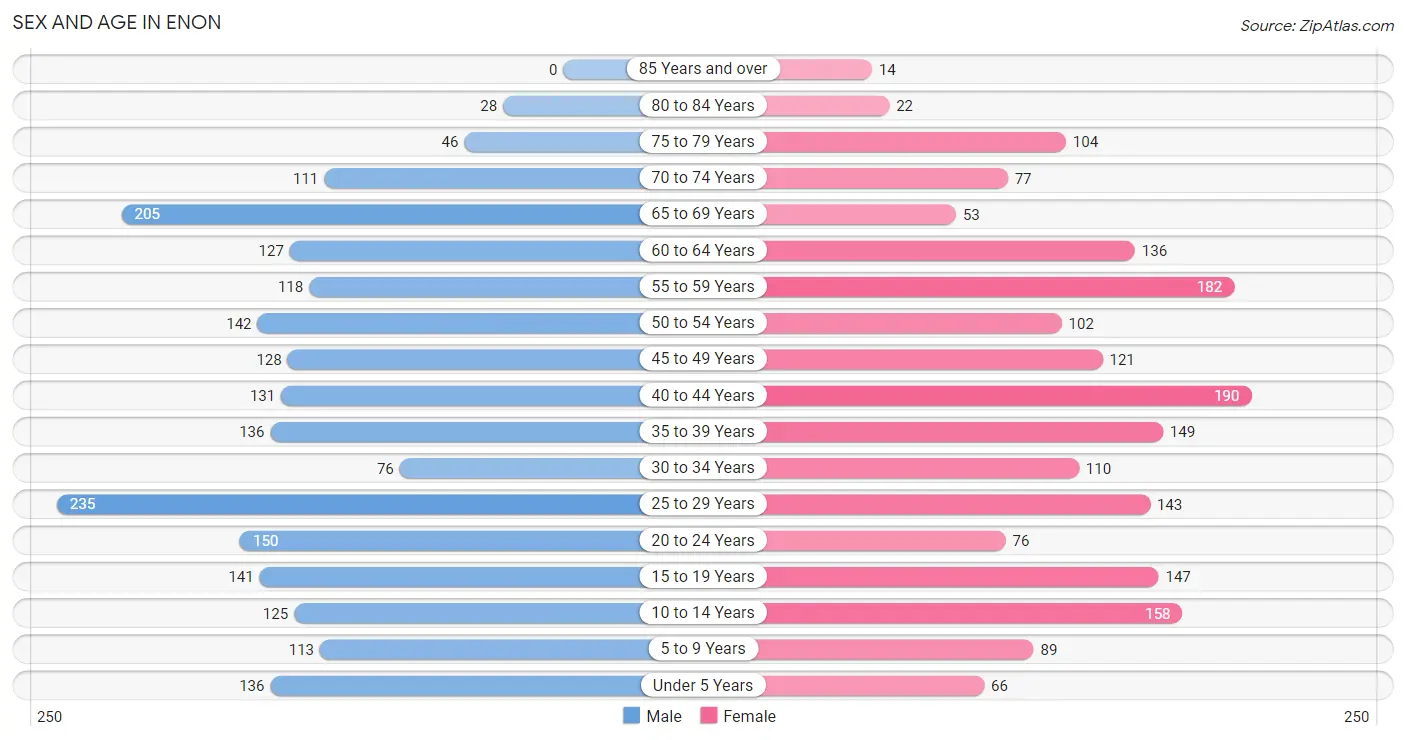
Sex and Age in Enon
The most populous age groups in Enon are 25 to 29 Years (235 | 10.9%) for men and 40 to 44 Years (190 | 9.8%) for women.
| Age Bracket | Male | Female |
| Under 5 Years | 136 (6.3%) | 66 (3.4%) |
| 5 to 9 Years | 113 (5.3%) | 89 (4.6%) |
| 10 to 14 Years | 125 (5.8%) | 158 (8.2%) |
| 15 to 19 Years | 141 (6.6%) | 147 (7.6%) |
| 20 to 24 Years | 150 (7.0%) | 76 (3.9%) |
| 25 to 29 Years | 235 (10.9%) | 143 (7.4%) |
| 30 to 34 Years | 76 (3.5%) | 110 (5.7%) |
| 35 to 39 Years | 136 (6.3%) | 149 (7.7%) |
| 40 to 44 Years | 131 (6.1%) | 190 (9.8%) |
| 45 to 49 Years | 128 (6.0%) | 121 (6.2%) |
| 50 to 54 Years | 142 (6.6%) | 102 (5.3%) |
| 55 to 59 Years | 118 (5.5%) | 182 (9.4%) |
| 60 to 64 Years | 127 (5.9%) | 136 (7.0%) |
| 65 to 69 Years | 205 (9.5%) | 53 (2.7%) |
| 70 to 74 Years | 111 (5.2%) | 77 (4.0%) |
| 75 to 79 Years | 46 (2.1%) | 104 (5.4%) |
| 80 to 84 Years | 28 (1.3%) | 22 (1.1%) |
| 85 Years and over | 0 (0.0%) | 14 (0.7%) |
| Total | 2,148 (100.0%) | 1,939 (100.0%) |
Families and Households in Enon
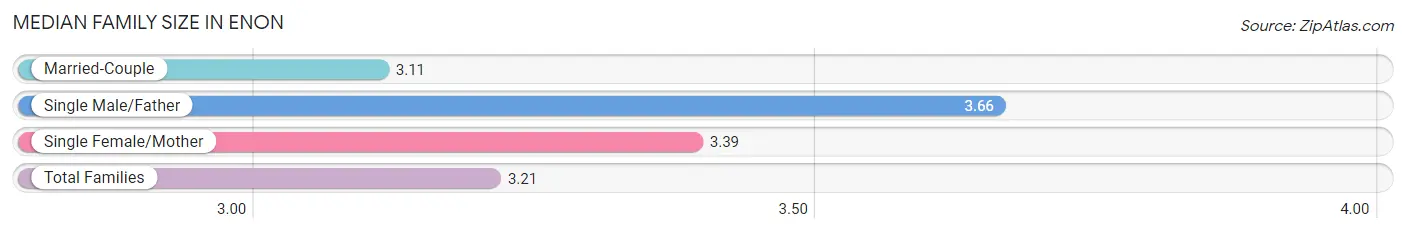
Median Family Size in Enon
The median family size in Enon is 3.21 persons per family, with single male/father families (59 | 6.2%) accounting for the largest median family size of 3.66 persons per family. On the other hand, married-couple families (642 | 67.9%) represent the smallest median family size with 3.11 persons per family.
| Family Type | # Families | Family Size |
| Married-Couple | 642 (67.9%) | 3.11 |
| Single Male/Father | 59 (6.2%) | 3.66 |
| Single Female/Mother | 245 (25.9%) | 3.39 |
| Total Families | 946 (100.0%) | 3.21 |
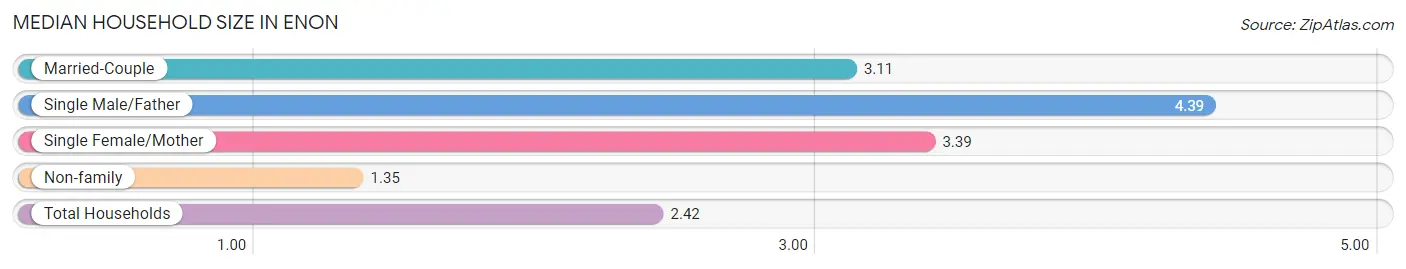
Median Household Size in Enon
The median household size in Enon is 2.42 persons per household, with single male/father households (59 | 3.5%) accounting for the largest median household size of 4.39 persons per household. non-family households (744 | 44.0%) represent the smallest median household size with 1.35 persons per household.
| Household Type | # Households | Household Size |
| Married-Couple | 642 (38.0%) | 3.11 |
| Single Male/Father | 59 (3.5%) | 4.39 |
| Single Female/Mother | 245 (14.5%) | 3.39 |
| Non-family | 744 (44.0%) | 1.35 |
| Total Households | 1,690 (100.0%) | 2.42 |
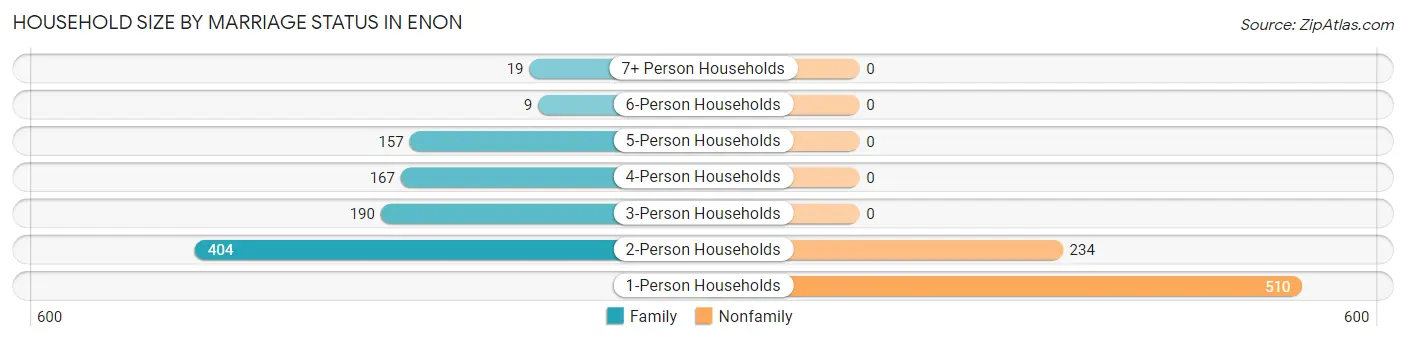
Household Size by Marriage Status in Enon
Out of a total of 1,690 households in Enon, 946 (56.0%) are family households, while 744 (44.0%) are nonfamily households. The most numerous type of family households are 2-person households, comprising 404, and the most common type of nonfamily households are 1-person households, comprising 510.
| Household Size | Family Households | Nonfamily Households |
| 1-Person Households | - | 510 (30.2%) |
| 2-Person Households | 404 (23.9%) | 234 (13.9%) |
| 3-Person Households | 190 (11.2%) | 0 (0.0%) |
| 4-Person Households | 167 (9.9%) | 0 (0.0%) |
| 5-Person Households | 157 (9.3%) | 0 (0.0%) |
| 6-Person Households | 9 (0.5%) | 0 (0.0%) |
| 7+ Person Households | 19 (1.1%) | 0 (0.0%) |
| Total | 946 (56.0%) | 744 (44.0%) |
Female Fertility in Enon
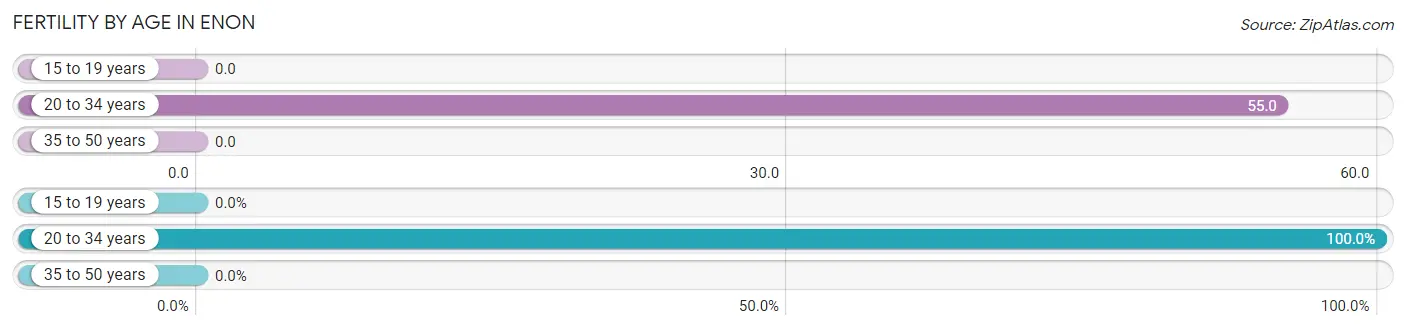
Fertility by Age in Enon
Average fertility rate in Enon is 18.0 births per 1,000 women. Women in the age bracket of 20 to 34 years have the highest fertility rate with 55.0 births per 1,000 women. Women in the age bracket of 20 to 34 years acount for 100.0% of all women with births.
| Age Bracket | Women with Births | Births / 1,000 Women |
| 15 to 19 years | 0 (0.0%) | 0.0 |
| 20 to 34 years | 18 (100.0%) | 55.0 |
| 35 to 50 years | 0 (0.0%) | 0.0 |
| Total | 18 (100.0%) | 18.0 |
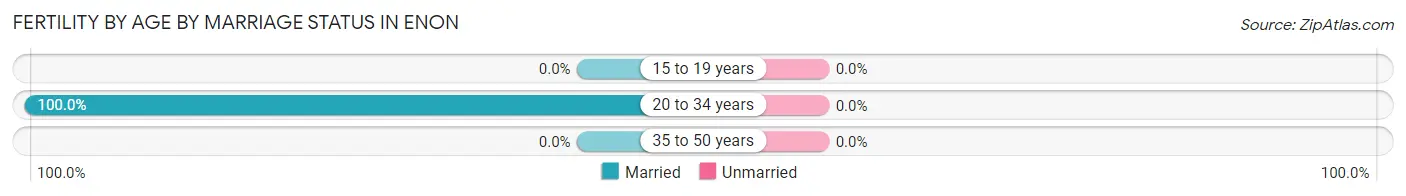
Fertility by Age by Marriage Status in Enon
| Age Bracket | Married | Unmarried |
| 15 to 19 years | 0 (0.0%) | 0 (0.0%) |
| 20 to 34 years | 18 (100.0%) | 0 (0.0%) |
| 35 to 50 years | 0 (0.0%) | 0 (0.0%) |
| Total | 18 (100.0%) | 0 (0.0%) |
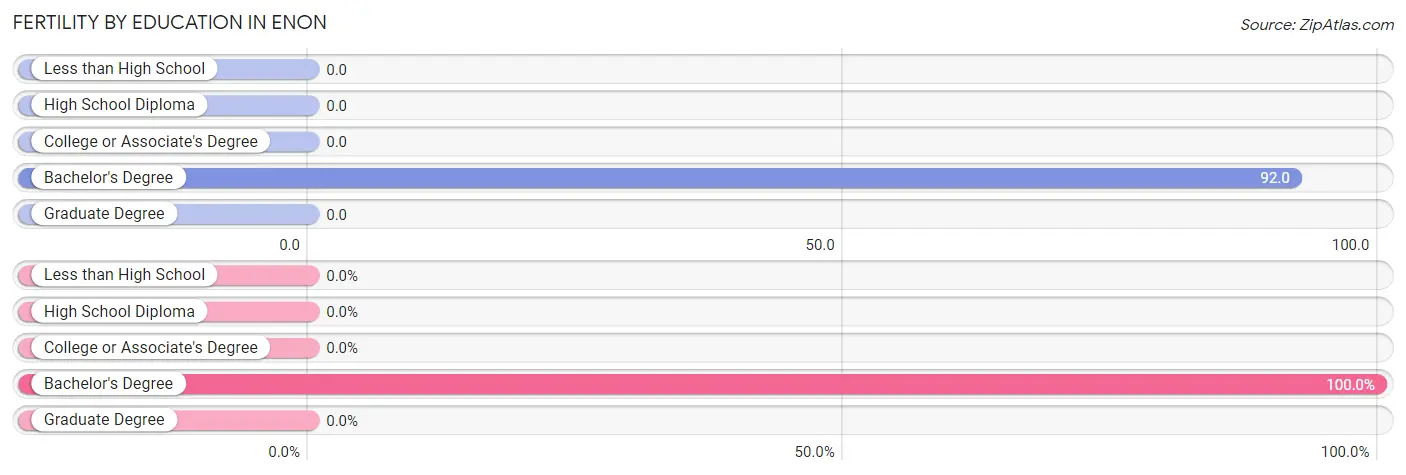
Fertility by Education in Enon
| Educational Attainment | Women with Births | Births / 1,000 Women |
| Less than High School | 0 (0.0%) | 0.0 |
| High School Diploma | 0 (0.0%) | 0.0 |
| College or Associate's Degree | 0 (0.0%) | 0.0 |
| Bachelor's Degree | 18 (100.0%) | 92.0 |
| Graduate Degree | 0 (0.0%) | 0.0 |
| Total | 18 (100.0%) | 18.0 |
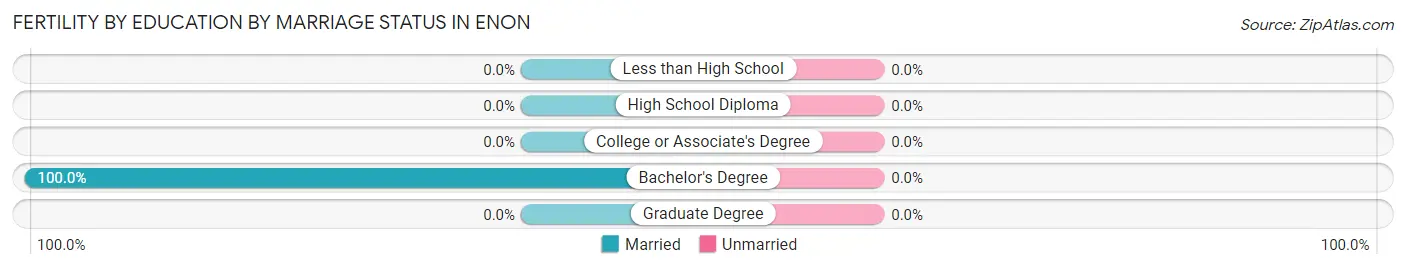
Fertility by Education by Marriage Status in Enon
| Educational Attainment | Married | Unmarried |
| Less than High School | 0 (0.0%) | 0 (0.0%) |
| High School Diploma | 0 (0.0%) | 0 (0.0%) |
| College or Associate's Degree | 0 (0.0%) | 0 (0.0%) |
| Bachelor's Degree | 18 (100.0%) | 0 (0.0%) |
| Graduate Degree | 0 (0.0%) | 0 (0.0%) |
| Total | 18 (100.0%) | 0 (0.0%) |
Employment Characteristics in Enon
Employment by Class of Employer in Enon
Among the 1,980 employed individuals in Enon, private company employees (1,254 | 63.3%), federal government employees (240 | 12.1%), and not-for-profit organizations (129 | 6.5%) make up the most common classes of employment.
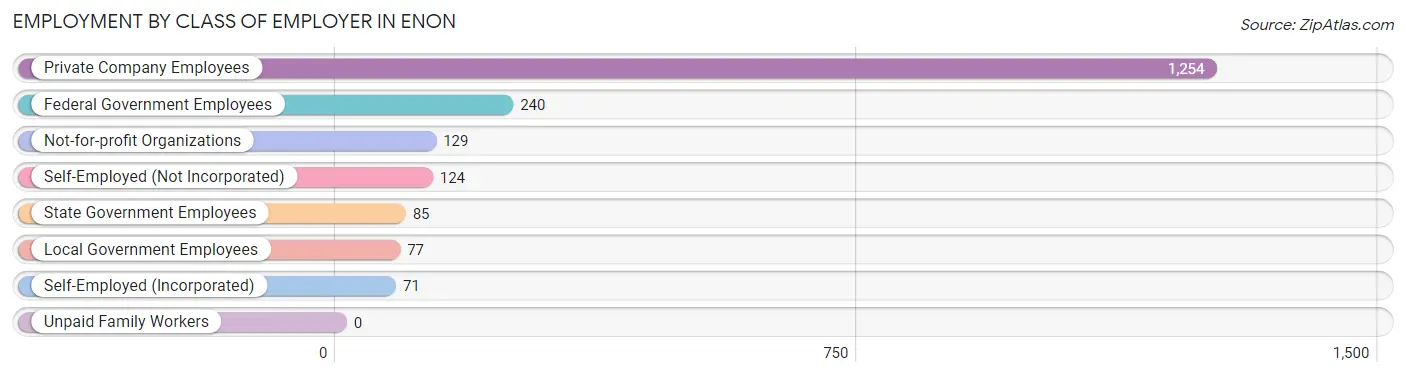
| Employer Class | # Employees | % Employees |
| Private Company Employees | 1,254 | 63.3% |
| Self-Employed (Incorporated) | 71 | 3.6% |
| Self-Employed (Not Incorporated) | 124 | 6.3% |
| Not-for-profit Organizations | 129 | 6.5% |
| Local Government Employees | 77 | 3.9% |
| State Government Employees | 85 | 4.3% |
| Federal Government Employees | 240 | 12.1% |
| Unpaid Family Workers | 0 | 0.0% |
| Total | 1,980 | 100.0% |
Employment Status by Age in Enon
According to the labor force statistics for Enon, out of the total population over 16 years of age (3,368), 61.3% or 2,065 individuals are in the labor force, with 4.1% or 85 of them unemployed. The age group with the highest labor force participation rate is 30 to 34 years, with 100.0% or 186 individuals in the labor force. Within the labor force, the 35 to 44 years age range has the highest percentage of unemployed individuals, with 13.0% or 55 of them being unemployed.
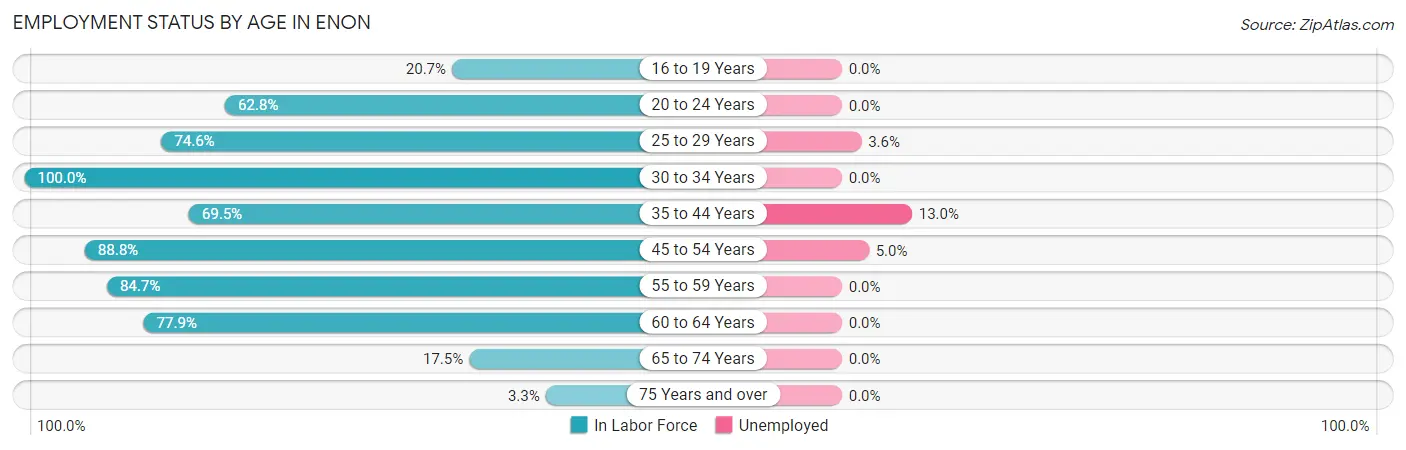
| Age Bracket | In Labor Force | Unemployed |
| 16 to 19 Years | 53 (20.7%) | 0 (0.0%) |
| 20 to 24 Years | 142 (62.8%) | 0 (0.0%) |
| 25 to 29 Years | 282 (74.6%) | 10 (3.6%) |
| 30 to 34 Years | 186 (100.0%) | 0 (0.0%) |
| 35 to 44 Years | 421 (69.5%) | 55 (13.0%) |
| 45 to 54 Years | 438 (88.8%) | 22 (5.0%) |
| 55 to 59 Years | 254 (84.7%) | 0 (0.0%) |
| 60 to 64 Years | 205 (77.9%) | 0 (0.0%) |
| 65 to 74 Years | 78 (17.5%) | 0 (0.0%) |
| 75 Years and over | 7 (3.3%) | 0 (0.0%) |
| Total | 2,065 (61.3%) | 85 (4.1%) |
Employment Status by Educational Attainment in Enon
According to labor force statistics for Enon, 80.2% of individuals (1,785) out of the total population between 25 and 64 years of age (2,226) are in the labor force, with 4.8% or 86 of them being unemployed. The group with the highest labor force participation rate are those with the educational attainment of bachelor's degree or higher, with 87.8% or 771 individuals in the labor force. Within the labor force, individuals with high school diploma education have the highest percentage of unemployment, with 14.0% or 63 of them being unemployed.
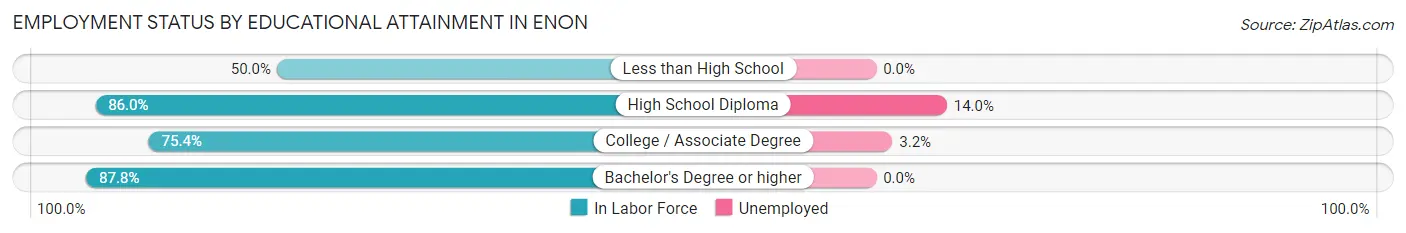
| Educational Attainment | In Labor Force | Unemployed |
| Less than High School | 112 (50.0%) | 0 (0.0%) |
| High School Diploma | 449 (86.0%) | 73 (14.0%) |
| College / Associate Degree | 454 (75.4%) | 19 (3.2%) |
| Bachelor's Degree or higher | 771 (87.8%) | 0 (0.0%) |
| Total | 1,785 (80.2%) | 107 (4.8%) |
Employment Occupations by Sex in Enon
Management, Business, Science and Arts Occupations
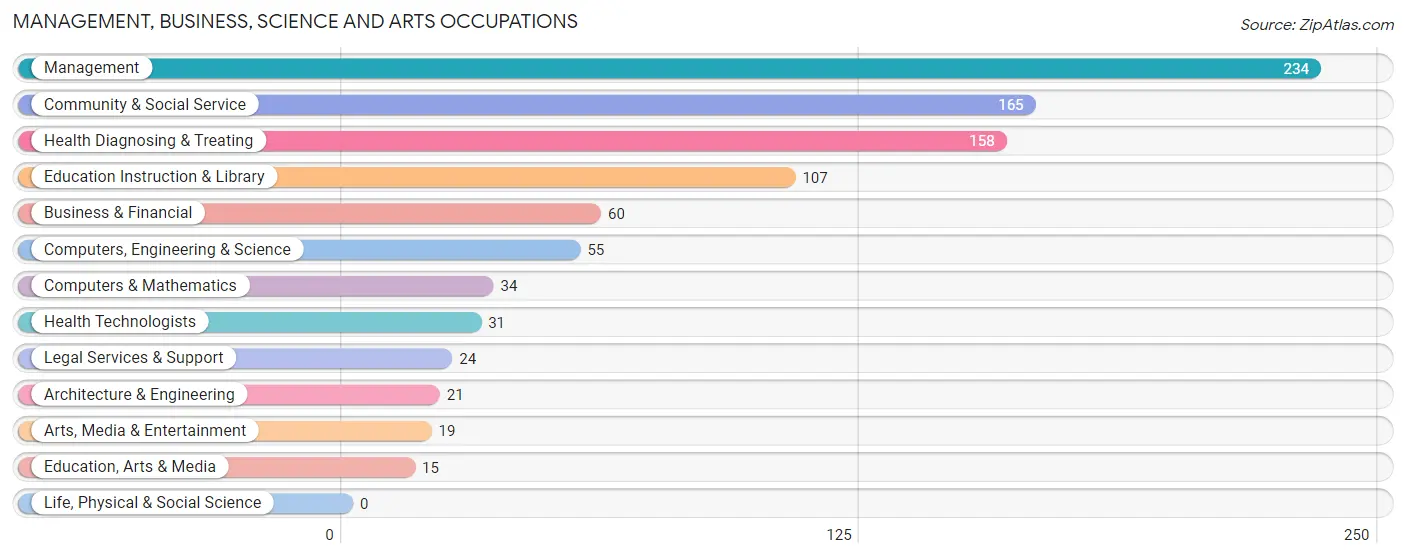
The most common Management, Business, Science and Arts occupations in Enon are Management (234 | 13.0%), Community & Social Service (165 | 9.2%), Health Diagnosing & Treating (158 | 8.8%), Education Instruction & Library (107 | 5.9%), and Business & Financial (60 | 3.3%).
Management, Business, Science and Arts Occupations by Sex
Within the Management, Business, Science and Arts occupations in Enon, the most male-oriented occupations are Architecture & Engineering (100.0%), Arts, Media & Entertainment (100.0%), and Computers, Engineering & Science (78.2%), while the most female-oriented occupations are Education, Arts & Media (100.0%), Legal Services & Support (100.0%), and Health Technologists (100.0%).
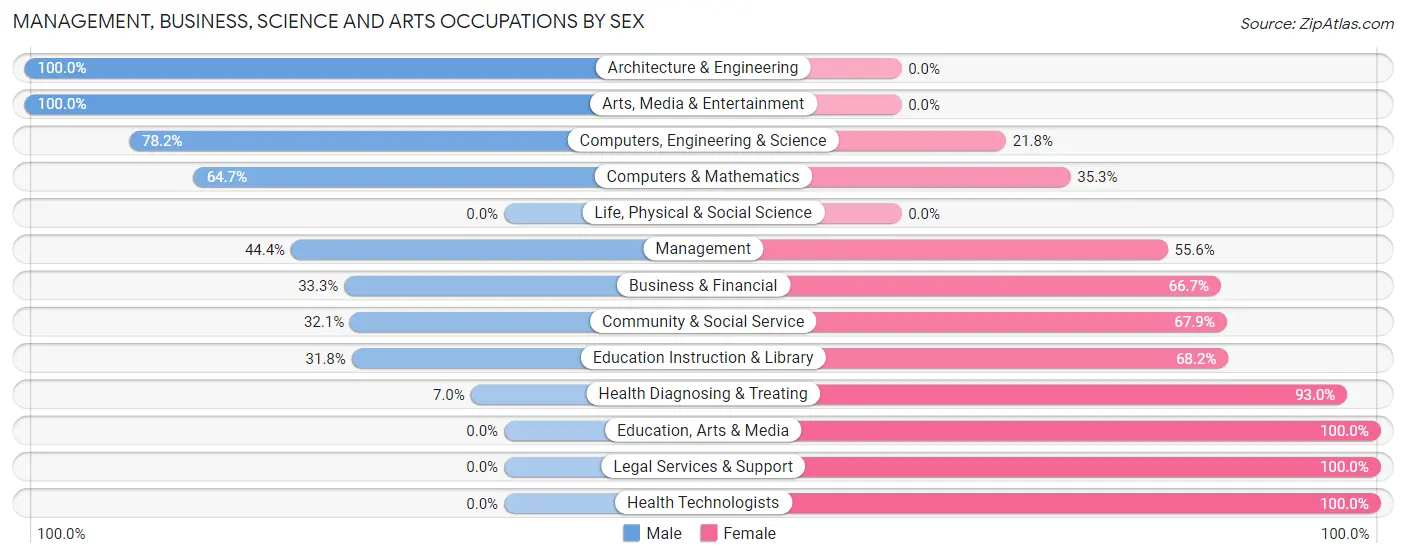
| Occupation | Male | Female |
| Management | 104 (44.4%) | 130 (55.6%) |
| Business & Financial | 20 (33.3%) | 40 (66.7%) |
| Computers, Engineering & Science | 43 (78.2%) | 12 (21.8%) |
| Computers & Mathematics | 22 (64.7%) | 12 (35.3%) |
| Architecture & Engineering | 21 (100.0%) | 0 (0.0%) |
| Life, Physical & Social Science | 0 (0.0%) | 0 (0.0%) |
| Community & Social Service | 53 (32.1%) | 112 (67.9%) |
| Education, Arts & Media | 0 (0.0%) | 15 (100.0%) |
| Legal Services & Support | 0 (0.0%) | 24 (100.0%) |
| Education Instruction & Library | 34 (31.8%) | 73 (68.2%) |
| Arts, Media & Entertainment | 19 (100.0%) | 0 (0.0%) |
| Health Diagnosing & Treating | 11 (7.0%) | 147 (93.0%) |
| Health Technologists | 0 (0.0%) | 31 (100.0%) |
| Total (Category) | 231 (34.4%) | 441 (65.6%) |
| Total (Overall) | 868 (48.2%) | 933 (51.8%) |
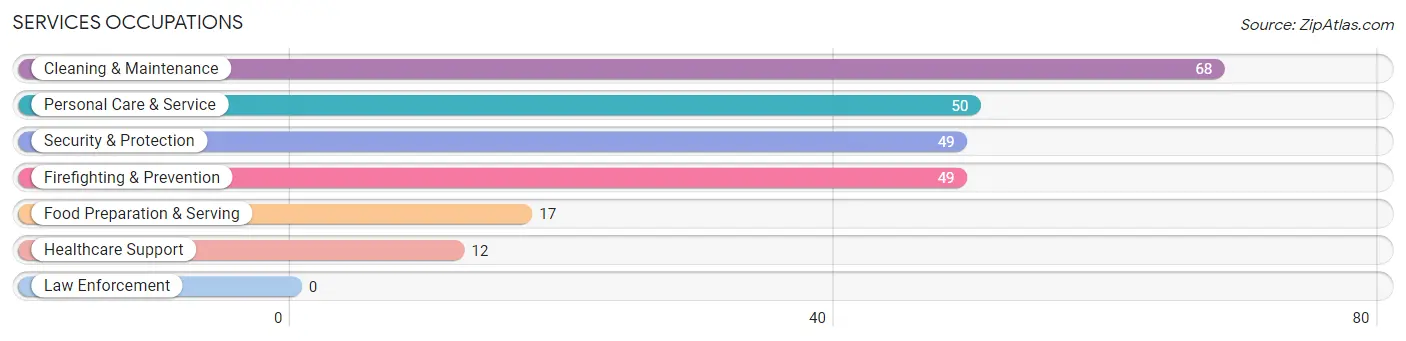
Services Occupations
The most common Services occupations in Enon are Cleaning & Maintenance (68 | 3.8%), Personal Care & Service (50 | 2.8%), Security & Protection (49 | 2.7%), Firefighting & Prevention (49 | 2.7%), and Food Preparation & Serving (17 | 0.9%).
Services Occupations by Sex
Within the Services occupations in Enon, the most male-oriented occupations are Security & Protection (100.0%), Firefighting & Prevention (100.0%), and Cleaning & Maintenance (100.0%), while the most female-oriented occupations are Healthcare Support (100.0%), Food Preparation & Serving (100.0%), and Personal Care & Service (100.0%).
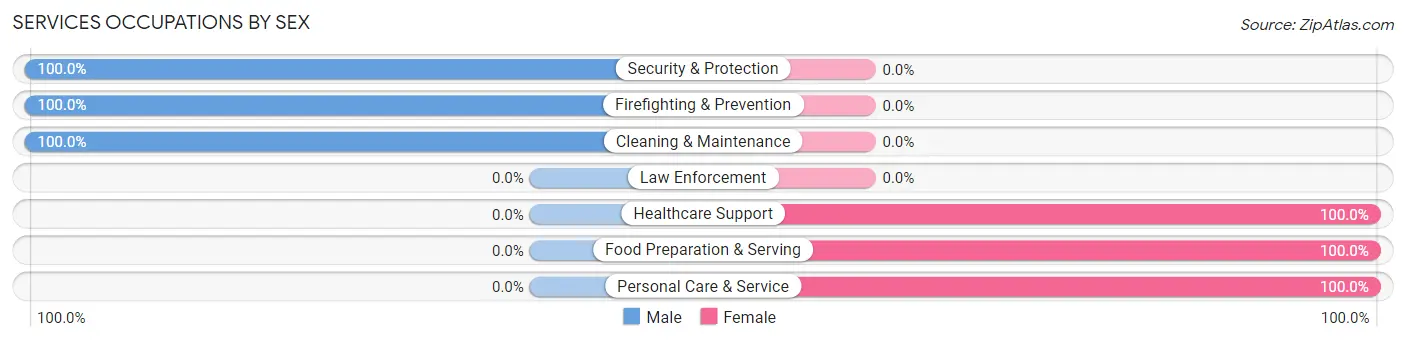
| Occupation | Male | Female |
| Healthcare Support | 0 (0.0%) | 12 (100.0%) |
| Security & Protection | 49 (100.0%) | 0 (0.0%) |
| Firefighting & Prevention | 49 (100.0%) | 0 (0.0%) |
| Law Enforcement | 0 (0.0%) | 0 (0.0%) |
| Food Preparation & Serving | 0 (0.0%) | 17 (100.0%) |
| Cleaning & Maintenance | 68 (100.0%) | 0 (0.0%) |
| Personal Care & Service | 0 (0.0%) | 50 (100.0%) |
| Total (Category) | 117 (59.7%) | 79 (40.3%) |
| Total (Overall) | 868 (48.2%) | 933 (51.8%) |
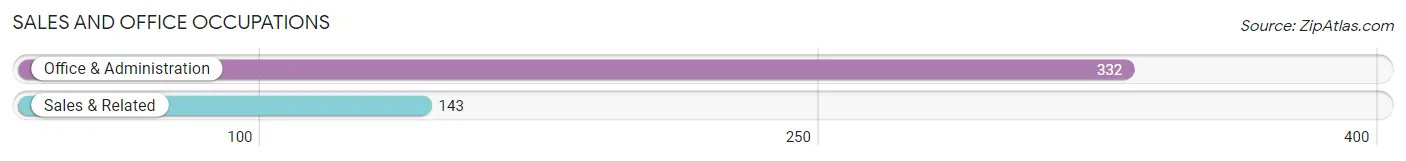
Sales and Office Occupations
The most common Sales and Office occupations in Enon are Office & Administration (332 | 18.4%), and Sales & Related (143 | 7.9%).
Sales and Office Occupations by Sex
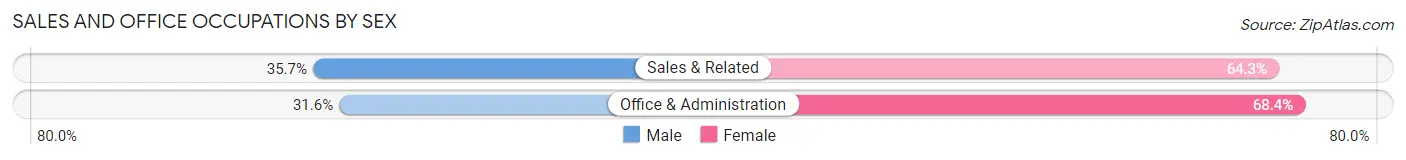
| Occupation | Male | Female |
| Sales & Related | 51 (35.7%) | 92 (64.3%) |
| Office & Administration | 105 (31.6%) | 227 (68.4%) |
| Total (Category) | 156 (32.8%) | 319 (67.2%) |
| Total (Overall) | 868 (48.2%) | 933 (51.8%) |
Natural Resources, Construction and Maintenance Occupations
The most common Natural Resources, Construction and Maintenance occupations in Enon are Construction & Extraction (149 | 8.3%), and Installation, Maintenance & Repair (31 | 1.7%).
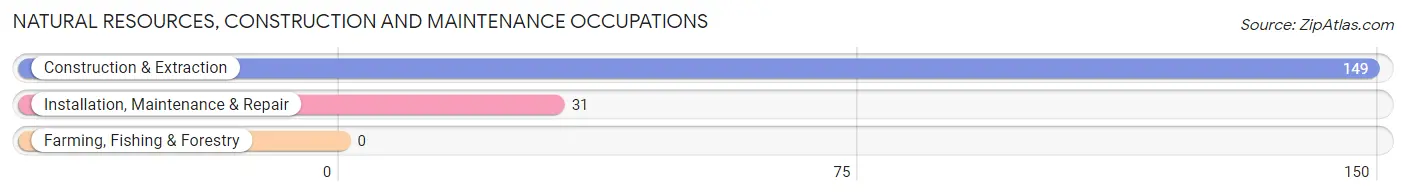
Natural Resources, Construction and Maintenance Occupations by Sex
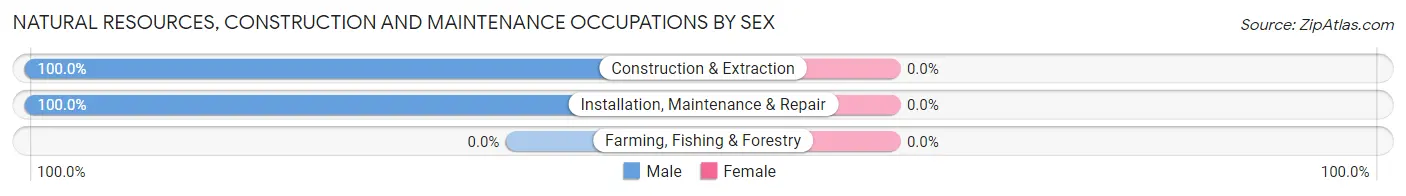
| Occupation | Male | Female |
| Farming, Fishing & Forestry | 0 (0.0%) | 0 (0.0%) |
| Construction & Extraction | 149 (100.0%) | 0 (0.0%) |
| Installation, Maintenance & Repair | 31 (100.0%) | 0 (0.0%) |
| Total (Category) | 180 (100.0%) | 0 (0.0%) |
| Total (Overall) | 868 (48.2%) | 933 (51.8%) |
Production, Transportation and Moving Occupations
The most common Production, Transportation and Moving occupations in Enon are Production (185 | 10.3%), Material Moving (70 | 3.9%), and Transportation (23 | 1.3%).
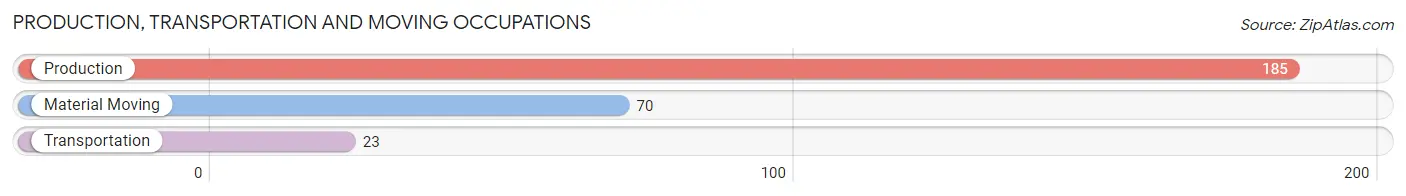
Production, Transportation and Moving Occupations by Sex
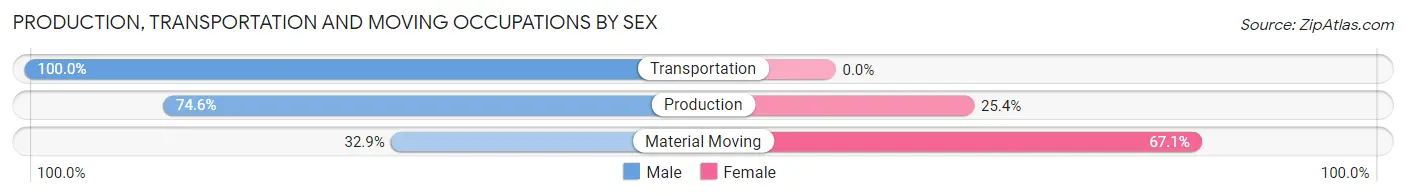
| Occupation | Male | Female |
| Production | 138 (74.6%) | 47 (25.4%) |
| Transportation | 23 (100.0%) | 0 (0.0%) |
| Material Moving | 23 (32.9%) | 47 (67.1%) |
| Total (Category) | 184 (66.2%) | 94 (33.8%) |
| Total (Overall) | 868 (48.2%) | 933 (51.8%) |
Employment Industries by Sex in Enon
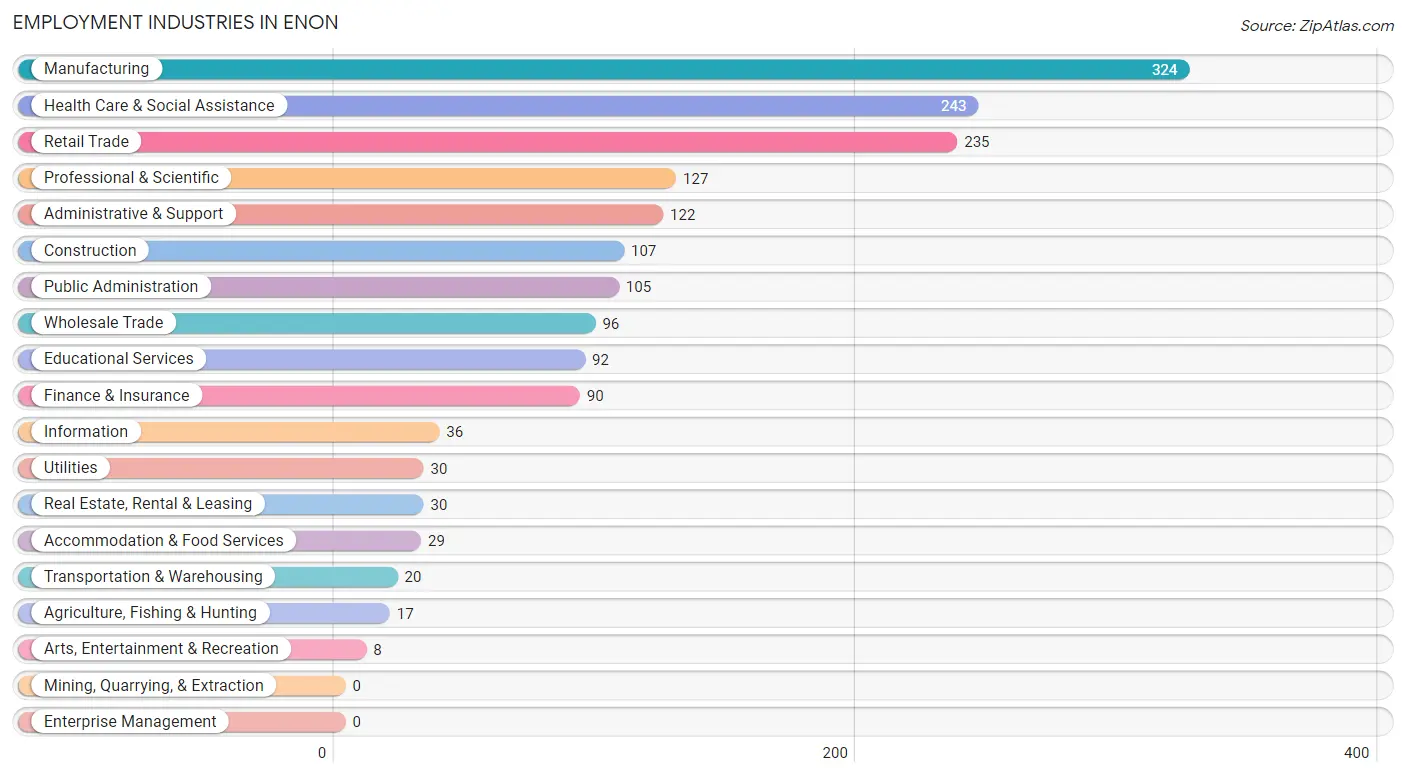
Employment Industries in Enon
The major employment industries in Enon include Manufacturing (324 | 18.0%), Health Care & Social Assistance (243 | 13.5%), Retail Trade (235 | 13.1%), Professional & Scientific (127 | 7.0%), and Administrative & Support (122 | 6.8%).
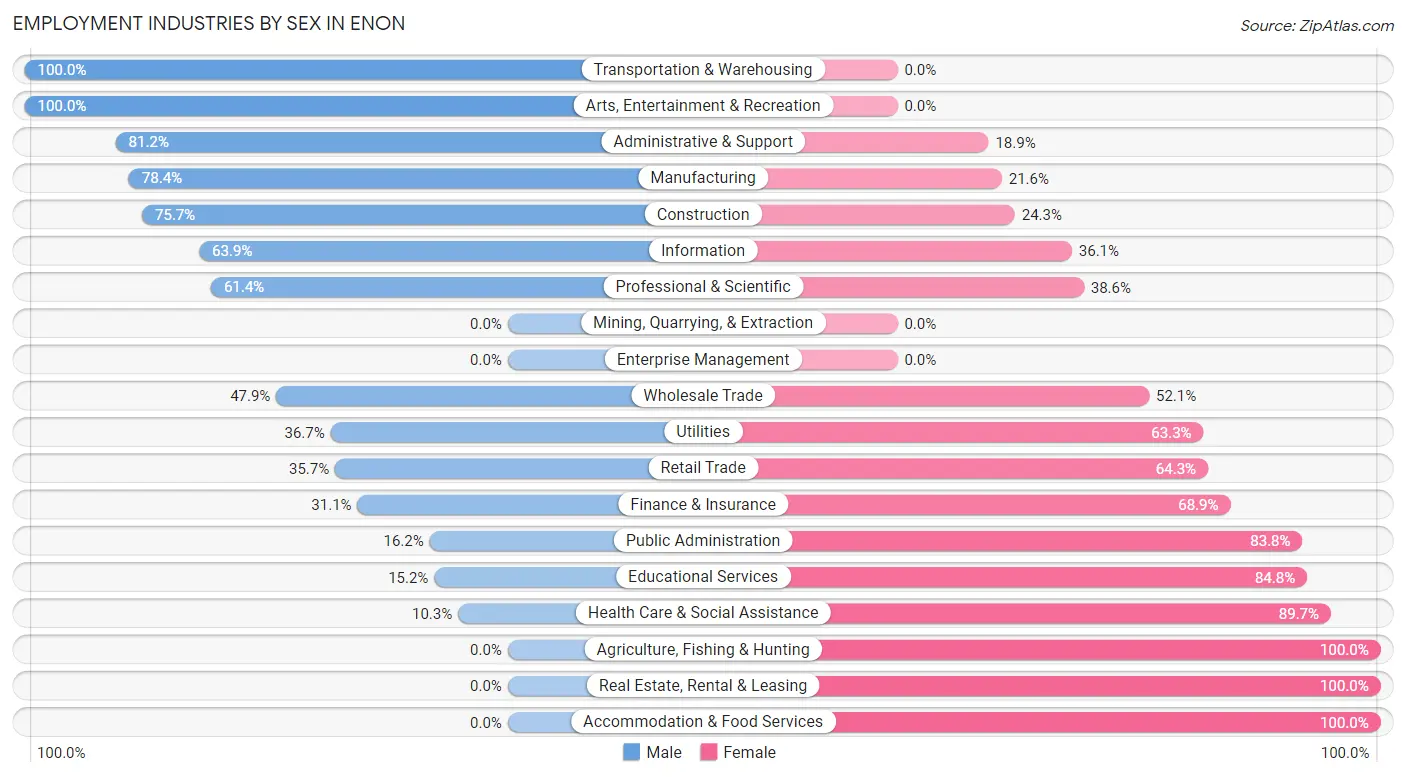
Employment Industries by Sex in Enon
The Enon industries that see more men than women are Transportation & Warehousing (100.0%), Arts, Entertainment & Recreation (100.0%), and Administrative & Support (81.1%), whereas the industries that tend to have a higher number of women are Agriculture, Fishing & Hunting (100.0%), Real Estate, Rental & Leasing (100.0%), and Accommodation & Food Services (100.0%).
| Industry | Male | Female |
| Agriculture, Fishing & Hunting | 0 (0.0%) | 17 (100.0%) |
| Mining, Quarrying, & Extraction | 0 (0.0%) | 0 (0.0%) |
| Construction | 81 (75.7%) | 26 (24.3%) |
| Manufacturing | 254 (78.4%) | 70 (21.6%) |
| Wholesale Trade | 46 (47.9%) | 50 (52.1%) |
| Retail Trade | 84 (35.7%) | 151 (64.3%) |
| Transportation & Warehousing | 20 (100.0%) | 0 (0.0%) |
| Utilities | 11 (36.7%) | 19 (63.3%) |
| Information | 23 (63.9%) | 13 (36.1%) |
| Finance & Insurance | 28 (31.1%) | 62 (68.9%) |
| Real Estate, Rental & Leasing | 0 (0.0%) | 30 (100.0%) |
| Professional & Scientific | 78 (61.4%) | 49 (38.6%) |
| Enterprise Management | 0 (0.0%) | 0 (0.0%) |
| Administrative & Support | 99 (81.1%) | 23 (18.9%) |
| Educational Services | 14 (15.2%) | 78 (84.8%) |
| Health Care & Social Assistance | 25 (10.3%) | 218 (89.7%) |
| Arts, Entertainment & Recreation | 8 (100.0%) | 0 (0.0%) |
| Accommodation & Food Services | 0 (0.0%) | 29 (100.0%) |
| Public Administration | 17 (16.2%) | 88 (83.8%) |
| Total | 868 (48.2%) | 933 (51.8%) |
Education in Enon
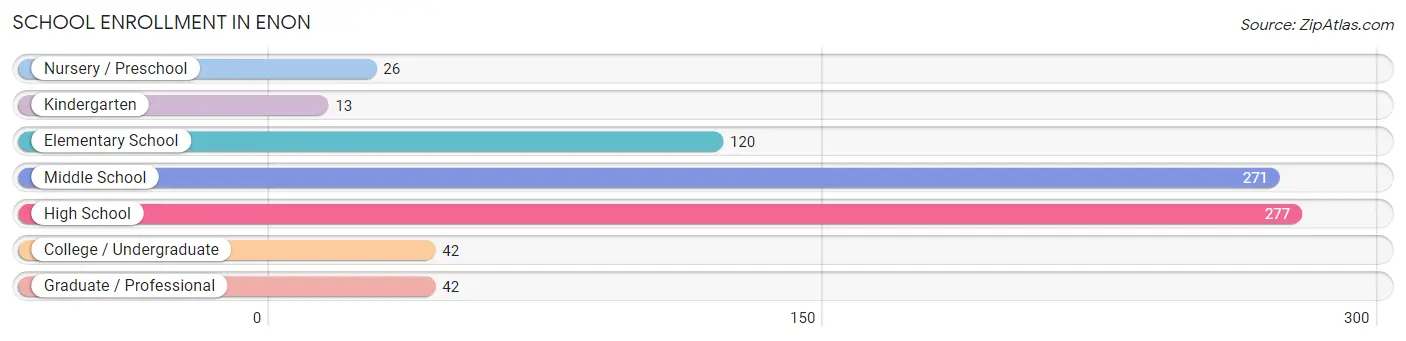
School Enrollment in Enon
The most common levels of schooling among the 791 students in Enon are high school (277 | 35.0%), middle school (271 | 34.3%), and elementary school (120 | 15.2%).
| School Level | # Students | % Students |
| Nursery / Preschool | 26 | 3.3% |
| Kindergarten | 13 | 1.6% |
| Elementary School | 120 | 15.2% |
| Middle School | 271 | 34.3% |
| High School | 277 | 35.0% |
| College / Undergraduate | 42 | 5.3% |
| Graduate / Professional | 42 | 5.3% |
| Total | 791 | 100.0% |
School Enrollment by Age by Funding Source in Enon
Out of a total of 791 students who are enrolled in schools in Enon, 69 (8.7%) attend a private institution, while the remaining 722 (91.3%) are enrolled in public schools. The age group of 15 to 17 year olds has the highest likelihood of being enrolled in private schools, with 53 (22.6% in the age bracket) enrolled. Conversely, the age group of 3 to 4 year olds has the lowest likelihood of being enrolled in a private school, with 18 (100.0% in the age bracket) attending a public institution.
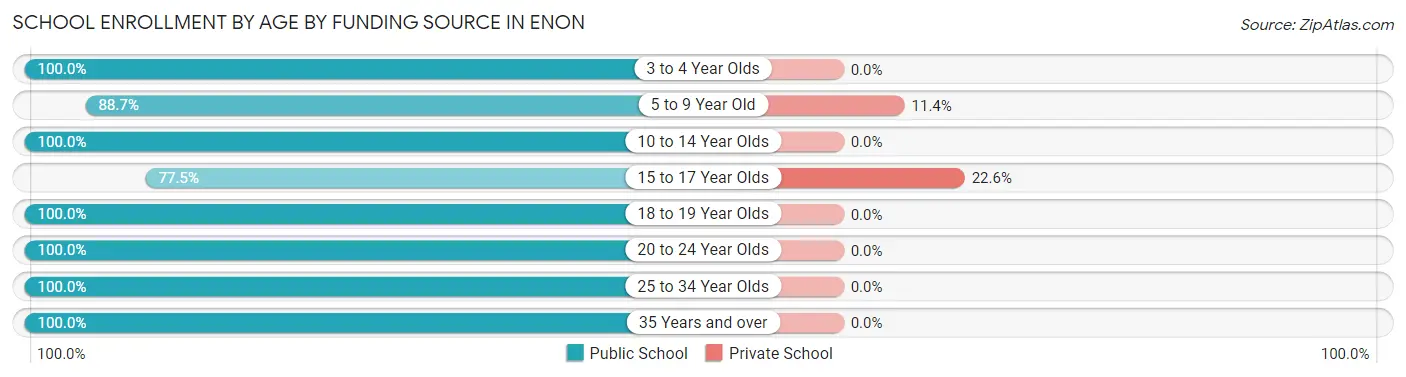
| Age Bracket | Public School | Private School |
| 3 to 4 Year Olds | 18 (100.0%) | 0 (0.0%) |
| 5 to 9 Year Old | 125 (88.6%) | 16 (11.4%) |
| 10 to 14 Year Olds | 283 (100.0%) | 0 (0.0%) |
| 15 to 17 Year Olds | 182 (77.4%) | 53 (22.6%) |
| 18 to 19 Year Olds | 30 (100.0%) | 0 (0.0%) |
| 20 to 24 Year Olds | 3 (100.0%) | 0 (0.0%) |
| 25 to 34 Year Olds | 31 (100.0%) | 0 (0.0%) |
| 35 Years and over | 50 (100.0%) | 0 (0.0%) |
| Total | 722 (91.3%) | 69 (8.7%) |
Educational Attainment by Field of Study in Enon
Business (174 | 16.5%), social sciences (157 | 14.8%), bio, nature & agricultural (125 | 11.8%), computers & mathematics (104 | 9.8%), and arts & humanities (99 | 9.4%) are the most common fields of study among 1,057 individuals in Enon who have obtained a bachelor's degree or higher.
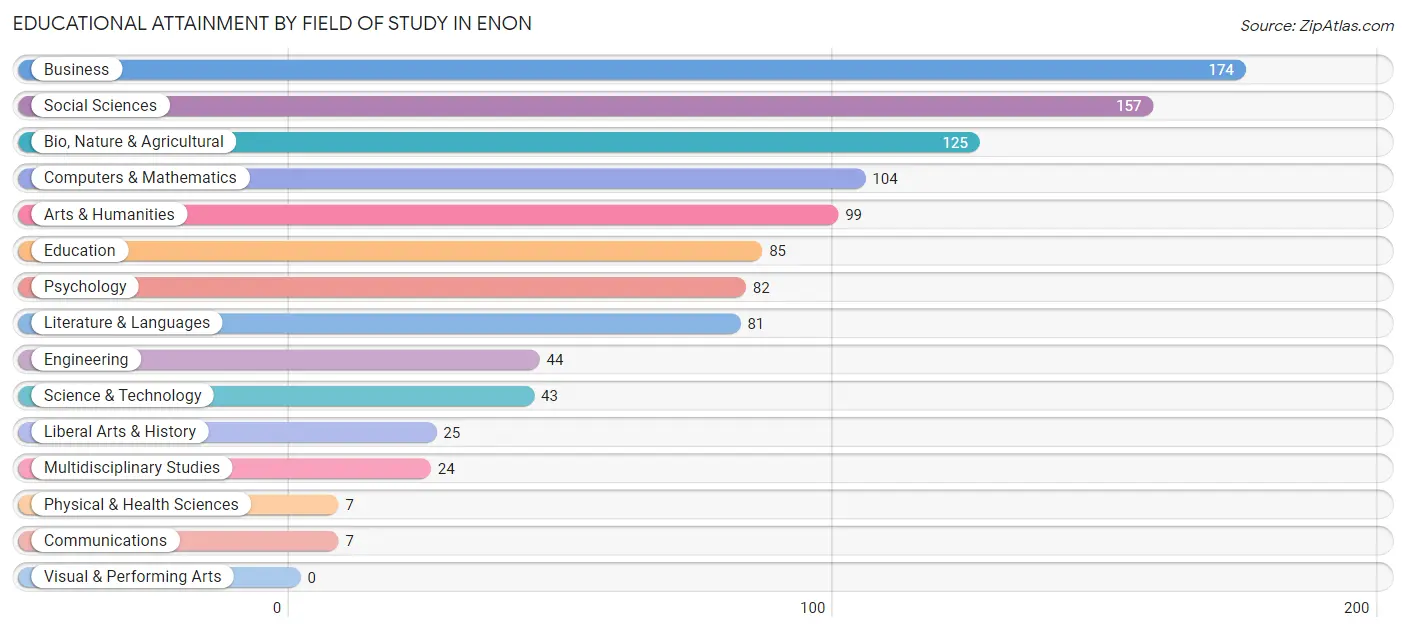
| Field of Study | # Graduates | % Graduates |
| Computers & Mathematics | 104 | 9.8% |
| Bio, Nature & Agricultural | 125 | 11.8% |
| Physical & Health Sciences | 7 | 0.7% |
| Psychology | 82 | 7.8% |
| Social Sciences | 157 | 14.8% |
| Engineering | 44 | 4.2% |
| Multidisciplinary Studies | 24 | 2.3% |
| Science & Technology | 43 | 4.1% |
| Business | 174 | 16.5% |
| Education | 85 | 8.0% |
| Literature & Languages | 81 | 7.7% |
| Liberal Arts & History | 25 | 2.4% |
| Visual & Performing Arts | 0 | 0.0% |
| Communications | 7 | 0.7% |
| Arts & Humanities | 99 | 9.4% |
| Total | 1,057 | 100.0% |
Transportation & Commute in Enon
Vehicle Availability by Sex in Enon
The most prevalent vehicle ownership categories in Enon are males with 2 vehicles (510, accounting for 49.0%) and females with 2 vehicles (343, making up 54.3%).
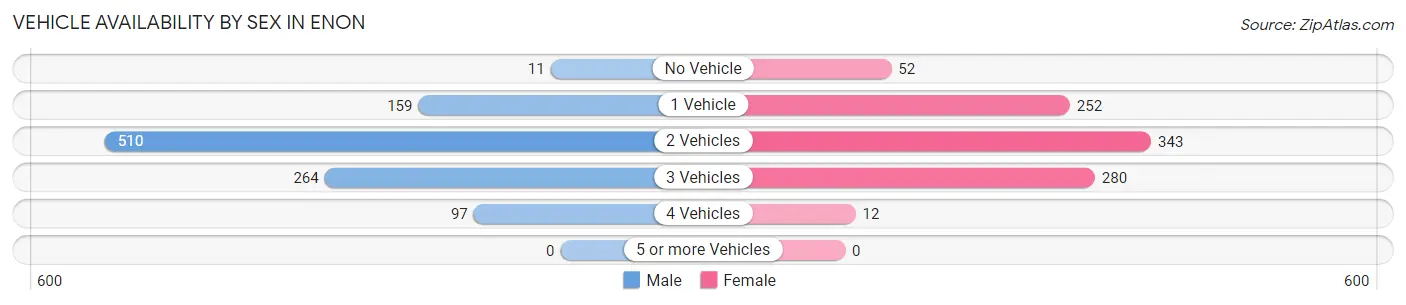
| Vehicles Available | Male | Female |
| No Vehicle | 11 (1.1%) | 52 (5.5%) |
| 1 Vehicle | 159 (15.3%) | 252 (26.8%) |
| 2 Vehicles | 510 (49.0%) | 343 (36.5%) |
| 3 Vehicles | 264 (25.4%) | 280 (29.8%) |
| 4 Vehicles | 97 (9.3%) | 12 (1.3%) |
| 5 or more Vehicles | 0 (0.0%) | 0 (0.0%) |
| Total | 1,041 (100.0%) | 939 (100.0%) |
Commute Time in Enon
The most frequently occuring commute durations in Enon are 20 to 24 minutes (517 commuters, 28.4%), 30 to 34 minutes (264 commuters, 14.5%), and 5 to 9 minutes (196 commuters, 10.8%).
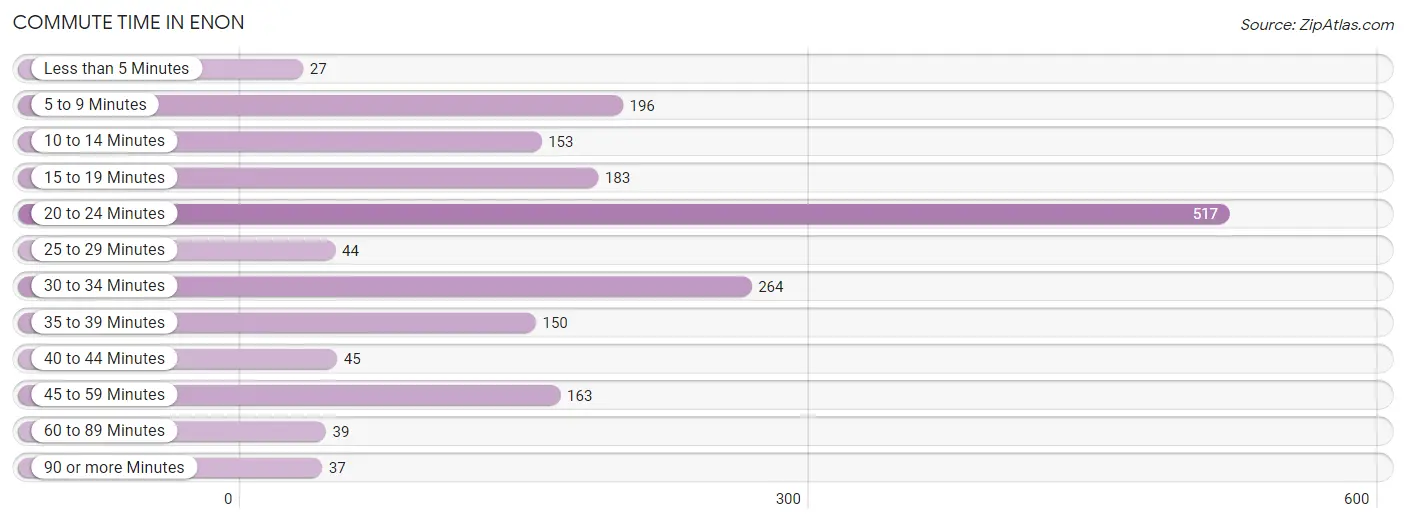
| Commute Time | # Commuters | % Commuters |
| Less than 5 Minutes | 27 | 1.5% |
| 5 to 9 Minutes | 196 | 10.8% |
| 10 to 14 Minutes | 153 | 8.4% |
| 15 to 19 Minutes | 183 | 10.1% |
| 20 to 24 Minutes | 517 | 28.4% |
| 25 to 29 Minutes | 44 | 2.4% |
| 30 to 34 Minutes | 264 | 14.5% |
| 35 to 39 Minutes | 150 | 8.3% |
| 40 to 44 Minutes | 45 | 2.5% |
| 45 to 59 Minutes | 163 | 9.0% |
| 60 to 89 Minutes | 39 | 2.1% |
| 90 or more Minutes | 37 | 2.0% |
Commute Time by Sex in Enon
The most common commute times in Enon are 20 to 24 minutes (340 commuters, 34.7%) for males and 20 to 24 minutes (177 commuters, 21.1%) for females.
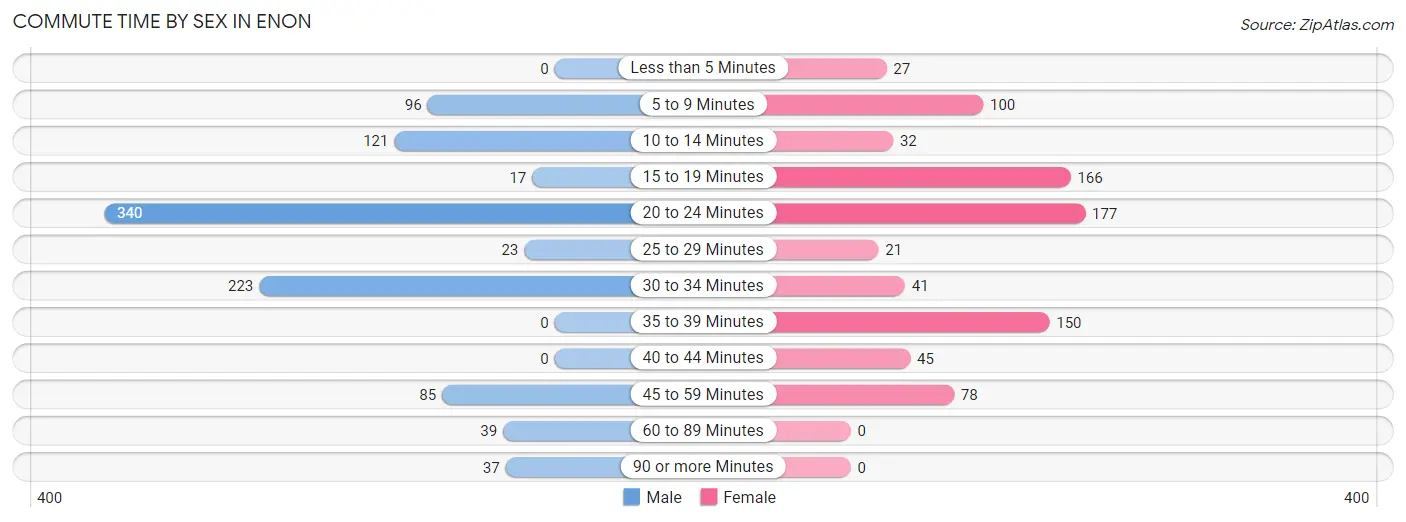
| Commute Time | Male | Female |
| Less than 5 Minutes | 0 (0.0%) | 27 (3.2%) |
| 5 to 9 Minutes | 96 (9.8%) | 100 (11.9%) |
| 10 to 14 Minutes | 121 (12.3%) | 32 (3.8%) |
| 15 to 19 Minutes | 17 (1.7%) | 166 (19.8%) |
| 20 to 24 Minutes | 340 (34.7%) | 177 (21.1%) |
| 25 to 29 Minutes | 23 (2.3%) | 21 (2.5%) |
| 30 to 34 Minutes | 223 (22.7%) | 41 (4.9%) |
| 35 to 39 Minutes | 0 (0.0%) | 150 (17.9%) |
| 40 to 44 Minutes | 0 (0.0%) | 45 (5.4%) |
| 45 to 59 Minutes | 85 (8.7%) | 78 (9.3%) |
| 60 to 89 Minutes | 39 (4.0%) | 0 (0.0%) |
| 90 or more Minutes | 37 (3.8%) | 0 (0.0%) |
Time of Departure to Work by Sex in Enon
The most frequent times of departure to work in Enon are 8:00 AM to 8:29 AM (191, 19.5%) for males and 7:30 AM to 7:59 AM (271, 32.4%) for females.
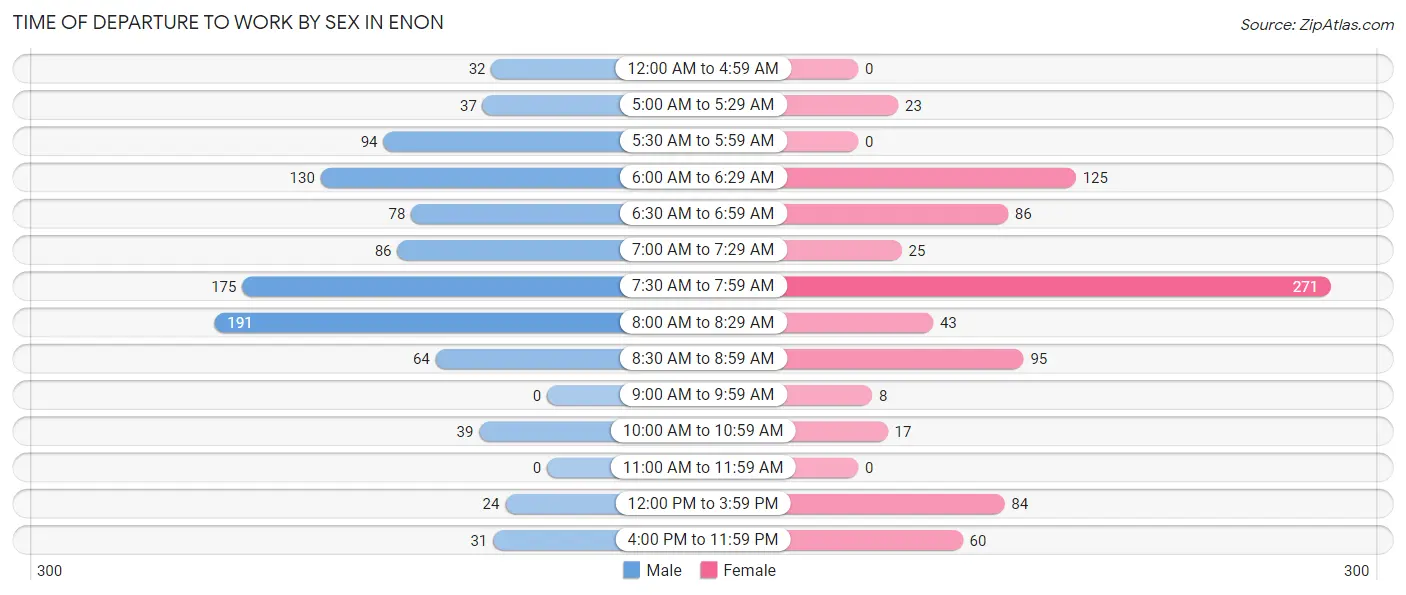
| Time of Departure | Male | Female |
| 12:00 AM to 4:59 AM | 32 (3.3%) | 0 (0.0%) |
| 5:00 AM to 5:29 AM | 37 (3.8%) | 23 (2.8%) |
| 5:30 AM to 5:59 AM | 94 (9.6%) | 0 (0.0%) |
| 6:00 AM to 6:29 AM | 130 (13.3%) | 125 (14.9%) |
| 6:30 AM to 6:59 AM | 78 (8.0%) | 86 (10.3%) |
| 7:00 AM to 7:29 AM | 86 (8.8%) | 25 (3.0%) |
| 7:30 AM to 7:59 AM | 175 (17.8%) | 271 (32.4%) |
| 8:00 AM to 8:29 AM | 191 (19.5%) | 43 (5.1%) |
| 8:30 AM to 8:59 AM | 64 (6.5%) | 95 (11.4%) |
| 9:00 AM to 9:59 AM | 0 (0.0%) | 8 (1.0%) |
| 10:00 AM to 10:59 AM | 39 (4.0%) | 17 (2.0%) |
| 11:00 AM to 11:59 AM | 0 (0.0%) | 0 (0.0%) |
| 12:00 PM to 3:59 PM | 24 (2.5%) | 84 (10.0%) |
| 4:00 PM to 11:59 PM | 31 (3.2%) | 60 (7.2%) |
| Total | 981 (100.0%) | 837 (100.0%) |
Housing Occupancy in Enon
Occupancy by Ownership in Enon
Of the total 1,690 dwellings in Enon, owner-occupied units account for 1,089 (64.4%), while renter-occupied units make up 601 (35.6%).
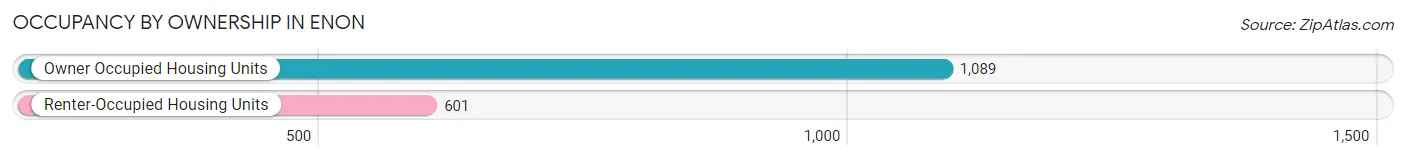
| Occupancy | # Housing Units | % Housing Units |
| Owner Occupied Housing Units | 1,089 | 64.4% |
| Renter-Occupied Housing Units | 601 | 35.6% |
| Total Occupied Housing Units | 1,690 | 100.0% |
Occupancy by Household Size in Enon
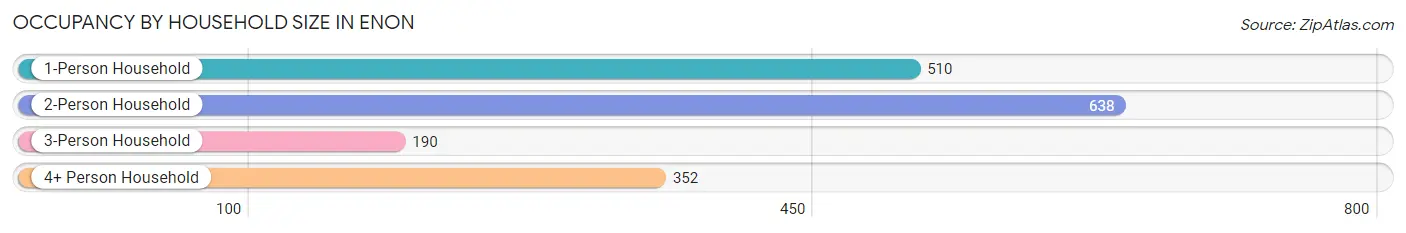
| Household Size | # Housing Units | % Housing Units |
| 1-Person Household | 510 | 30.2% |
| 2-Person Household | 638 | 37.8% |
| 3-Person Household | 190 | 11.2% |
| 4+ Person Household | 352 | 20.8% |
| Total Housing Units | 1,690 | 100.0% |
Occupancy by Ownership by Household Size in Enon
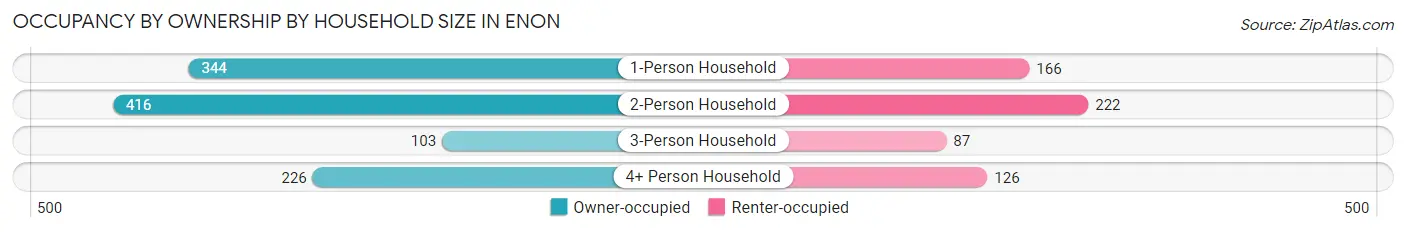
| Household Size | Owner-occupied | Renter-occupied |
| 1-Person Household | 344 (67.4%) | 166 (32.6%) |
| 2-Person Household | 416 (65.2%) | 222 (34.8%) |
| 3-Person Household | 103 (54.2%) | 87 (45.8%) |
| 4+ Person Household | 226 (64.2%) | 126 (35.8%) |
| Total Housing Units | 1,089 (64.4%) | 601 (35.6%) |
Occupancy by Educational Attainment in Enon
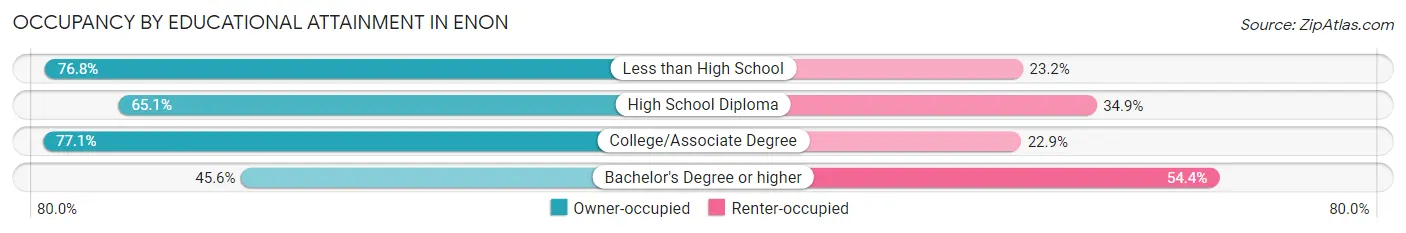
| Household Size | Owner-occupied | Renter-occupied |
| Less than High School | 76 (76.8%) | 23 (23.2%) |
| High School Diploma | 222 (65.1%) | 119 (34.9%) |
| College/Associate Degree | 541 (77.1%) | 161 (22.9%) |
| Bachelor's Degree or higher | 250 (45.6%) | 298 (54.4%) |
Occupancy by Age of Householder in Enon
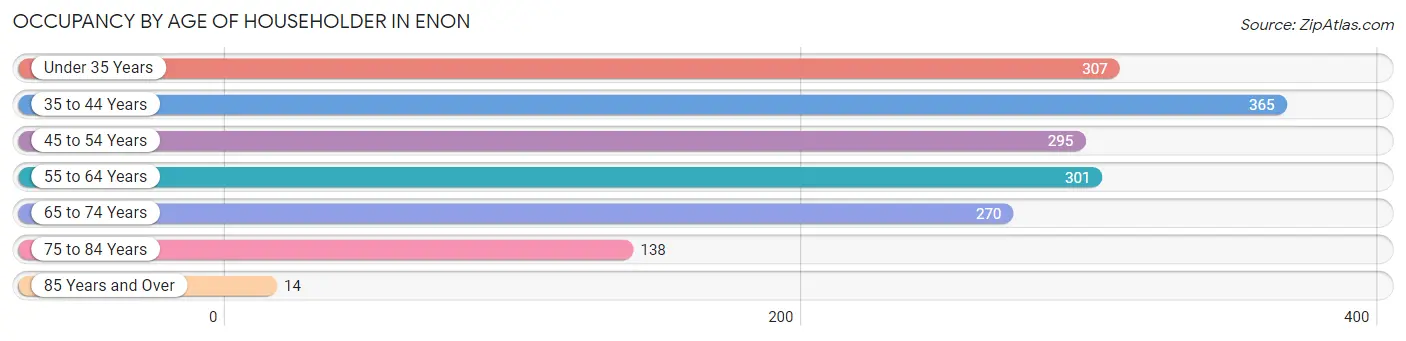
| Age Bracket | # Households | % Households |
| Under 35 Years | 307 | 18.2% |
| 35 to 44 Years | 365 | 21.6% |
| 45 to 54 Years | 295 | 17.5% |
| 55 to 64 Years | 301 | 17.8% |
| 65 to 74 Years | 270 | 16.0% |
| 75 to 84 Years | 138 | 8.2% |
| 85 Years and Over | 14 | 0.8% |
| Total | 1,690 | 100.0% |
Housing Finances in Enon
Median Income by Occupancy in Enon
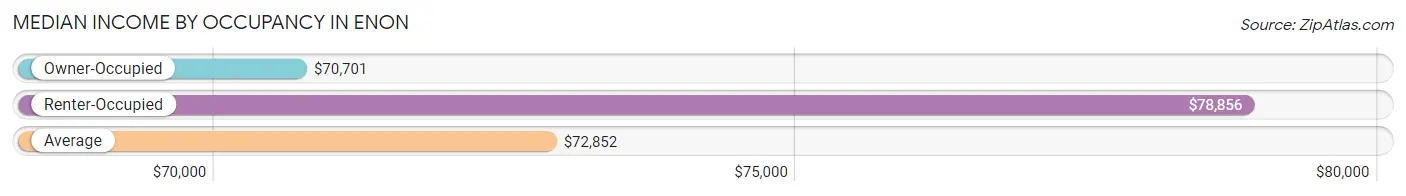
| Occupancy Type | # Households | Median Income |
| Owner-Occupied | 1,089 (64.4%) | $70,701 |
| Renter-Occupied | 601 (35.6%) | $78,856 |
| Average | 1,690 (100.0%) | $72,852 |
Occupancy by Householder Income Bracket in Enon
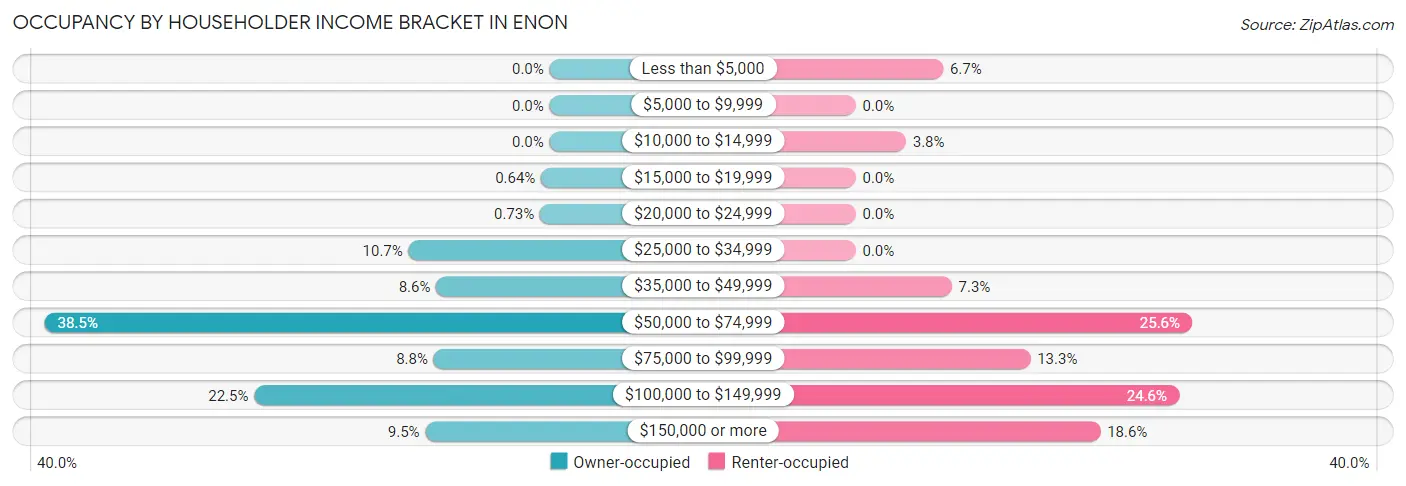
| Income Bracket | Owner-occupied | Renter-occupied |
| Less than $5,000 | 0 (0.0%) | 40 (6.7%) |
| $5,000 to $9,999 | 0 (0.0%) | 0 (0.0%) |
| $10,000 to $14,999 | 0 (0.0%) | 23 (3.8%) |
| $15,000 to $19,999 | 7 (0.6%) | 0 (0.0%) |
| $20,000 to $24,999 | 8 (0.7%) | 0 (0.0%) |
| $25,000 to $34,999 | 117 (10.7%) | 0 (0.0%) |
| $35,000 to $49,999 | 94 (8.6%) | 44 (7.3%) |
| $50,000 to $74,999 | 419 (38.5%) | 154 (25.6%) |
| $75,000 to $99,999 | 96 (8.8%) | 80 (13.3%) |
| $100,000 to $149,999 | 245 (22.5%) | 148 (24.6%) |
| $150,000 or more | 103 (9.5%) | 112 (18.6%) |
| Total | 1,089 (100.0%) | 601 (100.0%) |
Monthly Housing Cost Tiers in Enon
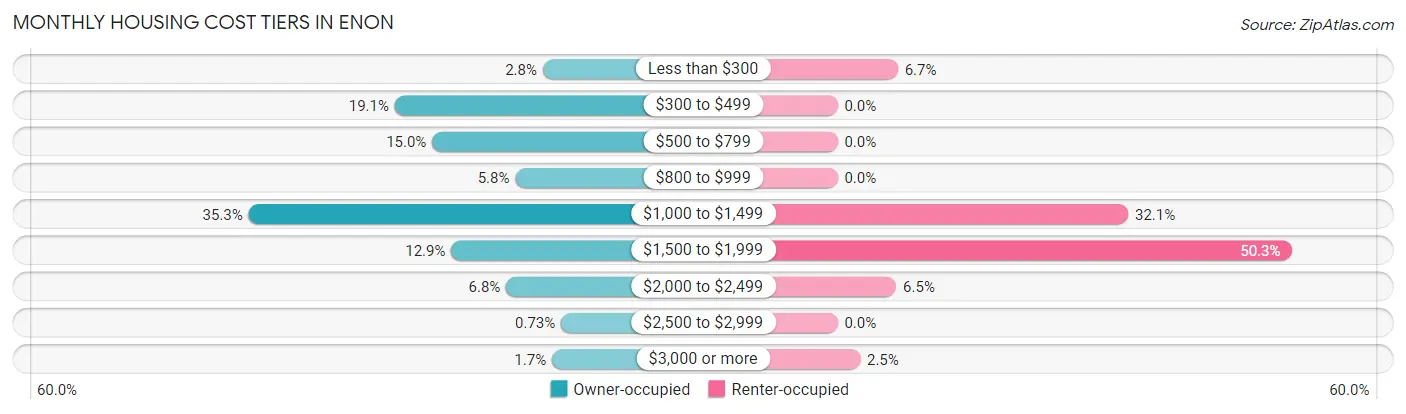
| Monthly Cost | Owner-occupied | Renter-occupied |
| Less than $300 | 30 (2.8%) | 40 (6.7%) |
| $300 to $499 | 208 (19.1%) | 0 (0.0%) |
| $500 to $799 | 163 (15.0%) | 0 (0.0%) |
| $800 to $999 | 63 (5.8%) | 0 (0.0%) |
| $1,000 to $1,499 | 384 (35.3%) | 193 (32.1%) |
| $1,500 to $1,999 | 140 (12.9%) | 302 (50.2%) |
| $2,000 to $2,499 | 74 (6.8%) | 39 (6.5%) |
| $2,500 to $2,999 | 8 (0.7%) | 0 (0.0%) |
| $3,000 or more | 19 (1.7%) | 15 (2.5%) |
| Total | 1,089 (100.0%) | 601 (100.0%) |
Physical Housing Characteristics in Enon
Housing Structures in Enon
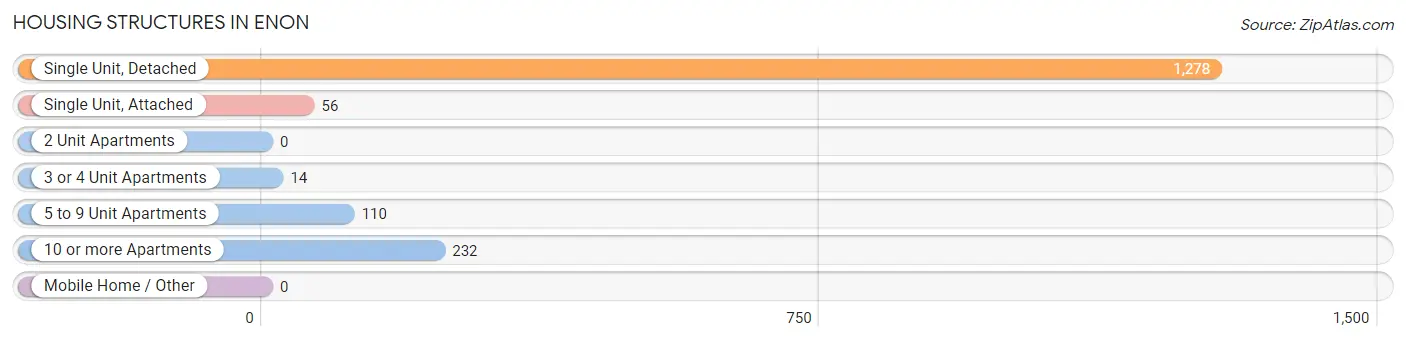
| Structure Type | # Housing Units | % Housing Units |
| Single Unit, Detached | 1,278 | 75.6% |
| Single Unit, Attached | 56 | 3.3% |
| 2 Unit Apartments | 0 | 0.0% |
| 3 or 4 Unit Apartments | 14 | 0.8% |
| 5 to 9 Unit Apartments | 110 | 6.5% |
| 10 or more Apartments | 232 | 13.7% |
| Mobile Home / Other | 0 | 0.0% |
| Total | 1,690 | 100.0% |
Housing Structures by Occupancy in Enon
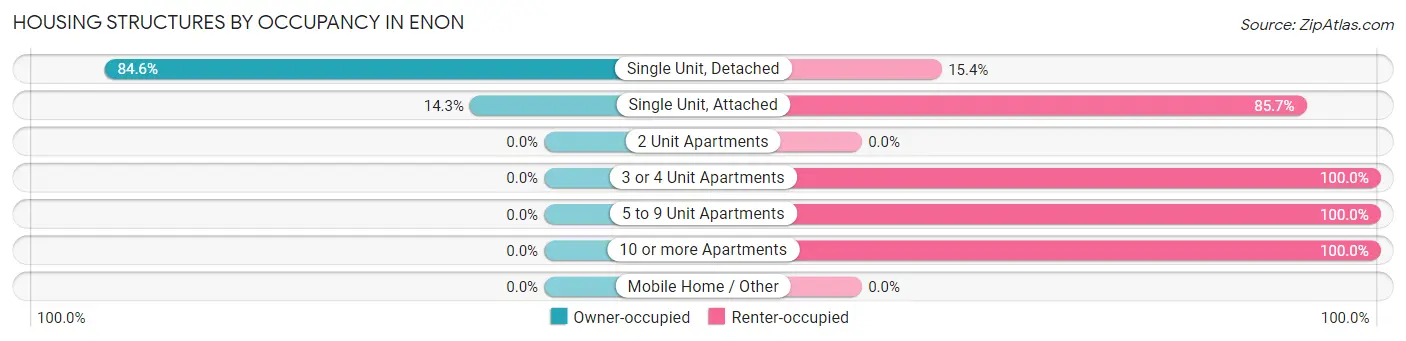
| Structure Type | Owner-occupied | Renter-occupied |
| Single Unit, Detached | 1,081 (84.6%) | 197 (15.4%) |
| Single Unit, Attached | 8 (14.3%) | 48 (85.7%) |
| 2 Unit Apartments | 0 (0.0%) | 0 (0.0%) |
| 3 or 4 Unit Apartments | 0 (0.0%) | 14 (100.0%) |
| 5 to 9 Unit Apartments | 0 (0.0%) | 110 (100.0%) |
| 10 or more Apartments | 0 (0.0%) | 232 (100.0%) |
| Mobile Home / Other | 0 (0.0%) | 0 (0.0%) |
| Total | 1,089 (64.4%) | 601 (35.6%) |
Housing Structures by Number of Rooms in Enon
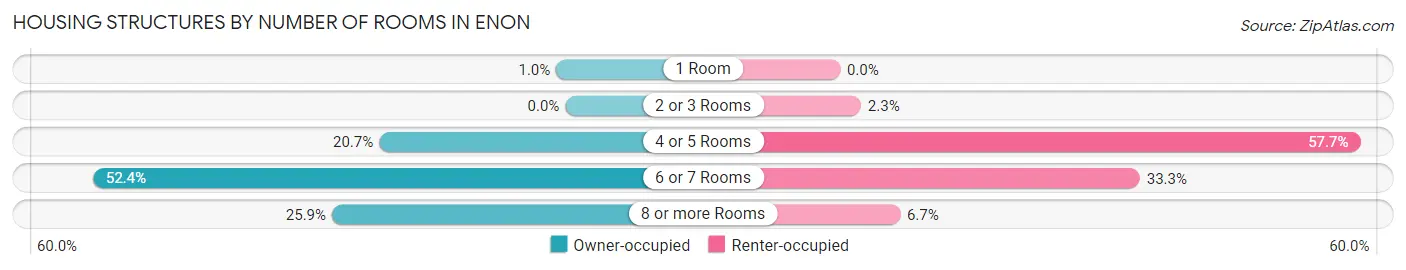
| Number of Rooms | Owner-occupied | Renter-occupied |
| 1 Room | 11 (1.0%) | 0 (0.0%) |
| 2 or 3 Rooms | 0 (0.0%) | 14 (2.3%) |
| 4 or 5 Rooms | 225 (20.7%) | 347 (57.7%) |
| 6 or 7 Rooms | 571 (52.4%) | 200 (33.3%) |
| 8 or more Rooms | 282 (25.9%) | 40 (6.7%) |
| Total | 1,089 (100.0%) | 601 (100.0%) |
Housing Structure by Heating Type in Enon
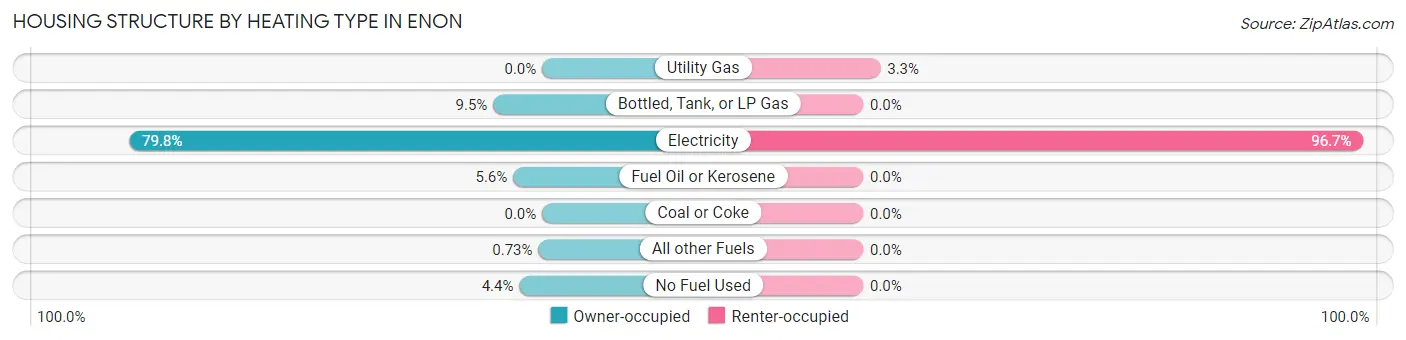
| Heating Type | Owner-occupied | Renter-occupied |
| Utility Gas | 0 (0.0%) | 20 (3.3%) |
| Bottled, Tank, or LP Gas | 103 (9.5%) | 0 (0.0%) |
| Electricity | 869 (79.8%) | 581 (96.7%) |
| Fuel Oil or Kerosene | 61 (5.6%) | 0 (0.0%) |
| Coal or Coke | 0 (0.0%) | 0 (0.0%) |
| All other Fuels | 8 (0.7%) | 0 (0.0%) |
| No Fuel Used | 48 (4.4%) | 0 (0.0%) |
| Total | 1,089 (100.0%) | 601 (100.0%) |
Household Vehicle Usage in Enon
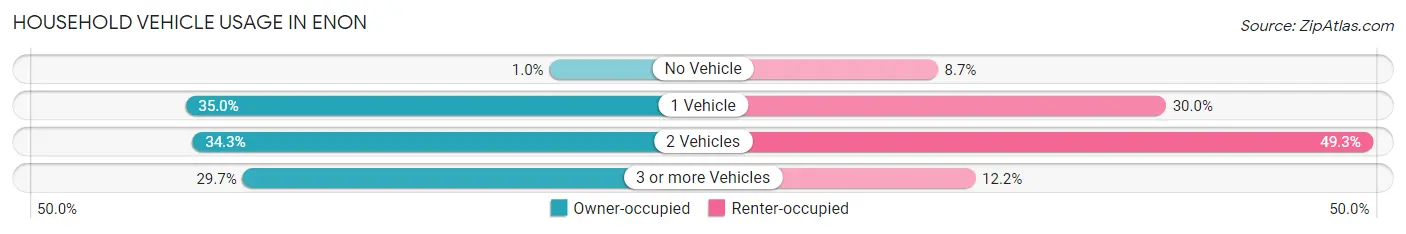
| Vehicles per Household | Owner-occupied | Renter-occupied |
| No Vehicle | 11 (1.0%) | 52 (8.6%) |
| 1 Vehicle | 381 (35.0%) | 180 (29.9%) |
| 2 Vehicles | 374 (34.3%) | 296 (49.2%) |
| 3 or more Vehicles | 323 (29.7%) | 73 (12.1%) |
| Total | 1,089 (100.0%) | 601 (100.0%) |
Real Estate & Mortgages in Enon
Real Estate and Mortgage Overview in Enon
| Characteristic | Without Mortgage | With Mortgage |
| Housing Units | 340 | 749 |
| Median Property Value | $228,100 | $216,200 |
| Median Household Income | $83,750 | $56 |
| Monthly Housing Costs | $428 | $19 |
| Real Estate Taxes | $2,065 | $0 |
Property Value by Mortgage Status in Enon
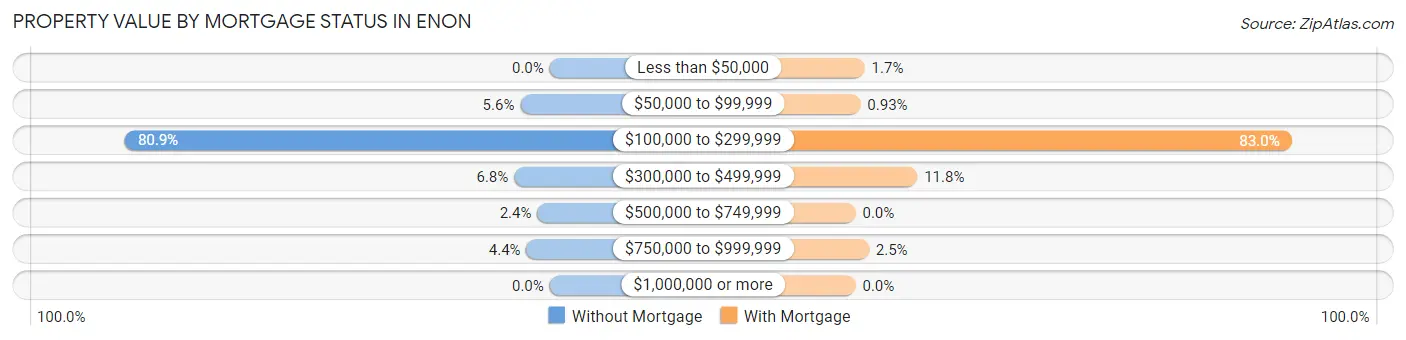
| Property Value | Without Mortgage | With Mortgage |
| Less than $50,000 | 0 (0.0%) | 13 (1.7%) |
| $50,000 to $99,999 | 19 (5.6%) | 7 (0.9%) |
| $100,000 to $299,999 | 275 (80.9%) | 622 (83.0%) |
| $300,000 to $499,999 | 23 (6.8%) | 88 (11.7%) |
| $500,000 to $749,999 | 8 (2.4%) | 0 (0.0%) |
| $750,000 to $999,999 | 15 (4.4%) | 19 (2.5%) |
| $1,000,000 or more | 0 (0.0%) | 0 (0.0%) |
| Total | 340 (100.0%) | 749 (100.0%) |
Household Income by Mortgage Status in Enon
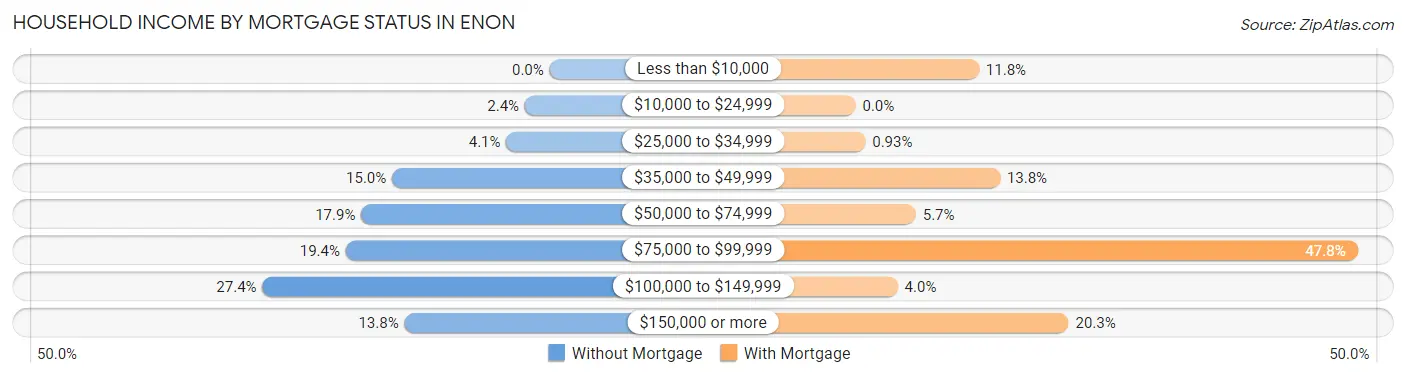
| Household Income | Without Mortgage | With Mortgage |
| Less than $10,000 | 0 (0.0%) | 88 (11.7%) |
| $10,000 to $24,999 | 8 (2.4%) | 0 (0.0%) |
| $25,000 to $34,999 | 14 (4.1%) | 7 (0.9%) |
| $35,000 to $49,999 | 51 (15.0%) | 103 (13.8%) |
| $50,000 to $74,999 | 61 (17.9%) | 43 (5.7%) |
| $75,000 to $99,999 | 66 (19.4%) | 358 (47.8%) |
| $100,000 to $149,999 | 93 (27.4%) | 30 (4.0%) |
| $150,000 or more | 47 (13.8%) | 152 (20.3%) |
| Total | 340 (100.0%) | 749 (100.0%) |
Property Value to Household Income Ratio in Enon
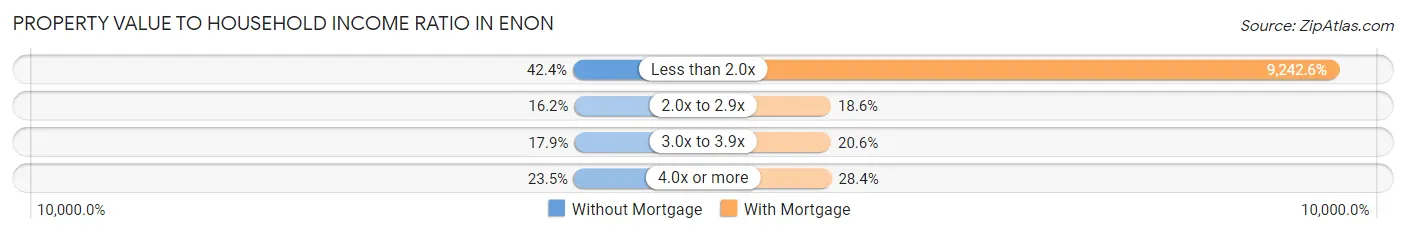
| Value-to-Income Ratio | Without Mortgage | With Mortgage |
| Less than 2.0x | 144 (42.3%) | 69,227 (9,242.6%) |
| 2.0x to 2.9x | 55 (16.2%) | 139 (18.6%) |
| 3.0x to 3.9x | 61 (17.9%) | 154 (20.6%) |
| 4.0x or more | 80 (23.5%) | 213 (28.4%) |
| Total | 340 (100.0%) | 749 (100.0%) |
Real Estate Taxes by Mortgage Status in Enon
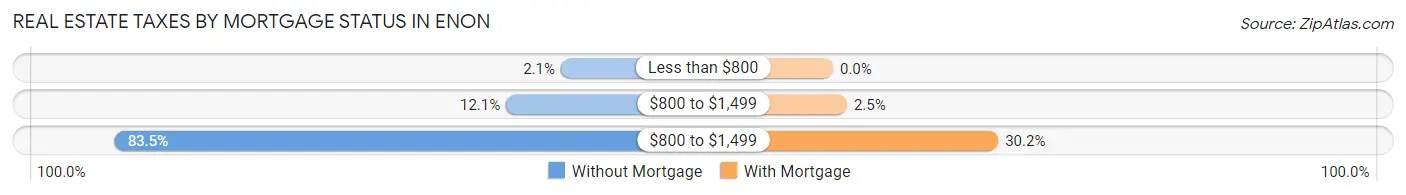
| Property Taxes | Without Mortgage | With Mortgage |
| Less than $800 | 7 (2.1%) | 0 (0.0%) |
| $800 to $1,499 | 41 (12.1%) | 19 (2.5%) |
| $800 to $1,499 | 284 (83.5%) | 226 (30.2%) |
| Total | 340 (100.0%) | 749 (100.0%) |
Health & Disability in Enon
Health Insurance Coverage by Age in Enon
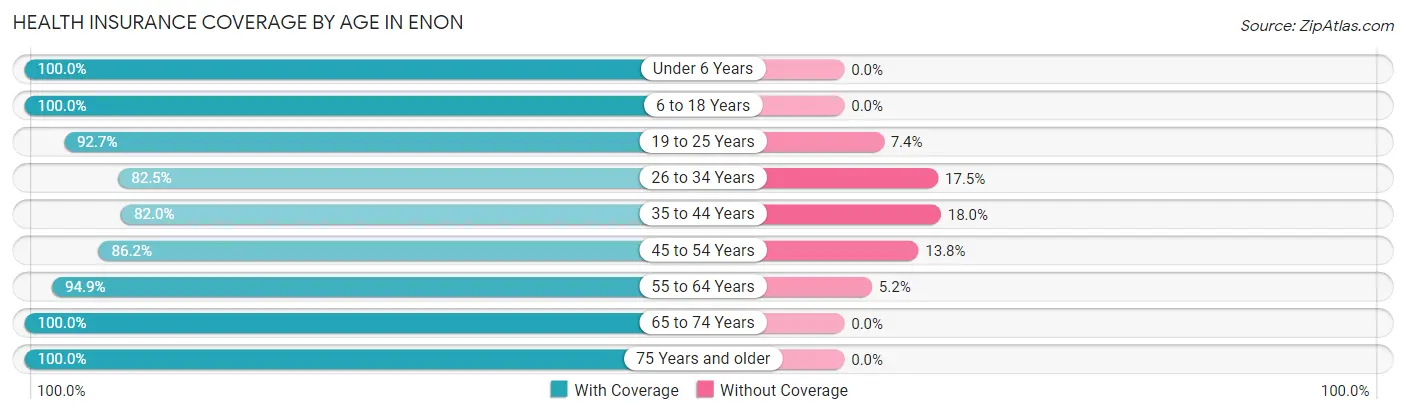
| Age Bracket | With Coverage | Without Coverage |
| Under 6 Years | 210 (100.0%) | 0 (0.0%) |
| 6 to 18 Years | 755 (100.0%) | 0 (0.0%) |
| 19 to 25 Years | 252 (92.6%) | 20 (7.3%) |
| 26 to 34 Years | 316 (82.5%) | 67 (17.5%) |
| 35 to 44 Years | 474 (82.0%) | 104 (18.0%) |
| 45 to 54 Years | 412 (86.2%) | 66 (13.8%) |
| 55 to 64 Years | 534 (94.9%) | 29 (5.1%) |
| 65 to 74 Years | 446 (100.0%) | 0 (0.0%) |
| 75 Years and older | 214 (100.0%) | 0 (0.0%) |
| Total | 3,613 (92.7%) | 286 (7.3%) |
Health Insurance Coverage by Citizenship Status in Enon
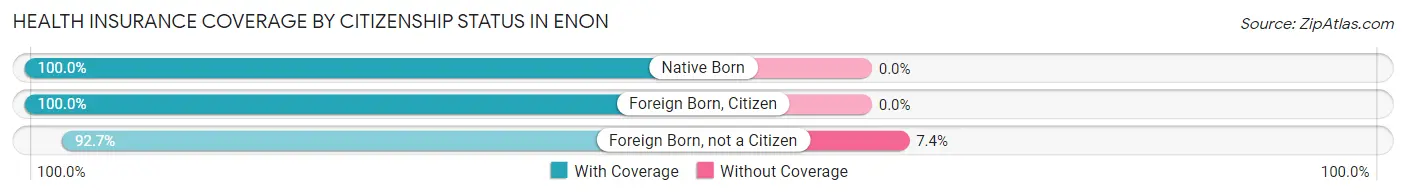
| Citizenship Status | With Coverage | Without Coverage |
| Native Born | 210 (100.0%) | 0 (0.0%) |
| Foreign Born, Citizen | 755 (100.0%) | 0 (0.0%) |
| Foreign Born, not a Citizen | 252 (92.6%) | 20 (7.3%) |
Health Insurance Coverage by Household Income in Enon
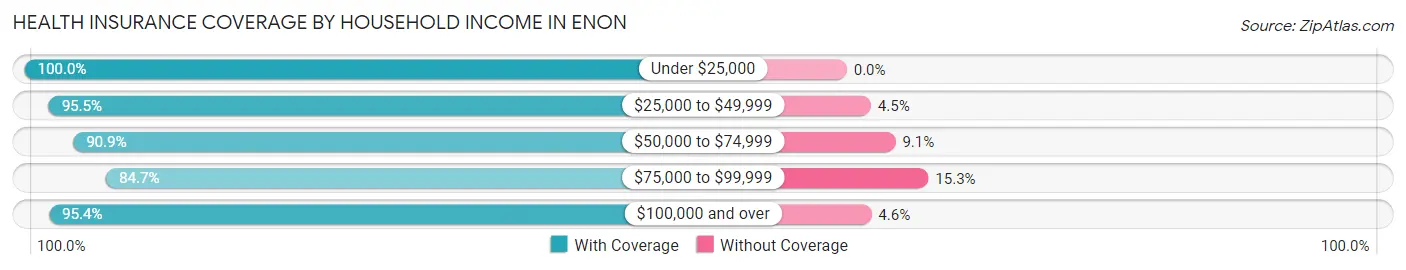
| Household Income | With Coverage | Without Coverage |
| Under $25,000 | 148 (100.0%) | 0 (0.0%) |
| $25,000 to $49,999 | 465 (95.5%) | 22 (4.5%) |
| $50,000 to $74,999 | 1,246 (90.9%) | 125 (9.1%) |
| $75,000 to $99,999 | 410 (84.7%) | 74 (15.3%) |
| $100,000 and over | 1,344 (95.4%) | 65 (4.6%) |
Public vs Private Health Insurance Coverage by Age in Enon
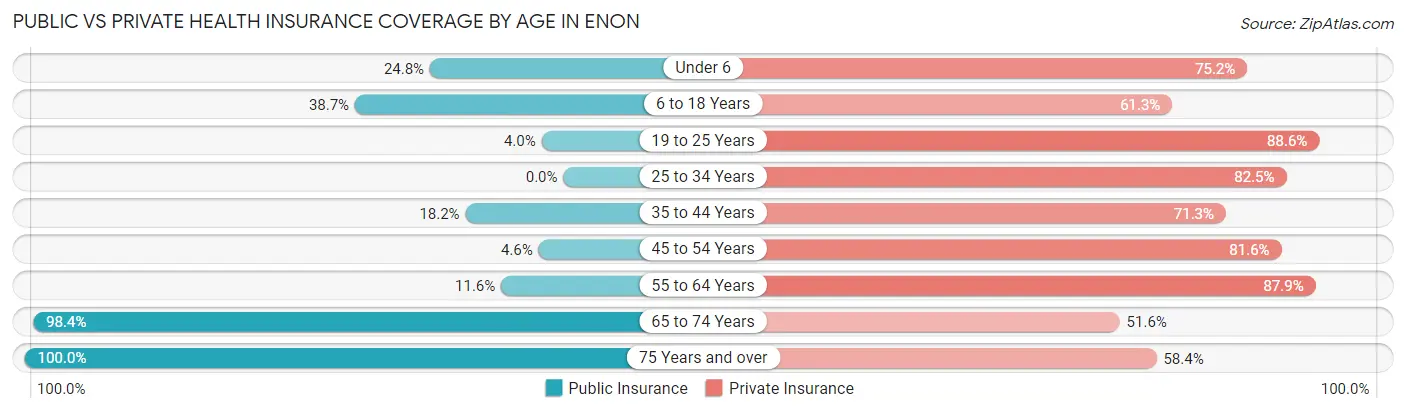
| Age Bracket | Public Insurance | Private Insurance |
| Under 6 | 52 (24.8%) | 158 (75.2%) |
| 6 to 18 Years | 292 (38.7%) | 463 (61.3%) |
| 19 to 25 Years | 11 (4.0%) | 241 (88.6%) |
| 25 to 34 Years | 0 (0.0%) | 316 (82.5%) |
| 35 to 44 Years | 105 (18.2%) | 412 (71.3%) |
| 45 to 54 Years | 22 (4.6%) | 390 (81.6%) |
| 55 to 64 Years | 65 (11.6%) | 495 (87.9%) |
| 65 to 74 Years | 439 (98.4%) | 230 (51.6%) |
| 75 Years and over | 214 (100.0%) | 125 (58.4%) |
| Total | 1,200 (30.8%) | 2,830 (72.6%) |
Disability Status by Sex by Age in Enon
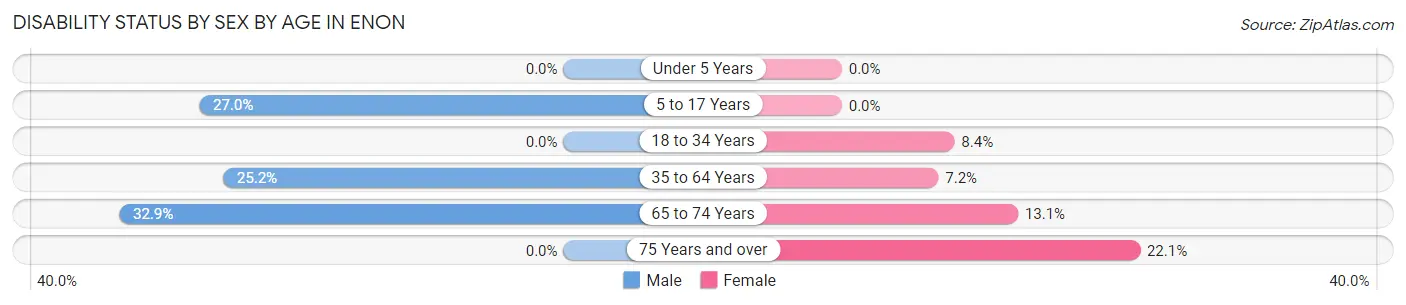
| Age Bracket | Male | Female |
| Under 5 Years | 0 (0.0%) | 0 (0.0%) |
| 5 to 17 Years | 96 (27.0%) | 0 (0.0%) |
| 18 to 34 Years | 0 (0.0%) | 30 (8.4%) |
| 35 to 64 Years | 190 (25.2%) | 62 (7.2%) |
| 65 to 74 Years | 104 (32.9%) | 17 (13.1%) |
| 75 Years and over | 0 (0.0%) | 31 (22.1%) |
Disability Class by Sex by Age in Enon
Disability Class: Hearing Difficulty
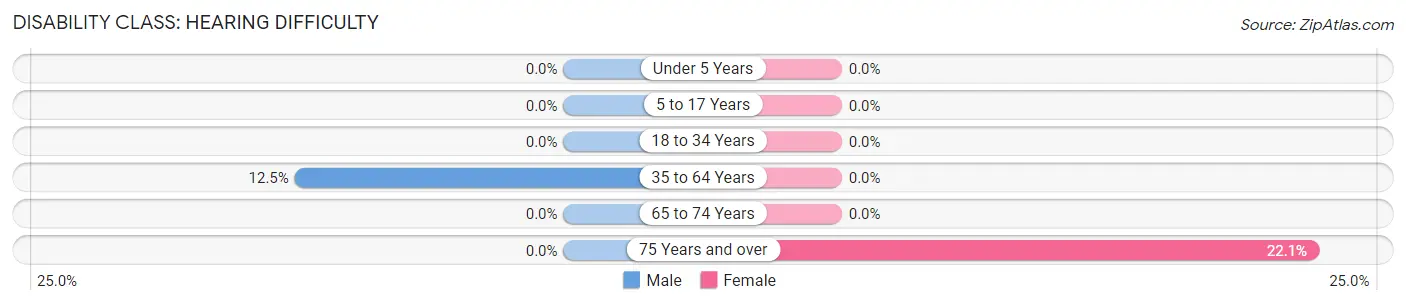
| Age Bracket | Male | Female |
| Under 5 Years | 0 (0.0%) | 0 (0.0%) |
| 5 to 17 Years | 0 (0.0%) | 0 (0.0%) |
| 18 to 34 Years | 0 (0.0%) | 0 (0.0%) |
| 35 to 64 Years | 94 (12.5%) | 0 (0.0%) |
| 65 to 74 Years | 0 (0.0%) | 0 (0.0%) |
| 75 Years and over | 0 (0.0%) | 31 (22.1%) |
Disability Class: Vision Difficulty
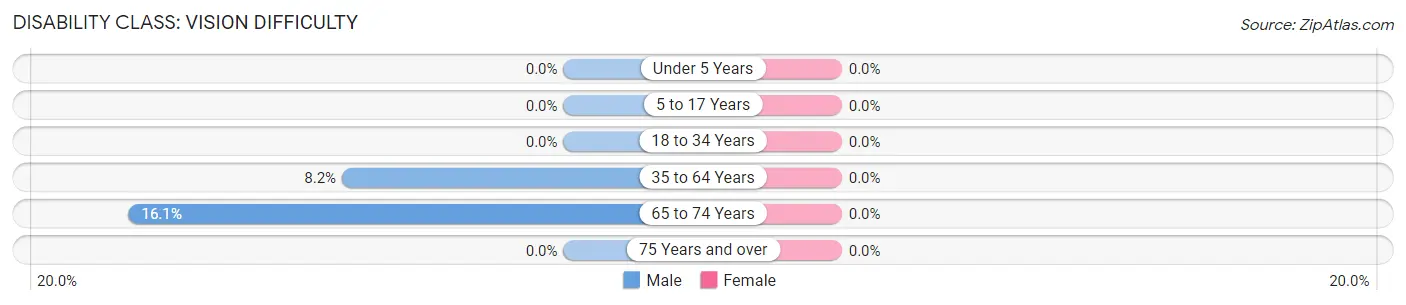
| Age Bracket | Male | Female |
| Under 5 Years | 0 (0.0%) | 0 (0.0%) |
| 5 to 17 Years | 0 (0.0%) | 0 (0.0%) |
| 18 to 34 Years | 0 (0.0%) | 0 (0.0%) |
| 35 to 64 Years | 62 (8.2%) | 0 (0.0%) |
| 65 to 74 Years | 51 (16.1%) | 0 (0.0%) |
| 75 Years and over | 0 (0.0%) | 0 (0.0%) |
Disability Class: Cognitive Difficulty
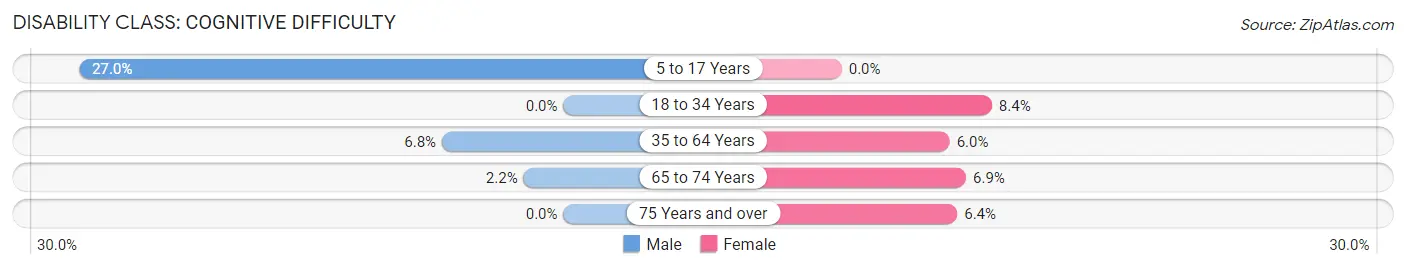
| Age Bracket | Male | Female |
| 5 to 17 Years | 96 (27.0%) | 0 (0.0%) |
| 18 to 34 Years | 0 (0.0%) | 30 (8.4%) |
| 35 to 64 Years | 51 (6.8%) | 52 (6.0%) |
| 65 to 74 Years | 7 (2.2%) | 9 (6.9%) |
| 75 Years and over | 0 (0.0%) | 9 (6.4%) |
Disability Class: Ambulatory Difficulty
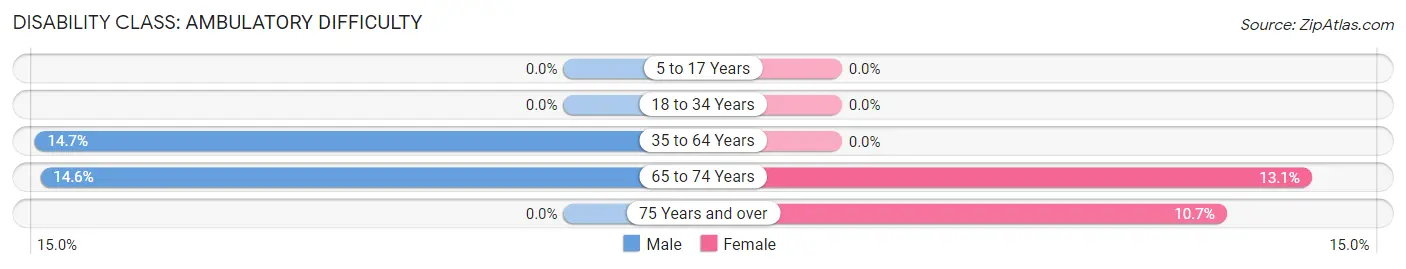
| Age Bracket | Male | Female |
| 5 to 17 Years | 0 (0.0%) | 0 (0.0%) |
| 18 to 34 Years | 0 (0.0%) | 0 (0.0%) |
| 35 to 64 Years | 111 (14.7%) | 0 (0.0%) |
| 65 to 74 Years | 46 (14.6%) | 17 (13.1%) |
| 75 Years and over | 0 (0.0%) | 15 (10.7%) |
Disability Class: Self-Care Difficulty
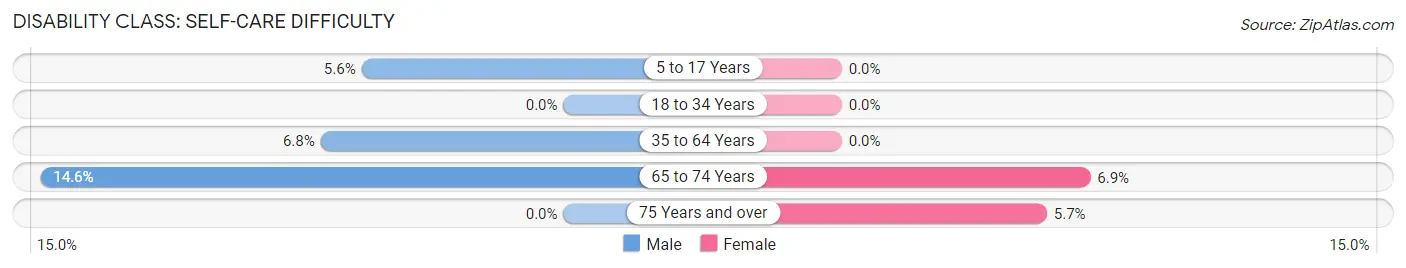
| Age Bracket | Male | Female |
| 5 to 17 Years | 20 (5.6%) | 0 (0.0%) |
| 18 to 34 Years | 0 (0.0%) | 0 (0.0%) |
| 35 to 64 Years | 51 (6.8%) | 0 (0.0%) |
| 65 to 74 Years | 46 (14.6%) | 9 (6.9%) |
| 75 Years and over | 0 (0.0%) | 8 (5.7%) |
Technology Access in Enon
Computing Device Access in Enon
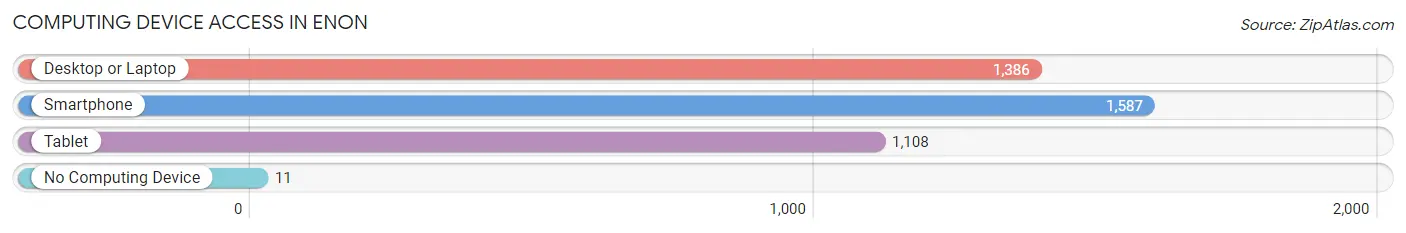
| Device Type | # Households | % Households |
| Desktop or Laptop | 1,386 | 82.0% |
| Smartphone | 1,587 | 93.9% |
| Tablet | 1,108 | 65.6% |
| No Computing Device | 11 | 0.6% |
| Total | 1,690 | 100.0% |
Internet Access in Enon
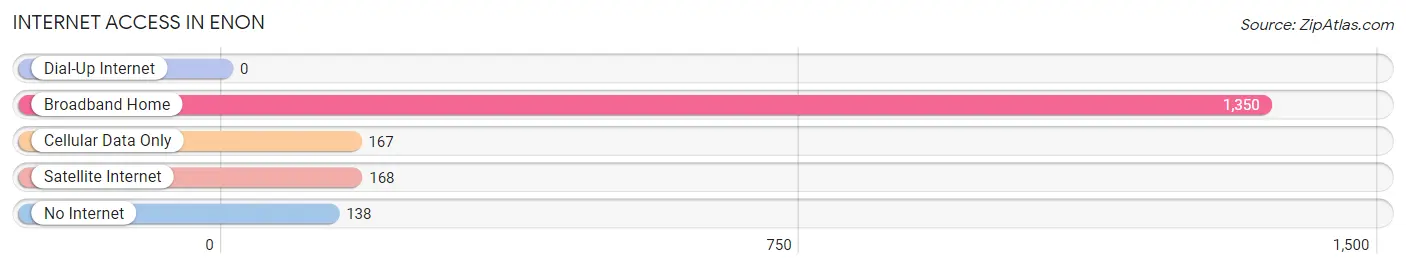
| Internet Type | # Households | % Households |
| Dial-Up Internet | 0 | 0.0% |
| Broadband Home | 1,350 | 79.9% |
| Cellular Data Only | 167 | 9.9% |
| Satellite Internet | 168 | 9.9% |
| No Internet | 138 | 8.2% |
| Total | 1,690 | 100.0% |
Enon Summary
Enon is a small unincorporated community located in Chesterfield County, Virginia. It is situated on the south bank of the Appomattox River, approximately 20 miles south of Richmond. The population of Enon was estimated to be 1,845 in 2019.
History
Enon was first settled in the early 1700s by English colonists. The community was named after the biblical city of Enon, which is mentioned in the New Testament. The area was originally part of Henrico County, but was later annexed to Chesterfield County in 1749.
In the early 1800s, Enon was a thriving agricultural community. The area was known for its tobacco production, and the Appomattox River provided a convenient means of transportation for goods and services.
During the Civil War, Enon was the site of several battles, including the Battle of Enon Church in 1864. The town was also the site of a Confederate hospital, which was used to treat wounded soldiers.
Geography
Enon is located in the Piedmont region of Virginia, approximately 20 miles south of Richmond. The town is situated on the south bank of the Appomattox River, which provides a convenient means of transportation for goods and services.
The terrain of Enon is mostly flat, with some rolling hills. The area is heavily forested, with a variety of hardwood and pine trees. The climate is humid subtropical, with hot, humid summers and mild winters.
Economy
Enon’s economy is largely based on agriculture and tourism. The area is known for its tobacco production, and the Appomattox River provides a convenient means of transportation for goods and services.
The town is also home to several small businesses, including restaurants, retail stores, and service providers. The area is also home to several historic sites, including the Enon Church, which was built in 1864.
Demographics
As of 2019, the population of Enon was estimated to be 1,845. The racial makeup of the town is 87.3% White, 8.2% African American, 0.7% Asian, and 3.8% other. The median household income is $50,945, and the median age is 40.
Enon is a small, close-knit community with a strong sense of community and pride. The town is home to several churches, schools, and parks, and is a popular destination for outdoor recreation.
Common Questions
What is Per Capita Income in Enon?
Per Capita income in Enon is $42,237.
What is the Median Family Income in Enon?
Median Family Income in Enon is $79,833.
What is the Median Household income in Enon?
Median Household Income in Enon is $72,852.
What is Income or Wage Gap in Enon?
Income or Wage Gap in Enon is 34.0%.
Women in Enon earn 66.0 cents for every dollar earned by a man.
What is Family Income Deficit in Enon?
Family Income Deficit in Enon is $11,733.
Families that are below poverty line in Enon earn $11,733 less on average than the poverty threshold level.
What is Inequality or Gini Index in Enon?
Inequality or Gini Index in Enon is 0.38.
What is the Total Population of Enon?
Total Population of Enon is 4,087.
What is the Total Male Population of Enon?
Total Male Population of Enon is 2,148.
What is the Total Female Population of Enon?
Total Female Population of Enon is 1,939.
What is the Ratio of Males per 100 Females in Enon?
There are 110.78 Males per 100 Females in Enon.
What is the Ratio of Females per 100 Males in Enon?
There are 90.27 Females per 100 Males in Enon.
What is the Median Population Age in Enon?
Median Population Age in Enon is 39.9 Years.
What is the Average Family Size in Enon
Average Family Size in Enon is 3.2 People.
What is the Average Household Size in Enon
Average Household Size in Enon is 2.4 People.
How Large is the Labor Force in Enon?
There are 2,065 People in the Labor Forcein in Enon.
What is the Percentage of People in the Labor Force in Enon?
61.3% of People are in the Labor Force in Enon.
What is the Unemployment Rate in Enon?
Unemployment Rate in Enon is 4.1%.