Zip Codes with the Lowest Poverty Level Among Children Under the Age of 5 in Virginia
RELATED REPORTS & OPTIONS
Lowest Poverty | Child 0-5
Virginia
Compare Zip Codes
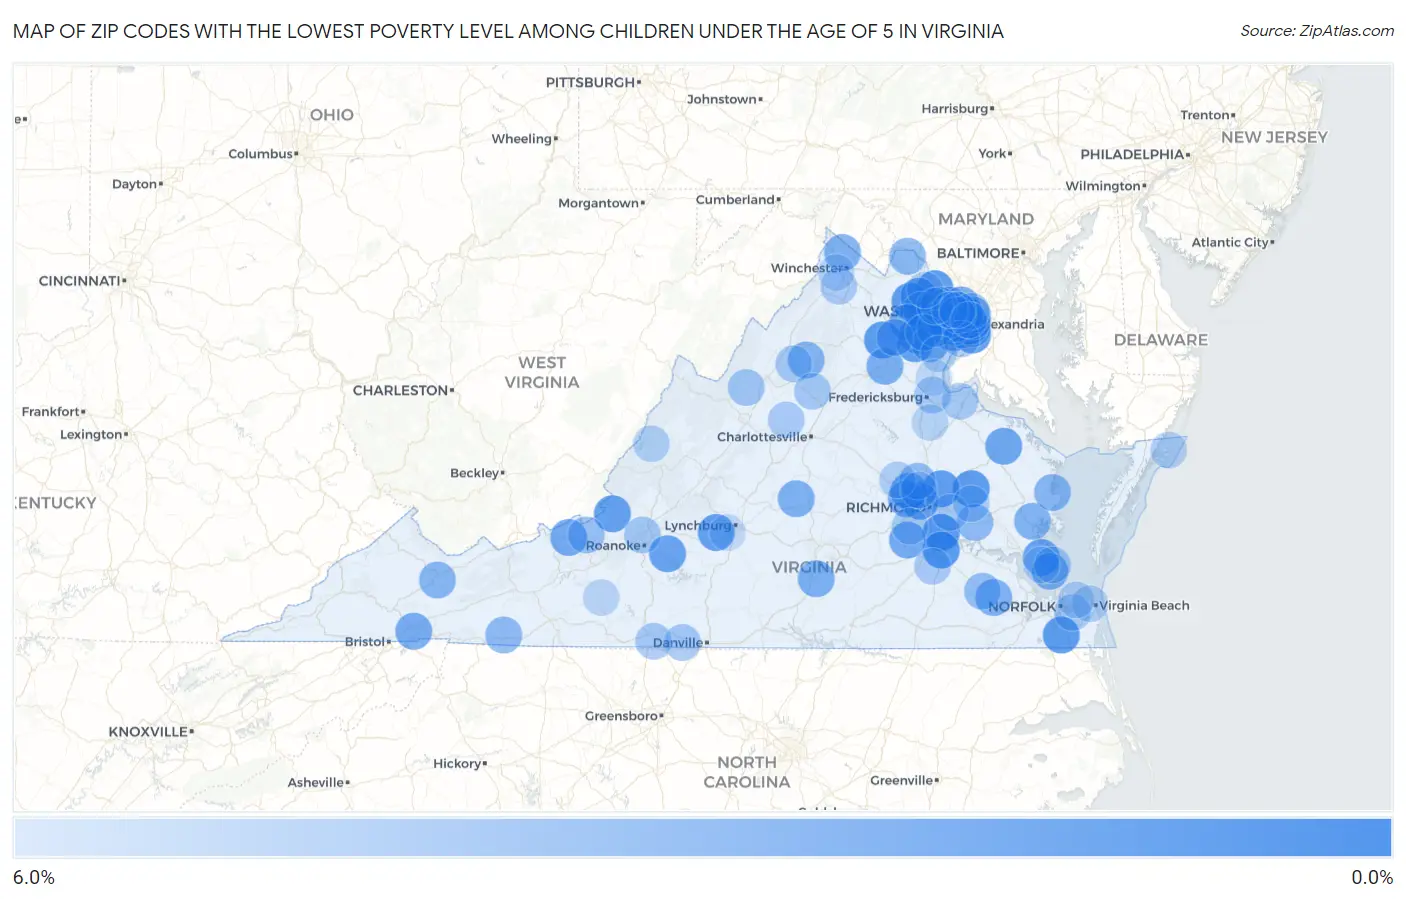
Map of Zip Codes with the Lowest Poverty Level Among Children Under the Age of 5 in Virginia
6.0%
0.0%
Zip Codes with the Lowest Poverty Level Among Children Under the Age of 5 in Virginia
| Zip Code | Child Poverty | vs State | vs National | |
| 1. | 23836 | 0.17% | 13.9%(-13.7)#1 | 18.1%(-17.9)#8 |
| 2. | 23801 | 0.41% | 13.9%(-13.5)#2 | 18.1%(-17.6)#36 |
| 3. | 20165 | 0.43% | 13.9%(-13.5)#3 | 18.1%(-17.6)#41 |
| 4. | 20186 | 0.45% | 13.9%(-13.4)#4 | 18.1%(-17.6)#47 |
| 5. | 20120 | 0.46% | 13.9%(-13.4)#5 | 18.1%(-17.6)#50 |
| 6. | 20105 | 0.48% | 13.9%(-13.4)#6 | 18.1%(-17.6)#54 |
| 7. | 23086 | 0.51% | 13.9%(-13.4)#7 | 18.1%(-17.6)#64 |
| 8. | 23322 | 0.54% | 13.9%(-13.3)#8 | 18.1%(-17.5)#71 |
| 9. | 23116 | 0.58% | 13.9%(-13.3)#9 | 18.1%(-17.5)#86 |
| 10. | 20136 | 0.60% | 13.9%(-13.3)#10 | 18.1%(-17.5)#90 |
| 11. | 22308 | 0.61% | 13.9%(-13.3)#11 | 18.1%(-17.5)#94 |
| 12. | 22153 | 0.81% | 13.9%(-13.1)#12 | 18.1%(-17.3)#180 |
| 13. | 24551 | 0.85% | 13.9%(-13.0)#13 | 18.1%(-17.2)#198 |
| 14. | 20148 | 0.85% | 13.9%(-13.0)#14 | 18.1%(-17.2)#204 |
| 15. | 22205 | 0.90% | 13.9%(-13.0)#15 | 18.1%(-17.2)#227 |
| 16. | 22046 | 0.92% | 13.9%(-13.0)#16 | 18.1%(-17.1)#242 |
| 17. | 24127 | 0.92% | 13.9%(-13.0)#17 | 18.1%(-17.1)#244 |
| 18. | 20181 | 0.93% | 13.9%(-13.0)#18 | 18.1%(-17.1)#246 |
| 19. | 23226 | 0.97% | 13.9%(-12.9)#19 | 18.1%(-17.1)#262 |
| 20. | 23692 | 1.1% | 13.9%(-12.8)#20 | 18.1%(-16.9)#334 |
| 21. | 24095 | 1.2% | 13.9%(-12.7)#21 | 18.1%(-16.9)#362 |
| 22. | 23233 | 1.4% | 13.9%(-12.5)#22 | 18.1%(-16.7)#459 |
| 23. | 22572 | 1.4% | 13.9%(-12.5)#23 | 18.1%(-16.7)#466 |
| 24. | 22315 | 1.6% | 13.9%(-12.3)#24 | 18.1%(-16.5)#574 |
| 25. | 22307 | 1.6% | 13.9%(-12.3)#25 | 18.1%(-16.5)#591 |
| 26. | 23838 | 1.6% | 13.9%(-12.3)#26 | 18.1%(-16.4)#611 |
| 27. | 22303 | 1.7% | 13.9%(-12.2)#27 | 18.1%(-16.4)#623 |
| 28. | 24136 | 1.7% | 13.9%(-12.2)#28 | 18.1%(-16.4)#635 |
| 29. | 24211 | 1.7% | 13.9%(-12.1)#29 | 18.1%(-16.3)#667 |
| 30. | 20152 | 1.8% | 13.9%(-12.1)#30 | 18.1%(-16.3)#693 |
| 31. | 22182 | 1.8% | 13.9%(-12.1)#31 | 18.1%(-16.3)#705 |
| 32. | 20155 | 1.8% | 13.9%(-12.1)#32 | 18.1%(-16.2)#724 |
| 33. | 22101 | 1.8% | 13.9%(-12.0)#33 | 18.1%(-16.2)#732 |
| 34. | 23238 | 1.8% | 13.9%(-12.0)#34 | 18.1%(-16.2)#737 |
| 35. | 22152 | 1.9% | 13.9%(-12.0)#35 | 18.1%(-16.2)#756 |
| 36. | 23665 | 2.0% | 13.9%(-11.9)#36 | 18.1%(-16.1)#827 |
| 37. | 22734 | 2.0% | 13.9%(-11.9)#37 | 18.1%(-16.0)#849 |
| 38. | 23947 | 2.0% | 13.9%(-11.8)#38 | 18.1%(-16.0)#859 |
| 39. | 20112 | 2.1% | 13.9%(-11.8)#39 | 18.1%(-16.0)#874 |
| 40. | 22202 | 2.1% | 13.9%(-11.8)#40 | 18.1%(-16.0)#896 |
| 41. | 23921 | 2.2% | 13.9%(-11.7)#41 | 18.1%(-15.9)#960 |
| 42. | 23866 | 2.2% | 13.9%(-11.7)#42 | 18.1%(-15.9)#973 |
| 43. | 20187 | 2.2% | 13.9%(-11.7)#43 | 18.1%(-15.8)#983 |
| 44. | 22015 | 2.3% | 13.9%(-11.6)#44 | 18.1%(-15.8)#1,004 |
| 45. | 22603 | 2.3% | 13.9%(-11.6)#45 | 18.1%(-15.7)#1,041 |
| 46. | 22151 | 2.4% | 13.9%(-11.5)#46 | 18.1%(-15.6)#1,118 |
| 47. | 22032 | 2.4% | 13.9%(-11.5)#47 | 18.1%(-15.6)#1,120 |
| 48. | 22851 | 2.4% | 13.9%(-11.4)#48 | 18.1%(-15.6)#1,127 |
| 49. | 23061 | 2.5% | 13.9%(-11.4)#49 | 18.1%(-15.6)#1,140 |
| 50. | 22030 | 2.5% | 13.9%(-11.4)#50 | 18.1%(-15.6)#1,162 |
| 51. | 24609 | 2.6% | 13.9%(-11.3)#51 | 18.1%(-15.5)#1,237 |
| 52. | 20124 | 2.6% | 13.9%(-11.2)#52 | 18.1%(-15.4)#1,258 |
| 53. | 22578 | 2.7% | 13.9%(-11.2)#53 | 18.1%(-15.4)#1,295 |
| 54. | 20180 | 2.8% | 13.9%(-11.1)#54 | 18.1%(-15.3)#1,346 |
| 55. | 24348 | 2.9% | 13.9%(-11.0)#55 | 18.1%(-15.1)#1,458 |
| 56. | 22301 | 3.0% | 13.9%(-10.9)#56 | 18.1%(-15.1)#1,494 |
| 57. | 23140 | 3.1% | 13.9%(-10.8)#57 | 18.1%(-15.0)#1,564 |
| 58. | 23059 | 3.1% | 13.9%(-10.8)#58 | 18.1%(-15.0)#1,570 |
| 59. | 23888 | 3.3% | 13.9%(-10.6)#59 | 18.1%(-14.7)#1,721 |
| 60. | 22203 | 3.4% | 13.9%(-10.5)#60 | 18.1%(-14.7)#1,749 |
| 61. | 24128 | 3.5% | 13.9%(-10.4)#61 | 18.1%(-14.6)#1,830 |
| 62. | 22812 | 3.8% | 13.9%(-10.1)#62 | 18.1%(-14.2)#2,041 |
| 63. | 22209 | 3.9% | 13.9%(-9.98)#63 | 18.1%(-14.2)#2,096 |
| 64. | 23662 | 4.0% | 13.9%(-9.92)#64 | 18.1%(-14.1)#2,148 |
| 65. | 24069 | 4.0% | 13.9%(-9.91)#65 | 18.1%(-14.1)#2,151 |
| 66. | 24019 | 4.0% | 13.9%(-9.86)#66 | 18.1%(-14.0)#2,193 |
| 67. | 20191 | 4.1% | 13.9%(-9.81)#67 | 18.1%(-14.0)#2,222 |
| 68. | 22849 | 4.2% | 13.9%(-9.72)#68 | 18.1%(-13.9)#2,296 |
| 69. | 22042 | 4.2% | 13.9%(-9.70)#69 | 18.1%(-13.9)#2,326 |
| 70. | 23150 | 4.2% | 13.9%(-9.70)#70 | 18.1%(-13.9)#2,330 |
| 71. | 24148 | 4.2% | 13.9%(-9.69)#71 | 18.1%(-13.9)#2,333 |
| 72. | 22973 | 4.2% | 13.9%(-9.69)#72 | 18.1%(-13.9)#2,339 |
| 73. | 23464 | 4.3% | 13.9%(-9.62)#73 | 18.1%(-13.8)#2,390 |
| 74. | 23832 | 4.3% | 13.9%(-9.60)#74 | 18.1%(-13.8)#2,397 |
| 75. | 22405 | 4.3% | 13.9%(-9.59)#75 | 18.1%(-13.8)#2,407 |
| 76. | 22485 | 4.3% | 13.9%(-9.57)#76 | 18.1%(-13.7)#2,417 |
| 77. | 22655 | 4.3% | 13.9%(-9.55)#77 | 18.1%(-13.7)#2,434 |
| 78. | 22060 | 4.4% | 13.9%(-9.53)#78 | 18.1%(-13.7)#2,459 |
| 79. | 23805 | 4.4% | 13.9%(-9.53)#79 | 18.1%(-13.7)#2,460 |
| 80. | 22932 | 4.4% | 13.9%(-9.47)#80 | 18.1%(-13.6)#2,489 |
| 81. | 23124 | 4.4% | 13.9%(-9.44)#81 | 18.1%(-13.6)#2,505 |
| 82. | 20110 | 4.5% | 13.9%(-9.35)#82 | 18.1%(-13.5)#2,579 |
| 83. | 23146 | 4.6% | 13.9%(-9.32)#83 | 18.1%(-13.5)#2,611 |
| 84. | 20171 | 4.6% | 13.9%(-9.24)#84 | 18.1%(-13.4)#2,660 |
| 85. | 23451 | 4.7% | 13.9%(-9.19)#85 | 18.1%(-13.4)#2,694 |
| 86. | 24445 | 4.8% | 13.9%(-9.13)#86 | 18.1%(-13.3)#2,732 |
| 87. | 23336 | 4.8% | 13.9%(-9.10)#87 | 18.1%(-13.3)#2,756 |
| 88. | 23455 | 4.8% | 13.9%(-9.07)#88 | 18.1%(-13.2)#2,773 |
| 89. | 22180 | 4.9% | 13.9%(-8.97)#89 | 18.1%(-13.1)#2,851 |
| 90. | 22580 | 5.0% | 13.9%(-8.94)#90 | 18.1%(-13.1)#2,865 |
| 91. | 22025 | 5.0% | 13.9%(-8.93)#91 | 18.1%(-13.1)#2,867 |
| 92. | 22602 | 5.1% | 13.9%(-8.77)#92 | 18.1%(-12.9)#2,982 |
| 93. | 23060 | 5.1% | 13.9%(-8.75)#93 | 18.1%(-12.9)#3,000 |
| 94. | 24091 | 5.1% | 13.9%(-8.75)#94 | 18.1%(-12.9)#3,002 |
| 95. | 20147 | 5.3% | 13.9%(-8.55)#95 | 18.1%(-12.7)#3,117 |
| 96. | 22302 | 5.5% | 13.9%(-8.42)#96 | 18.1%(-12.6)#3,215 |
| 97. | 22554 | 5.5% | 13.9%(-8.35)#97 | 18.1%(-12.5)#3,263 |
| 98. | 22043 | 5.5% | 13.9%(-8.35)#98 | 18.1%(-12.5)#3,266 |
| 99. | 23693 | 5.6% | 13.9%(-8.32)#99 | 18.1%(-12.5)#3,303 |
| 100. | 24502 | 5.6% | 13.9%(-8.31)#100 | 18.1%(-12.5)#3,305 |
Common Questions
What are the Top 10 Zip Codes with the Lowest Poverty Level Among Children Under the Age of 5 in Virginia?
Top 10 Zip Codes with the Lowest Poverty Level Among Children Under the Age of 5 in Virginia are:
What zip code has the Lowest Poverty Level Among Children Under the Age of 5 in Virginia?
23836 has the Lowest Poverty Level Among Children Under the Age of 5 in Virginia with 0.17%.
What is the Poverty Level Among Children Under the Age of 5 in the State of Virginia?
Poverty Level Among Children Under the Age of 5 in Virginia is 13.9%.
What is the Poverty Level Among Children Under the Age of 5 in the United States?
Poverty Level Among Children Under the Age of 5 in the United States is 18.1%.