Fort Lee, VA Map & Demographics
Fort Lee Map
Fort Lee Overview
$24,315
PER CAPITA INCOME
$74,563
AVG FAMILY INCOME
$73,906
AVG HOUSEHOLD INCOME
1.7%
WAGE / INCOME GAP [ % ]
98.3¢/ $1
WAGE / INCOME GAP [ $ ]
0.28
INEQUALITY / GINI INDEX
7,577
TOTAL POPULATION
4,452
MALE POPULATION
3,125
FEMALE POPULATION
142.46
MALES / 100 FEMALES
70.19
FEMALES / 100 MALES
21.8
MEDIAN AGE
3.5
AVG FAMILY SIZE
3.7
AVG HOUSEHOLD SIZE
4,541
LABOR FORCE [ PEOPLE ]
82.2%
PERCENT IN LABOR FORCE
30.7%
UNEMPLOYMENT RATE
Fort Lee Zip Codes
Fort Lee Area Codes
Income in Fort Lee
Income Overview in Fort Lee
Per Capita Income in Fort Lee is $24,315, while median incomes of families and households are $74,563 and $73,906 respectively.
| Characteristic | Number | Measure |
| Per Capita Income | 7,577 | $24,315 |
| Median Family Income | 1,470 | $74,563 |
| Mean Family Income | 1,470 | $82,712 |
| Median Household Income | 1,509 | $73,906 |
| Mean Household Income | 1,509 | $83,285 |
| Income Deficit | 1,470 | $0 |
| Wage / Income Gap (%) | 7,577 | 1.68% |
| Wage / Income Gap ($) | 7,577 | 98.32¢ per $1 |
| Gini / Inequality Index | 7,577 | 0.28 |
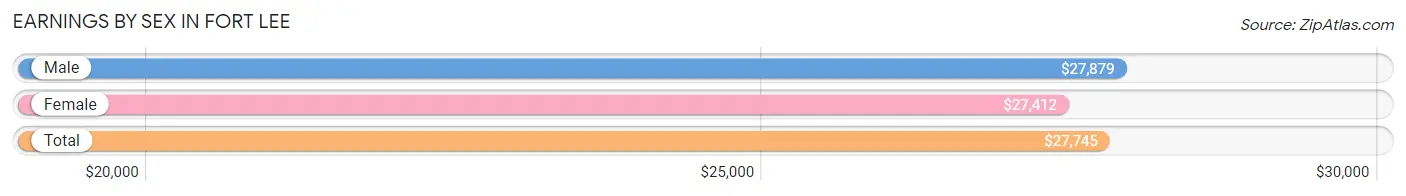
Earnings by Sex in Fort Lee
Average Earnings in Fort Lee are $27,745, $27,879 for men and $27,412 for women, a difference of 1.7%.
| Sex | Number | Average Earnings |
| Male | 3,341 (71.5%) | $27,879 |
| Female | 1,330 (28.5%) | $27,412 |
| Total | 4,671 (100.0%) | $27,745 |
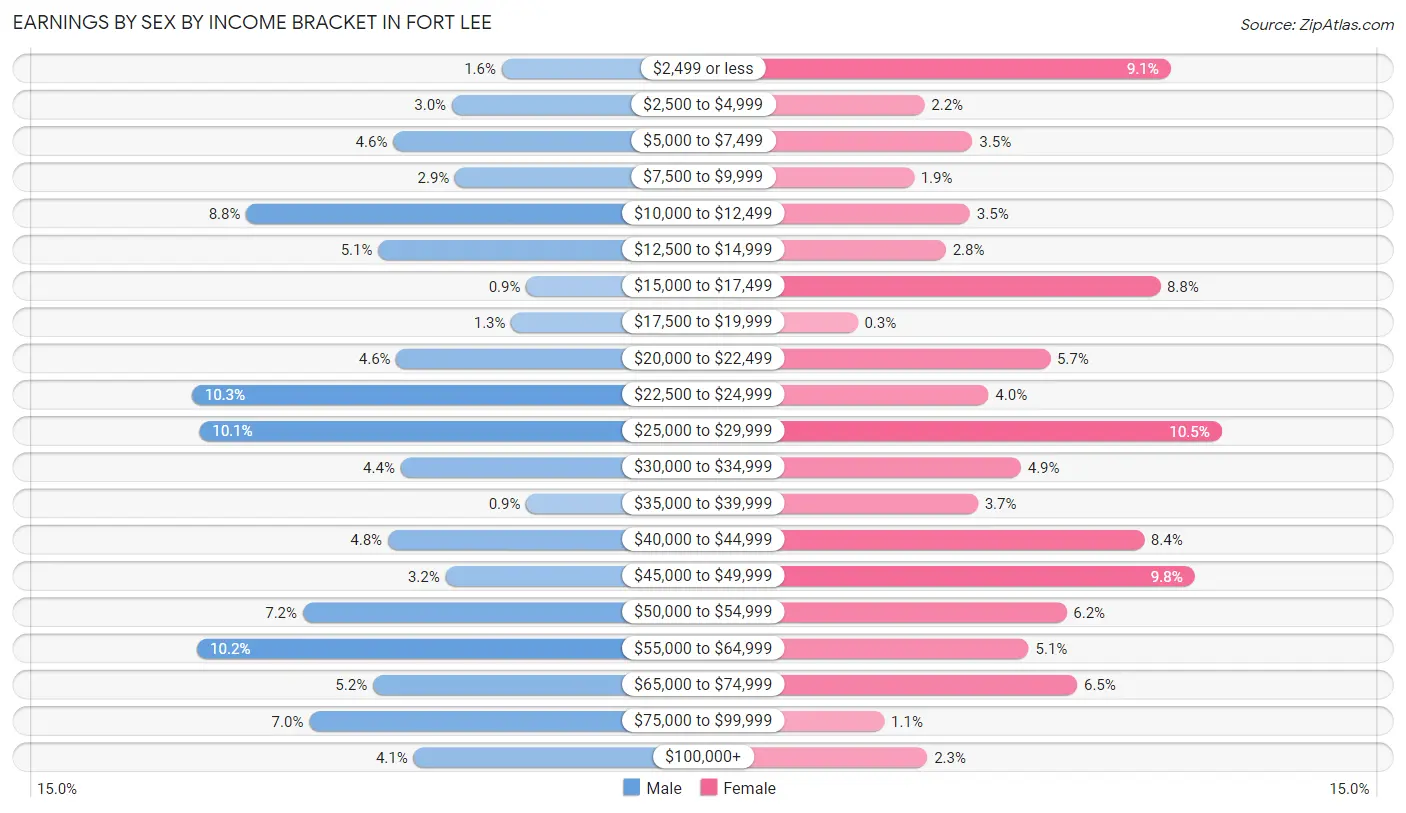
Earnings by Sex by Income Bracket in Fort Lee
The most common earnings brackets in Fort Lee are $22,500 to $24,999 for men (344 | 10.3%) and $25,000 to $29,999 for women (140 | 10.5%).
| Income | Male | Female |
| $2,499 or less | 53 (1.6%) | 121 (9.1%) |
| $2,500 to $4,999 | 100 (3.0%) | 29 (2.2%) |
| $5,000 to $7,499 | 155 (4.6%) | 47 (3.5%) |
| $7,500 to $9,999 | 97 (2.9%) | 25 (1.9%) |
| $10,000 to $12,499 | 293 (8.8%) | 46 (3.5%) |
| $12,500 to $14,999 | 169 (5.1%) | 37 (2.8%) |
| $15,000 to $17,499 | 30 (0.9%) | 117 (8.8%) |
| $17,500 to $19,999 | 44 (1.3%) | 4 (0.3%) |
| $20,000 to $22,499 | 152 (4.5%) | 76 (5.7%) |
| $22,500 to $24,999 | 344 (10.3%) | 53 (4.0%) |
| $25,000 to $29,999 | 337 (10.1%) | 140 (10.5%) |
| $30,000 to $34,999 | 148 (4.4%) | 65 (4.9%) |
| $35,000 to $39,999 | 30 (0.9%) | 49 (3.7%) |
| $40,000 to $44,999 | 160 (4.8%) | 111 (8.4%) |
| $45,000 to $49,999 | 106 (3.2%) | 130 (9.8%) |
| $50,000 to $54,999 | 240 (7.2%) | 82 (6.2%) |
| $55,000 to $64,999 | 339 (10.2%) | 68 (5.1%) |
| $65,000 to $74,999 | 174 (5.2%) | 86 (6.5%) |
| $75,000 to $99,999 | 234 (7.0%) | 14 (1.1%) |
| $100,000+ | 136 (4.1%) | 30 (2.3%) |
| Total | 3,341 (100.0%) | 1,330 (100.0%) |
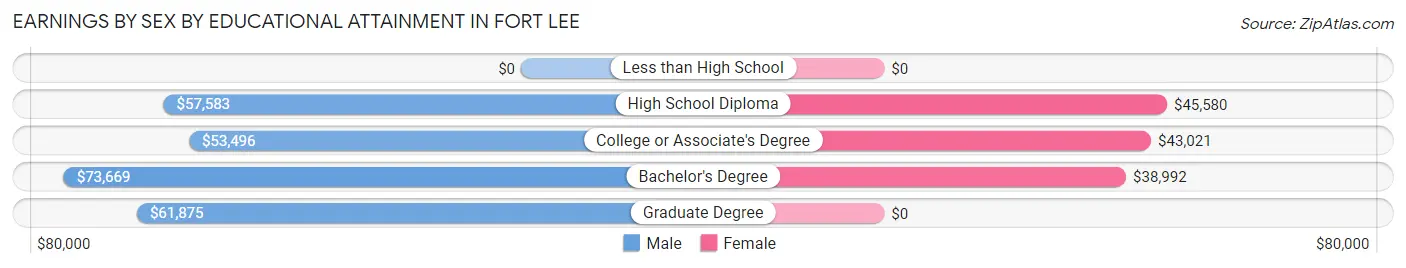
Earnings by Sex by Educational Attainment in Fort Lee
Average earnings in Fort Lee are $57,338 for men and $42,703 for women, a difference of 25.5%. Men with an educational attainment of bachelor's degree enjoy the highest average annual earnings of $73,669, while those with college or associate's degree education earn the least with $53,496. Women with an educational attainment of high school diploma earn the most with the average annual earnings of $45,580, while those with bachelor's degree education have the smallest earnings of $38,992.
| Educational Attainment | Male Income | Female Income |
| Less than High School | - | - |
| High School Diploma | $57,583 | $45,580 |
| College or Associate's Degree | $53,496 | $43,021 |
| Bachelor's Degree | $73,669 | $38,992 |
| Graduate Degree | $61,875 | $0 |
| Total | $57,338 | $42,703 |
Family Income in Fort Lee
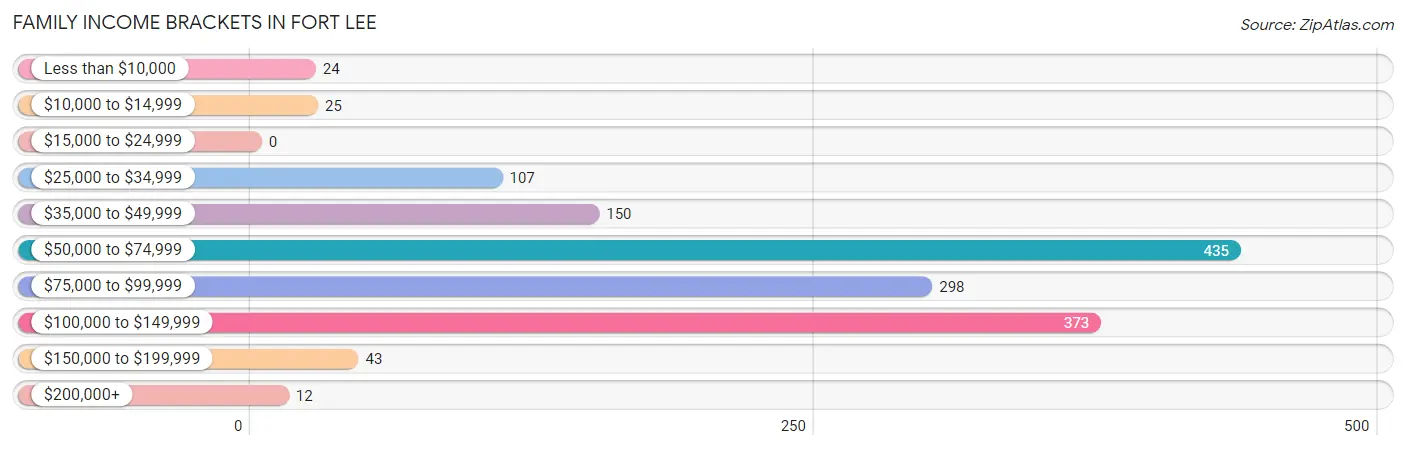
Family Income Brackets in Fort Lee
According to the Fort Lee family income data, there are 435 families falling into the $50,000 to $74,999 income range, which is the most common income bracket and makes up 29.6% of all families.
| Income Bracket | # Families | % Families |
| Less than $10,000 | 24 | 1.6% |
| $10,000 to $14,999 | 25 | 1.7% |
| $15,000 to $24,999 | 0 | 0.0% |
| $25,000 to $34,999 | 107 | 7.3% |
| $35,000 to $49,999 | 150 | 10.2% |
| $50,000 to $74,999 | 435 | 29.6% |
| $75,000 to $99,999 | 298 | 20.3% |
| $100,000 to $149,999 | 373 | 25.4% |
| $150,000 to $199,999 | 43 | 2.9% |
| $200,000+ | 12 | 0.8% |
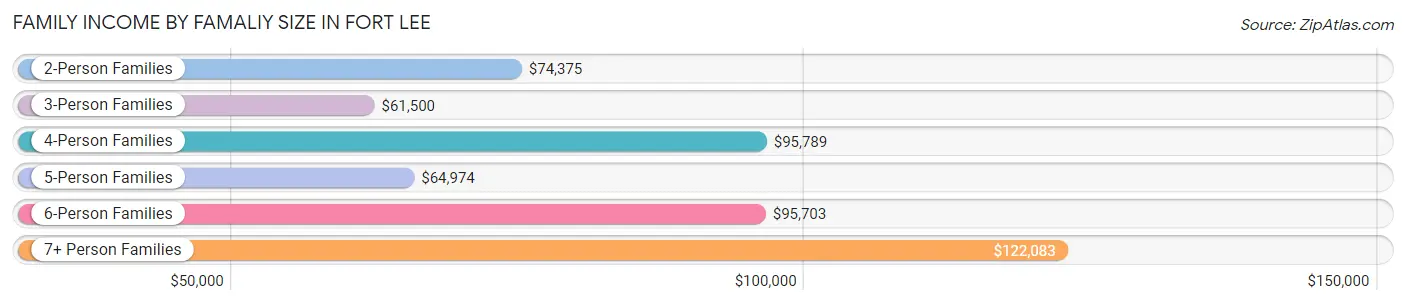
Family Income by Famaliy Size in Fort Lee
7+ person families (46 | 3.1%) account for the highest median family income in Fort Lee with $122,083 per family, while 2-person families (218 | 14.8%) have the highest median income of $37,188 per family member.
| Income Bracket | # Families | Median Income |
| 2-Person Families | 218 (14.8%) | $74,375 |
| 3-Person Families | 416 (28.3%) | $61,500 |
| 4-Person Families | 456 (31.0%) | $95,789 |
| 5-Person Families | 211 (14.3%) | $64,974 |
| 6-Person Families | 123 (8.4%) | $95,703 |
| 7+ Person Families | 46 (3.1%) | $122,083 |
| Total | 1,470 (100.0%) | $74,563 |
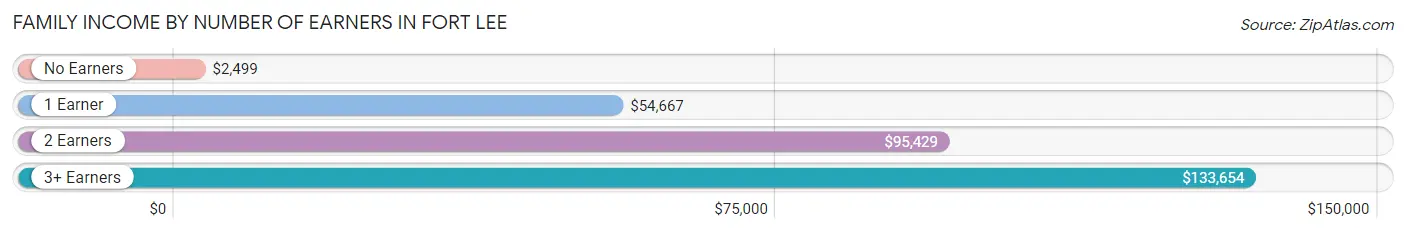
Family Income by Number of Earners in Fort Lee
The median family income in Fort Lee is $74,563, with families comprising 3+ earners (94) having the highest median family income of $133,654, while families with no earners (24) have the lowest median family income of $2,499, accounting for 6.4% and 1.6% of families, respectively.
| Number of Earners | # Families | Median Income |
| No Earners | 24 (1.6%) | $2,499 |
| 1 Earner | 658 (44.8%) | $54,667 |
| 2 Earners | 694 (47.2%) | $95,429 |
| 3+ Earners | 94 (6.4%) | $133,654 |
| Total | 1,470 (100.0%) | $74,563 |
Household Income in Fort Lee
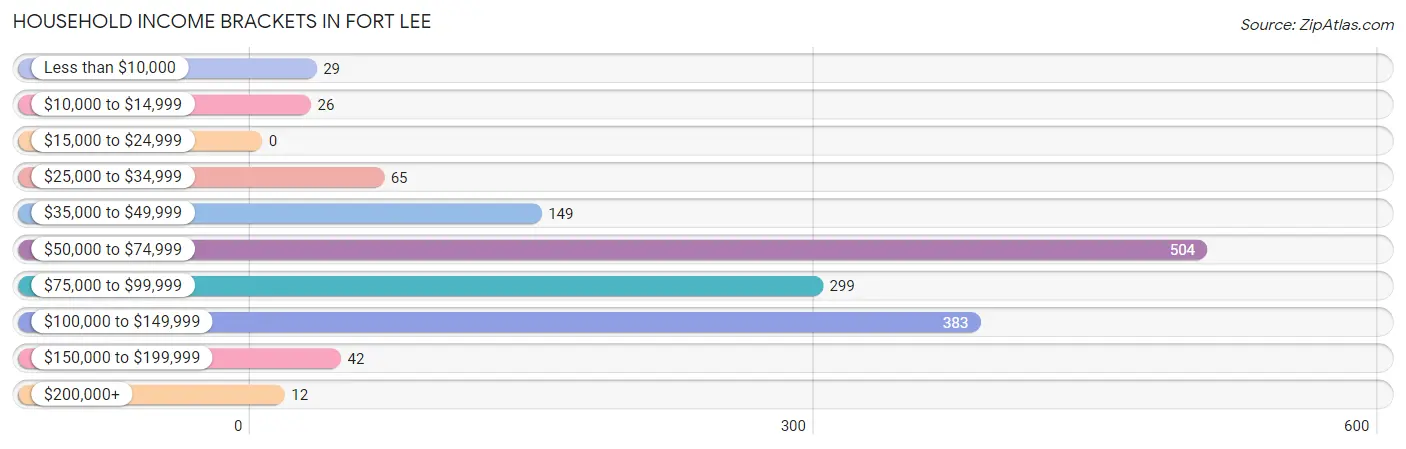
Household Income Brackets in Fort Lee
With 504 households falling in the category, the $50,000 to $74,999 income range is the most frequent in Fort Lee, accounting for 33.4% of all households.
| Income Bracket | # Households | % Households |
| Less than $10,000 | 29 | 1.9% |
| $10,000 to $14,999 | 26 | 1.7% |
| $15,000 to $24,999 | 0 | 0.0% |
| $25,000 to $34,999 | 65 | 4.3% |
| $35,000 to $49,999 | 149 | 9.9% |
| $50,000 to $74,999 | 504 | 33.4% |
| $75,000 to $99,999 | 299 | 19.8% |
| $100,000 to $149,999 | 383 | 25.4% |
| $150,000 to $199,999 | 42 | 2.8% |
| $200,000+ | 12 | 0.8% |
Household Income by Householder Age in Fort Lee
The median household income in Fort Lee is $73,906, with the highest median household income of $79,491 found in the 45 to 64 years age bracket for the primary householder. A total of 137 households (9.1%) fall into this category. Meanwhile, the 65+ years age bracket for the primary householder has the lowest median household income of $0, with 5 households (0.3%) in this group.
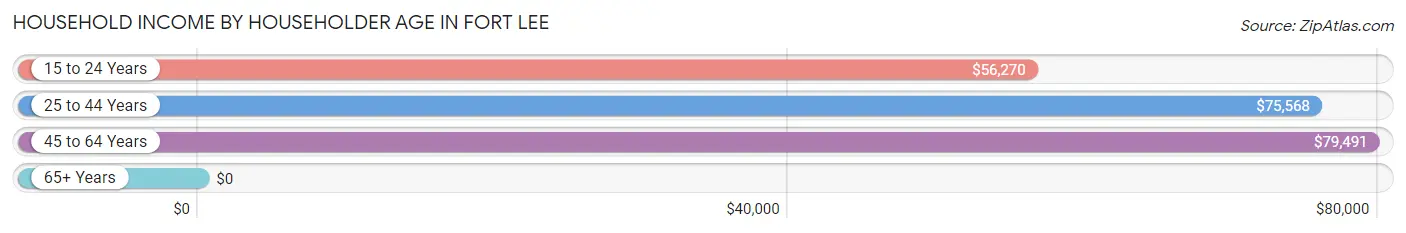
| Income Bracket | # Households | Median Income |
| 15 to 24 Years | 116 (7.7%) | $56,270 |
| 25 to 44 Years | 1,251 (82.9%) | $75,568 |
| 45 to 64 Years | 137 (9.1%) | $79,491 |
| 65+ Years | 5 (0.3%) | $0 |
| Total | 1,509 (100.0%) | $73,906 |
Poverty in Fort Lee
Income Below Poverty by Sex and Age in Fort Lee
With 0.6% poverty level for males and 5.3% for females among the residents of Fort Lee, 12 to 14 year old males and 16 and 17 year old females are the most vulnerable to poverty, with 10 males (5.0%) and 49 females (62.0%) in their respective age groups living below the poverty level.
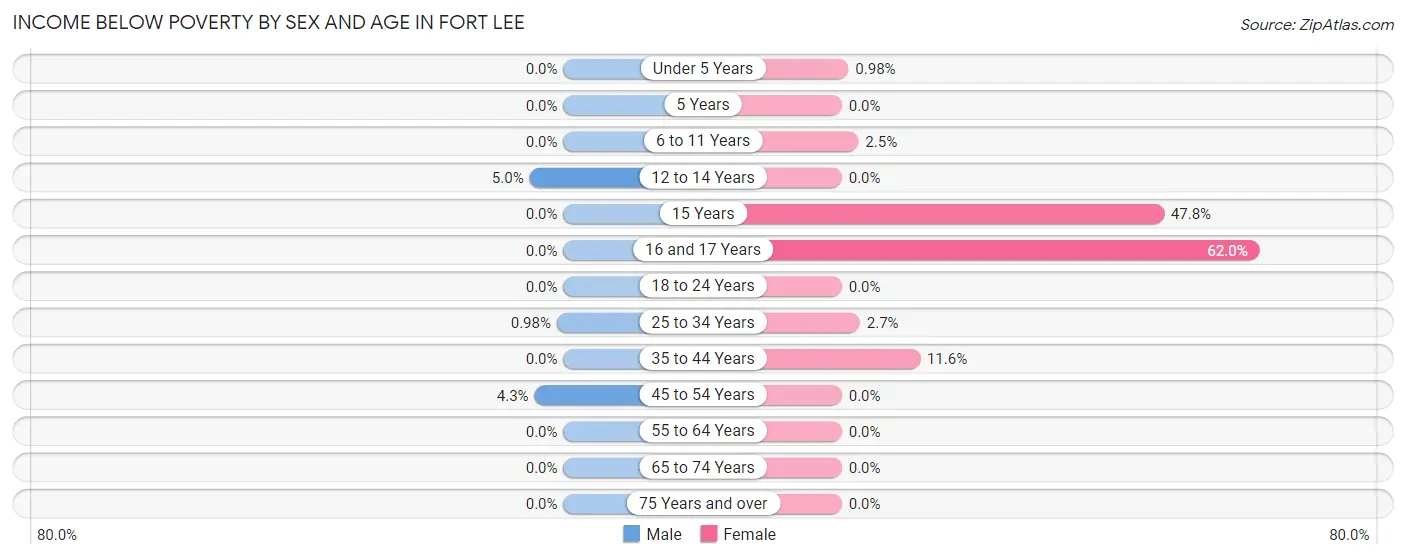
| Age Bracket | Male | Female |
| Under 5 Years | 0 (0.0%) | 3 (1.0%) |
| 5 Years | 0 (0.0%) | 0 (0.0%) |
| 6 to 11 Years | 0 (0.0%) | 11 (2.5%) |
| 12 to 14 Years | 10 (5.0%) | 0 (0.0%) |
| 15 Years | 0 (0.0%) | 11 (47.8%) |
| 16 and 17 Years | 0 (0.0%) | 49 (62.0%) |
| 18 to 24 Years | 0 (0.0%) | 0 (0.0%) |
| 25 to 34 Years | 5 (1.0%) | 16 (2.7%) |
| 35 to 44 Years | 0 (0.0%) | 49 (11.6%) |
| 45 to 54 Years | 4 (4.3%) | 0 (0.0%) |
| 55 to 64 Years | 0 (0.0%) | 0 (0.0%) |
| 65 to 74 Years | 0 (0.0%) | 0 (0.0%) |
| 75 Years and over | 0 (0.0%) | 0 (0.0%) |
| Total | 19 (0.6%) | 139 (5.3%) |
Income Above Poverty by Sex and Age in Fort Lee
According to the poverty statistics in Fort Lee, males aged under 5 years and females aged 5 years are the age groups that are most secure financially, with 100.0% of males and 100.0% of females in these age groups living above the poverty line.
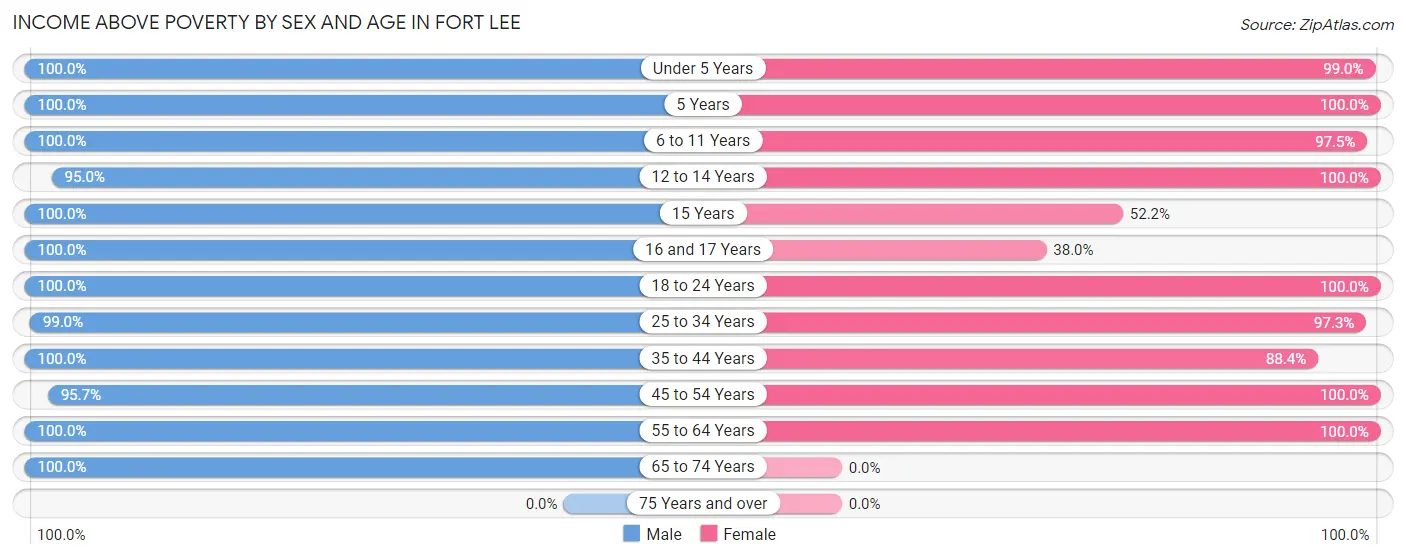
| Age Bracket | Male | Female |
| Under 5 Years | 419 (100.0%) | 302 (99.0%) |
| 5 Years | 42 (100.0%) | 88 (100.0%) |
| 6 to 11 Years | 317 (100.0%) | 435 (97.5%) |
| 12 to 14 Years | 189 (95.0%) | 140 (100.0%) |
| 15 Years | 69 (100.0%) | 12 (52.2%) |
| 16 and 17 Years | 59 (100.0%) | 30 (38.0%) |
| 18 to 24 Years | 467 (100.0%) | 320 (100.0%) |
| 25 to 34 Years | 504 (99.0%) | 581 (97.3%) |
| 35 to 44 Years | 732 (100.0%) | 373 (88.4%) |
| 45 to 54 Years | 89 (95.7%) | 166 (100.0%) |
| 55 to 64 Years | 34 (100.0%) | 46 (100.0%) |
| 65 to 74 Years | 5 (100.0%) | 0 (0.0%) |
| 75 Years and over | 0 (0.0%) | 0 (0.0%) |
| Total | 2,926 (99.4%) | 2,493 (94.7%) |
Income Below Poverty Among Married-Couple Families in Fort Lee
The poverty statistics for married-couple families in Fort Lee show that 0.4% or 5 of the total 1,270 families live below the poverty line. Families with no children have the highest poverty rate of 2.5%, comprising of 5 families. On the other hand, families with 1 or 2 children have the lowest poverty rate of 0.0%, which includes 0 families.
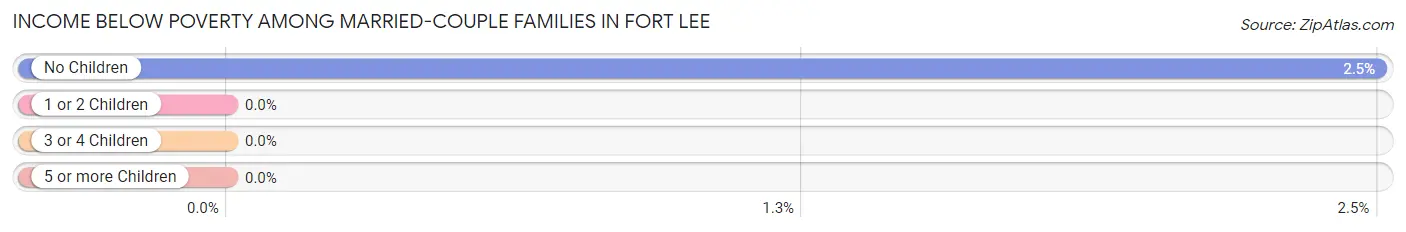
| Children | Above Poverty | Below Poverty |
| No Children | 195 (97.5%) | 5 (2.5%) |
| 1 or 2 Children | 741 (100.0%) | 0 (0.0%) |
| 3 or 4 Children | 283 (100.0%) | 0 (0.0%) |
| 5 or more Children | 46 (100.0%) | 0 (0.0%) |
| Total | 1,265 (99.6%) | 5 (0.4%) |
Income Below Poverty Among Single-Parent Households in Fort Lee
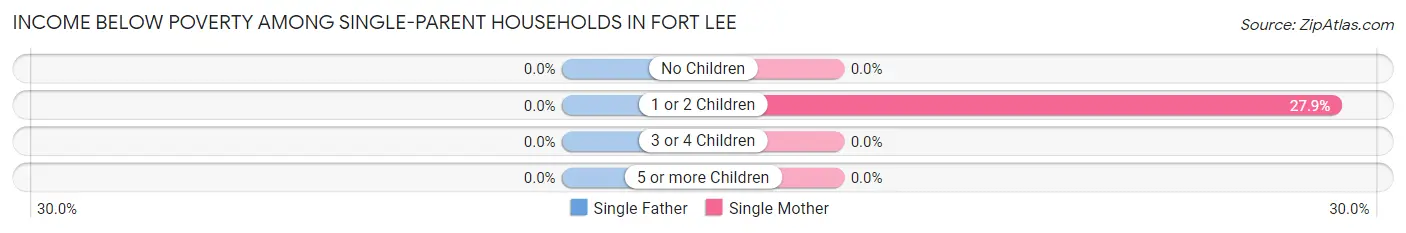
| Children | Single Father | Single Mother |
| No Children | 0 (0.0%) | 0 (0.0%) |
| 1 or 2 Children | 0 (0.0%) | 44 (27.9%) |
| 3 or 4 Children | 0 (0.0%) | 0 (0.0%) |
| 5 or more Children | 0 (0.0%) | 0 (0.0%) |
| Total | 0 (0.0%) | 44 (23.5%) |
Income Below Poverty Among Married-Couple vs Single-Parent Households in Fort Lee
The poverty data for Fort Lee shows that 5 of the married-couple family households (0.4%) and 44 of the single-parent households (22.0%) are living below the poverty level. Within the married-couple family households, those with no children have the highest poverty rate, with 5 households (2.5%) falling below the poverty line. Among the single-parent households, those with 1 or 2 children have the highest poverty rate, with 44 household (25.7%) living below poverty.
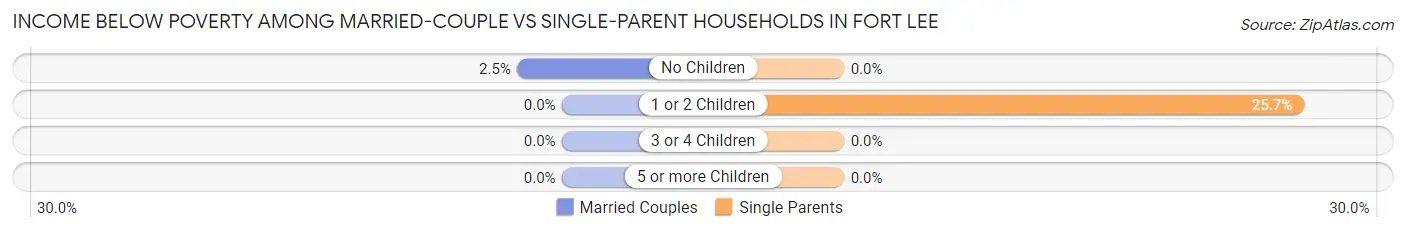
| Children | Married-Couple Families | Single-Parent Households |
| No Children | 5 (2.5%) | 0 (0.0%) |
| 1 or 2 Children | 0 (0.0%) | 44 (25.7%) |
| 3 or 4 Children | 0 (0.0%) | 0 (0.0%) |
| 5 or more Children | 0 (0.0%) | 0 (0.0%) |
| Total | 5 (0.4%) | 44 (22.0%) |
Race in Fort Lee
The most populous races in Fort Lee are White / Caucasian (2,680 | 35.4%), Black / African American (2,501 | 33.0%), and Hispanic or Latino (1,796 | 23.7%).
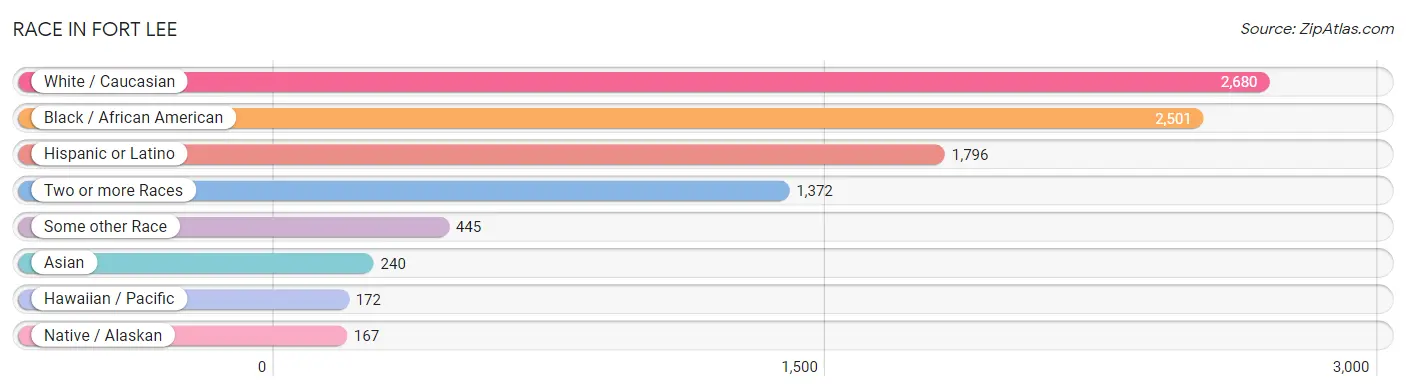
| Race | # Population | % Population |
| Asian | 240 | 3.2% |
| Black / African American | 2,501 | 33.0% |
| Hawaiian / Pacific | 172 | 2.3% |
| Hispanic or Latino | 1,796 | 23.7% |
| Native / Alaskan | 167 | 2.2% |
| White / Caucasian | 2,680 | 35.4% |
| Two or more Races | 1,372 | 18.1% |
| Some other Race | 445 | 5.9% |
| Total | 7,577 | 100.0% |
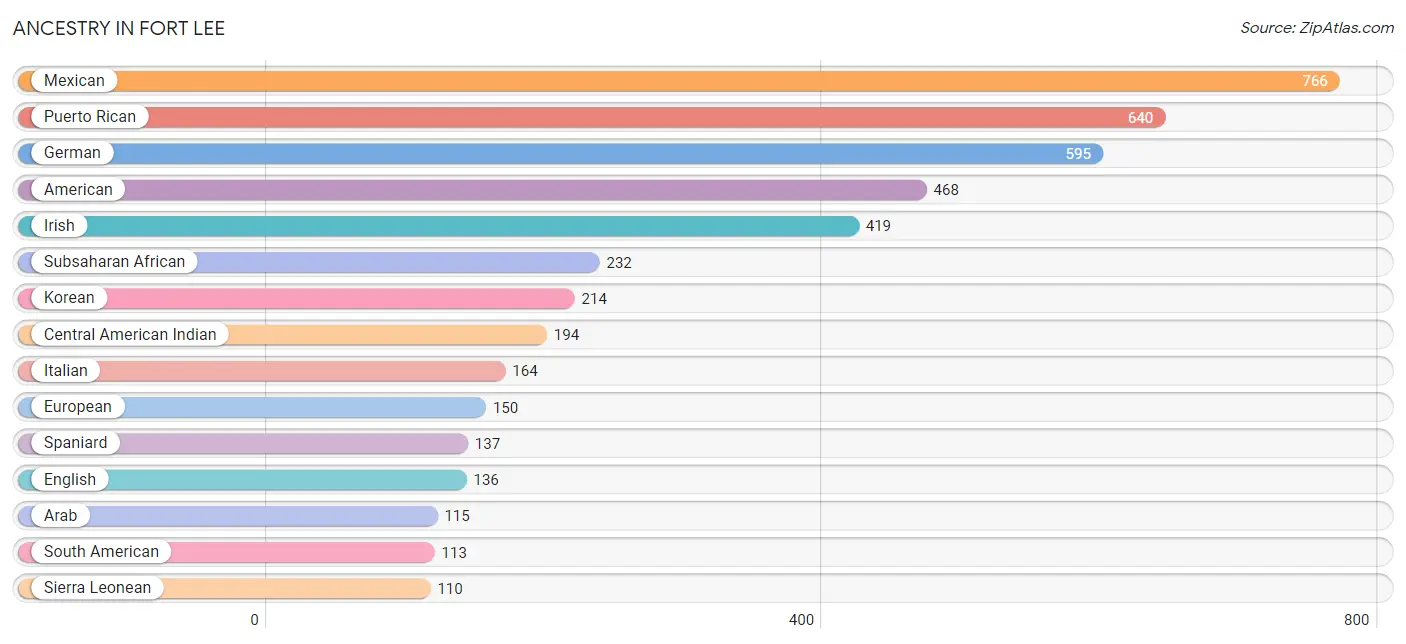
Ancestry in Fort Lee
The most populous ancestries reported in Fort Lee are Mexican (766 | 10.1%), Puerto Rican (640 | 8.5%), German (595 | 7.9%), American (468 | 6.2%), and Irish (419 | 5.5%), together accounting for 38.1% of all Fort Lee residents.
| Ancestry | # Population | % Population |
| African | 82 | 1.1% |
| American | 468 | 6.2% |
| Arab | 115 | 1.5% |
| Argentinean | 1 | 0.0% |
| Austrian | 3 | 0.0% |
| Bhutanese | 43 | 0.6% |
| Blackfeet | 3 | 0.0% |
| Brazilian | 104 | 1.4% |
| British | 10 | 0.1% |
| British West Indian | 13 | 0.2% |
| Burmese | 88 | 1.2% |
| Central American | 71 | 0.9% |
| Central American Indian | 194 | 2.6% |
| Chippewa | 24 | 0.3% |
| Colombian | 20 | 0.3% |
| Czech | 49 | 0.6% |
| Danish | 31 | 0.4% |
| Dominican | 37 | 0.5% |
| Dutch | 17 | 0.2% |
| English | 136 | 1.8% |
| European | 150 | 2.0% |
| French | 43 | 0.6% |
| French Canadian | 46 | 0.6% |
| German | 595 | 7.9% |
| Guamanian / Chamorro | 28 | 0.4% |
| Guatemalan | 29 | 0.4% |
| Haitian | 55 | 0.7% |
| Hungarian | 7 | 0.1% |
| Indian (Asian) | 57 | 0.7% |
| Iranian | 20 | 0.3% |
| Iraqi | 3 | 0.0% |
| Irish | 419 | 5.5% |
| Italian | 164 | 2.2% |
| Jamaican | 23 | 0.3% |
| Japanese | 65 | 0.9% |
| Kenyan | 3 | 0.0% |
| Korean | 214 | 2.8% |
| Lebanese | 11 | 0.2% |
| Mexican | 766 | 10.1% |
| Mexican American Indian | 25 | 0.3% |
| Nicaraguan | 23 | 0.3% |
| Nigerian | 10 | 0.1% |
| Northern European | 4 | 0.1% |
| Norwegian | 34 | 0.4% |
| Pakistani | 76 | 1.0% |
| Panamanian | 19 | 0.3% |
| Peruvian | 65 | 0.9% |
| Polish | 71 | 0.9% |
| Portuguese | 65 | 0.9% |
| Puerto Rican | 640 | 8.5% |
| Russian | 3 | 0.0% |
| Samoan | 30 | 0.4% |
| Scandinavian | 1 | 0.0% |
| Scotch-Irish | 24 | 0.3% |
| Scottish | 95 | 1.3% |
| Sierra Leonean | 110 | 1.5% |
| South American | 113 | 1.5% |
| Spaniard | 137 | 1.8% |
| Sri Lankan | 27 | 0.4% |
| Subsaharan African | 232 | 3.1% |
| Swedish | 1 | 0.0% |
| Syrian | 18 | 0.2% |
| Thai | 48 | 0.6% |
| Trinidadian and Tobagonian | 44 | 0.6% |
| U.S. Virgin Islander | 9 | 0.1% |
| Venezuelan | 27 | 0.4% |
| Welsh | 8 | 0.1% |
| Yugoslavian | 24 | 0.3% |
| Yup'ik | 6 | 0.1% | View All 69 Rows |
Immigrants in Fort Lee
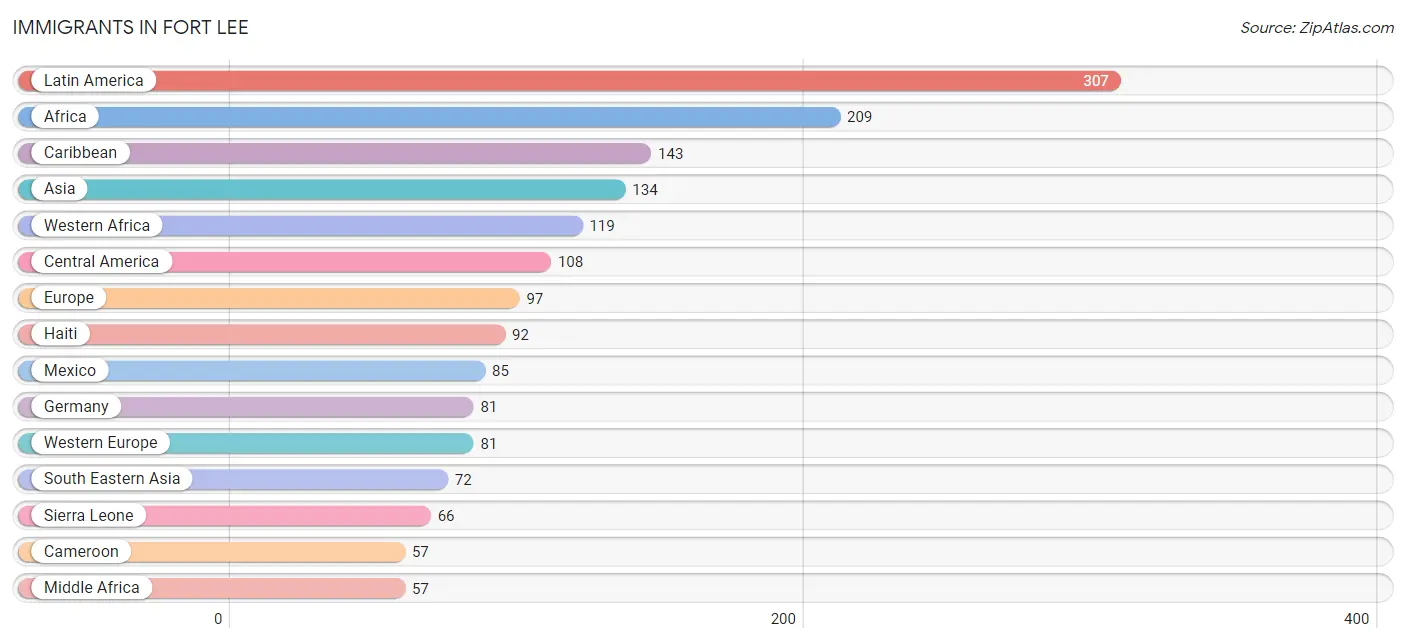
The most numerous immigrant groups reported in Fort Lee came from Latin America (307 | 4.1%), Africa (209 | 2.8%), Caribbean (143 | 1.9%), Asia (134 | 1.8%), and Western Africa (119 | 1.6%), together accounting for 12.0% of all Fort Lee residents.
| Immigration Origin | # Population | % Population |
| Africa | 209 | 2.8% |
| Argentina | 4 | 0.1% |
| Asia | 134 | 1.8% |
| Bosnia and Herzegovina | 16 | 0.2% |
| Brazil | 15 | 0.2% |
| Cameroon | 57 | 0.7% |
| Caribbean | 143 | 1.9% |
| Central America | 108 | 1.4% |
| China | 1 | 0.0% |
| Colombia | 9 | 0.1% |
| Dominican Republic | 8 | 0.1% |
| Eastern Africa | 3 | 0.0% |
| Eastern Asia | 38 | 0.5% |
| Eastern Europe | 16 | 0.2% |
| Europe | 97 | 1.3% |
| Germany | 81 | 1.1% |
| Grenada | 13 | 0.2% |
| Haiti | 92 | 1.2% |
| Iraq | 3 | 0.0% |
| Jamaica | 9 | 0.1% |
| Japan | 11 | 0.2% |
| Kenya | 3 | 0.0% |
| Korea | 26 | 0.3% |
| Latin America | 307 | 4.1% |
| Mexico | 85 | 1.1% |
| Middle Africa | 57 | 0.7% |
| Nicaragua | 23 | 0.3% |
| Nigeria | 53 | 0.7% |
| Oceania | 10 | 0.1% |
| Peru | 1 | 0.0% |
| Philippines | 50 | 0.7% |
| Sierra Leone | 66 | 0.9% |
| South America | 56 | 0.7% |
| South Eastern Asia | 72 | 0.9% |
| Thailand | 22 | 0.3% |
| Trinidad and Tobago | 14 | 0.2% |
| Venezuela | 27 | 0.4% |
| Western Africa | 119 | 1.6% |
| Western Asia | 24 | 0.3% |
| Western Europe | 81 | 1.1% |
| Yemen | 21 | 0.3% | View All 41 Rows |
Sex and Age in Fort Lee
Sex and Age in Fort Lee
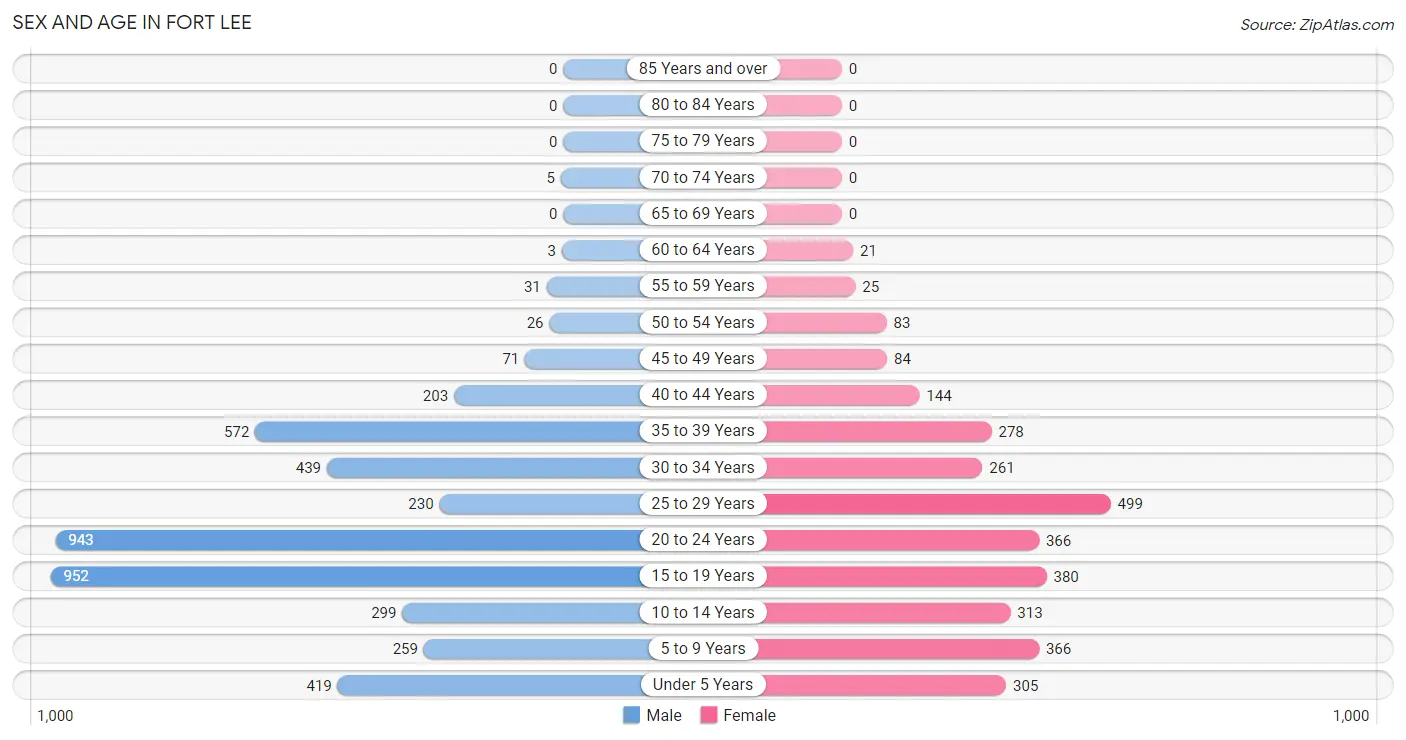
The most populous age groups in Fort Lee are 15 to 19 Years (952 | 21.4%) for men and 25 to 29 Years (499 | 16.0%) for women.
| Age Bracket | Male | Female |
| Under 5 Years | 419 (9.4%) | 305 (9.8%) |
| 5 to 9 Years | 259 (5.8%) | 366 (11.7%) |
| 10 to 14 Years | 299 (6.7%) | 313 (10.0%) |
| 15 to 19 Years | 952 (21.4%) | 380 (12.2%) |
| 20 to 24 Years | 943 (21.2%) | 366 (11.7%) |
| 25 to 29 Years | 230 (5.2%) | 499 (16.0%) |
| 30 to 34 Years | 439 (9.9%) | 261 (8.4%) |
| 35 to 39 Years | 572 (12.9%) | 278 (8.9%) |
| 40 to 44 Years | 203 (4.6%) | 144 (4.6%) |
| 45 to 49 Years | 71 (1.6%) | 84 (2.7%) |
| 50 to 54 Years | 26 (0.6%) | 83 (2.7%) |
| 55 to 59 Years | 31 (0.7%) | 25 (0.8%) |
| 60 to 64 Years | 3 (0.1%) | 21 (0.7%) |
| 65 to 69 Years | 0 (0.0%) | 0 (0.0%) |
| 70 to 74 Years | 5 (0.1%) | 0 (0.0%) |
| 75 to 79 Years | 0 (0.0%) | 0 (0.0%) |
| 80 to 84 Years | 0 (0.0%) | 0 (0.0%) |
| 85 Years and over | 0 (0.0%) | 0 (0.0%) |
| Total | 4,452 (100.0%) | 3,125 (100.0%) |
Families and Households in Fort Lee
Median Family Size in Fort Lee
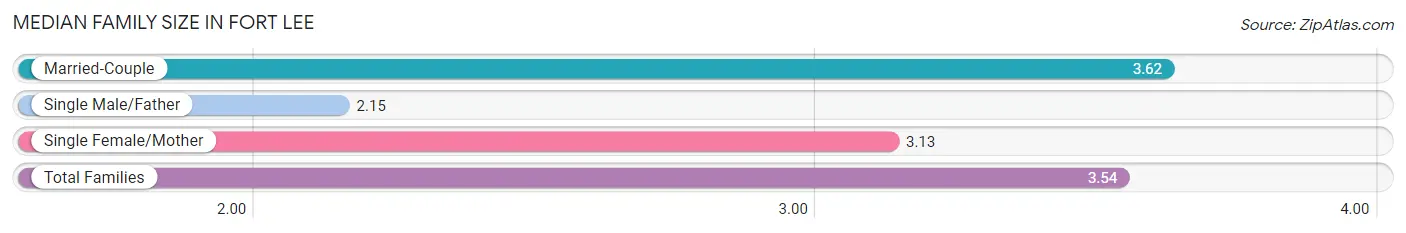
The median family size in Fort Lee is 3.54 persons per family, with married-couple families (1,270 | 86.4%) accounting for the largest median family size of 3.62 persons per family. On the other hand, single male/father families (13 | 0.9%) represent the smallest median family size with 2.15 persons per family.
| Family Type | # Families | Family Size |
| Married-Couple | 1,270 (86.4%) | 3.62 |
| Single Male/Father | 13 (0.9%) | 2.15 |
| Single Female/Mother | 187 (12.7%) | 3.13 |
| Total Families | 1,470 (100.0%) | 3.54 |
Median Household Size in Fort Lee
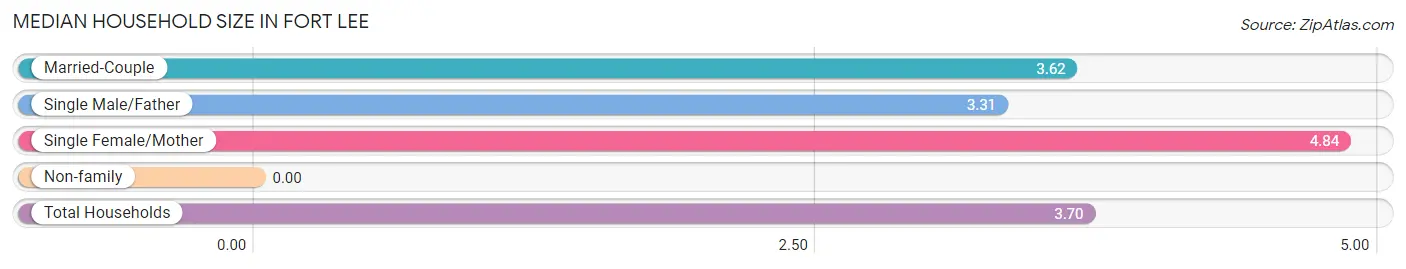
| Household Type | # Households | Household Size |
| Married-Couple | 1,270 (84.2%) | 3.62 |
| Single Male/Father | 13 (0.9%) | 3.31 |
| Single Female/Mother | 187 (12.4%) | 4.84 |
| Non-family | 39 (2.6%) | - |
| Total Households | 1,509 (100.0%) | 3.70 |
Household Size by Marriage Status in Fort Lee
Out of a total of 1,509 households in Fort Lee, 1,470 (97.4%) are family households, while 39 (2.6%) are nonfamily households. The most numerous type of family households are 4-person households, comprising 517, and the most common type of nonfamily households are 1-person households, comprising 39.
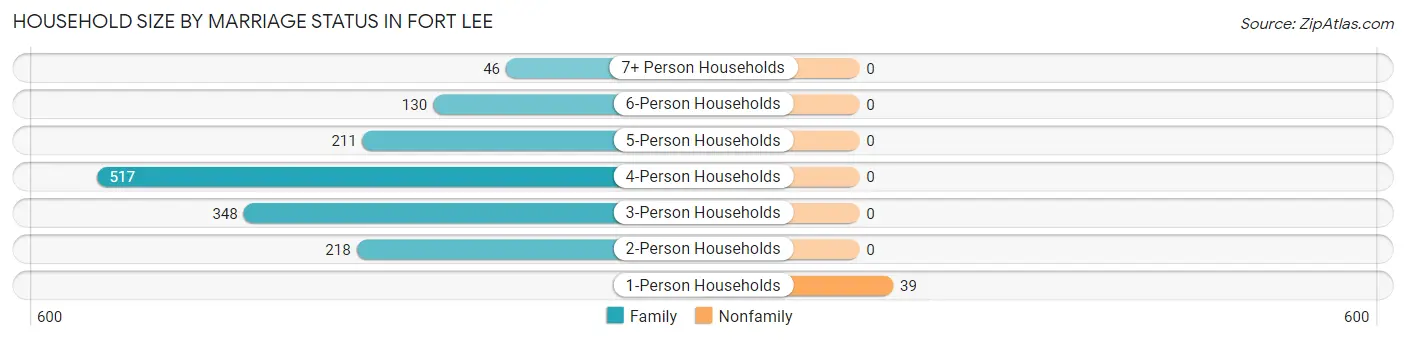
| Household Size | Family Households | Nonfamily Households |
| 1-Person Households | - | 39 (2.6%) |
| 2-Person Households | 218 (14.4%) | 0 (0.0%) |
| 3-Person Households | 348 (23.1%) | 0 (0.0%) |
| 4-Person Households | 517 (34.3%) | 0 (0.0%) |
| 5-Person Households | 211 (14.0%) | 0 (0.0%) |
| 6-Person Households | 130 (8.6%) | 0 (0.0%) |
| 7+ Person Households | 46 (3.0%) | 0 (0.0%) |
| Total | 1,470 (97.4%) | 39 (2.6%) |
Female Fertility in Fort Lee
Fertility by Age in Fort Lee
Average fertility rate in Fort Lee is 102.0 births per 1,000 women. Women in the age bracket of 20 to 34 years have the highest fertility rate with 176.0 births per 1,000 women. Women in the age bracket of 20 to 34 years acount for 96.1% of all women with births.
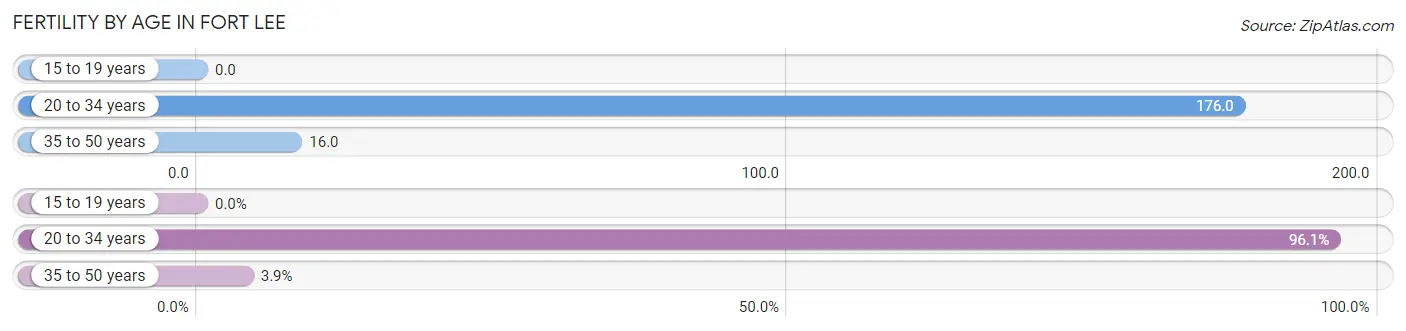
| Age Bracket | Women with Births | Births / 1,000 Women |
| 15 to 19 years | 0 (0.0%) | 0.0 |
| 20 to 34 years | 198 (96.1%) | 176.0 |
| 35 to 50 years | 8 (3.9%) | 16.0 |
| Total | 206 (100.0%) | 102.0 |
Fertility by Age by Marriage Status in Fort Lee
49.5% of women with births (206) in Fort Lee are married. The highest percentage of unmarried women with births falls into 20 to 34 years age bracket with 52.5% of them unmarried at the time of birth, while the lowest percentage of unmarried women with births belong to 35 to 50 years age bracket with 0.0% of them unmarried.
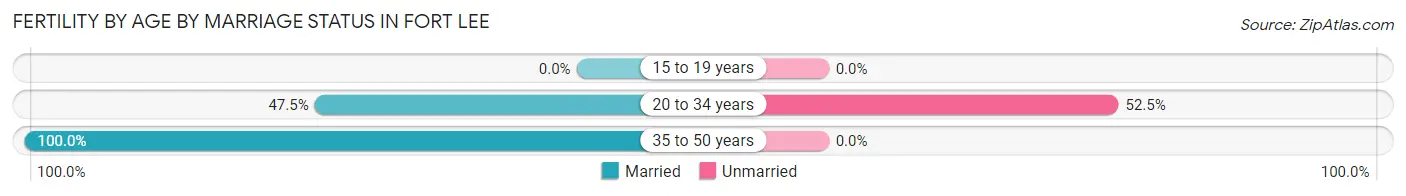
| Age Bracket | Married | Unmarried |
| 15 to 19 years | 0 (0.0%) | 0 (0.0%) |
| 20 to 34 years | 94 (47.5%) | 104 (52.5%) |
| 35 to 50 years | 8 (100.0%) | 0 (0.0%) |
| Total | 102 (49.5%) | 104 (50.5%) |
Fertility by Education in Fort Lee
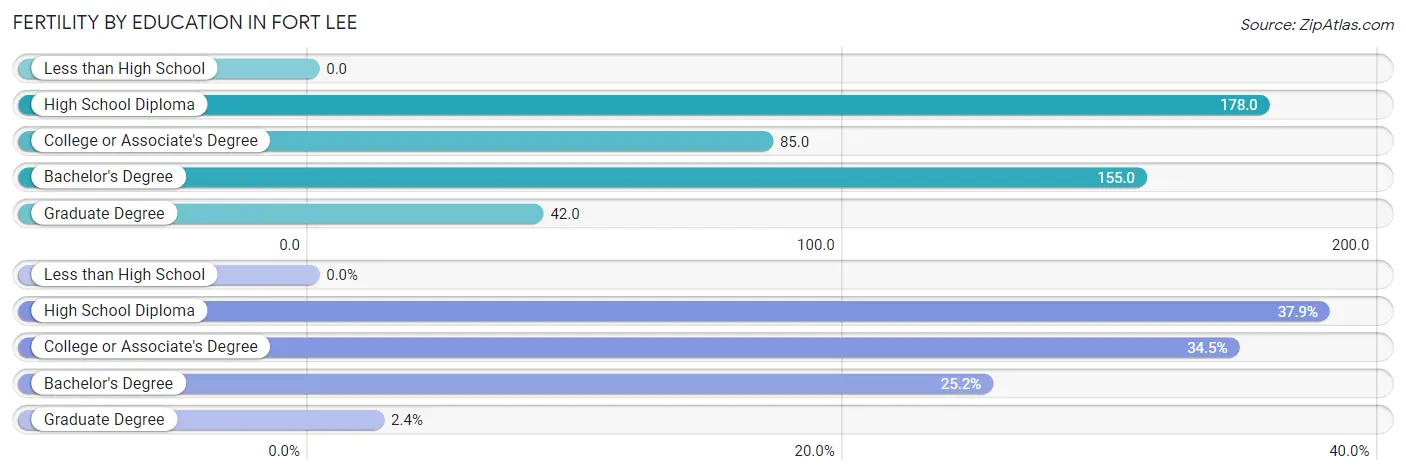
| Educational Attainment | Women with Births | Births / 1,000 Women |
| Less than High School | 0 (0.0%) | 0.0 |
| High School Diploma | 78 (37.9%) | 178.0 |
| College or Associate's Degree | 71 (34.5%) | 85.0 |
| Bachelor's Degree | 52 (25.2%) | 155.0 |
| Graduate Degree | 5 (2.4%) | 42.0 |
| Total | 206 (100.0%) | 102.0 |
Fertility by Education by Marriage Status in Fort Lee
50.5% of women with births in Fort Lee are unmarried. Women with the educational attainment of bachelor's degree are most likely to be married with 100.0% of them married at childbirth, while women with the educational attainment of high school diploma are least likely to be married with 78.2% of them unmarried at childbirth.
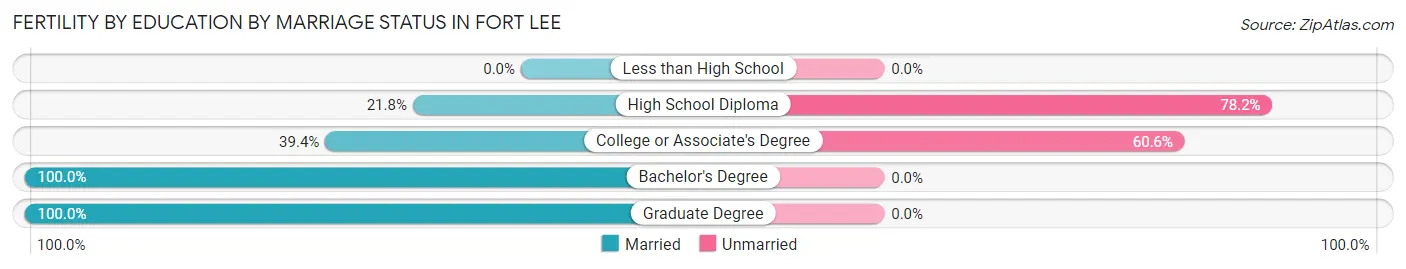
| Educational Attainment | Married | Unmarried |
| Less than High School | 0 (0.0%) | 0 (0.0%) |
| High School Diploma | 17 (21.8%) | 61 (78.2%) |
| College or Associate's Degree | 28 (39.4%) | 43 (60.6%) |
| Bachelor's Degree | 52 (100.0%) | 0 (0.0%) |
| Graduate Degree | 5 (100.0%) | 0 (0.0%) |
| Total | 102 (49.5%) | 104 (50.5%) |
Employment Characteristics in Fort Lee
Employment by Class of Employer in Fort Lee
Among the 4,055 employed individuals in Fort Lee, federal government employees (3,324 | 82.0%), private company employees (548 | 13.5%), and not-for-profit organizations (82 | 2.0%) make up the most common classes of employment.
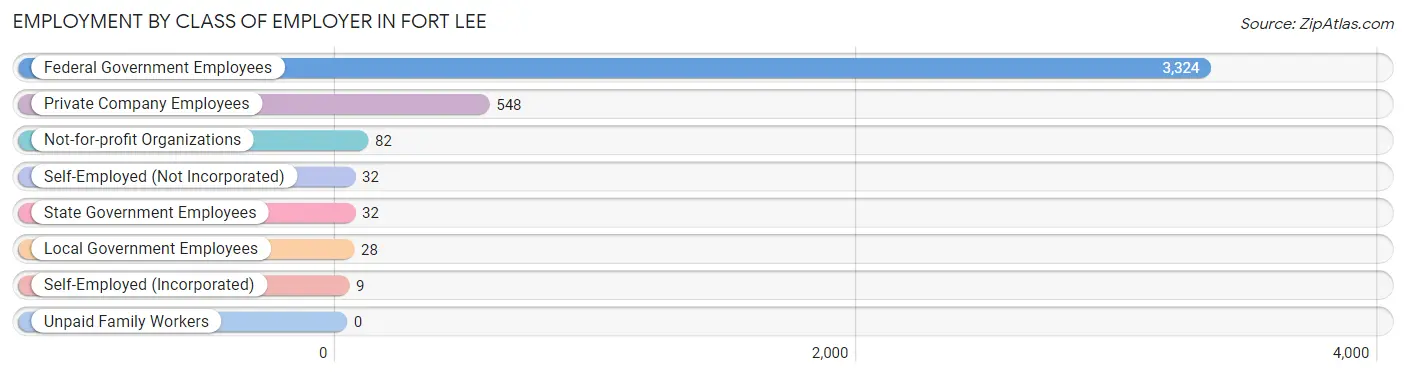
| Employer Class | # Employees | % Employees |
| Private Company Employees | 548 | 13.5% |
| Self-Employed (Incorporated) | 9 | 0.2% |
| Self-Employed (Not Incorporated) | 32 | 0.8% |
| Not-for-profit Organizations | 82 | 2.0% |
| Local Government Employees | 28 | 0.7% |
| State Government Employees | 32 | 0.8% |
| Federal Government Employees | 3,324 | 82.0% |
| Unpaid Family Workers | 0 | 0.0% |
| Total | 4,055 | 100.0% |
Employment Status by Age in Fort Lee
According to the labor force statistics for Fort Lee, out of the total population over 16 years of age (5,524), 82.2% or 4,541 individuals are in the labor force, with 30.7% or 1,394 of them unemployed. The age group with the highest labor force participation rate is 65 to 74 years, with 100.0% or 5 individuals in the labor force. Within the labor force, the 20 to 24 years age range has the highest percentage of unemployed individuals, with 77.1% or 956 of them being unemployed.
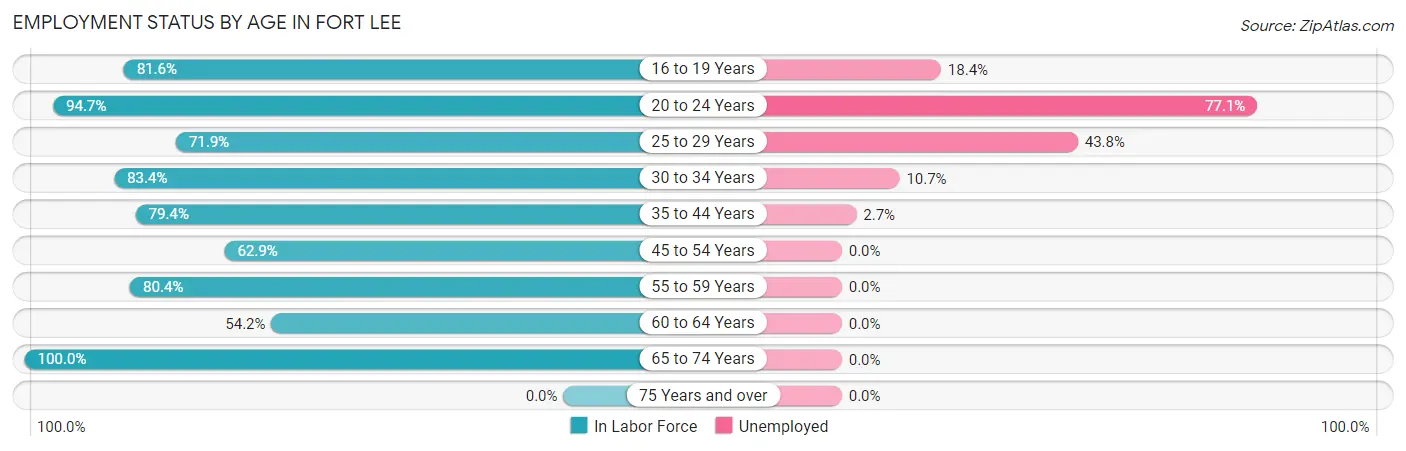
| Age Bracket | In Labor Force | Unemployed |
| 16 to 19 Years | 1,012 (81.6%) | 186 (18.4%) |
| 20 to 24 Years | 1,240 (94.7%) | 956 (77.1%) |
| 25 to 29 Years | 524 (71.9%) | 230 (43.8%) |
| 30 to 34 Years | 584 (83.4%) | 62 (10.7%) |
| 35 to 44 Years | 950 (79.4%) | 26 (2.7%) |
| 45 to 54 Years | 166 (62.9%) | 0 (0.0%) |
| 55 to 59 Years | 45 (80.4%) | 0 (0.0%) |
| 60 to 64 Years | 13 (54.2%) | 0 (0.0%) |
| 65 to 74 Years | 5 (100.0%) | 0 (0.0%) |
| 75 Years and over | 0 (0.0%) | 0 (0.0%) |
| Total | 4,541 (82.2%) | 1,394 (30.7%) |
Employment Status by Educational Attainment in Fort Lee
According to labor force statistics for Fort Lee, 76.9% of individuals (2,284) out of the total population between 25 and 64 years of age (2,970) are in the labor force, with 10.9% or 249 of them being unemployed. The group with the highest labor force participation rate are those with the educational attainment of college / associate degree, with 85.8% or 1,295 individuals in the labor force. Within the labor force, individuals with high school diploma education have the highest percentage of unemployment, with 27.7% or 73 of them being unemployed.
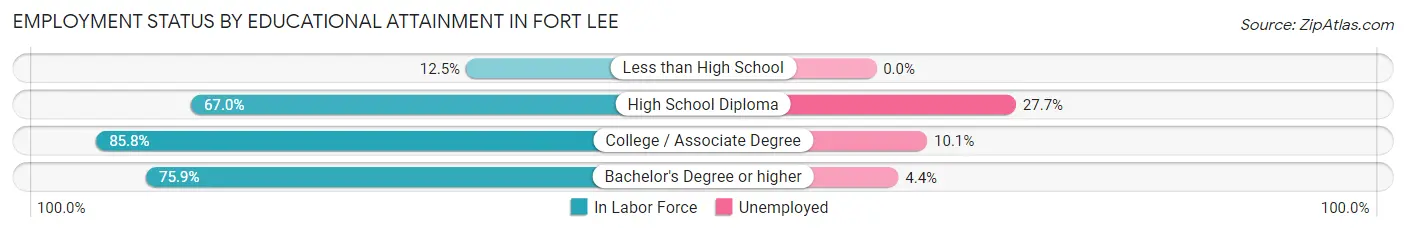
| Educational Attainment | In Labor Force | Unemployed |
| Less than High School | 17 (12.5%) | 0 (0.0%) |
| High School Diploma | 264 (67.0%) | 109 (27.7%) |
| College / Associate Degree | 1,295 (85.8%) | 152 (10.1%) |
| Bachelor's Degree or higher | 707 (75.9%) | 41 (4.4%) |
| Total | 2,284 (76.9%) | 324 (10.9%) |
Employment Occupations by Sex in Fort Lee
Management, Business, Science and Arts Occupations
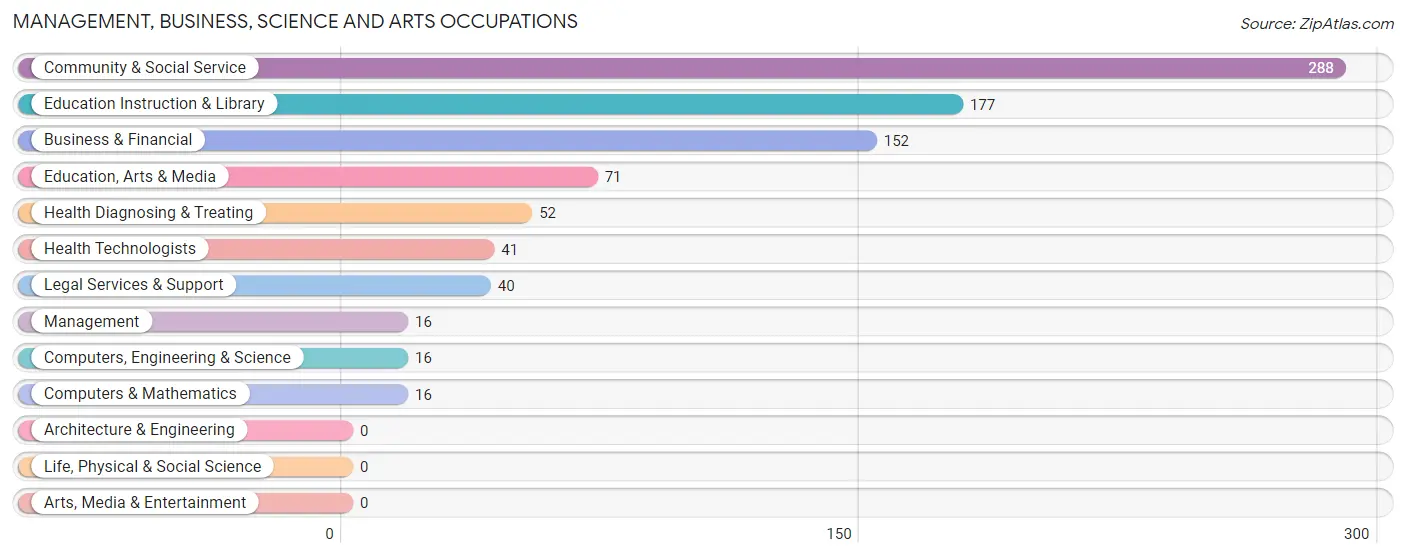
The most common Management, Business, Science and Arts occupations in Fort Lee are Community & Social Service (288 | 29.4%), Education Instruction & Library (177 | 18.1%), Business & Financial (152 | 15.5%), Education, Arts & Media (71 | 7.3%), and Health Diagnosing & Treating (52 | 5.3%).
Management, Business, Science and Arts Occupations by Sex
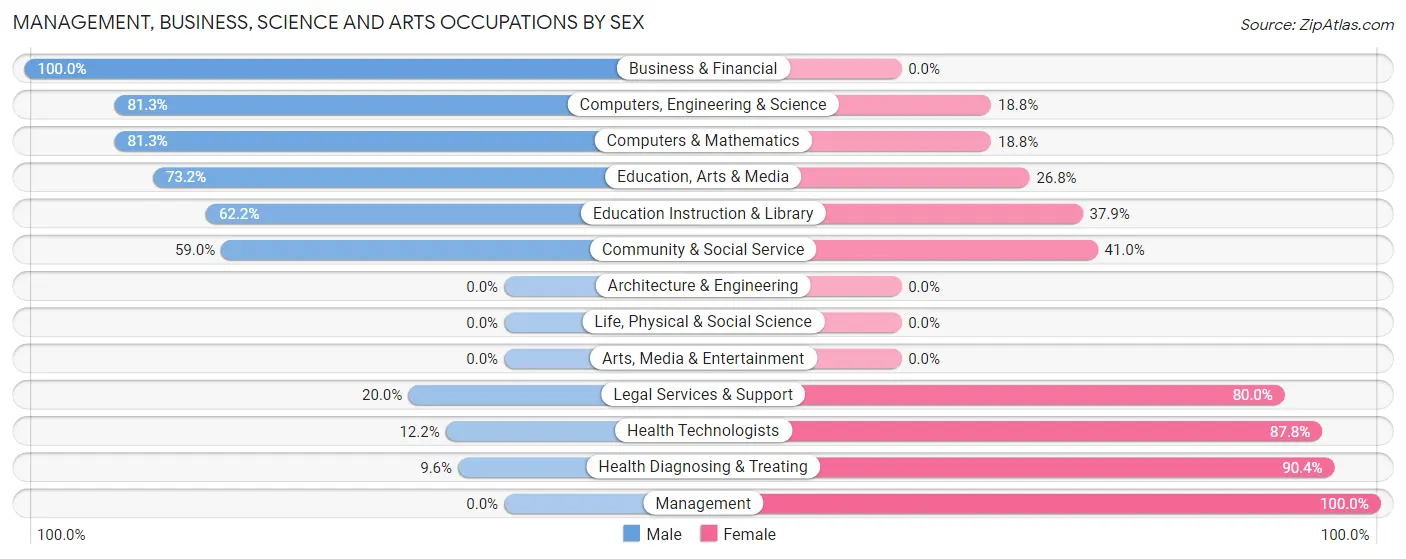
Within the Management, Business, Science and Arts occupations in Fort Lee, the most male-oriented occupations are Business & Financial (100.0%), Computers, Engineering & Science (81.2%), and Computers & Mathematics (81.2%), while the most female-oriented occupations are Management (100.0%), Health Diagnosing & Treating (90.4%), and Health Technologists (87.8%).
| Occupation | Male | Female |
| Management | 0 (0.0%) | 16 (100.0%) |
| Business & Financial | 152 (100.0%) | 0 (0.0%) |
| Computers, Engineering & Science | 13 (81.2%) | 3 (18.8%) |
| Computers & Mathematics | 13 (81.2%) | 3 (18.8%) |
| Architecture & Engineering | 0 (0.0%) | 0 (0.0%) |
| Life, Physical & Social Science | 0 (0.0%) | 0 (0.0%) |
| Community & Social Service | 170 (59.0%) | 118 (41.0%) |
| Education, Arts & Media | 52 (73.2%) | 19 (26.8%) |
| Legal Services & Support | 8 (20.0%) | 32 (80.0%) |
| Education Instruction & Library | 110 (62.2%) | 67 (37.9%) |
| Arts, Media & Entertainment | 0 (0.0%) | 0 (0.0%) |
| Health Diagnosing & Treating | 5 (9.6%) | 47 (90.4%) |
| Health Technologists | 5 (12.2%) | 36 (87.8%) |
| Total (Category) | 340 (64.9%) | 184 (35.1%) |
| Total (Overall) | 491 (50.2%) | 487 (49.8%) |
Services Occupations
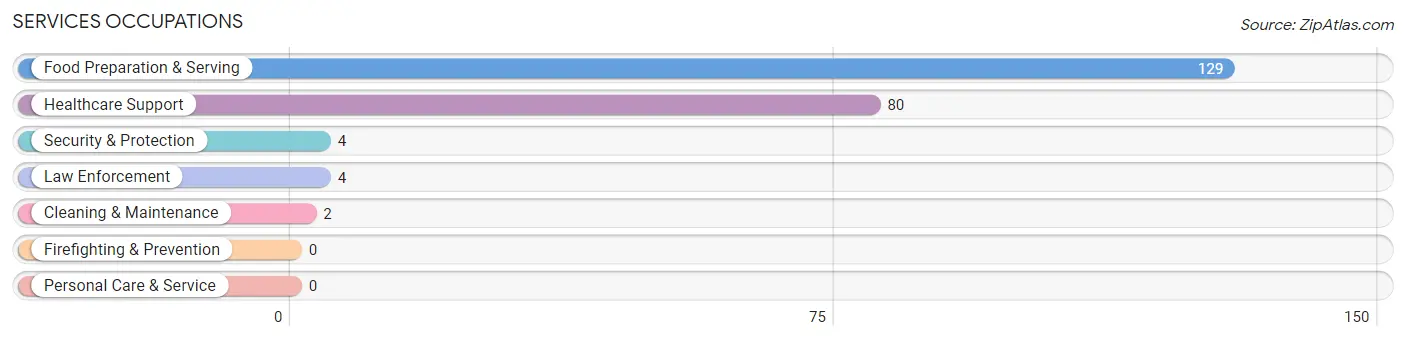
The most common Services occupations in Fort Lee are Food Preparation & Serving (129 | 13.2%), Healthcare Support (80 | 8.2%), Security & Protection (4 | 0.4%), Law Enforcement (4 | 0.4%), and Cleaning & Maintenance (2 | 0.2%).
Services Occupations by Sex
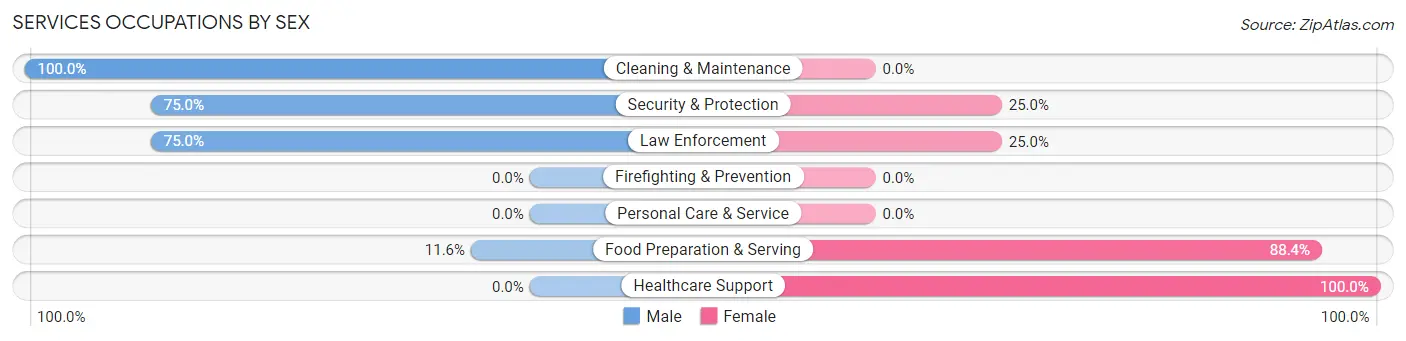
Within the Services occupations in Fort Lee, the most male-oriented occupations are Cleaning & Maintenance (100.0%), Security & Protection (75.0%), and Law Enforcement (75.0%), while the most female-oriented occupations are Healthcare Support (100.0%), Food Preparation & Serving (88.4%), and Security & Protection (25.0%).
| Occupation | Male | Female |
| Healthcare Support | 0 (0.0%) | 80 (100.0%) |
| Security & Protection | 3 (75.0%) | 1 (25.0%) |
| Firefighting & Prevention | 0 (0.0%) | 0 (0.0%) |
| Law Enforcement | 3 (75.0%) | 1 (25.0%) |
| Food Preparation & Serving | 15 (11.6%) | 114 (88.4%) |
| Cleaning & Maintenance | 2 (100.0%) | 0 (0.0%) |
| Personal Care & Service | 0 (0.0%) | 0 (0.0%) |
| Total (Category) | 20 (9.3%) | 195 (90.7%) |
| Total (Overall) | 491 (50.2%) | 487 (49.8%) |
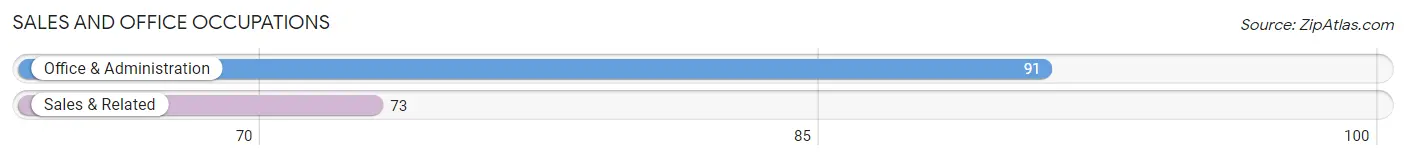
Sales and Office Occupations
The most common Sales and Office occupations in Fort Lee are Office & Administration (91 | 9.3%), and Sales & Related (73 | 7.5%).
Sales and Office Occupations by Sex
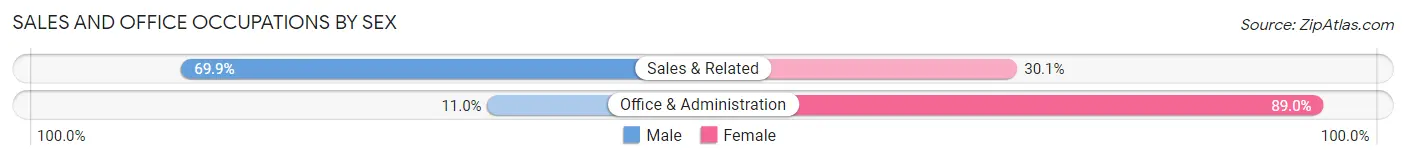
| Occupation | Male | Female |
| Sales & Related | 51 (69.9%) | 22 (30.1%) |
| Office & Administration | 10 (11.0%) | 81 (89.0%) |
| Total (Category) | 61 (37.2%) | 103 (62.8%) |
| Total (Overall) | 491 (50.2%) | 487 (49.8%) |
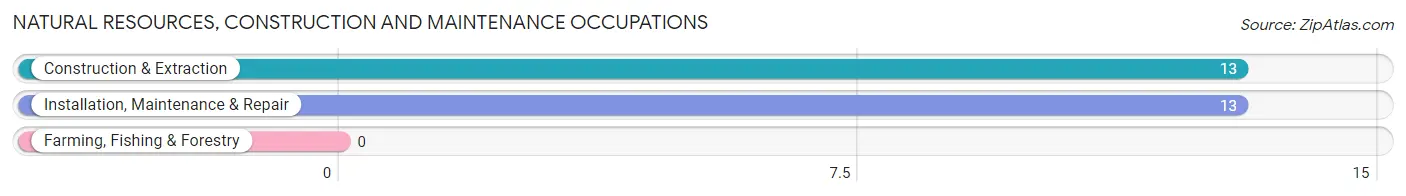
Natural Resources, Construction and Maintenance Occupations
The most common Natural Resources, Construction and Maintenance occupations in Fort Lee are Construction & Extraction (13 | 1.3%), and Installation, Maintenance & Repair (13 | 1.3%).
Natural Resources, Construction and Maintenance Occupations by Sex
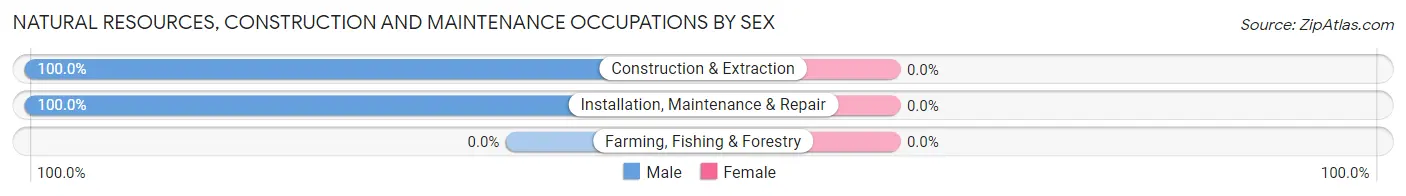
| Occupation | Male | Female |
| Farming, Fishing & Forestry | 0 (0.0%) | 0 (0.0%) |
| Construction & Extraction | 13 (100.0%) | 0 (0.0%) |
| Installation, Maintenance & Repair | 13 (100.0%) | 0 (0.0%) |
| Total (Category) | 26 (100.0%) | 0 (0.0%) |
| Total (Overall) | 491 (50.2%) | 487 (49.8%) |
Production, Transportation and Moving Occupations
The most common Production, Transportation and Moving occupations in Fort Lee are Production (31 | 3.2%), and Material Moving (18 | 1.8%).
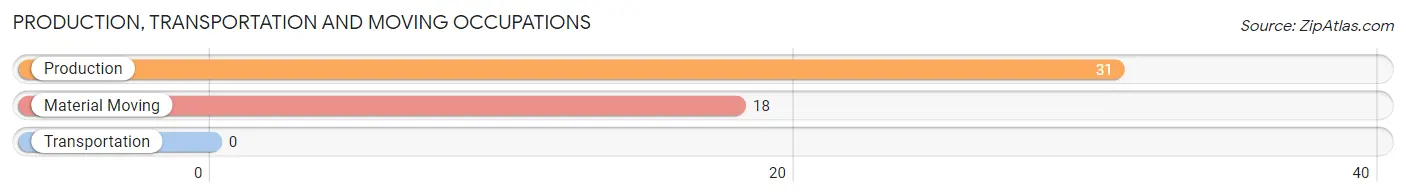
Production, Transportation and Moving Occupations by Sex
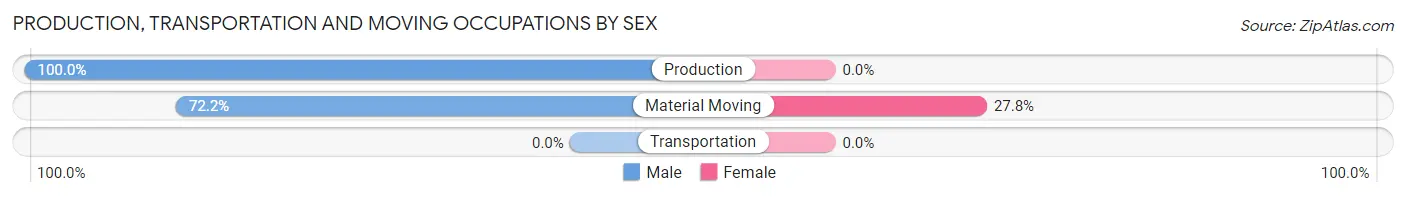
| Occupation | Male | Female |
| Production | 31 (100.0%) | 0 (0.0%) |
| Transportation | 0 (0.0%) | 0 (0.0%) |
| Material Moving | 13 (72.2%) | 5 (27.8%) |
| Total (Category) | 44 (89.8%) | 5 (10.2%) |
| Total (Overall) | 491 (50.2%) | 487 (49.8%) |
Employment Industries by Sex in Fort Lee
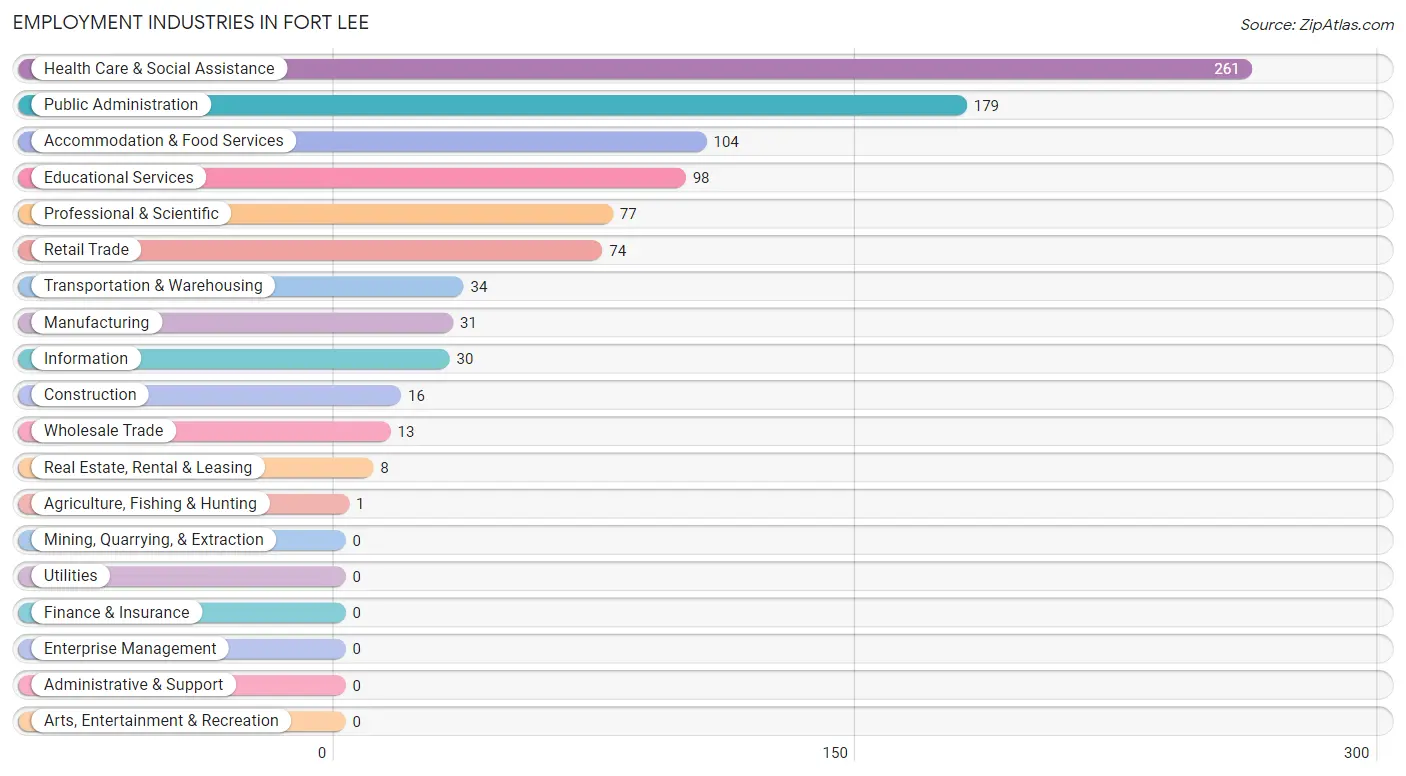
Employment Industries in Fort Lee
The major employment industries in Fort Lee include Health Care & Social Assistance (261 | 26.7%), Public Administration (179 | 18.3%), Accommodation & Food Services (104 | 10.6%), Educational Services (98 | 10.0%), and Professional & Scientific (77 | 7.9%).
Employment Industries by Sex in Fort Lee
The Fort Lee industries that see more men than women are Agriculture, Fishing & Hunting (100.0%), Manufacturing (100.0%), and Transportation & Warehousing (100.0%), whereas the industries that tend to have a higher number of women are Information (100.0%), Real Estate, Rental & Leasing (100.0%), and Accommodation & Food Services (85.6%).
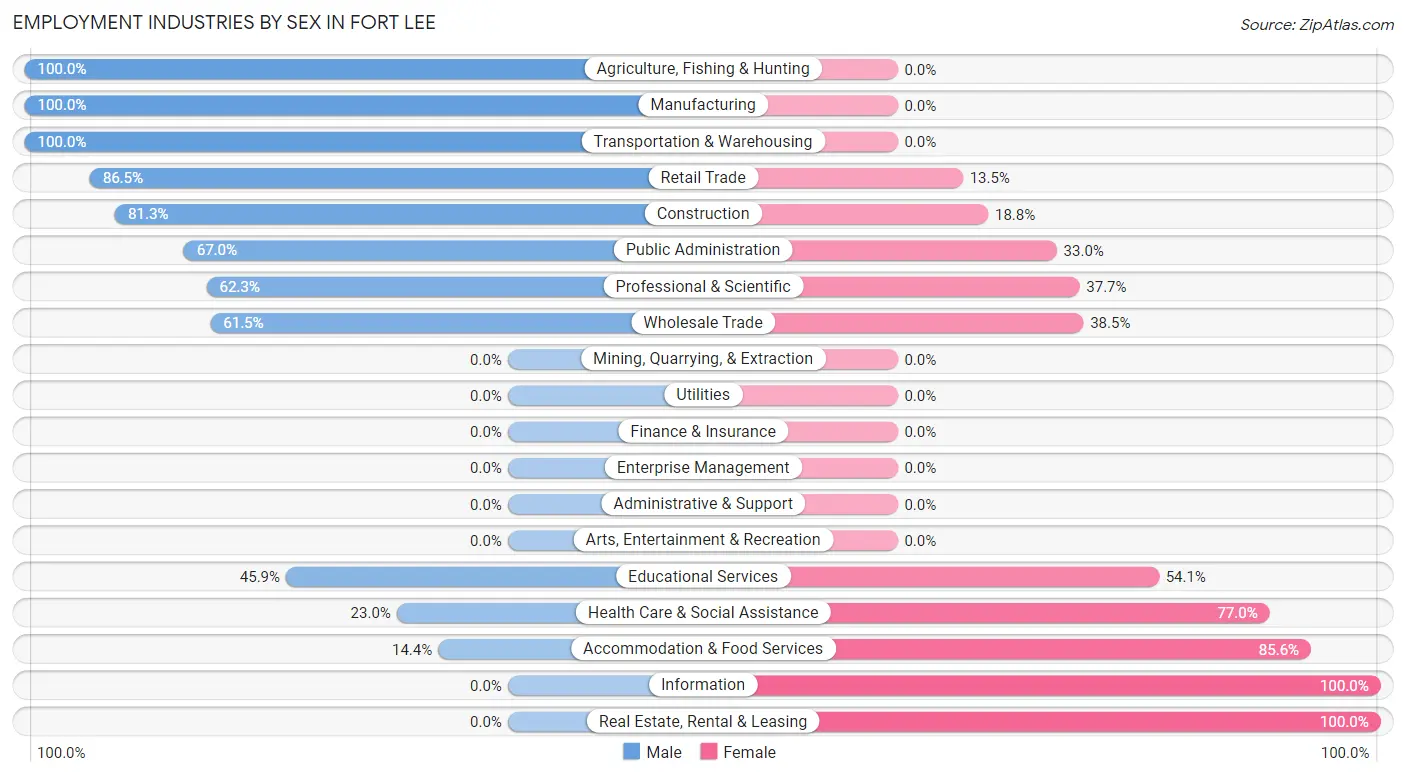
| Industry | Male | Female |
| Agriculture, Fishing & Hunting | 1 (100.0%) | 0 (0.0%) |
| Mining, Quarrying, & Extraction | 0 (0.0%) | 0 (0.0%) |
| Construction | 13 (81.2%) | 3 (18.8%) |
| Manufacturing | 31 (100.0%) | 0 (0.0%) |
| Wholesale Trade | 8 (61.5%) | 5 (38.5%) |
| Retail Trade | 64 (86.5%) | 10 (13.5%) |
| Transportation & Warehousing | 34 (100.0%) | 0 (0.0%) |
| Utilities | 0 (0.0%) | 0 (0.0%) |
| Information | 0 (0.0%) | 30 (100.0%) |
| Finance & Insurance | 0 (0.0%) | 0 (0.0%) |
| Real Estate, Rental & Leasing | 0 (0.0%) | 8 (100.0%) |
| Professional & Scientific | 48 (62.3%) | 29 (37.7%) |
| Enterprise Management | 0 (0.0%) | 0 (0.0%) |
| Administrative & Support | 0 (0.0%) | 0 (0.0%) |
| Educational Services | 45 (45.9%) | 53 (54.1%) |
| Health Care & Social Assistance | 60 (23.0%) | 201 (77.0%) |
| Arts, Entertainment & Recreation | 0 (0.0%) | 0 (0.0%) |
| Accommodation & Food Services | 15 (14.4%) | 89 (85.6%) |
| Public Administration | 120 (67.0%) | 59 (33.0%) |
| Total | 491 (50.2%) | 487 (49.8%) |
Education in Fort Lee
School Enrollment in Fort Lee
The most common levels of schooling among the 2,732 students in Fort Lee are college / undergraduate (1,079 | 39.5%), elementary school (491 | 18.0%), and high school (434 | 15.9%).
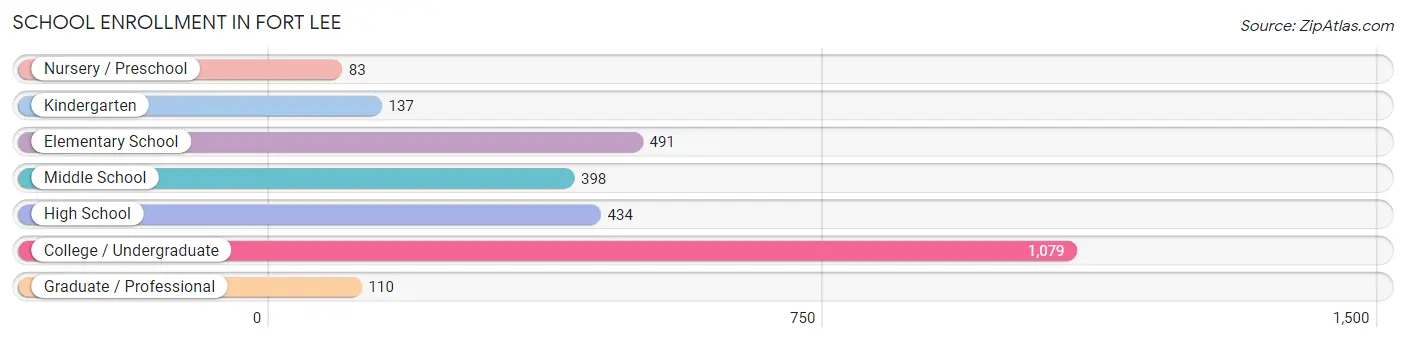
| School Level | # Students | % Students |
| Nursery / Preschool | 83 | 3.0% |
| Kindergarten | 137 | 5.0% |
| Elementary School | 491 | 18.0% |
| Middle School | 398 | 14.6% |
| High School | 434 | 15.9% |
| College / Undergraduate | 1,079 | 39.5% |
| Graduate / Professional | 110 | 4.0% |
| Total | 2,732 | 100.0% |
School Enrollment by Age by Funding Source in Fort Lee
Out of a total of 2,732 students who are enrolled in schools in Fort Lee, 180 (6.6%) attend a private institution, while the remaining 2,552 (93.4%) are enrolled in public schools. The age group of 3 to 4 year olds has the highest likelihood of being enrolled in private schools, with 9 (28.1% in the age bracket) enrolled. Conversely, the age group of 15 to 17 year olds has the lowest likelihood of being enrolled in a private school, with 230 (100.0% in the age bracket) attending a public institution.
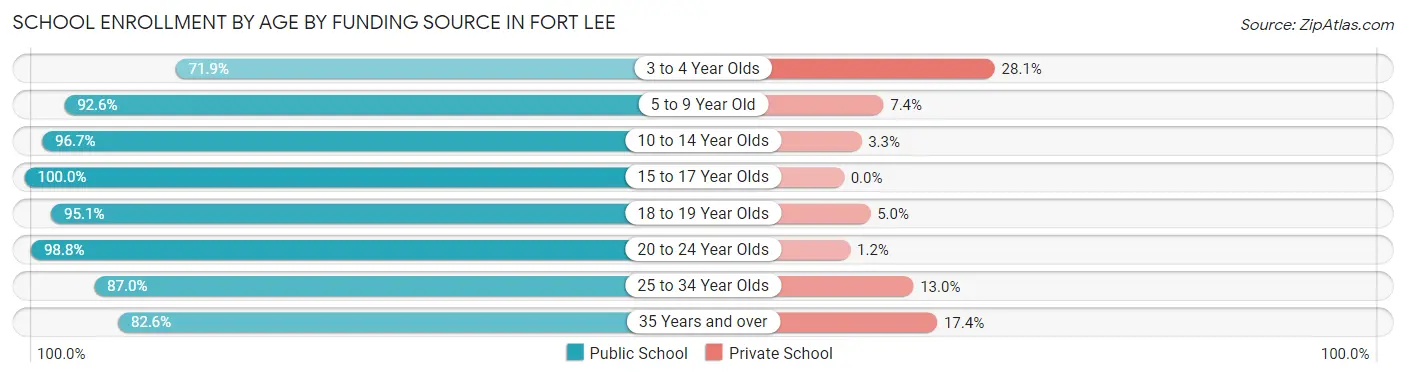
| Age Bracket | Public School | Private School |
| 3 to 4 Year Olds | 23 (71.9%) | 9 (28.1%) |
| 5 to 9 Year Old | 540 (92.6%) | 43 (7.4%) |
| 10 to 14 Year Olds | 592 (96.7%) | 20 (3.3%) |
| 15 to 17 Year Olds | 230 (100.0%) | 0 (0.0%) |
| 18 to 19 Year Olds | 269 (95.1%) | 14 (5.0%) |
| 20 to 24 Year Olds | 412 (98.8%) | 5 (1.2%) |
| 25 to 34 Year Olds | 235 (87.0%) | 35 (13.0%) |
| 35 Years and over | 252 (82.6%) | 53 (17.4%) |
| Total | 2,552 (93.4%) | 180 (6.6%) |
Educational Attainment by Field of Study in Fort Lee
Business (161 | 17.1%), multidisciplinary studies (156 | 16.6%), science & technology (149 | 15.9%), arts & humanities (120 | 12.8%), and social sciences (101 | 10.7%) are the most common fields of study among 940 individuals in Fort Lee who have obtained a bachelor's degree or higher.
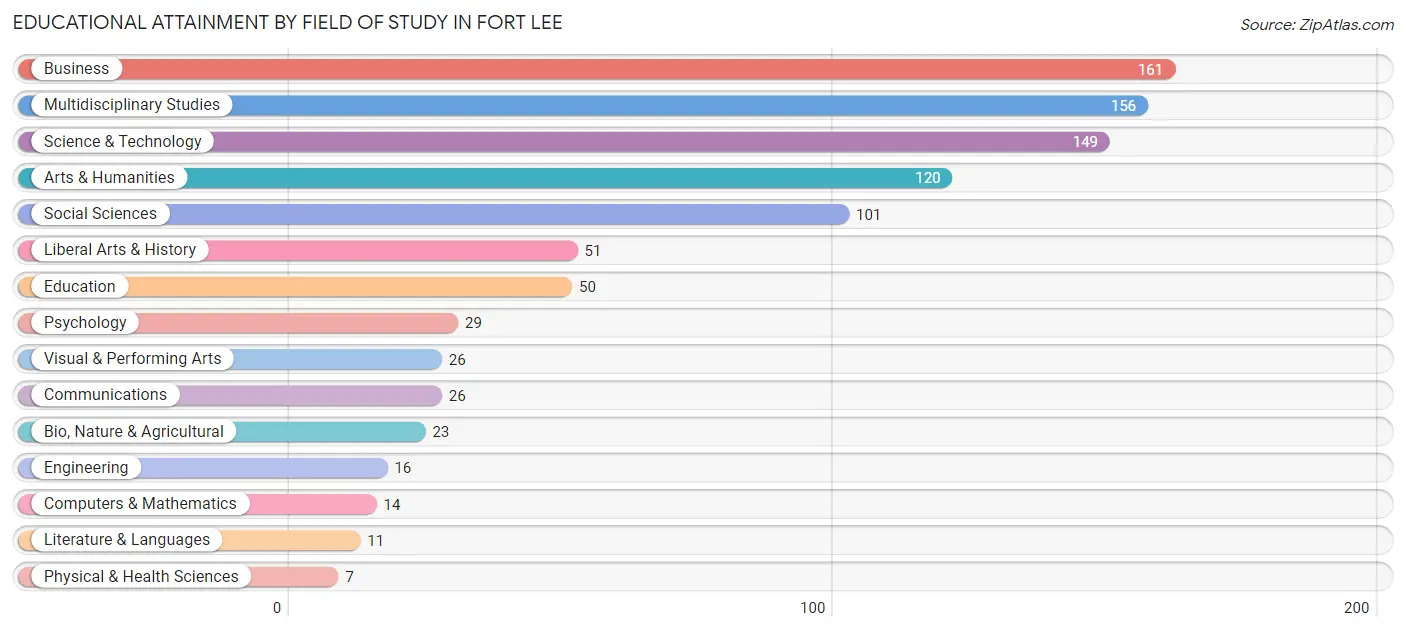
| Field of Study | # Graduates | % Graduates |
| Computers & Mathematics | 14 | 1.5% |
| Bio, Nature & Agricultural | 23 | 2.5% |
| Physical & Health Sciences | 7 | 0.7% |
| Psychology | 29 | 3.1% |
| Social Sciences | 101 | 10.7% |
| Engineering | 16 | 1.7% |
| Multidisciplinary Studies | 156 | 16.6% |
| Science & Technology | 149 | 15.9% |
| Business | 161 | 17.1% |
| Education | 50 | 5.3% |
| Literature & Languages | 11 | 1.2% |
| Liberal Arts & History | 51 | 5.4% |
| Visual & Performing Arts | 26 | 2.8% |
| Communications | 26 | 2.8% |
| Arts & Humanities | 120 | 12.8% |
| Total | 940 | 100.0% |
Transportation & Commute in Fort Lee
Vehicle Availability by Sex in Fort Lee
The most prevalent vehicle ownership categories in Fort Lee are males with 2 vehicles (925, accounting for 67.6%) and females with 2 vehicles (317, making up 133.1%).
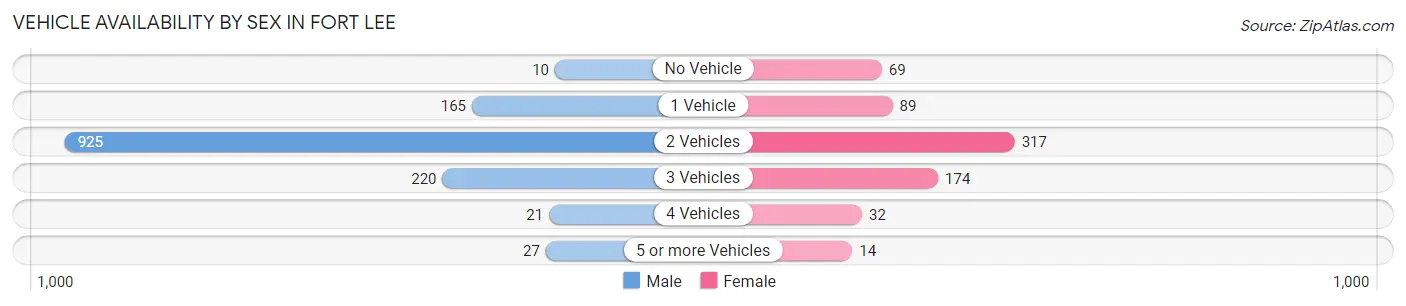
| Vehicles Available | Male | Female |
| No Vehicle | 10 (0.7%) | 69 (9.9%) |
| 1 Vehicle | 165 (12.1%) | 89 (12.8%) |
| 2 Vehicles | 925 (67.6%) | 317 (45.6%) |
| 3 Vehicles | 220 (16.1%) | 174 (25.0%) |
| 4 Vehicles | 21 (1.5%) | 32 (4.6%) |
| 5 or more Vehicles | 27 (2.0%) | 14 (2.0%) |
| Total | 1,368 (100.0%) | 695 (100.0%) |
Commute Time in Fort Lee
The most frequently occuring commute durations in Fort Lee are 5 to 9 minutes (1,165 commuters, 38.5%), 10 to 14 minutes (869 commuters, 28.7%), and 15 to 19 minutes (343 commuters, 11.3%).
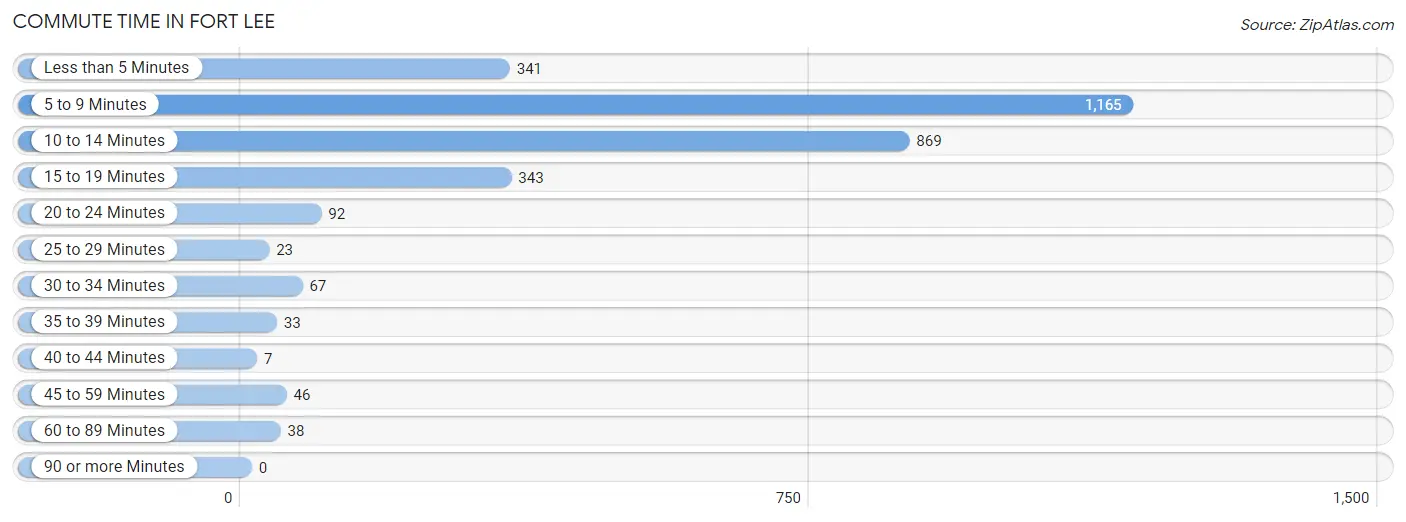
| Commute Time | # Commuters | % Commuters |
| Less than 5 Minutes | 341 | 11.3% |
| 5 to 9 Minutes | 1,165 | 38.5% |
| 10 to 14 Minutes | 869 | 28.7% |
| 15 to 19 Minutes | 343 | 11.3% |
| 20 to 24 Minutes | 92 | 3.0% |
| 25 to 29 Minutes | 23 | 0.8% |
| 30 to 34 Minutes | 67 | 2.2% |
| 35 to 39 Minutes | 33 | 1.1% |
| 40 to 44 Minutes | 7 | 0.2% |
| 45 to 59 Minutes | 46 | 1.5% |
| 60 to 89 Minutes | 38 | 1.3% |
| 90 or more Minutes | 0 | 0.0% |
Commute Time by Sex in Fort Lee
The most common commute times in Fort Lee are 5 to 9 minutes (879 commuters, 38.6%) for males and 5 to 9 minutes (286 commuters, 38.3%) for females.
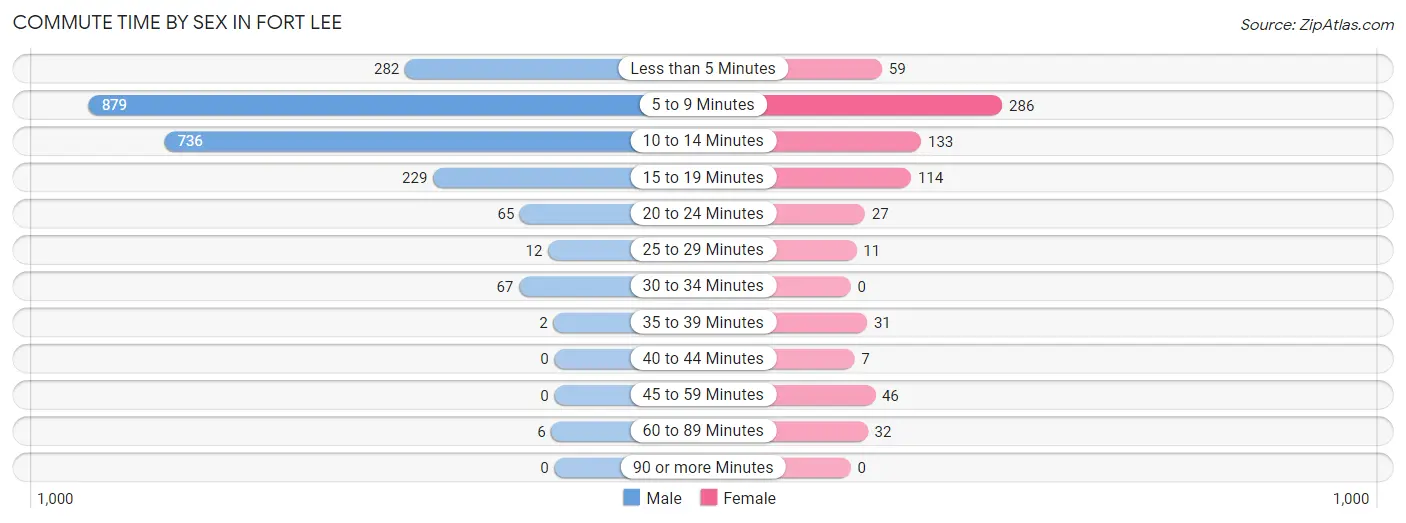
| Commute Time | Male | Female |
| Less than 5 Minutes | 282 (12.4%) | 59 (7.9%) |
| 5 to 9 Minutes | 879 (38.6%) | 286 (38.3%) |
| 10 to 14 Minutes | 736 (32.3%) | 133 (17.8%) |
| 15 to 19 Minutes | 229 (10.1%) | 114 (15.3%) |
| 20 to 24 Minutes | 65 (2.9%) | 27 (3.6%) |
| 25 to 29 Minutes | 12 (0.5%) | 11 (1.5%) |
| 30 to 34 Minutes | 67 (2.9%) | 0 (0.0%) |
| 35 to 39 Minutes | 2 (0.1%) | 31 (4.2%) |
| 40 to 44 Minutes | 0 (0.0%) | 7 (0.9%) |
| 45 to 59 Minutes | 0 (0.0%) | 46 (6.2%) |
| 60 to 89 Minutes | 6 (0.3%) | 32 (4.3%) |
| 90 or more Minutes | 0 (0.0%) | 0 (0.0%) |
Time of Departure to Work by Sex in Fort Lee
The most frequent times of departure to work in Fort Lee are 12:00 AM to 4:59 AM (626, 27.5%) for males and 8:00 AM to 8:29 AM (122, 16.4%) for females.
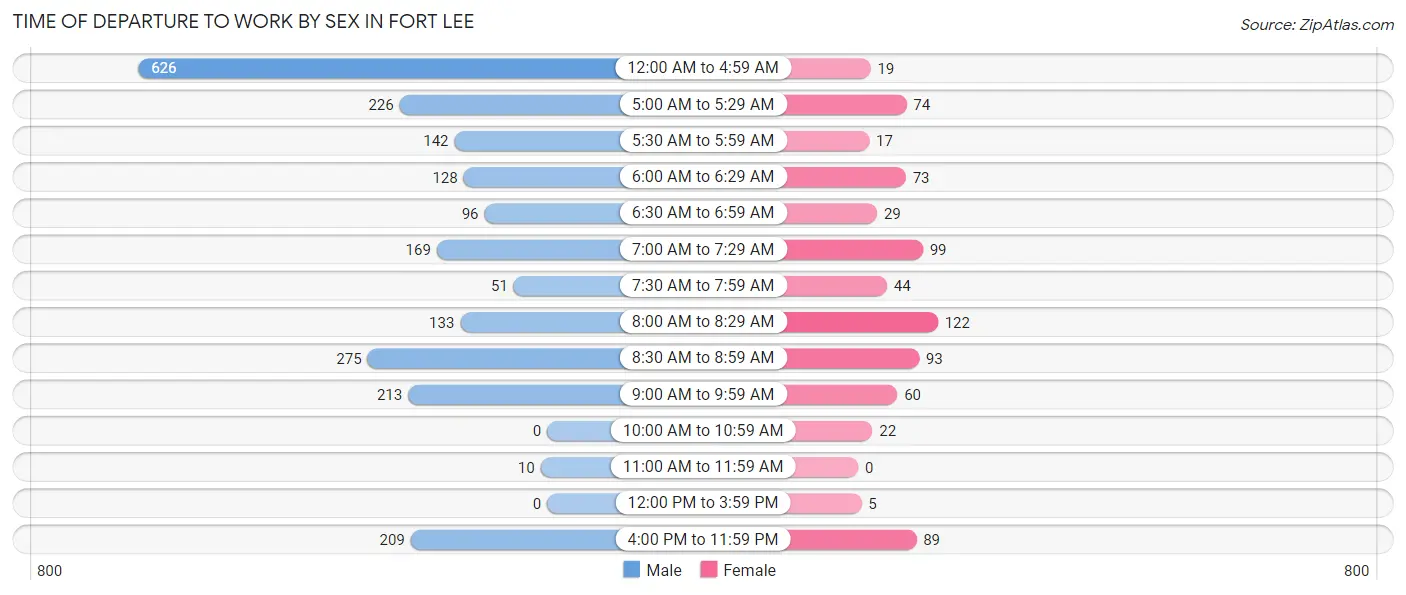
| Time of Departure | Male | Female |
| 12:00 AM to 4:59 AM | 626 (27.5%) | 19 (2.5%) |
| 5:00 AM to 5:29 AM | 226 (9.9%) | 74 (9.9%) |
| 5:30 AM to 5:59 AM | 142 (6.2%) | 17 (2.3%) |
| 6:00 AM to 6:29 AM | 128 (5.6%) | 73 (9.8%) |
| 6:30 AM to 6:59 AM | 96 (4.2%) | 29 (3.9%) |
| 7:00 AM to 7:29 AM | 169 (7.4%) | 99 (13.3%) |
| 7:30 AM to 7:59 AM | 51 (2.2%) | 44 (5.9%) |
| 8:00 AM to 8:29 AM | 133 (5.8%) | 122 (16.4%) |
| 8:30 AM to 8:59 AM | 275 (12.1%) | 93 (12.5%) |
| 9:00 AM to 9:59 AM | 213 (9.3%) | 60 (8.0%) |
| 10:00 AM to 10:59 AM | 0 (0.0%) | 22 (2.9%) |
| 11:00 AM to 11:59 AM | 10 (0.4%) | 0 (0.0%) |
| 12:00 PM to 3:59 PM | 0 (0.0%) | 5 (0.7%) |
| 4:00 PM to 11:59 PM | 209 (9.2%) | 89 (11.9%) |
| Total | 2,278 (100.0%) | 746 (100.0%) |
Housing Occupancy in Fort Lee
Occupancy by Ownership in Fort Lee
Of the total 1,509 dwellings in Fort Lee, owner-occupied units account for 30 (2.0%), while renter-occupied units make up 1,479 (98.0%).
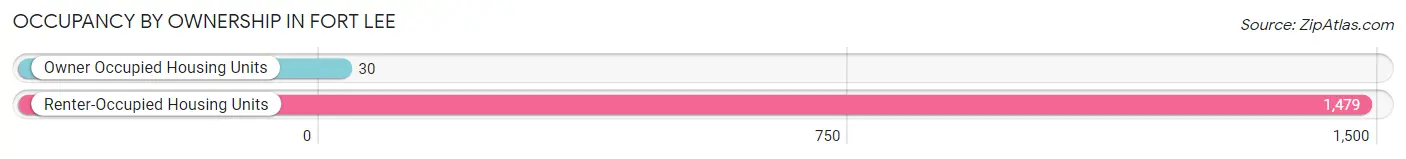
| Occupancy | # Housing Units | % Housing Units |
| Owner Occupied Housing Units | 30 | 2.0% |
| Renter-Occupied Housing Units | 1,479 | 98.0% |
| Total Occupied Housing Units | 1,509 | 100.0% |
Occupancy by Household Size in Fort Lee
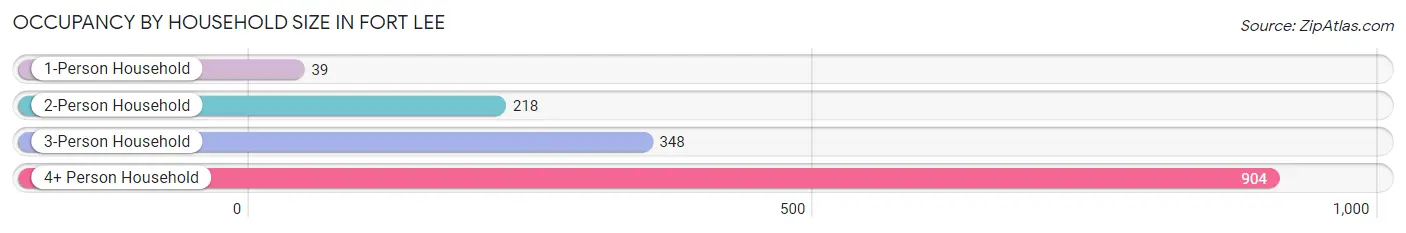
| Household Size | # Housing Units | % Housing Units |
| 1-Person Household | 39 | 2.6% |
| 2-Person Household | 218 | 14.4% |
| 3-Person Household | 348 | 23.1% |
| 4+ Person Household | 904 | 59.9% |
| Total Housing Units | 1,509 | 100.0% |
Occupancy by Ownership by Household Size in Fort Lee
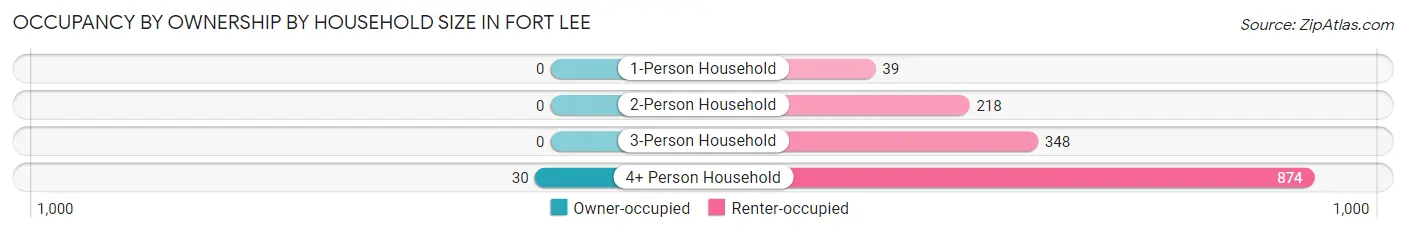
| Household Size | Owner-occupied | Renter-occupied |
| 1-Person Household | 0 (0.0%) | 39 (100.0%) |
| 2-Person Household | 0 (0.0%) | 218 (100.0%) |
| 3-Person Household | 0 (0.0%) | 348 (100.0%) |
| 4+ Person Household | 30 (3.3%) | 874 (96.7%) |
| Total Housing Units | 30 (2.0%) | 1,479 (98.0%) |
Occupancy by Educational Attainment in Fort Lee
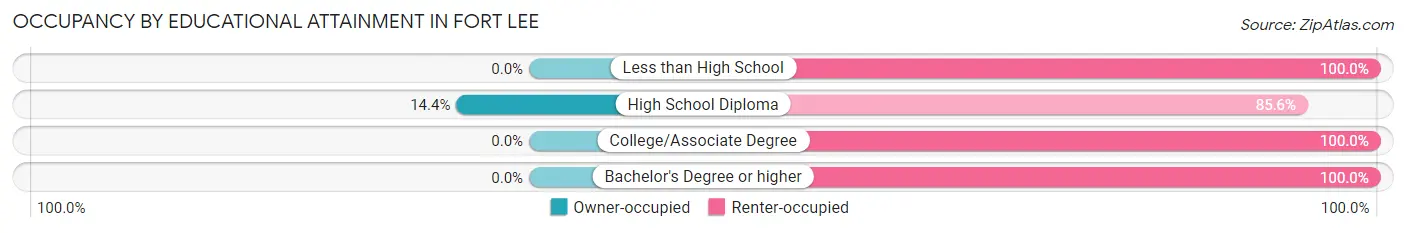
| Household Size | Owner-occupied | Renter-occupied |
| Less than High School | 0 (0.0%) | 13 (100.0%) |
| High School Diploma | 30 (14.4%) | 178 (85.6%) |
| College/Associate Degree | 0 (0.0%) | 806 (100.0%) |
| Bachelor's Degree or higher | 0 (0.0%) | 482 (100.0%) |
Occupancy by Age of Householder in Fort Lee
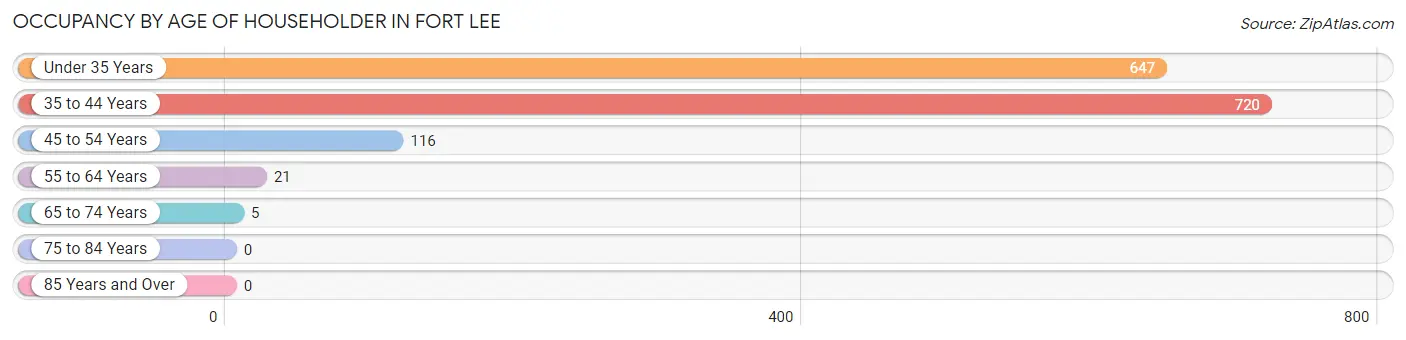
| Age Bracket | # Households | % Households |
| Under 35 Years | 647 | 42.9% |
| 35 to 44 Years | 720 | 47.7% |
| 45 to 54 Years | 116 | 7.7% |
| 55 to 64 Years | 21 | 1.4% |
| 65 to 74 Years | 5 | 0.3% |
| 75 to 84 Years | 0 | 0.0% |
| 85 Years and Over | 0 | 0.0% |
| Total | 1,509 | 100.0% |
Housing Finances in Fort Lee
Median Income by Occupancy in Fort Lee
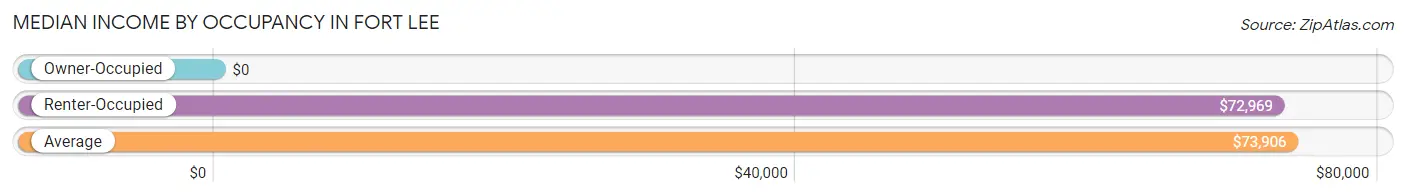
| Occupancy Type | # Households | Median Income |
| Owner-Occupied | 30 (2.0%) | $0 |
| Renter-Occupied | 1,479 (98.0%) | $72,969 |
| Average | 1,509 (100.0%) | $73,906 |
Occupancy by Householder Income Bracket in Fort Lee
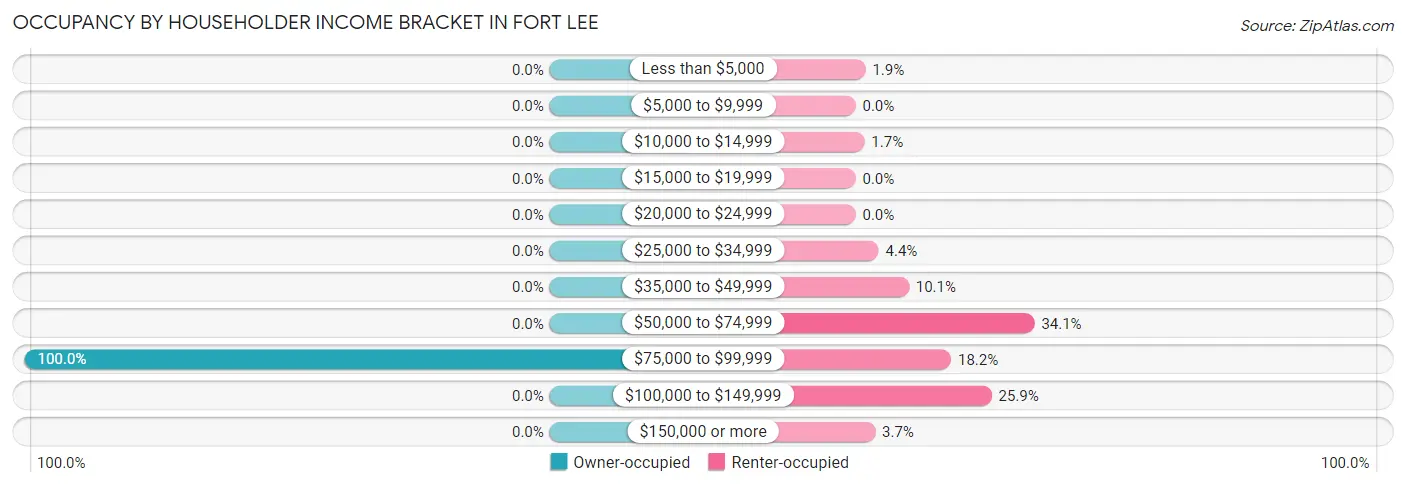
| Income Bracket | Owner-occupied | Renter-occupied |
| Less than $5,000 | 0 (0.0%) | 28 (1.9%) |
| $5,000 to $9,999 | 0 (0.0%) | 0 (0.0%) |
| $10,000 to $14,999 | 0 (0.0%) | 25 (1.7%) |
| $15,000 to $19,999 | 0 (0.0%) | 0 (0.0%) |
| $20,000 to $24,999 | 0 (0.0%) | 0 (0.0%) |
| $25,000 to $34,999 | 0 (0.0%) | 65 (4.4%) |
| $35,000 to $49,999 | 0 (0.0%) | 150 (10.1%) |
| $50,000 to $74,999 | 0 (0.0%) | 504 (34.1%) |
| $75,000 to $99,999 | 30 (100.0%) | 269 (18.2%) |
| $100,000 to $149,999 | 0 (0.0%) | 383 (25.9%) |
| $150,000 or more | 0 (0.0%) | 55 (3.7%) |
| Total | 30 (100.0%) | 1,479 (100.0%) |
Monthly Housing Cost Tiers in Fort Lee
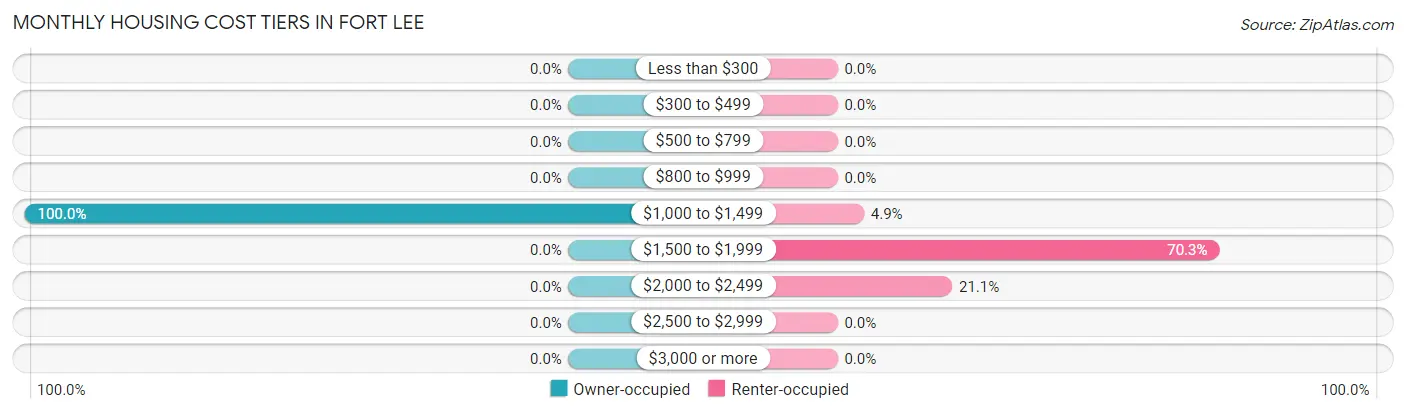
| Monthly Cost | Owner-occupied | Renter-occupied |
| Less than $300 | 0 (0.0%) | 0 (0.0%) |
| $300 to $499 | 0 (0.0%) | 0 (0.0%) |
| $500 to $799 | 0 (0.0%) | 0 (0.0%) |
| $800 to $999 | 0 (0.0%) | 0 (0.0%) |
| $1,000 to $1,499 | 30 (100.0%) | 72 (4.9%) |
| $1,500 to $1,999 | 0 (0.0%) | 1,040 (70.3%) |
| $2,000 to $2,499 | 0 (0.0%) | 312 (21.1%) |
| $2,500 to $2,999 | 0 (0.0%) | 0 (0.0%) |
| $3,000 or more | 0 (0.0%) | 0 (0.0%) |
| Total | 30 (100.0%) | 1,479 (100.0%) |
Physical Housing Characteristics in Fort Lee
Housing Structures in Fort Lee
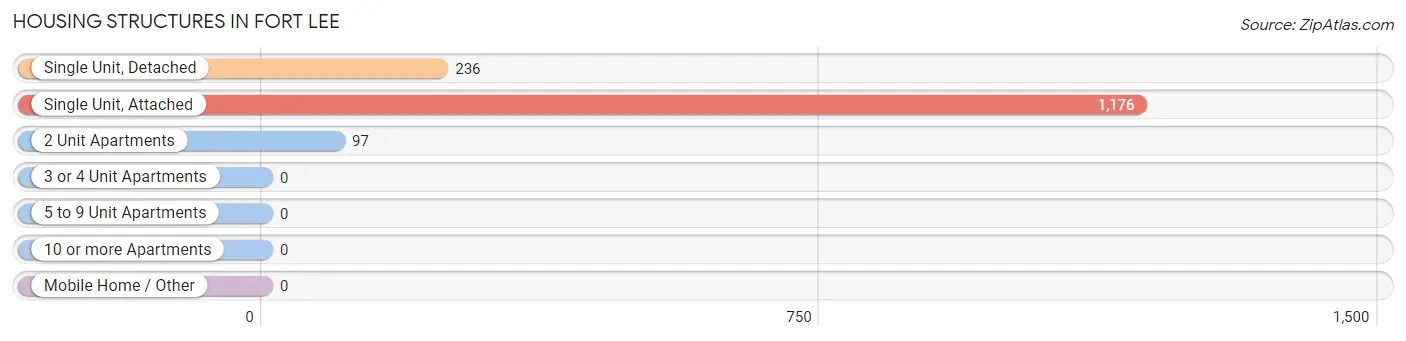
| Structure Type | # Housing Units | % Housing Units |
| Single Unit, Detached | 236 | 15.6% |
| Single Unit, Attached | 1,176 | 77.9% |
| 2 Unit Apartments | 97 | 6.4% |
| 3 or 4 Unit Apartments | 0 | 0.0% |
| 5 to 9 Unit Apartments | 0 | 0.0% |
| 10 or more Apartments | 0 | 0.0% |
| Mobile Home / Other | 0 | 0.0% |
| Total | 1,509 | 100.0% |
Housing Structures by Occupancy in Fort Lee
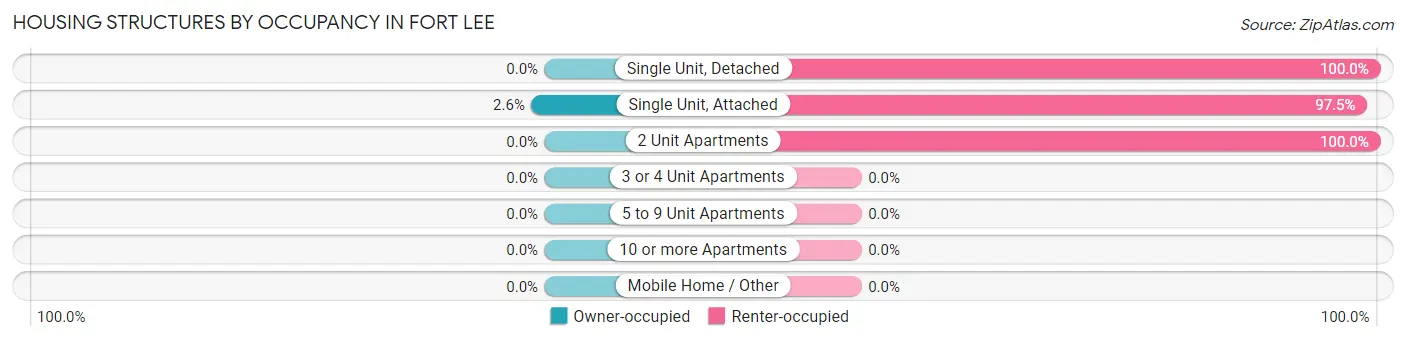
| Structure Type | Owner-occupied | Renter-occupied |
| Single Unit, Detached | 0 (0.0%) | 236 (100.0%) |
| Single Unit, Attached | 30 (2.5%) | 1,146 (97.5%) |
| 2 Unit Apartments | 0 (0.0%) | 97 (100.0%) |
| 3 or 4 Unit Apartments | 0 (0.0%) | 0 (0.0%) |
| 5 to 9 Unit Apartments | 0 (0.0%) | 0 (0.0%) |
| 10 or more Apartments | 0 (0.0%) | 0 (0.0%) |
| Mobile Home / Other | 0 (0.0%) | 0 (0.0%) |
| Total | 30 (2.0%) | 1,479 (98.0%) |
Housing Structures by Number of Rooms in Fort Lee
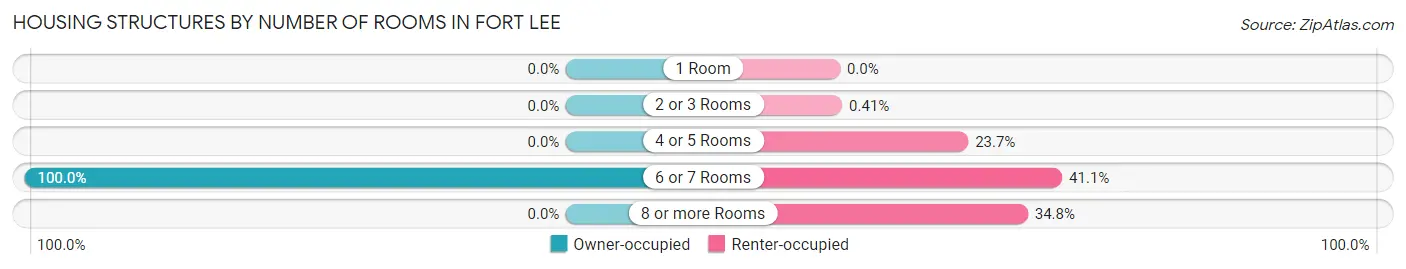
| Number of Rooms | Owner-occupied | Renter-occupied |
| 1 Room | 0 (0.0%) | 0 (0.0%) |
| 2 or 3 Rooms | 0 (0.0%) | 6 (0.4%) |
| 4 or 5 Rooms | 0 (0.0%) | 351 (23.7%) |
| 6 or 7 Rooms | 30 (100.0%) | 608 (41.1%) |
| 8 or more Rooms | 0 (0.0%) | 514 (34.7%) |
| Total | 30 (100.0%) | 1,479 (100.0%) |
Housing Structure by Heating Type in Fort Lee
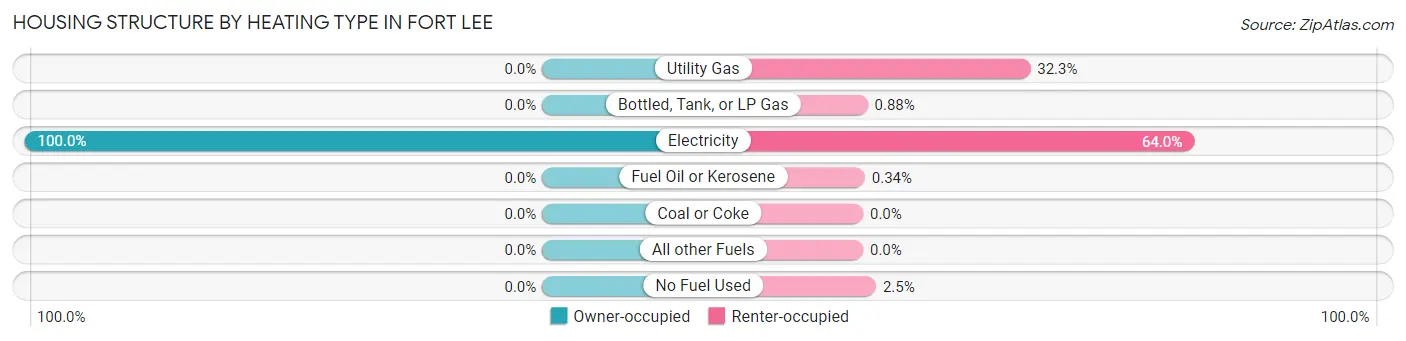
| Heating Type | Owner-occupied | Renter-occupied |
| Utility Gas | 0 (0.0%) | 478 (32.3%) |
| Bottled, Tank, or LP Gas | 0 (0.0%) | 13 (0.9%) |
| Electricity | 30 (100.0%) | 946 (64.0%) |
| Fuel Oil or Kerosene | 0 (0.0%) | 5 (0.3%) |
| Coal or Coke | 0 (0.0%) | 0 (0.0%) |
| All other Fuels | 0 (0.0%) | 0 (0.0%) |
| No Fuel Used | 0 (0.0%) | 37 (2.5%) |
| Total | 30 (100.0%) | 1,479 (100.0%) |
Household Vehicle Usage in Fort Lee
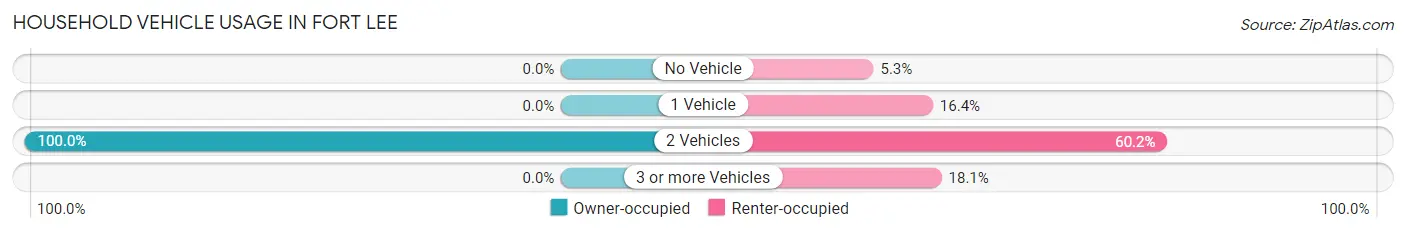
| Vehicles per Household | Owner-occupied | Renter-occupied |
| No Vehicle | 0 (0.0%) | 79 (5.3%) |
| 1 Vehicle | 0 (0.0%) | 243 (16.4%) |
| 2 Vehicles | 30 (100.0%) | 890 (60.2%) |
| 3 or more Vehicles | 0 (0.0%) | 267 (18.0%) |
| Total | 30 (100.0%) | 1,479 (100.0%) |
Real Estate & Mortgages in Fort Lee
Real Estate and Mortgage Overview in Fort Lee
| Characteristic | Without Mortgage | With Mortgage |
| Housing Units | 0 | 30 |
| Median Property Value | - | - |
| Median Household Income | - | - |
| Monthly Housing Costs | - | - |
| Real Estate Taxes | - | - |
Property Value by Mortgage Status in Fort Lee
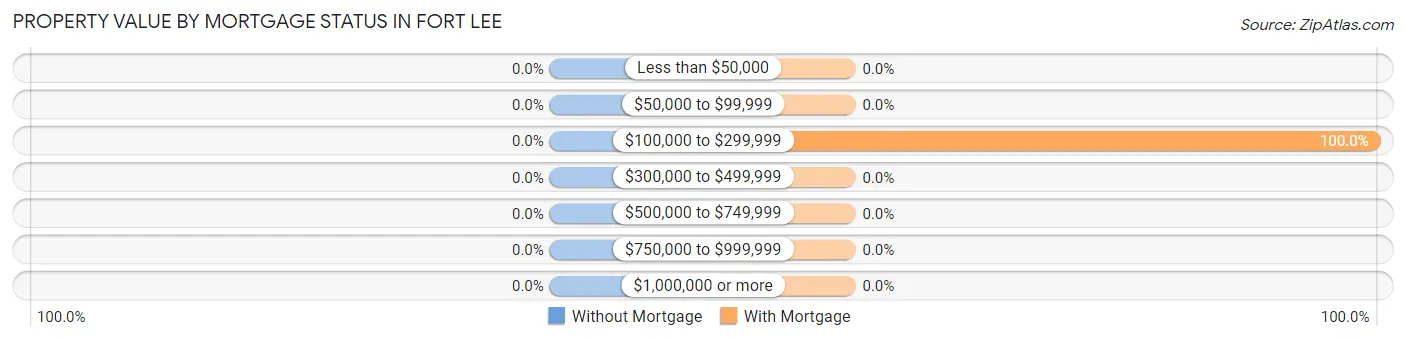
| Property Value | Without Mortgage | With Mortgage |
| Less than $50,000 | 0 (0.0%) | 0 (0.0%) |
| $50,000 to $99,999 | 0 (0.0%) | 0 (0.0%) |
| $100,000 to $299,999 | 0 (0.0%) | 30 (100.0%) |
| $300,000 to $499,999 | 0 (0.0%) | 0 (0.0%) |
| $500,000 to $749,999 | 0 (0.0%) | 0 (0.0%) |
| $750,000 to $999,999 | 0 (0.0%) | 0 (0.0%) |
| $1,000,000 or more | 0 (0.0%) | 0 (0.0%) |
| Total | 0 (0.0%) | 30 (100.0%) |
Household Income by Mortgage Status in Fort Lee
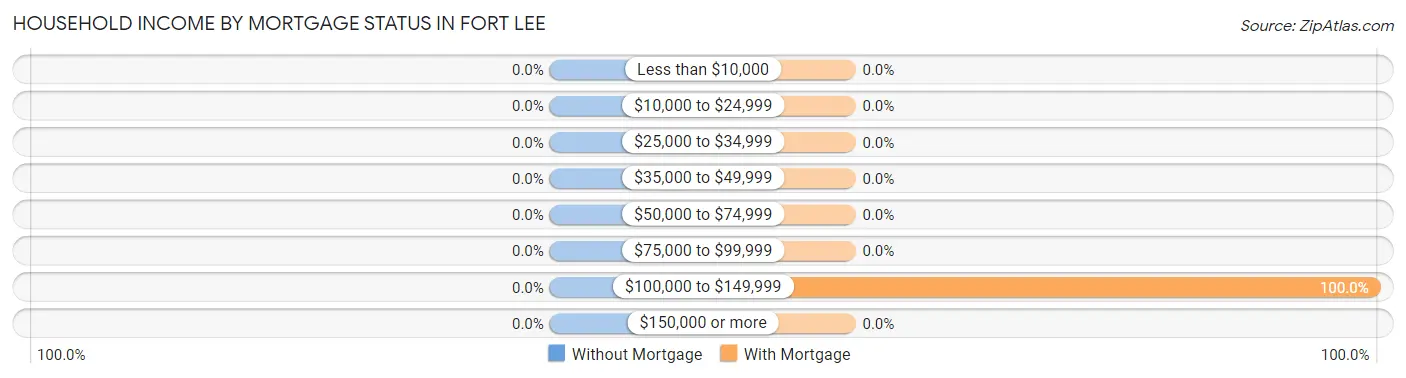
| Household Income | Without Mortgage | With Mortgage |
| Less than $10,000 | 0 (0.0%) | 0 (0.0%) |
| $10,000 to $24,999 | 0 (0.0%) | 0 (0.0%) |
| $25,000 to $34,999 | 0 (0.0%) | 0 (0.0%) |
| $35,000 to $49,999 | 0 (0.0%) | 0 (0.0%) |
| $50,000 to $74,999 | 0 (0.0%) | 0 (0.0%) |
| $75,000 to $99,999 | 0 (0.0%) | 0 (0.0%) |
| $100,000 to $149,999 | 0 (0.0%) | 30 (100.0%) |
| $150,000 or more | 0 (0.0%) | 0 (0.0%) |
| Total | 0 (0.0%) | 30 (100.0%) |
Property Value to Household Income Ratio in Fort Lee
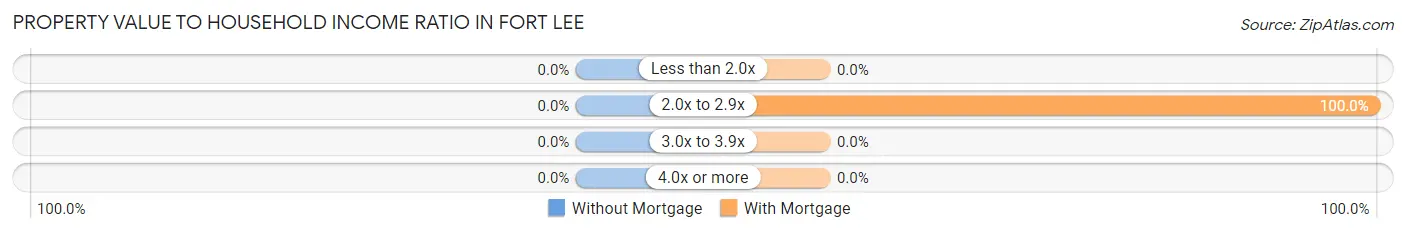
| Value-to-Income Ratio | Without Mortgage | With Mortgage |
| Less than 2.0x | 0 (0.0%) | 0 (0.0%) |
| 2.0x to 2.9x | 0 (0.0%) | 30 (100.0%) |
| 3.0x to 3.9x | 0 (0.0%) | 0 (0.0%) |
| 4.0x or more | 0 (0.0%) | 0 (0.0%) |
| Total | 0 (0.0%) | 30 (100.0%) |
Real Estate Taxes by Mortgage Status in Fort Lee
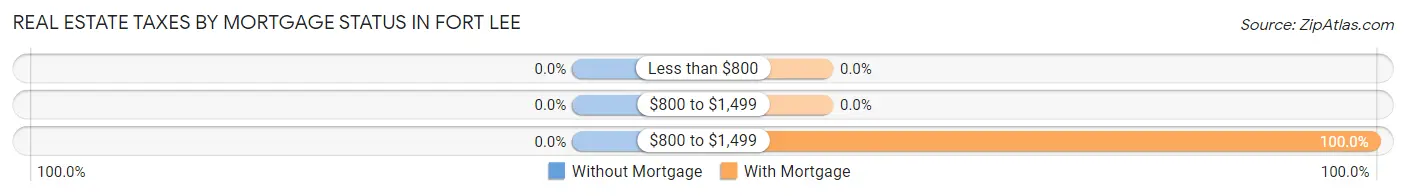
| Property Taxes | Without Mortgage | With Mortgage |
| Less than $800 | 0 (0.0%) | 0 (0.0%) |
| $800 to $1,499 | 0 (0.0%) | 0 (0.0%) |
| $800 to $1,499 | 0 (0.0%) | 30 (100.0%) |
| Total | 0 (0.0%) | 30 (100.0%) |
Health & Disability in Fort Lee
Health Insurance Coverage by Age in Fort Lee
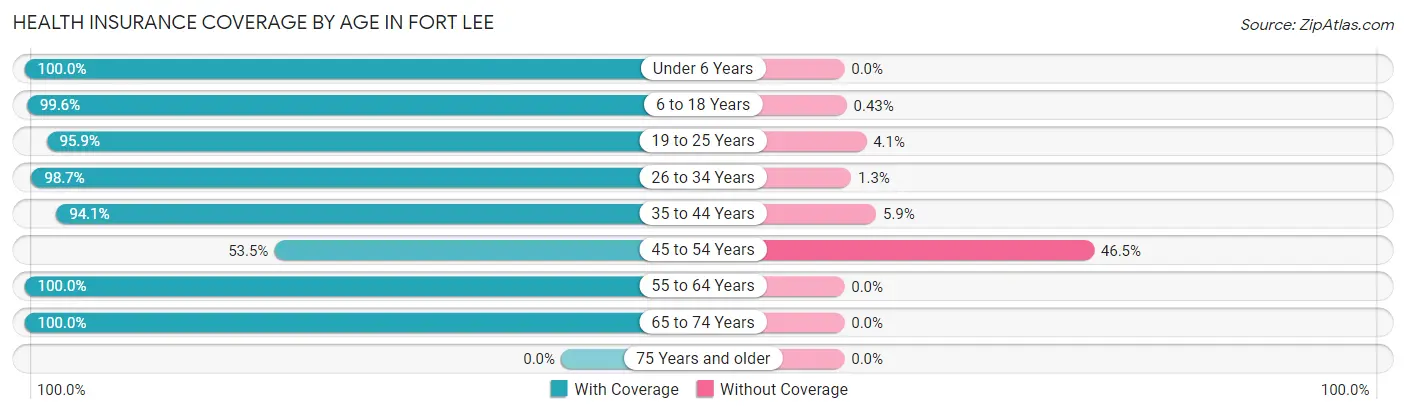
| Age Bracket | With Coverage | Without Coverage |
| Under 6 Years | 854 (100.0%) | 0 (0.0%) |
| 6 to 18 Years | 1,390 (99.6%) | 6 (0.4%) |
| 19 to 25 Years | 633 (95.9%) | 27 (4.1%) |
| 26 to 34 Years | 622 (98.7%) | 8 (1.3%) |
| 35 to 44 Years | 620 (94.1%) | 39 (5.9%) |
| 45 to 54 Years | 85 (53.5%) | 74 (46.5%) |
| 55 to 64 Years | 80 (100.0%) | 0 (0.0%) |
| 65 to 74 Years | 5 (100.0%) | 0 (0.0%) |
| 75 Years and older | 0 (0.0%) | 0 (0.0%) |
| Total | 4,289 (96.5%) | 154 (3.5%) |
Health Insurance Coverage by Citizenship Status in Fort Lee
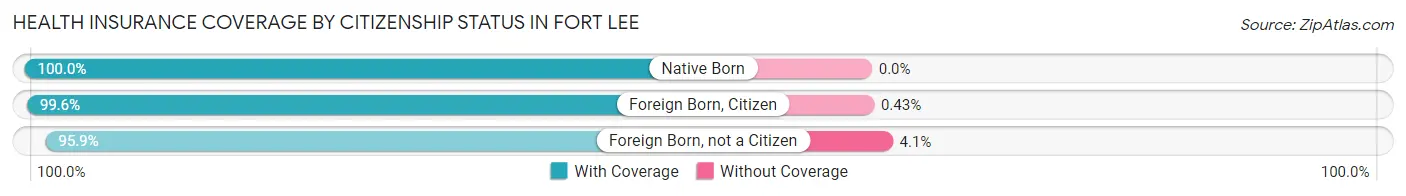
| Citizenship Status | With Coverage | Without Coverage |
| Native Born | 854 (100.0%) | 0 (0.0%) |
| Foreign Born, Citizen | 1,390 (99.6%) | 6 (0.4%) |
| Foreign Born, not a Citizen | 633 (95.9%) | 27 (4.1%) |
Health Insurance Coverage by Household Income in Fort Lee
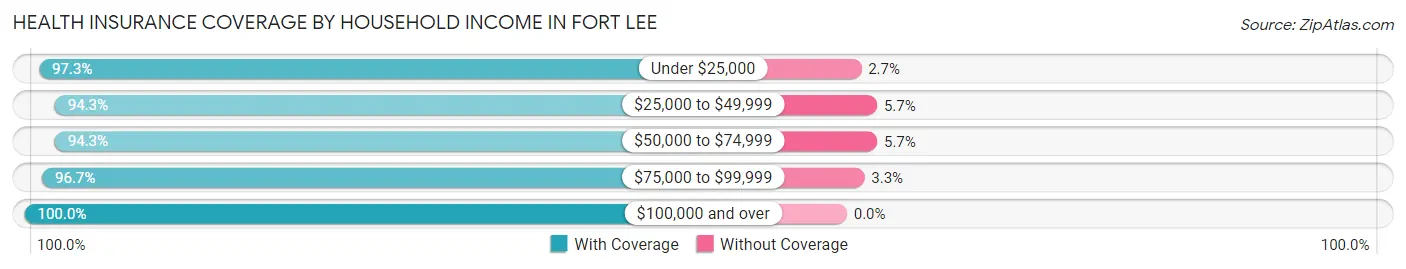
| Household Income | With Coverage | Without Coverage |
| Under $25,000 | 144 (97.3%) | 4 (2.7%) |
| $25,000 to $49,999 | 450 (94.3%) | 27 (5.7%) |
| $50,000 to $74,999 | 1,514 (94.3%) | 91 (5.7%) |
| $75,000 to $99,999 | 942 (96.7%) | 32 (3.3%) |
| $100,000 and over | 1,239 (100.0%) | 0 (0.0%) |
Public vs Private Health Insurance Coverage by Age in Fort Lee
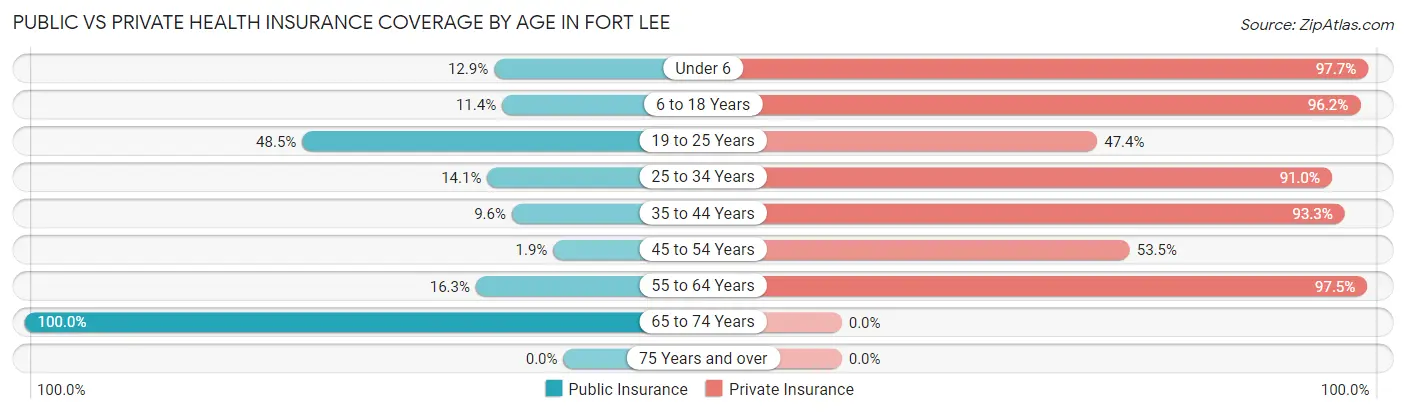
| Age Bracket | Public Insurance | Private Insurance |
| Under 6 | 110 (12.9%) | 834 (97.7%) |
| 6 to 18 Years | 159 (11.4%) | 1,343 (96.2%) |
| 19 to 25 Years | 320 (48.5%) | 313 (47.4%) |
| 25 to 34 Years | 89 (14.1%) | 573 (90.9%) |
| 35 to 44 Years | 63 (9.6%) | 615 (93.3%) |
| 45 to 54 Years | 3 (1.9%) | 85 (53.5%) |
| 55 to 64 Years | 13 (16.3%) | 78 (97.5%) |
| 65 to 74 Years | 5 (100.0%) | 0 (0.0%) |
| 75 Years and over | 0 (0.0%) | 0 (0.0%) |
| Total | 762 (17.2%) | 3,841 (86.5%) |
Disability Status by Sex by Age in Fort Lee
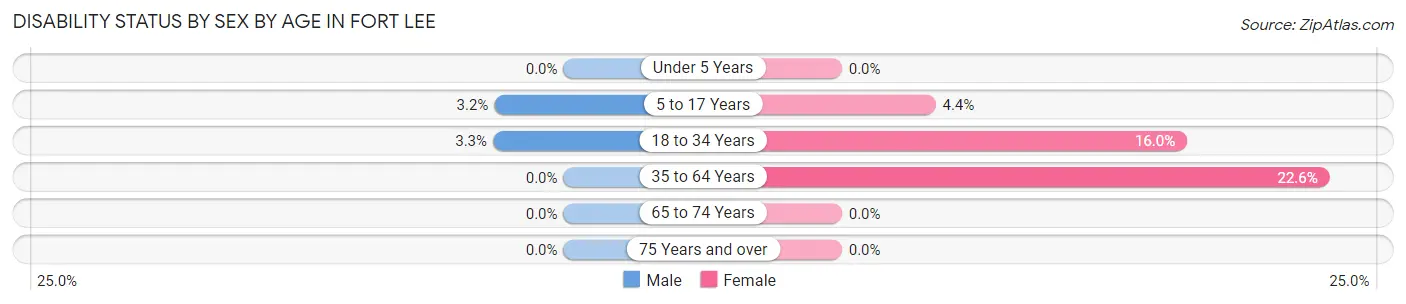
| Age Bracket | Male | Female |
| Under 5 Years | 0 (0.0%) | 0 (0.0%) |
| 5 to 17 Years | 22 (3.2%) | 34 (4.3%) |
| 18 to 34 Years | 19 (3.3%) | 123 (16.0%) |
| 35 to 64 Years | 0 (0.0%) | 129 (22.6%) |
| 65 to 74 Years | 0 (0.0%) | 0 (0.0%) |
| 75 Years and over | 0 (0.0%) | 0 (0.0%) |
Disability Class by Sex by Age in Fort Lee
Disability Class: Hearing Difficulty
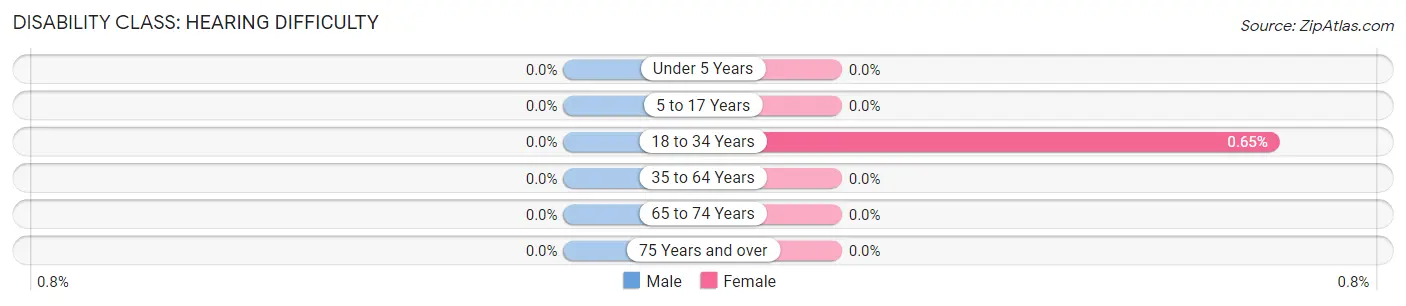
| Age Bracket | Male | Female |
| Under 5 Years | 0 (0.0%) | 0 (0.0%) |
| 5 to 17 Years | 0 (0.0%) | 0 (0.0%) |
| 18 to 34 Years | 0 (0.0%) | 5 (0.6%) |
| 35 to 64 Years | 0 (0.0%) | 0 (0.0%) |
| 65 to 74 Years | 0 (0.0%) | 0 (0.0%) |
| 75 Years and over | 0 (0.0%) | 0 (0.0%) |
Disability Class: Vision Difficulty
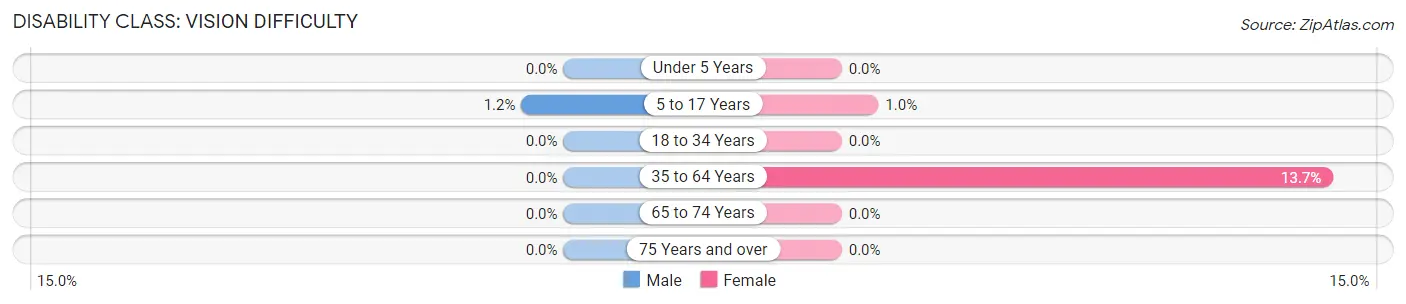
| Age Bracket | Male | Female |
| Under 5 Years | 0 (0.0%) | 0 (0.0%) |
| 5 to 17 Years | 8 (1.2%) | 8 (1.0%) |
| 18 to 34 Years | 0 (0.0%) | 0 (0.0%) |
| 35 to 64 Years | 0 (0.0%) | 78 (13.7%) |
| 65 to 74 Years | 0 (0.0%) | 0 (0.0%) |
| 75 Years and over | 0 (0.0%) | 0 (0.0%) |
Disability Class: Cognitive Difficulty
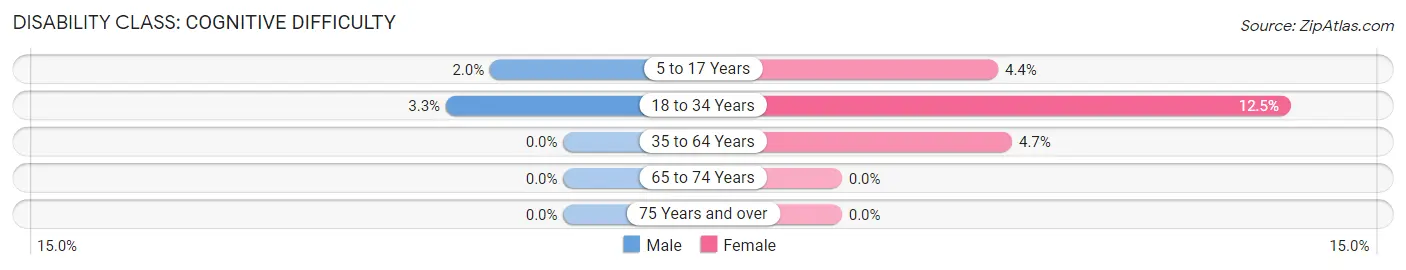
| Age Bracket | Male | Female |
| 5 to 17 Years | 14 (2.0%) | 34 (4.3%) |
| 18 to 34 Years | 19 (3.3%) | 96 (12.5%) |
| 35 to 64 Years | 0 (0.0%) | 27 (4.7%) |
| 65 to 74 Years | 0 (0.0%) | 0 (0.0%) |
| 75 Years and over | 0 (0.0%) | 0 (0.0%) |
Disability Class: Ambulatory Difficulty
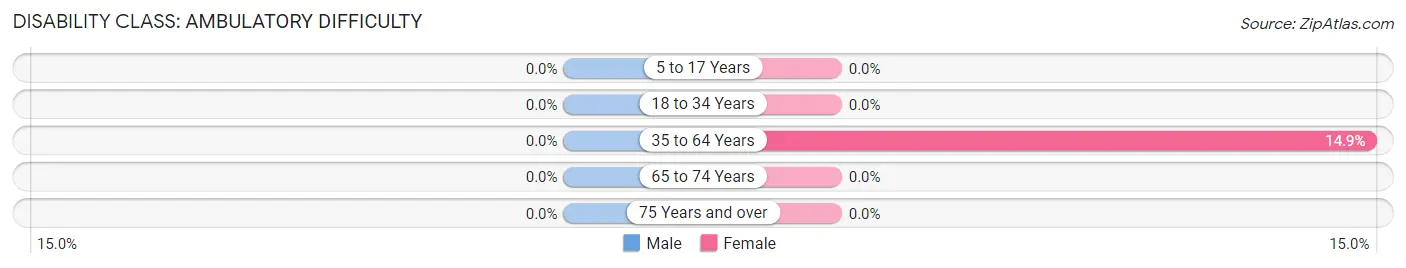
| Age Bracket | Male | Female |
| 5 to 17 Years | 0 (0.0%) | 0 (0.0%) |
| 18 to 34 Years | 0 (0.0%) | 0 (0.0%) |
| 35 to 64 Years | 0 (0.0%) | 85 (14.9%) |
| 65 to 74 Years | 0 (0.0%) | 0 (0.0%) |
| 75 Years and over | 0 (0.0%) | 0 (0.0%) |
Disability Class: Self-Care Difficulty
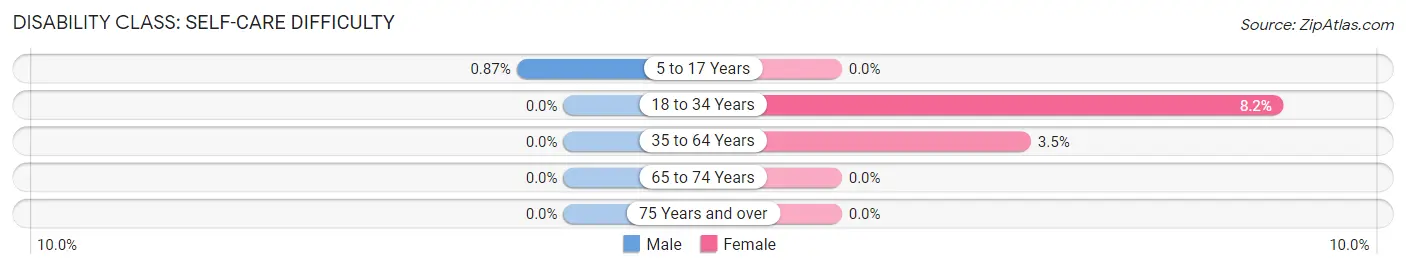
| Age Bracket | Male | Female |
| 5 to 17 Years | 6 (0.9%) | 0 (0.0%) |
| 18 to 34 Years | 0 (0.0%) | 63 (8.2%) |
| 35 to 64 Years | 0 (0.0%) | 20 (3.5%) |
| 65 to 74 Years | 0 (0.0%) | 0 (0.0%) |
| 75 Years and over | 0 (0.0%) | 0 (0.0%) |
Technology Access in Fort Lee
Computing Device Access in Fort Lee
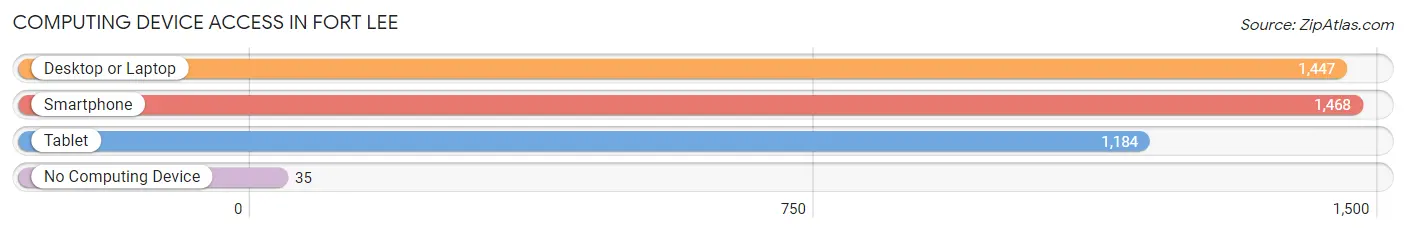
| Device Type | # Households | % Households |
| Desktop or Laptop | 1,447 | 95.9% |
| Smartphone | 1,468 | 97.3% |
| Tablet | 1,184 | 78.5% |
| No Computing Device | 35 | 2.3% |
| Total | 1,509 | 100.0% |
Internet Access in Fort Lee
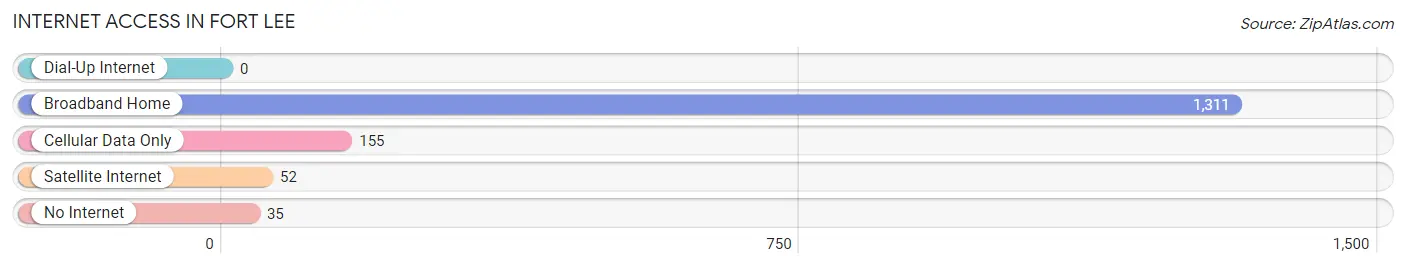
| Internet Type | # Households | % Households |
| Dial-Up Internet | 0 | 0.0% |
| Broadband Home | 1,311 | 86.9% |
| Cellular Data Only | 155 | 10.3% |
| Satellite Internet | 52 | 3.5% |
| No Internet | 35 | 2.3% |
| Total | 1,509 | 100.0% |
Fort Lee Summary
Fort Lee is a United States Army post located in Prince George County, Virginia. It is located near the cities of Petersburg and Hopewell, and is part of the Richmond-Petersburg metropolitan area. Fort Lee is home to the United States Army Combined Arms Support Command (CASCOM), the United States Army Quartermaster School, the United States Army Ordnance School, the United States Army Transportation School, the United States Army Logistics University, and the United States Army Women's Museum.
History
Fort Lee was established in 1917 as Camp Lee, a training camp for World War I soldiers. It was named after Confederate General Robert E. Lee, who was born in nearby Stratford Hall. The camp was used to train soldiers for the war effort, and was later expanded to include a hospital and other facilities. After the war, the camp was closed and the land was sold to private owners.
In 1941, the United States Army purchased the land and established Fort Lee. The post was used to train soldiers for World War II, and was later expanded to include a hospital and other facilities. During the Cold War, Fort Lee was used to train soldiers for the Korean War and Vietnam War.
Geography
Fort Lee is located in Prince George County, Virginia, approximately 25 miles south of Richmond and 40 miles north of Petersburg. The post is situated on the Appomattox River, and is bordered by the cities of Hopewell and Petersburg. The post covers an area of approximately 4,000 acres.
Economy
Fort Lee is home to a variety of businesses and organizations, including the United States Army Combined Arms Support Command (CASCOM), the United States Army Quartermaster School, the United States Army Ordnance School, the United States Army Transportation School, the United States Army Logistics University, and the United States Army Women's Museum. The post also houses a variety of retail stores, restaurants, and other businesses.
Demographics
As of the 2010 census, the population of Fort Lee was 3,393. The racial makeup of the post was 73.3% White, 15.2% African American, 0.7% Native American, 4.2% Asian, 0.1% Pacific Islander, 3.2% from other races, and 3.5% from two or more races. Hispanic or Latino of any race were 6.3% of the population.
The median income for a household in Fort Lee was $45,938, and the median income for a family was $50,938. The per capita income for the post was $20,938. About 4.3% of families and 5.3% of the population were below the poverty line, including 6.3% of those under age 18 and 4.3% of those age 65 or over.
Common Questions
What is Per Capita Income in Fort Lee?
Per Capita income in Fort Lee is $24,315.
What is the Median Family Income in Fort Lee?
Median Family Income in Fort Lee is $74,563.
What is the Median Household income in Fort Lee?
Median Household Income in Fort Lee is $73,906.
What is Income or Wage Gap in Fort Lee?
Income or Wage Gap in Fort Lee is 1.7%.
Women in Fort Lee earn 98.3 cents for every dollar earned by a man.
What is Inequality or Gini Index in Fort Lee?
Inequality or Gini Index in Fort Lee is 0.28.
What is the Total Population of Fort Lee?
Total Population of Fort Lee is 7,577.
What is the Total Male Population of Fort Lee?
Total Male Population of Fort Lee is 4,452.
What is the Total Female Population of Fort Lee?
Total Female Population of Fort Lee is 3,125.
What is the Ratio of Males per 100 Females in Fort Lee?
There are 142.46 Males per 100 Females in Fort Lee.
What is the Ratio of Females per 100 Males in Fort Lee?
There are 70.19 Females per 100 Males in Fort Lee.
What is the Median Population Age in Fort Lee?
Median Population Age in Fort Lee is 21.8 Years.
What is the Average Family Size in Fort Lee
Average Family Size in Fort Lee is 3.5 People.
What is the Average Household Size in Fort Lee
Average Household Size in Fort Lee is 3.7 People.
How Large is the Labor Force in Fort Lee?
There are 4,541 People in the Labor Forcein in Fort Lee.
What is the Percentage of People in the Labor Force in Fort Lee?
82.2% of People are in the Labor Force in Fort Lee.
What is the Unemployment Rate in Fort Lee?
Unemployment Rate in Fort Lee is 30.7%.