Bowling Green, VA Map & Demographics
Bowling Green Map
Bowling Green Overview
$34,738
PER CAPITA INCOME
$89,437
AVG FAMILY INCOME
$69,167
AVG HOUSEHOLD INCOME
20.1%
WAGE / INCOME GAP [ % ]
79.9¢/ $1
WAGE / INCOME GAP [ $ ]
0.42
INEQUALITY / GINI INDEX
1,538
TOTAL POPULATION
673
MALE POPULATION
865
FEMALE POPULATION
77.80
MALES / 100 FEMALES
128.53
FEMALES / 100 MALES
42.3
MEDIAN AGE
3.1
AVG FAMILY SIZE
2.4
AVG HOUSEHOLD SIZE
647
LABOR FORCE [ PEOPLE ]
51.9%
PERCENT IN LABOR FORCE
3.9%
UNEMPLOYMENT RATE
Bowling Green Zip Codes
Bowling Green Area Codes
Income in Bowling Green
Income Overview in Bowling Green
Per Capita Income in Bowling Green is $34,738, while median incomes of families and households are $89,437 and $69,167 respectively.
| Characteristic | Number | Measure |
| Per Capita Income | 1,538 | $34,738 |
| Median Family Income | 356 | $89,437 |
| Mean Family Income | 356 | $101,081 |
| Median Household Income | 596 | $69,167 |
| Mean Household Income | 596 | $81,110 |
| Income Deficit | 356 | $0 |
| Wage / Income Gap (%) | 1,538 | 20.15% |
| Wage / Income Gap ($) | 1,538 | 79.85¢ per $1 |
| Gini / Inequality Index | 1,538 | 0.42 |
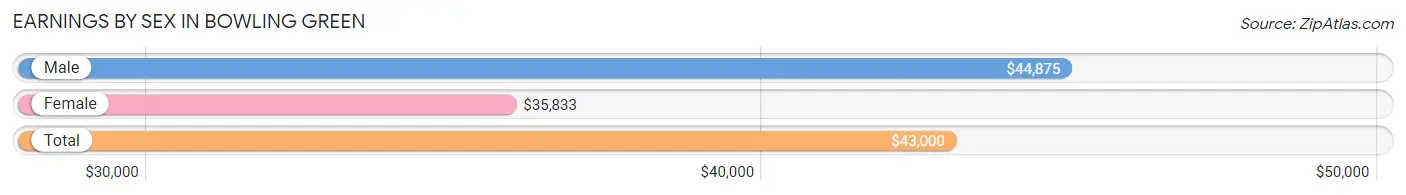
Earnings by Sex in Bowling Green
Average Earnings in Bowling Green are $43,000, $44,875 for men and $35,833 for women, a difference of 20.2%.
| Sex | Number | Average Earnings |
| Male | 344 (49.9%) | $44,875 |
| Female | 346 (50.1%) | $35,833 |
| Total | 690 (100.0%) | $43,000 |
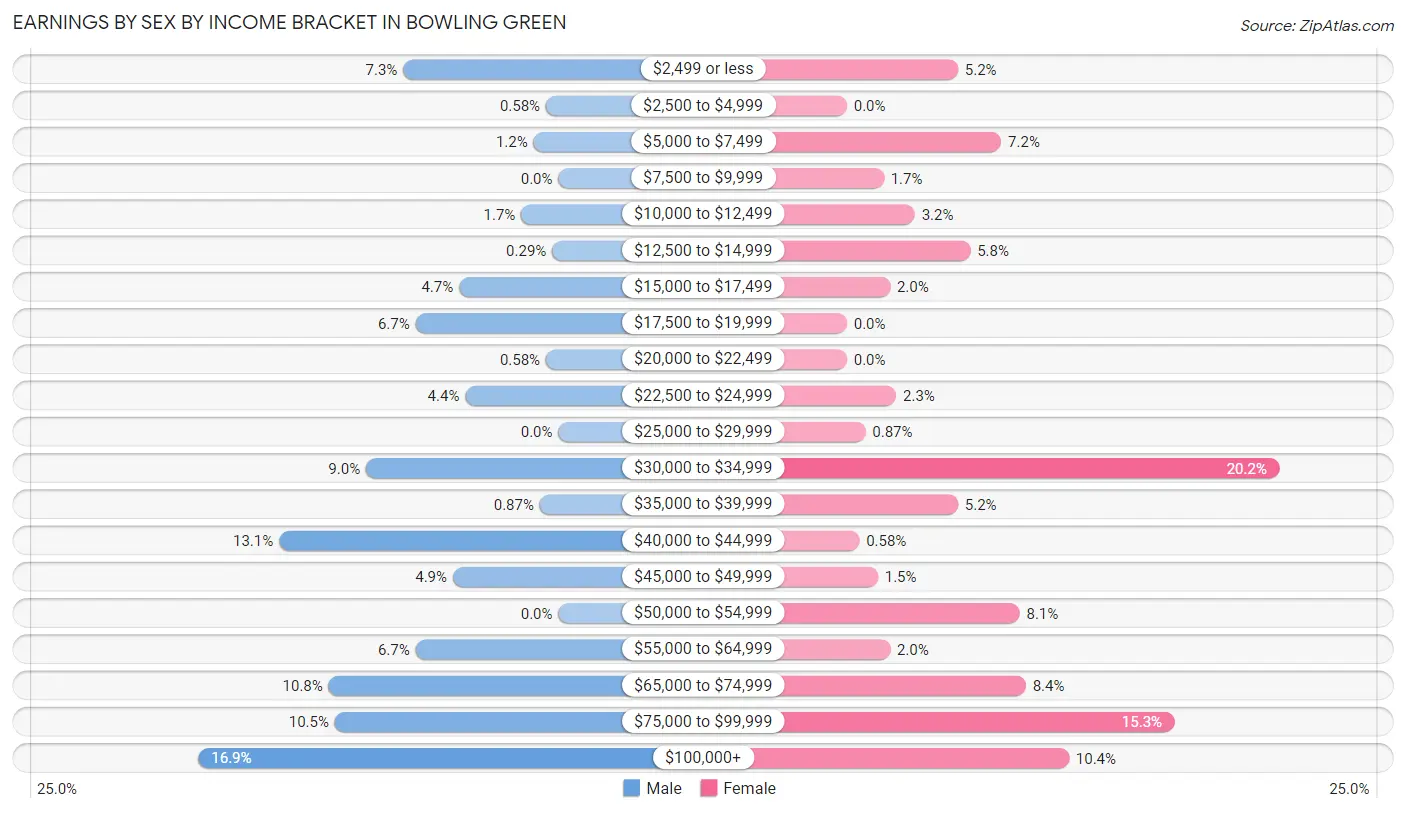
Earnings by Sex by Income Bracket in Bowling Green
The most common earnings brackets in Bowling Green are $100,000+ for men (58 | 16.9%) and $30,000 to $34,999 for women (70 | 20.2%).
| Income | Male | Female |
| $2,499 or less | 25 (7.3%) | 18 (5.2%) |
| $2,500 to $4,999 | 2 (0.6%) | 0 (0.0%) |
| $5,000 to $7,499 | 4 (1.2%) | 25 (7.2%) |
| $7,500 to $9,999 | 0 (0.0%) | 6 (1.7%) |
| $10,000 to $12,499 | 6 (1.7%) | 11 (3.2%) |
| $12,500 to $14,999 | 1 (0.3%) | 20 (5.8%) |
| $15,000 to $17,499 | 16 (4.6%) | 7 (2.0%) |
| $17,500 to $19,999 | 23 (6.7%) | 0 (0.0%) |
| $20,000 to $22,499 | 2 (0.6%) | 0 (0.0%) |
| $22,500 to $24,999 | 15 (4.4%) | 8 (2.3%) |
| $25,000 to $29,999 | 0 (0.0%) | 3 (0.9%) |
| $30,000 to $34,999 | 31 (9.0%) | 70 (20.2%) |
| $35,000 to $39,999 | 3 (0.9%) | 18 (5.2%) |
| $40,000 to $44,999 | 45 (13.1%) | 2 (0.6%) |
| $45,000 to $49,999 | 17 (4.9%) | 5 (1.5%) |
| $50,000 to $54,999 | 0 (0.0%) | 28 (8.1%) |
| $55,000 to $64,999 | 23 (6.7%) | 7 (2.0%) |
| $65,000 to $74,999 | 37 (10.8%) | 29 (8.4%) |
| $75,000 to $99,999 | 36 (10.5%) | 53 (15.3%) |
| $100,000+ | 58 (16.9%) | 36 (10.4%) |
| Total | 344 (100.0%) | 346 (100.0%) |
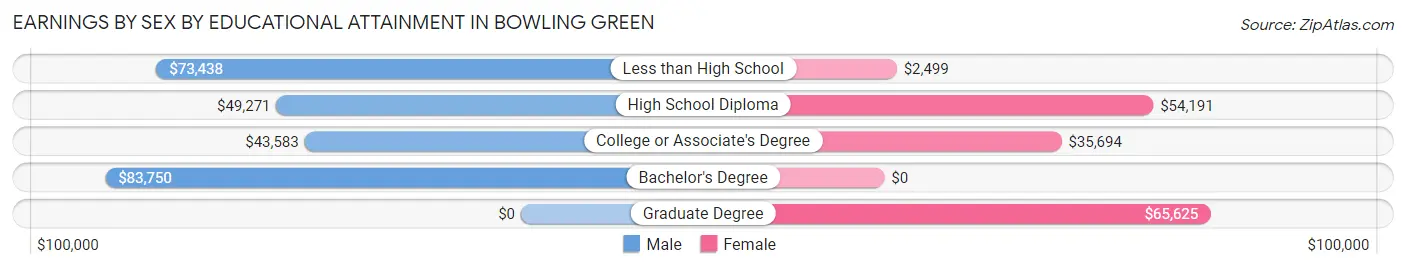
Earnings by Sex by Educational Attainment in Bowling Green
Average earnings in Bowling Green are $59,107 for men and $36,583 for women, a difference of 38.1%. Men with an educational attainment of bachelor's degree enjoy the highest average annual earnings of $83,750, while those with college or associate's degree education earn the least with $43,583. Women with an educational attainment of graduate degree earn the most with the average annual earnings of $65,625, while those with less than high school education have the smallest earnings of $2,499.
| Educational Attainment | Male Income | Female Income |
| Less than High School | $73,438 | $2,499 |
| High School Diploma | $49,271 | $54,191 |
| College or Associate's Degree | $43,583 | $35,694 |
| Bachelor's Degree | $83,750 | $0 |
| Graduate Degree | - | - |
| Total | $59,107 | $36,583 |
Family Income in Bowling Green
Family Income Brackets in Bowling Green
According to the Bowling Green family income data, there are 125 families falling into the $75,000 to $99,999 income range, which is the most common income bracket and makes up 35.1% of all families.
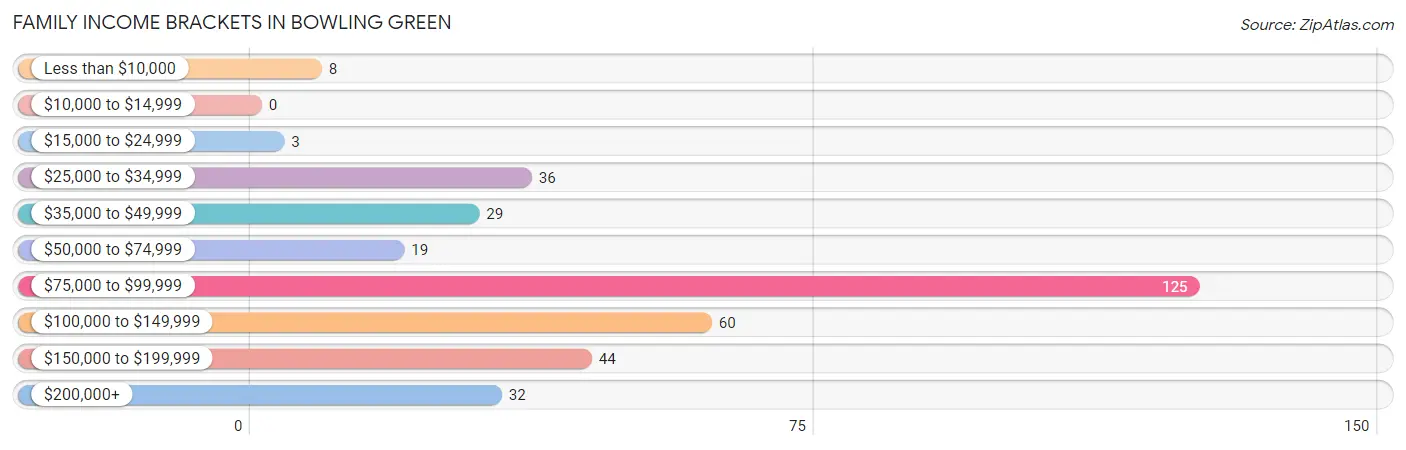
| Income Bracket | # Families | % Families |
| Less than $10,000 | 8 | 2.2% |
| $10,000 to $14,999 | 0 | 0.0% |
| $15,000 to $24,999 | 3 | 0.8% |
| $25,000 to $34,999 | 36 | 10.1% |
| $35,000 to $49,999 | 29 | 8.1% |
| $50,000 to $74,999 | 19 | 5.3% |
| $75,000 to $99,999 | 125 | 35.1% |
| $100,000 to $149,999 | 60 | 16.9% |
| $150,000 to $199,999 | 44 | 12.4% |
| $200,000+ | 32 | 9.0% |
Family Income by Famaliy Size in Bowling Green
4-person families (81 | 22.8%) account for the highest median family income in Bowling Green with $162,589 per family, while 2-person families (133 | 37.4%) have the highest median income of $44,930 per family member.
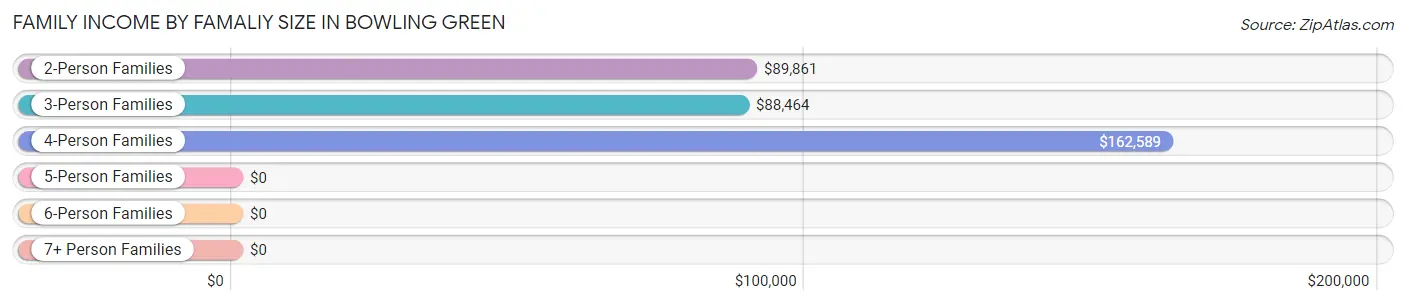
| Income Bracket | # Families | Median Income |
| 2-Person Families | 133 (37.4%) | $89,861 |
| 3-Person Families | 83 (23.3%) | $88,464 |
| 4-Person Families | 81 (22.8%) | $162,589 |
| 5-Person Families | 25 (7.0%) | $0 |
| 6-Person Families | 27 (7.6%) | $0 |
| 7+ Person Families | 7 (2.0%) | $0 |
| Total | 356 (100.0%) | $89,437 |
Family Income by Number of Earners in Bowling Green
The median family income in Bowling Green is $89,437, with families comprising 3+ earners (40) having the highest median family income of $117,000, while families with no earners (69) have the lowest median family income of $77,250, accounting for 11.2% and 19.4% of families, respectively.
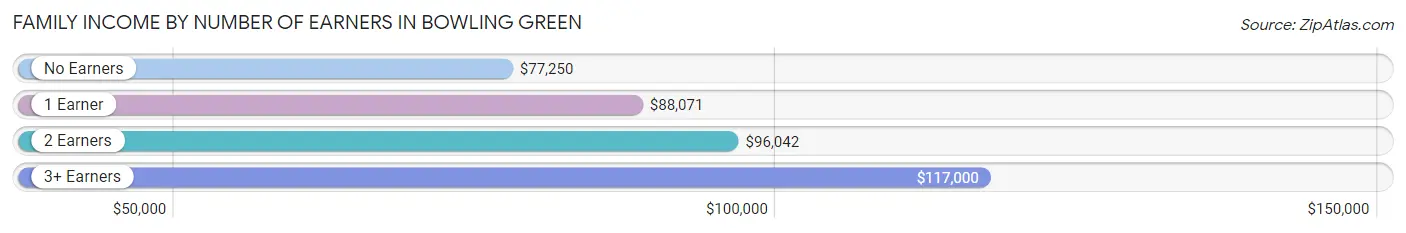
| Number of Earners | # Families | Median Income |
| No Earners | 69 (19.4%) | $77,250 |
| 1 Earner | 104 (29.2%) | $88,071 |
| 2 Earners | 143 (40.2%) | $96,042 |
| 3+ Earners | 40 (11.2%) | $117,000 |
| Total | 356 (100.0%) | $89,437 |
Household Income in Bowling Green
Household Income Brackets in Bowling Green
With 132 households falling in the category, the $75,000 to $99,999 income range is the most frequent in Bowling Green, accounting for 22.2% of all households. In contrast, only 15 households (2.5%) fall into the less than $10,000 income bracket, making it the least populous group.
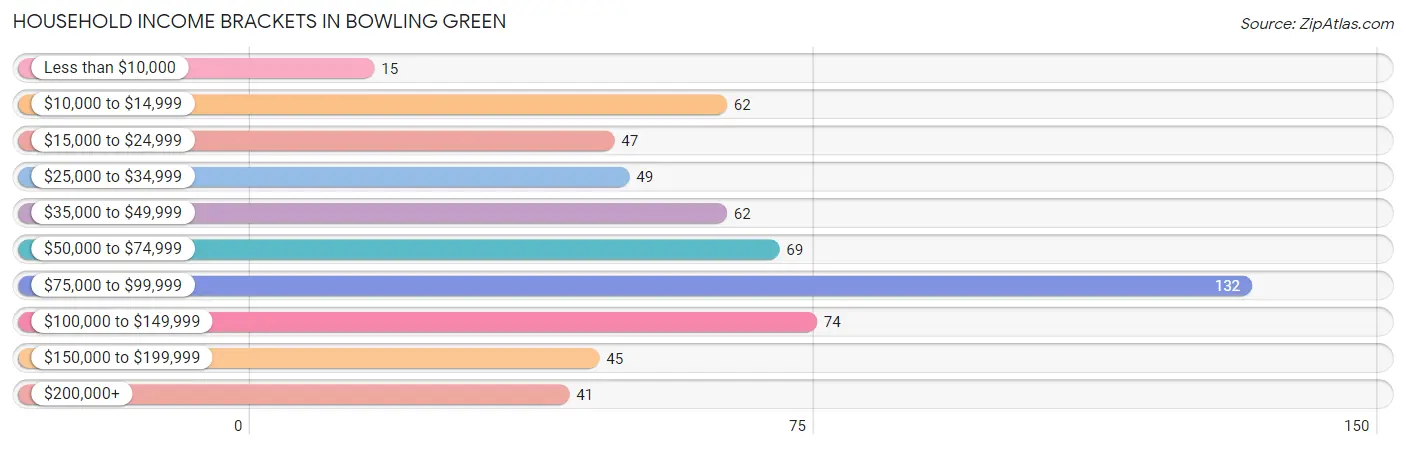
| Income Bracket | # Households | % Households |
| Less than $10,000 | 15 | 2.5% |
| $10,000 to $14,999 | 62 | 10.4% |
| $15,000 to $24,999 | 47 | 7.9% |
| $25,000 to $34,999 | 49 | 8.2% |
| $35,000 to $49,999 | 62 | 10.4% |
| $50,000 to $74,999 | 69 | 11.6% |
| $75,000 to $99,999 | 132 | 22.1% |
| $100,000 to $149,999 | 74 | 12.4% |
| $150,000 to $199,999 | 45 | 7.6% |
| $200,000+ | 41 | 6.9% |
Household Income by Householder Age in Bowling Green
The median household income in Bowling Green is $69,167, with the highest median household income of $88,000 found in the 25 to 44 years age bracket for the primary householder. A total of 194 households (32.6%) fall into this category. Meanwhile, the 45 to 64 years age bracket for the primary householder has the lowest median household income of $0, with 166 households (27.9%) in this group.
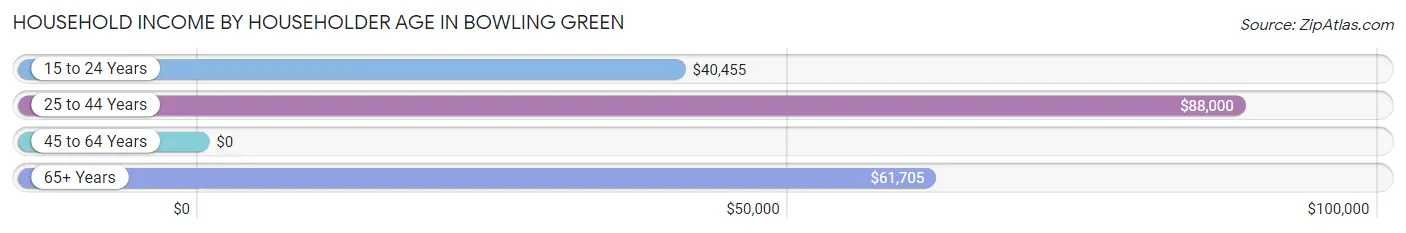
| Income Bracket | # Households | Median Income |
| 15 to 24 Years | 22 (3.7%) | $40,455 |
| 25 to 44 Years | 194 (32.6%) | $88,000 |
| 45 to 64 Years | 166 (27.9%) | $0 |
| 65+ Years | 214 (35.9%) | $61,705 |
| Total | 596 (100.0%) | $69,167 |
Poverty in Bowling Green
Income Below Poverty by Sex and Age in Bowling Green
With 10.8% poverty level for males and 9.0% for females among the residents of Bowling Green, 18 to 24 year old males and 18 to 24 year old females are the most vulnerable to poverty, with 12 males (26.1%) and 9 females (36.0%) in their respective age groups living below the poverty level.
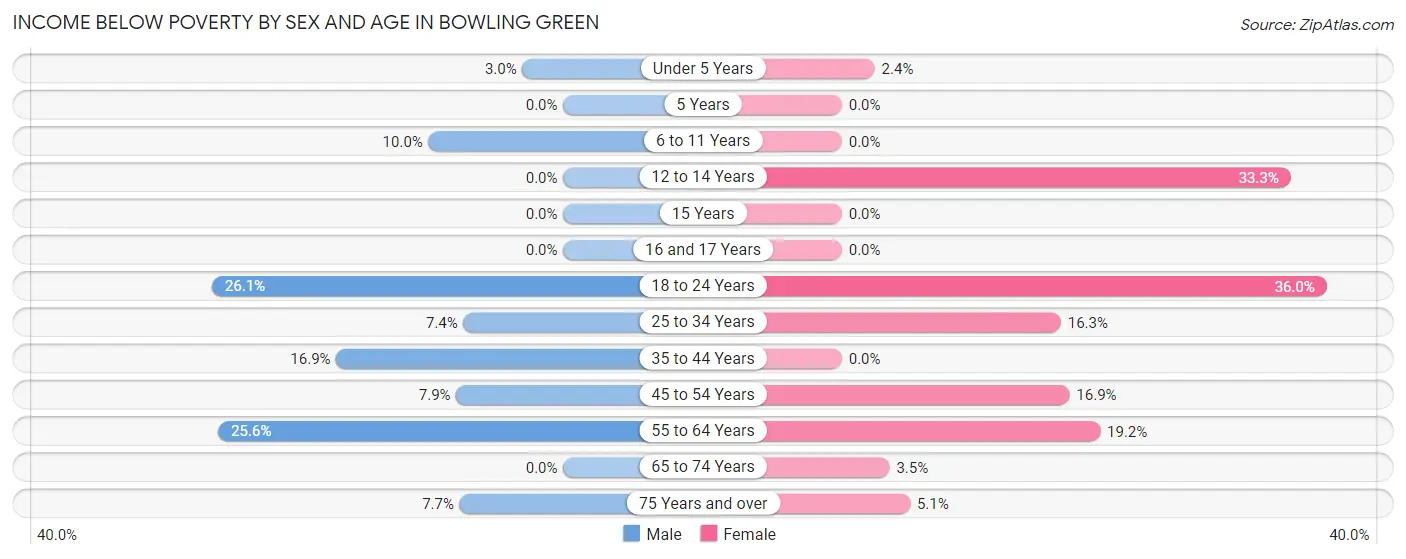
| Age Bracket | Male | Female |
| Under 5 Years | 1 (3.0%) | 1 (2.4%) |
| 5 Years | 0 (0.0%) | 0 (0.0%) |
| 6 to 11 Years | 3 (10.0%) | 0 (0.0%) |
| 12 to 14 Years | 0 (0.0%) | 8 (33.3%) |
| 15 Years | 0 (0.0%) | 0 (0.0%) |
| 16 and 17 Years | 0 (0.0%) | 0 (0.0%) |
| 18 to 24 Years | 12 (26.1%) | 9 (36.0%) |
| 25 to 34 Years | 6 (7.4%) | 20 (16.3%) |
| 35 to 44 Years | 15 (16.9%) | 0 (0.0%) |
| 45 to 54 Years | 5 (7.9%) | 12 (16.9%) |
| 55 to 64 Years | 20 (25.6%) | 14 (19.2%) |
| 65 to 74 Years | 0 (0.0%) | 4 (3.5%) |
| 75 Years and over | 5 (7.7%) | 4 (5.1%) |
| Total | 67 (10.8%) | 72 (9.0%) |
Income Above Poverty by Sex and Age in Bowling Green
According to the poverty statistics in Bowling Green, males aged 5 years and females aged 6 to 11 years are the age groups that are most secure financially, with 100.0% of males and 100.0% of females in these age groups living above the poverty line.
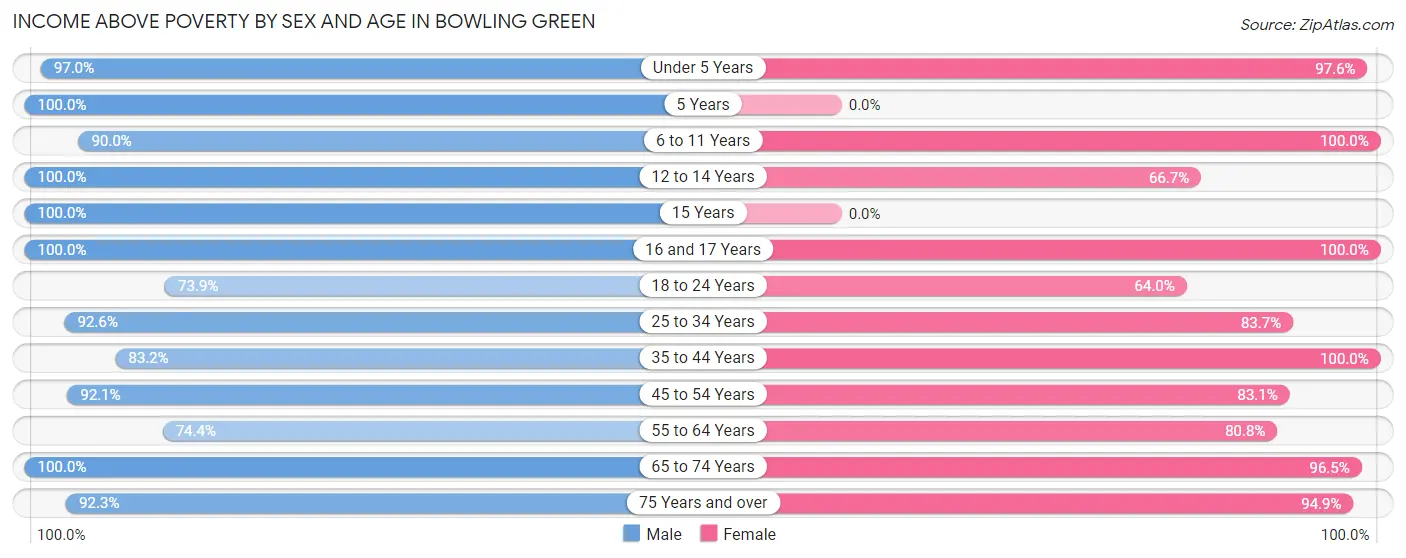
| Age Bracket | Male | Female |
| Under 5 Years | 32 (97.0%) | 40 (97.6%) |
| 5 Years | 8 (100.0%) | 0 (0.0%) |
| 6 to 11 Years | 27 (90.0%) | 99 (100.0%) |
| 12 to 14 Years | 44 (100.0%) | 16 (66.7%) |
| 15 Years | 13 (100.0%) | 0 (0.0%) |
| 16 and 17 Years | 22 (100.0%) | 41 (100.0%) |
| 18 to 24 Years | 34 (73.9%) | 16 (64.0%) |
| 25 to 34 Years | 75 (92.6%) | 103 (83.7%) |
| 35 to 44 Years | 74 (83.2%) | 107 (100.0%) |
| 45 to 54 Years | 58 (92.1%) | 59 (83.1%) |
| 55 to 64 Years | 58 (74.4%) | 59 (80.8%) |
| 65 to 74 Years | 49 (100.0%) | 109 (96.5%) |
| 75 Years and over | 60 (92.3%) | 75 (94.9%) |
| Total | 554 (89.2%) | 724 (90.9%) |
Income Below Poverty Among Married-Couple Families in Bowling Green
The poverty statistics for married-couple families in Bowling Green show that 5.1% or 14 of the total 273 families live below the poverty line. Families with 3 or 4 children have the highest poverty rate of 29.8%, comprising of 14 families. On the other hand, families with no children have the lowest poverty rate of 0.0%, which includes 0 families.
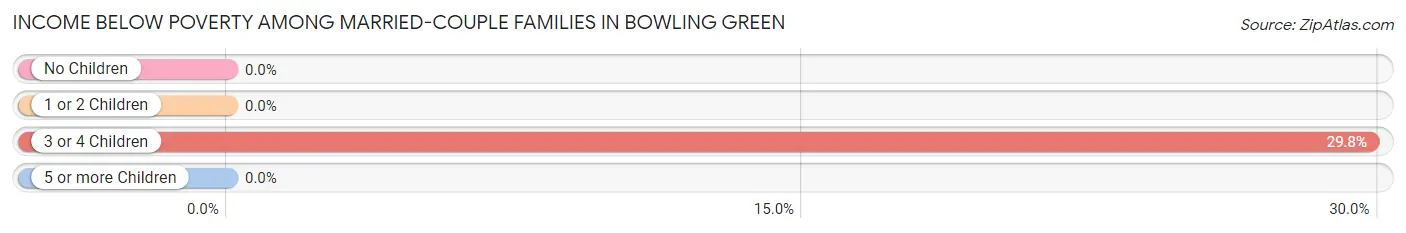
| Children | Above Poverty | Below Poverty |
| No Children | 133 (100.0%) | 0 (0.0%) |
| 1 or 2 Children | 86 (100.0%) | 0 (0.0%) |
| 3 or 4 Children | 33 (70.2%) | 14 (29.8%) |
| 5 or more Children | 7 (100.0%) | 0 (0.0%) |
| Total | 259 (94.9%) | 14 (5.1%) |
Income Below Poverty Among Single-Parent Households in Bowling Green
According to the poverty data in Bowling Green, 30.0% or 3 single-father households and 11.0% or 8 single-mother households are living below the poverty line. Among single-father households, those with no children have the highest poverty rate, with 3 households (100.0%) experiencing poverty. Likewise, among single-mother households, those with 1 or 2 children have the highest poverty rate, with 8 households (11.8%) falling below the poverty line.
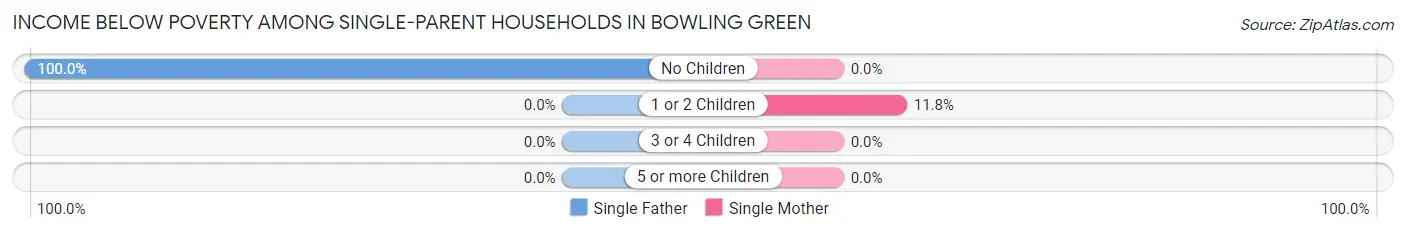
| Children | Single Father | Single Mother |
| No Children | 3 (100.0%) | 0 (0.0%) |
| 1 or 2 Children | 0 (0.0%) | 8 (11.8%) |
| 3 or 4 Children | 0 (0.0%) | 0 (0.0%) |
| 5 or more Children | 0 (0.0%) | 0 (0.0%) |
| Total | 3 (30.0%) | 8 (11.0%) |
Income Below Poverty Among Married-Couple vs Single-Parent Households in Bowling Green
The poverty data for Bowling Green shows that 14 of the married-couple family households (5.1%) and 11 of the single-parent households (13.3%) are living below the poverty level. Within the married-couple family households, those with 3 or 4 children have the highest poverty rate, with 14 households (29.8%) falling below the poverty line. Among the single-parent households, those with no children have the highest poverty rate, with 3 household (37.5%) living below poverty.
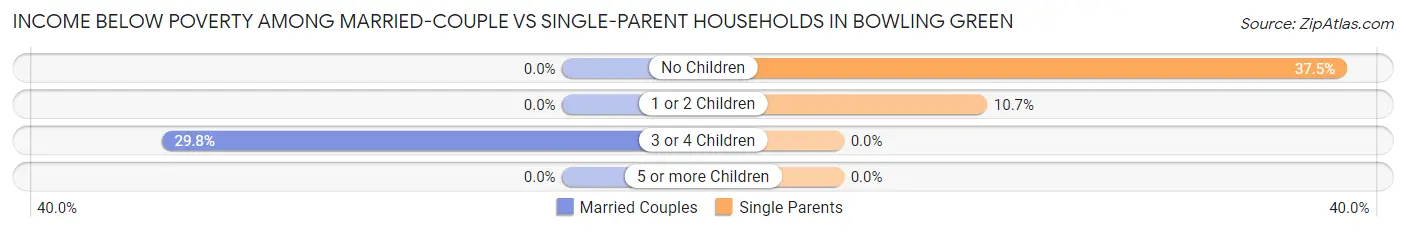
| Children | Married-Couple Families | Single-Parent Households |
| No Children | 0 (0.0%) | 3 (37.5%) |
| 1 or 2 Children | 0 (0.0%) | 8 (10.7%) |
| 3 or 4 Children | 14 (29.8%) | 0 (0.0%) |
| 5 or more Children | 0 (0.0%) | 0 (0.0%) |
| Total | 14 (5.1%) | 11 (13.3%) |
Race in Bowling Green
The most populous races in Bowling Green are White / Caucasian (1,158 | 75.3%), Black / African American (217 | 14.1%), and Two or more Races (110 | 7.1%).
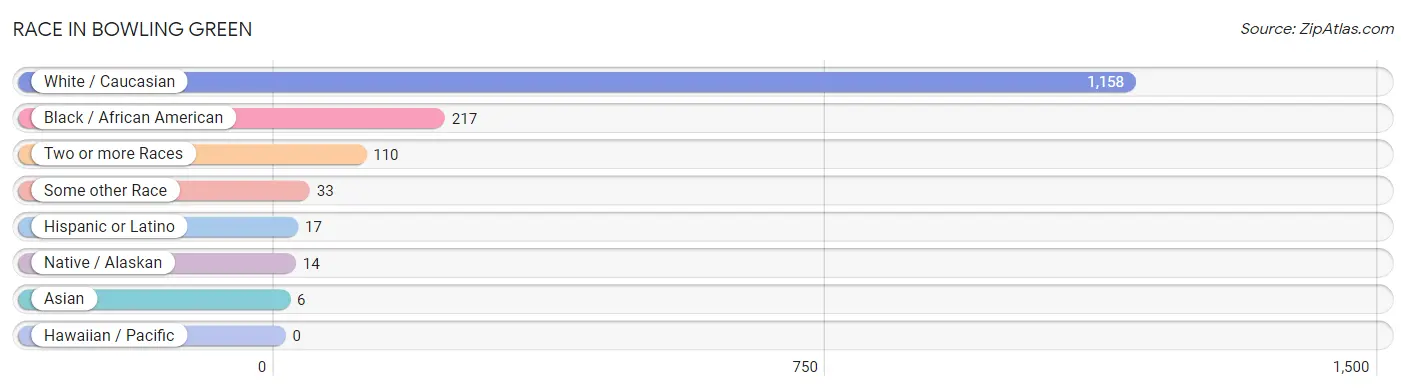
| Race | # Population | % Population |
| Asian | 6 | 0.4% |
| Black / African American | 217 | 14.1% |
| Hawaiian / Pacific | 0 | 0.0% |
| Hispanic or Latino | 17 | 1.1% |
| Native / Alaskan | 14 | 0.9% |
| White / Caucasian | 1,158 | 75.3% |
| Two or more Races | 110 | 7.1% |
| Some other Race | 33 | 2.1% |
| Total | 1,538 | 100.0% |
Ancestry in Bowling Green
The most populous ancestries reported in Bowling Green are English (330 | 21.5%), Irish (168 | 10.9%), American (136 | 8.8%), German (113 | 7.3%), and Italian (66 | 4.3%), together accounting for 52.9% of all Bowling Green residents.
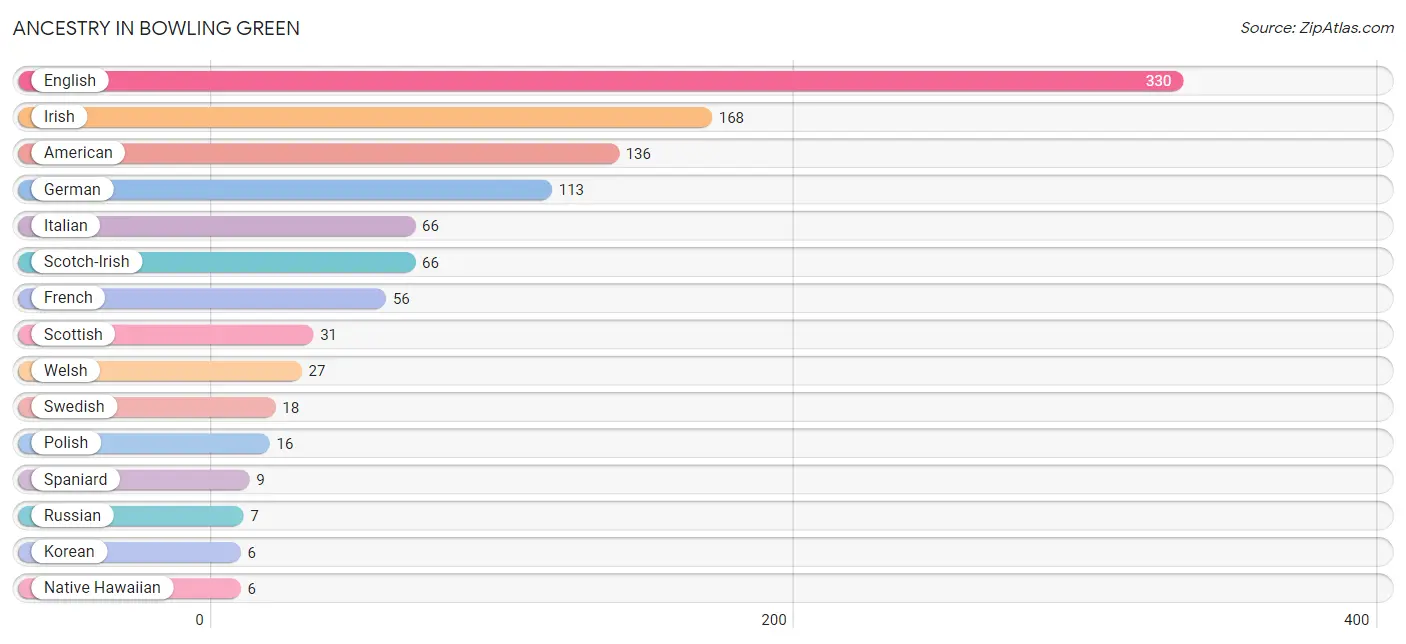
| Ancestry | # Population | % Population |
| American | 136 | 8.8% |
| British | 3 | 0.2% |
| English | 330 | 21.5% |
| French | 56 | 3.6% |
| German | 113 | 7.3% |
| Indian (Asian) | 4 | 0.3% |
| Irish | 168 | 10.9% |
| Italian | 66 | 4.3% |
| Korean | 6 | 0.4% |
| Native Hawaiian | 6 | 0.4% |
| Northern European | 6 | 0.4% |
| Norwegian | 2 | 0.1% |
| Polish | 16 | 1.0% |
| Portuguese | 6 | 0.4% |
| Russian | 7 | 0.5% |
| Scotch-Irish | 66 | 4.3% |
| Scottish | 31 | 2.0% |
| Spaniard | 9 | 0.6% |
| Swedish | 18 | 1.2% |
| Swiss | 3 | 0.2% |
| Welsh | 27 | 1.8% | View All 21 Rows |
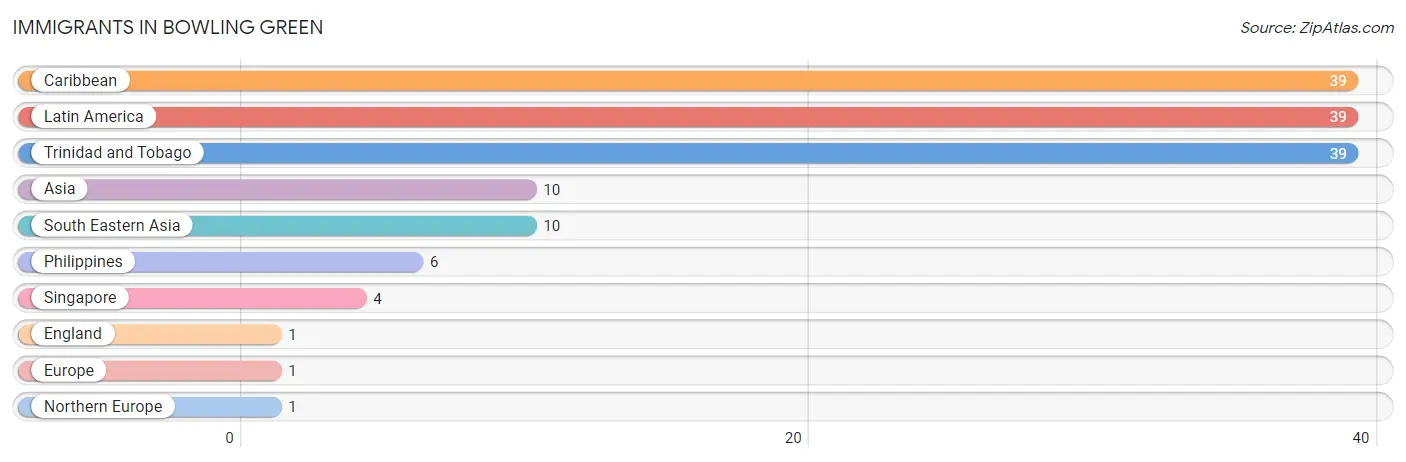
Immigrants in Bowling Green
The most numerous immigrant groups reported in Bowling Green came from Caribbean (39 | 2.5%), Latin America (39 | 2.5%), Trinidad and Tobago (39 | 2.5%), Asia (10 | 0.6%), and South Eastern Asia (10 | 0.6%), together accounting for 8.9% of all Bowling Green residents.
| Immigration Origin | # Population | % Population |
| Asia | 10 | 0.6% |
| Caribbean | 39 | 2.5% |
| England | 1 | 0.1% |
| Europe | 1 | 0.1% |
| Latin America | 39 | 2.5% |
| Northern Europe | 1 | 0.1% |
| Philippines | 6 | 0.4% |
| Singapore | 4 | 0.3% |
| South Eastern Asia | 10 | 0.6% |
| Trinidad and Tobago | 39 | 2.5% | View All 10 Rows |
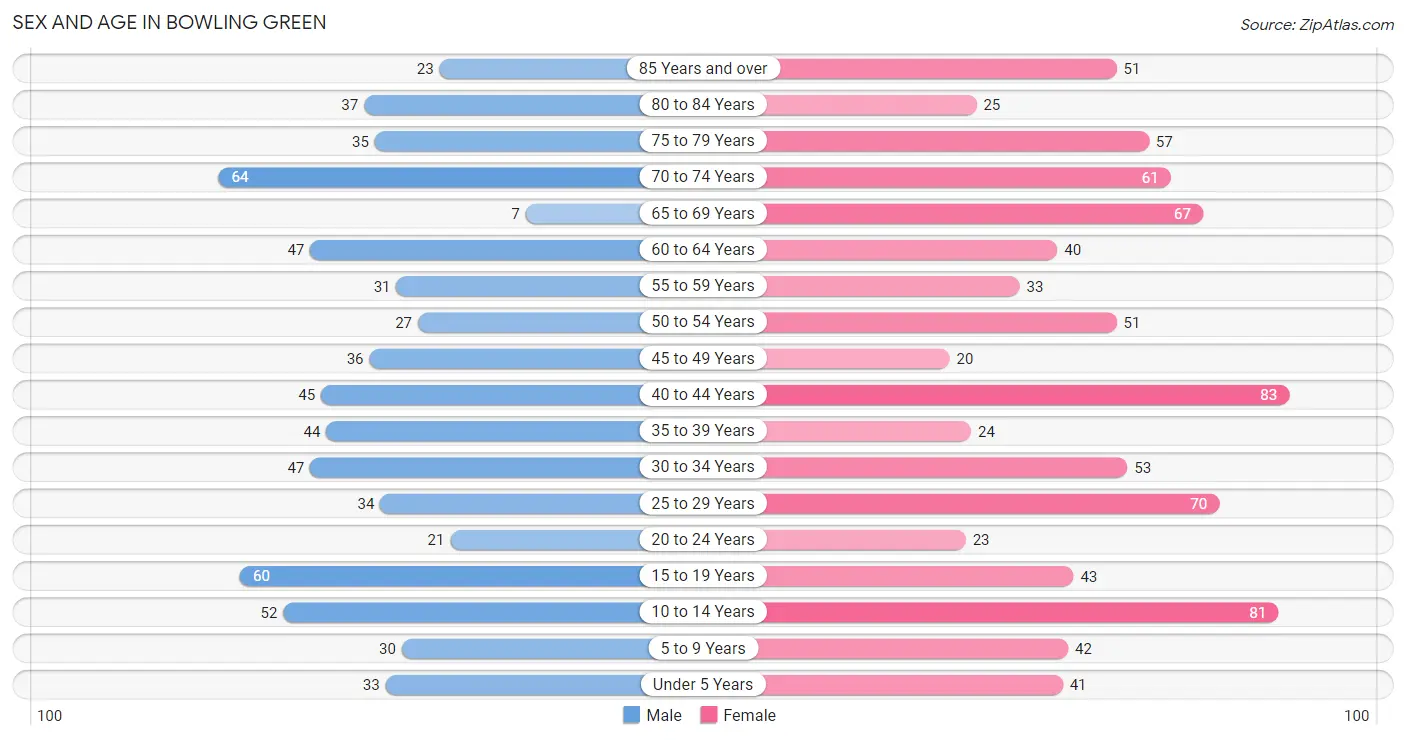
Sex and Age in Bowling Green
Sex and Age in Bowling Green
The most populous age groups in Bowling Green are 70 to 74 Years (64 | 9.5%) for men and 40 to 44 Years (83 | 9.6%) for women.
| Age Bracket | Male | Female |
| Under 5 Years | 33 (4.9%) | 41 (4.7%) |
| 5 to 9 Years | 30 (4.5%) | 42 (4.9%) |
| 10 to 14 Years | 52 (7.7%) | 81 (9.4%) |
| 15 to 19 Years | 60 (8.9%) | 43 (5.0%) |
| 20 to 24 Years | 21 (3.1%) | 23 (2.7%) |
| 25 to 29 Years | 34 (5.1%) | 70 (8.1%) |
| 30 to 34 Years | 47 (7.0%) | 53 (6.1%) |
| 35 to 39 Years | 44 (6.5%) | 24 (2.8%) |
| 40 to 44 Years | 45 (6.7%) | 83 (9.6%) |
| 45 to 49 Years | 36 (5.3%) | 20 (2.3%) |
| 50 to 54 Years | 27 (4.0%) | 51 (5.9%) |
| 55 to 59 Years | 31 (4.6%) | 33 (3.8%) |
| 60 to 64 Years | 47 (7.0%) | 40 (4.6%) |
| 65 to 69 Years | 7 (1.0%) | 67 (7.7%) |
| 70 to 74 Years | 64 (9.5%) | 61 (7.0%) |
| 75 to 79 Years | 35 (5.2%) | 57 (6.6%) |
| 80 to 84 Years | 37 (5.5%) | 25 (2.9%) |
| 85 Years and over | 23 (3.4%) | 51 (5.9%) |
| Total | 673 (100.0%) | 865 (100.0%) |
Families and Households in Bowling Green
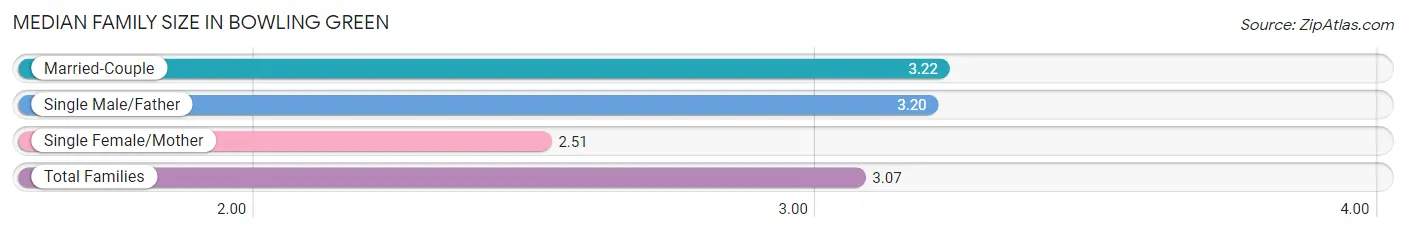
Median Family Size in Bowling Green
The median family size in Bowling Green is 3.07 persons per family, with married-couple families (273 | 76.7%) accounting for the largest median family size of 3.22 persons per family. On the other hand, single female/mother families (73 | 20.5%) represent the smallest median family size with 2.51 persons per family.
| Family Type | # Families | Family Size |
| Married-Couple | 273 (76.7%) | 3.22 |
| Single Male/Father | 10 (2.8%) | 3.20 |
| Single Female/Mother | 73 (20.5%) | 2.51 |
| Total Families | 356 (100.0%) | 3.07 |
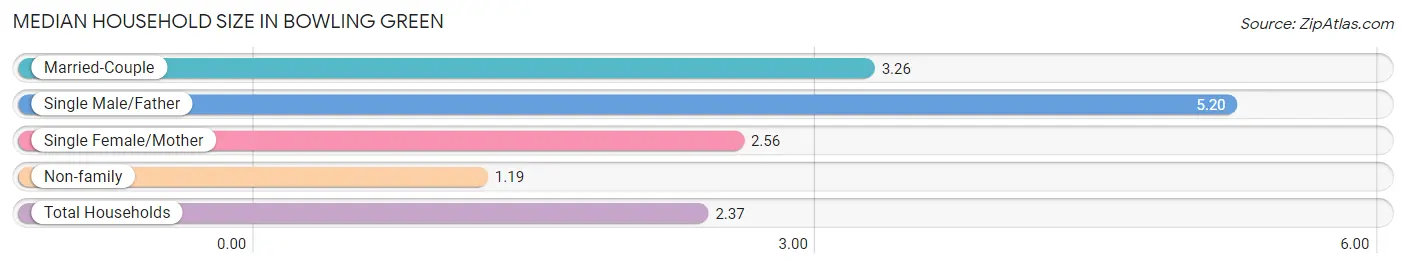
Median Household Size in Bowling Green
The median household size in Bowling Green is 2.37 persons per household, with single male/father households (10 | 1.7%) accounting for the largest median household size of 5.2 persons per household. non-family households (240 | 40.3%) represent the smallest median household size with 1.19 persons per household.
| Household Type | # Households | Household Size |
| Married-Couple | 273 (45.8%) | 3.26 |
| Single Male/Father | 10 (1.7%) | 5.20 |
| Single Female/Mother | 73 (12.2%) | 2.56 |
| Non-family | 240 (40.3%) | 1.19 |
| Total Households | 596 (100.0%) | 2.37 |
Household Size by Marriage Status in Bowling Green
Out of a total of 596 households in Bowling Green, 356 (59.7%) are family households, while 240 (40.3%) are nonfamily households. The most numerous type of family households are 2-person households, comprising 129, and the most common type of nonfamily households are 1-person households, comprising 216.
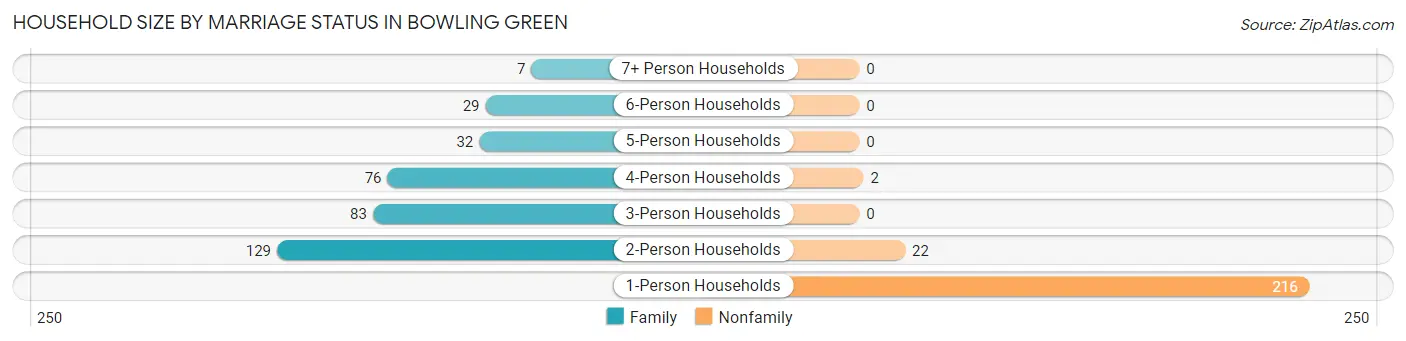
| Household Size | Family Households | Nonfamily Households |
| 1-Person Households | - | 216 (36.2%) |
| 2-Person Households | 129 (21.6%) | 22 (3.7%) |
| 3-Person Households | 83 (13.9%) | 0 (0.0%) |
| 4-Person Households | 76 (12.8%) | 2 (0.3%) |
| 5-Person Households | 32 (5.4%) | 0 (0.0%) |
| 6-Person Households | 29 (4.9%) | 0 (0.0%) |
| 7+ Person Households | 7 (1.2%) | 0 (0.0%) |
| Total | 356 (59.7%) | 240 (40.3%) |
Female Fertility in Bowling Green
Fertility by Age in Bowling Green
Average fertility rate in Bowling Green is 90.0 births per 1,000 women. Women in the age bracket of 20 to 34 years have the highest fertility rate with 171.0 births per 1,000 women. Women in the age bracket of 20 to 34 years acount for 86.2% of all women with births.
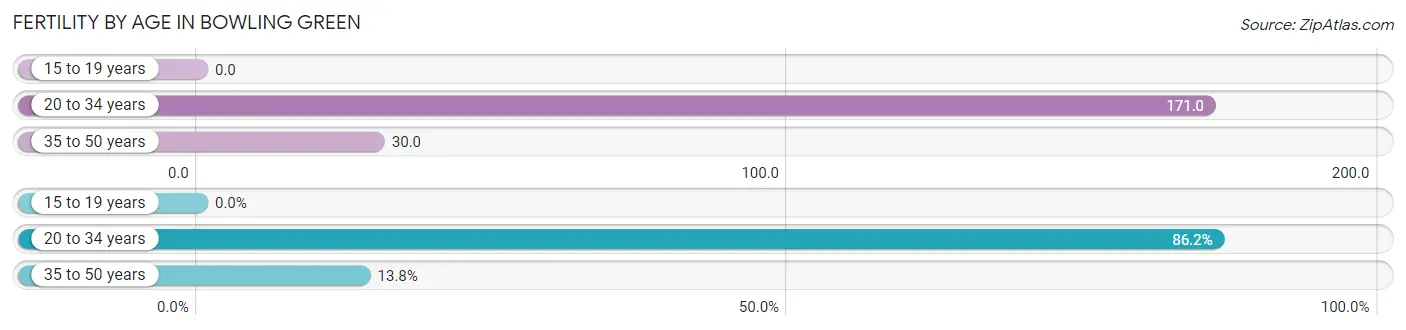
| Age Bracket | Women with Births | Births / 1,000 Women |
| 15 to 19 years | 0 (0.0%) | 0.0 |
| 20 to 34 years | 25 (86.2%) | 171.0 |
| 35 to 50 years | 4 (13.8%) | 30.0 |
| Total | 29 (100.0%) | 90.0 |
Fertility by Age by Marriage Status in Bowling Green
93.1% of women with births (29) in Bowling Green are married. The highest percentage of unmarried women with births falls into 35 to 50 years age bracket with 50.0% of them unmarried at the time of birth, while the lowest percentage of unmarried women with births belong to 20 to 34 years age bracket with 0.0% of them unmarried.
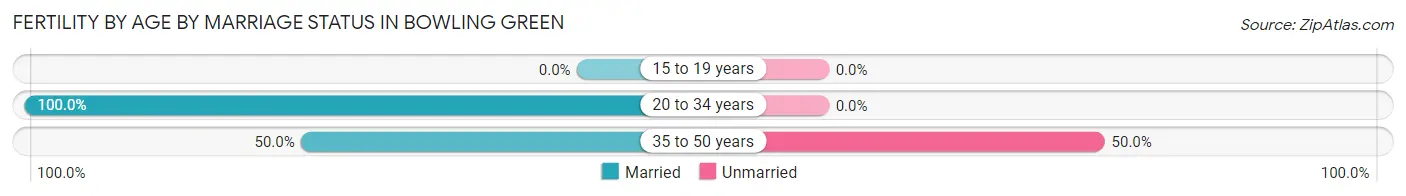
| Age Bracket | Married | Unmarried |
| 15 to 19 years | 0 (0.0%) | 0 (0.0%) |
| 20 to 34 years | 25 (100.0%) | 0 (0.0%) |
| 35 to 50 years | 2 (50.0%) | 2 (50.0%) |
| Total | 27 (93.1%) | 2 (6.9%) |
Fertility by Education in Bowling Green
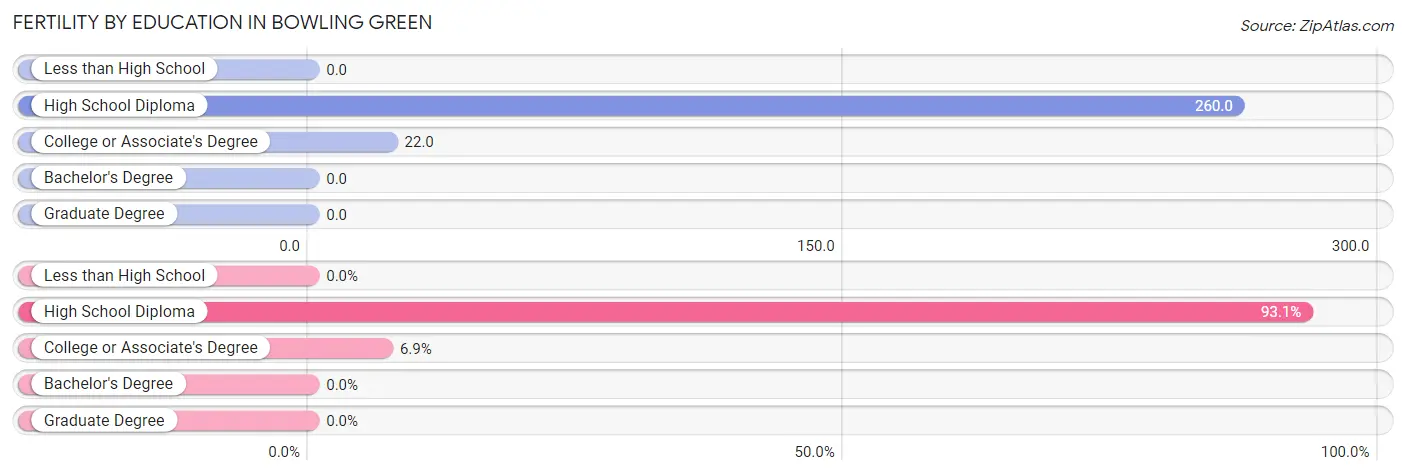
| Educational Attainment | Women with Births | Births / 1,000 Women |
| Less than High School | 0 (0.0%) | 0.0 |
| High School Diploma | 27 (93.1%) | 260.0 |
| College or Associate's Degree | 2 (6.9%) | 22.0 |
| Bachelor's Degree | 0 (0.0%) | 0.0 |
| Graduate Degree | 0 (0.0%) | 0.0 |
| Total | 29 (100.0%) | 90.0 |
Fertility by Education by Marriage Status in Bowling Green
6.9% of women with births in Bowling Green are unmarried. Women with the educational attainment of high school diploma are most likely to be married with 100.0% of them married at childbirth, while women with the educational attainment of college or associate's degree are least likely to be married with 100.0% of them unmarried at childbirth.
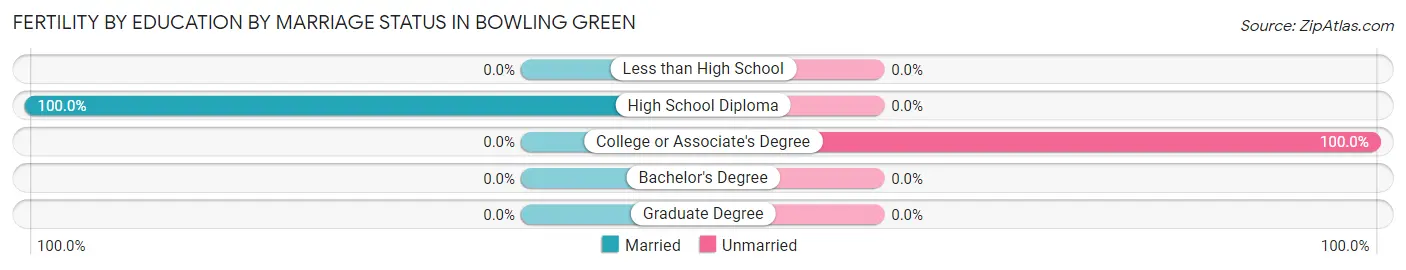
| Educational Attainment | Married | Unmarried |
| Less than High School | 0 (0.0%) | 0 (0.0%) |
| High School Diploma | 27 (100.0%) | 0 (0.0%) |
| College or Associate's Degree | 0 (0.0%) | 2 (100.0%) |
| Bachelor's Degree | 0 (0.0%) | 0 (0.0%) |
| Graduate Degree | 0 (0.0%) | 0 (0.0%) |
| Total | 27 (93.1%) | 2 (6.9%) |
Employment Characteristics in Bowling Green
Employment by Class of Employer in Bowling Green
Among the 617 employed individuals in Bowling Green, private company employees (343 | 55.6%), local government employees (92 | 14.9%), and state government employees (64 | 10.4%) make up the most common classes of employment.
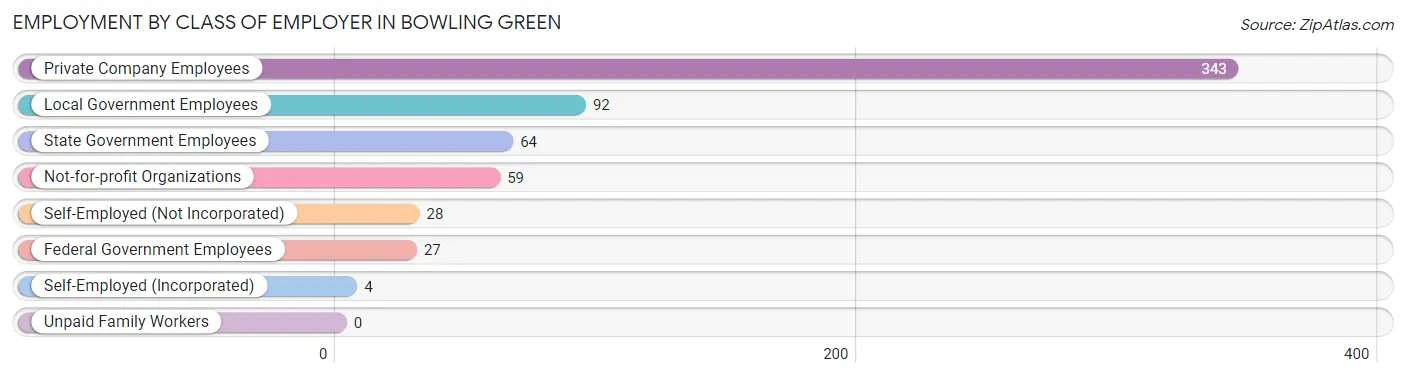
| Employer Class | # Employees | % Employees |
| Private Company Employees | 343 | 55.6% |
| Self-Employed (Incorporated) | 4 | 0.6% |
| Self-Employed (Not Incorporated) | 28 | 4.5% |
| Not-for-profit Organizations | 59 | 9.6% |
| Local Government Employees | 92 | 14.9% |
| State Government Employees | 64 | 10.4% |
| Federal Government Employees | 27 | 4.4% |
| Unpaid Family Workers | 0 | 0.0% |
| Total | 617 | 100.0% |
Employment Status by Age in Bowling Green
According to the labor force statistics for Bowling Green, out of the total population over 16 years of age (1,246), 51.9% or 647 individuals are in the labor force, with 3.9% or 25 of them unemployed. The age group with the highest labor force participation rate is 20 to 24 years, with 93.2% or 41 individuals in the labor force. Within the labor force, the 20 to 24 years age range has the highest percentage of unemployed individuals, with 26.8% or 11 of them being unemployed.
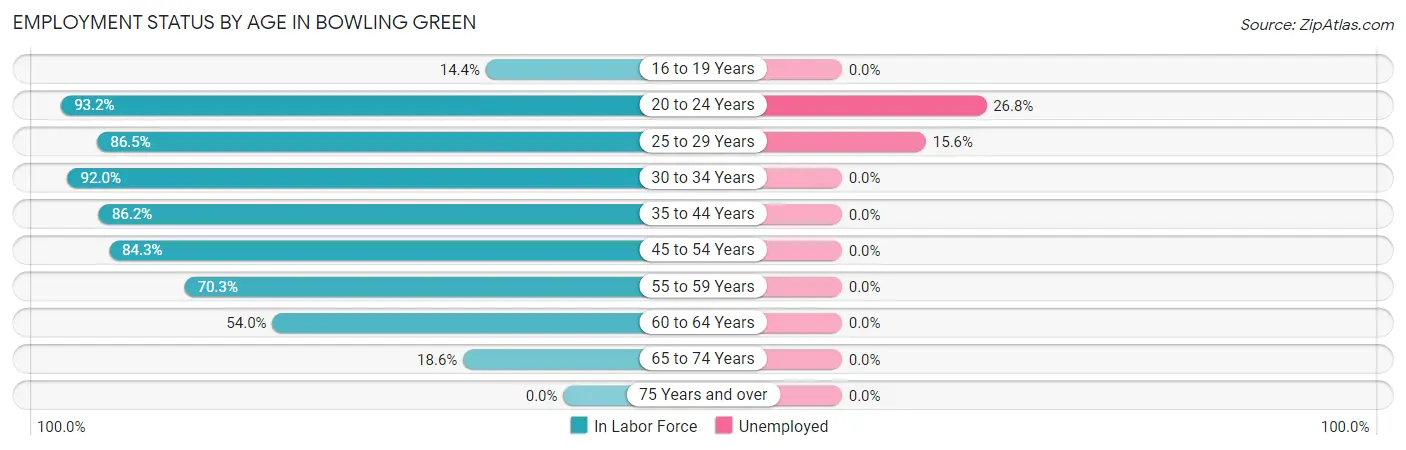
| Age Bracket | In Labor Force | Unemployed |
| 16 to 19 Years | 13 (14.4%) | 0 (0.0%) |
| 20 to 24 Years | 41 (93.2%) | 11 (26.8%) |
| 25 to 29 Years | 90 (86.5%) | 14 (15.6%) |
| 30 to 34 Years | 92 (92.0%) | 0 (0.0%) |
| 35 to 44 Years | 169 (86.2%) | 0 (0.0%) |
| 45 to 54 Years | 113 (84.3%) | 0 (0.0%) |
| 55 to 59 Years | 45 (70.3%) | 0 (0.0%) |
| 60 to 64 Years | 47 (54.0%) | 0 (0.0%) |
| 65 to 74 Years | 37 (18.6%) | 0 (0.0%) |
| 75 Years and over | 0 (0.0%) | 0 (0.0%) |
| Total | 647 (51.9%) | 25 (3.9%) |
Employment Status by Educational Attainment in Bowling Green
According to labor force statistics for Bowling Green, 81.2% of individuals (556) out of the total population between 25 and 64 years of age (685) are in the labor force, with 2.5% or 14 of them being unemployed. The group with the highest labor force participation rate are those with the educational attainment of bachelor's degree or higher, with 92.0% or 160 individuals in the labor force. Within the labor force, individuals with high school diploma education have the highest percentage of unemployment, with 6.2% or 14 of them being unemployed.
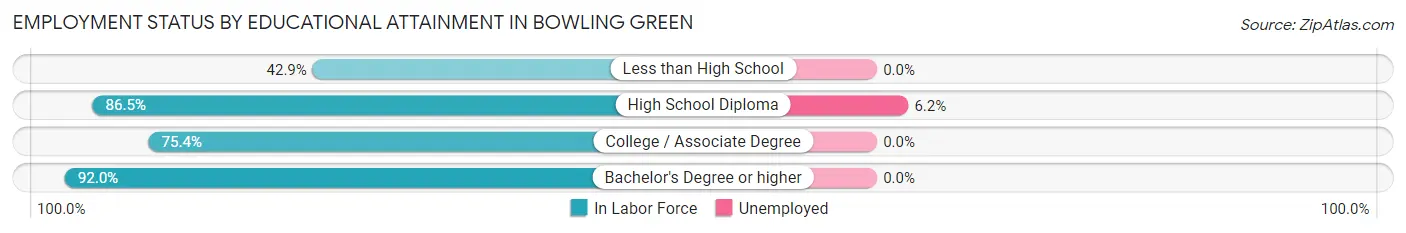
| Educational Attainment | In Labor Force | Unemployed |
| Less than High School | 24 (42.9%) | 0 (0.0%) |
| High School Diploma | 225 (86.5%) | 16 (6.2%) |
| College / Associate Degree | 147 (75.4%) | 0 (0.0%) |
| Bachelor's Degree or higher | 160 (92.0%) | 0 (0.0%) |
| Total | 556 (81.2%) | 17 (2.5%) |
Employment Occupations by Sex in Bowling Green
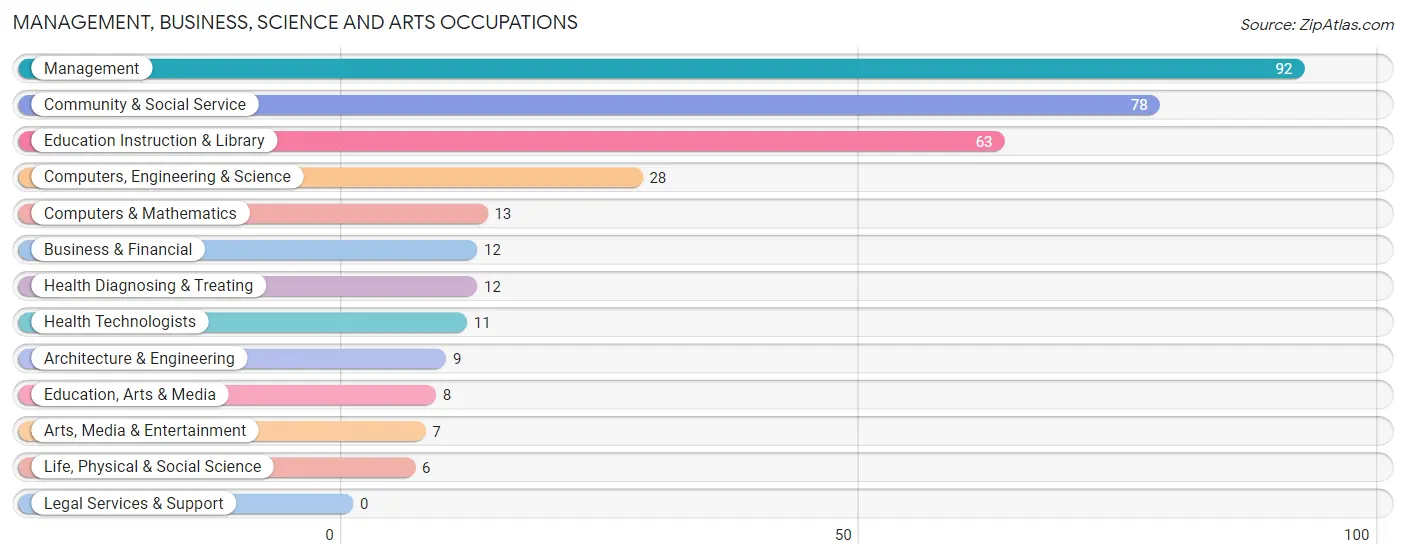
Management, Business, Science and Arts Occupations
The most common Management, Business, Science and Arts occupations in Bowling Green are Management (92 | 14.8%), Community & Social Service (78 | 12.5%), Education Instruction & Library (63 | 10.1%), Computers, Engineering & Science (28 | 4.5%), and Computers & Mathematics (13 | 2.1%).
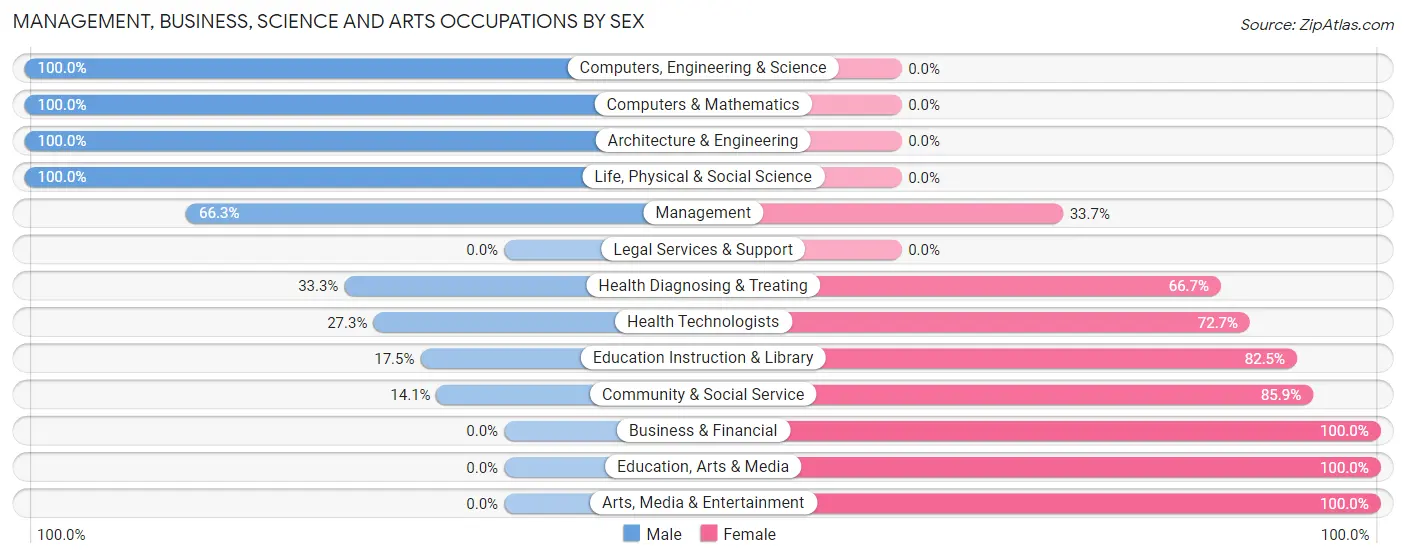
Management, Business, Science and Arts Occupations by Sex
Within the Management, Business, Science and Arts occupations in Bowling Green, the most male-oriented occupations are Computers, Engineering & Science (100.0%), Computers & Mathematics (100.0%), and Architecture & Engineering (100.0%), while the most female-oriented occupations are Business & Financial (100.0%), Education, Arts & Media (100.0%), and Arts, Media & Entertainment (100.0%).
| Occupation | Male | Female |
| Management | 61 (66.3%) | 31 (33.7%) |
| Business & Financial | 0 (0.0%) | 12 (100.0%) |
| Computers, Engineering & Science | 28 (100.0%) | 0 (0.0%) |
| Computers & Mathematics | 13 (100.0%) | 0 (0.0%) |
| Architecture & Engineering | 9 (100.0%) | 0 (0.0%) |
| Life, Physical & Social Science | 6 (100.0%) | 0 (0.0%) |
| Community & Social Service | 11 (14.1%) | 67 (85.9%) |
| Education, Arts & Media | 0 (0.0%) | 8 (100.0%) |
| Legal Services & Support | 0 (0.0%) | 0 (0.0%) |
| Education Instruction & Library | 11 (17.5%) | 52 (82.5%) |
| Arts, Media & Entertainment | 0 (0.0%) | 7 (100.0%) |
| Health Diagnosing & Treating | 4 (33.3%) | 8 (66.7%) |
| Health Technologists | 3 (27.3%) | 8 (72.7%) |
| Total (Category) | 104 (46.9%) | 118 (53.1%) |
| Total (Overall) | 323 (51.9%) | 299 (48.1%) |
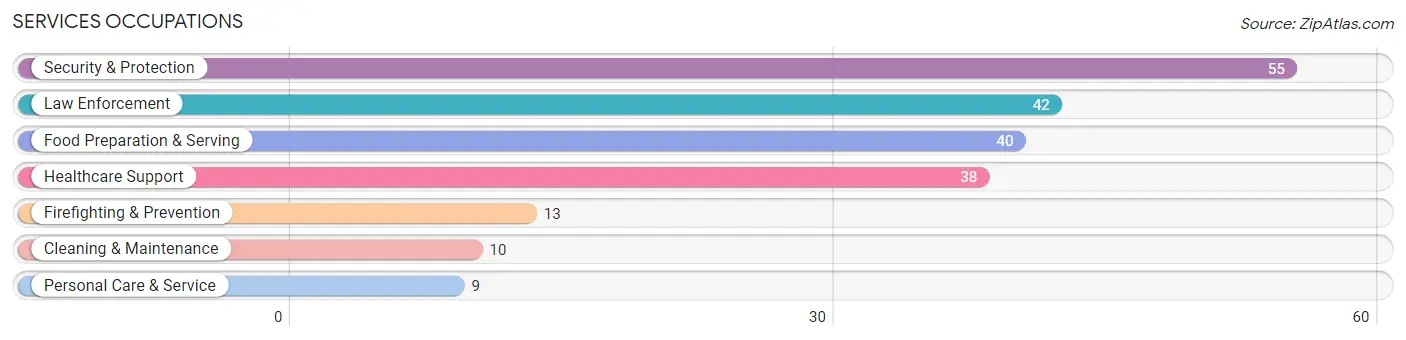
Services Occupations
The most common Services occupations in Bowling Green are Security & Protection (55 | 8.8%), Law Enforcement (42 | 6.8%), Food Preparation & Serving (40 | 6.4%), Healthcare Support (38 | 6.1%), and Firefighting & Prevention (13 | 2.1%).
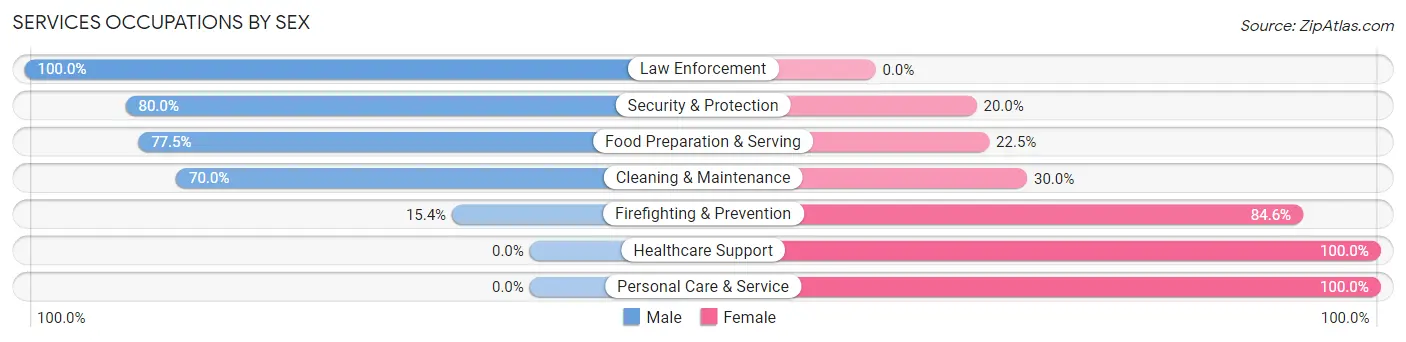
Services Occupations by Sex
Within the Services occupations in Bowling Green, the most male-oriented occupations are Law Enforcement (100.0%), Security & Protection (80.0%), and Food Preparation & Serving (77.5%), while the most female-oriented occupations are Healthcare Support (100.0%), Personal Care & Service (100.0%), and Firefighting & Prevention (84.6%).
| Occupation | Male | Female |
| Healthcare Support | 0 (0.0%) | 38 (100.0%) |
| Security & Protection | 44 (80.0%) | 11 (20.0%) |
| Firefighting & Prevention | 2 (15.4%) | 11 (84.6%) |
| Law Enforcement | 42 (100.0%) | 0 (0.0%) |
| Food Preparation & Serving | 31 (77.5%) | 9 (22.5%) |
| Cleaning & Maintenance | 7 (70.0%) | 3 (30.0%) |
| Personal Care & Service | 0 (0.0%) | 9 (100.0%) |
| Total (Category) | 82 (53.9%) | 70 (46.1%) |
| Total (Overall) | 323 (51.9%) | 299 (48.1%) |
Sales and Office Occupations
The most common Sales and Office occupations in Bowling Green are Office & Administration (106 | 17.0%), and Sales & Related (23 | 3.7%).
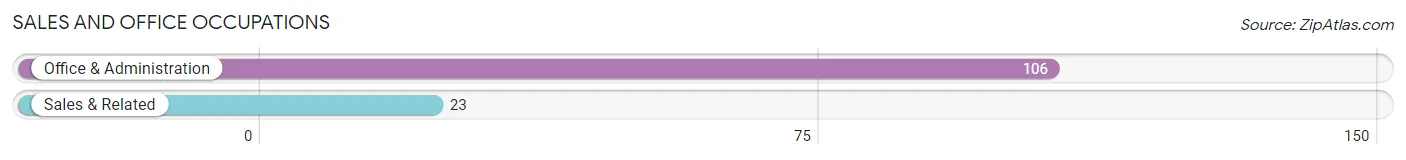
Sales and Office Occupations by Sex
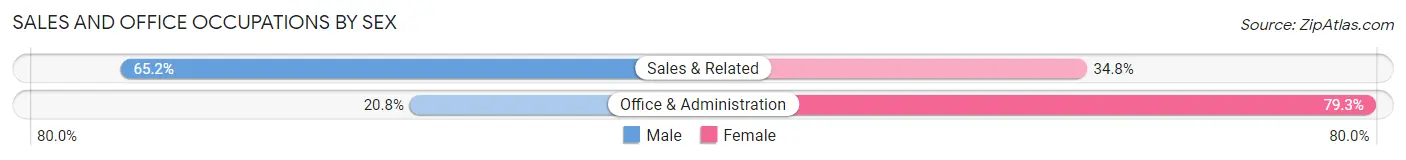
| Occupation | Male | Female |
| Sales & Related | 15 (65.2%) | 8 (34.8%) |
| Office & Administration | 22 (20.7%) | 84 (79.2%) |
| Total (Category) | 37 (28.7%) | 92 (71.3%) |
| Total (Overall) | 323 (51.9%) | 299 (48.1%) |
Natural Resources, Construction and Maintenance Occupations
The most common Natural Resources, Construction and Maintenance occupations in Bowling Green are Construction & Extraction (38 | 6.1%), and Installation, Maintenance & Repair (37 | 5.9%).
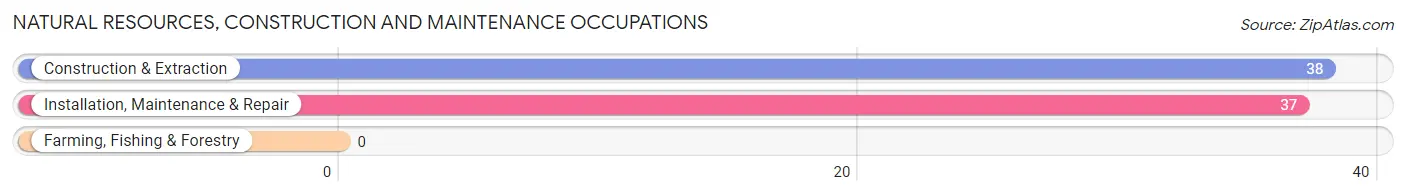
Natural Resources, Construction and Maintenance Occupations by Sex
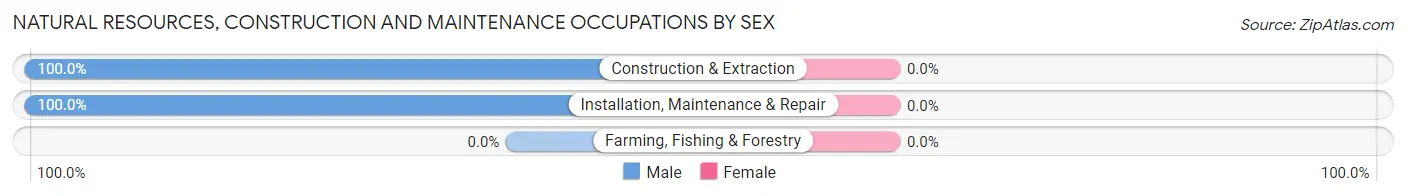
| Occupation | Male | Female |
| Farming, Fishing & Forestry | 0 (0.0%) | 0 (0.0%) |
| Construction & Extraction | 38 (100.0%) | 0 (0.0%) |
| Installation, Maintenance & Repair | 37 (100.0%) | 0 (0.0%) |
| Total (Category) | 75 (100.0%) | 0 (0.0%) |
| Total (Overall) | 323 (51.9%) | 299 (48.1%) |
Production, Transportation and Moving Occupations
The most common Production, Transportation and Moving occupations in Bowling Green are Material Moving (26 | 4.2%), Production (11 | 1.8%), and Transportation (7 | 1.1%).
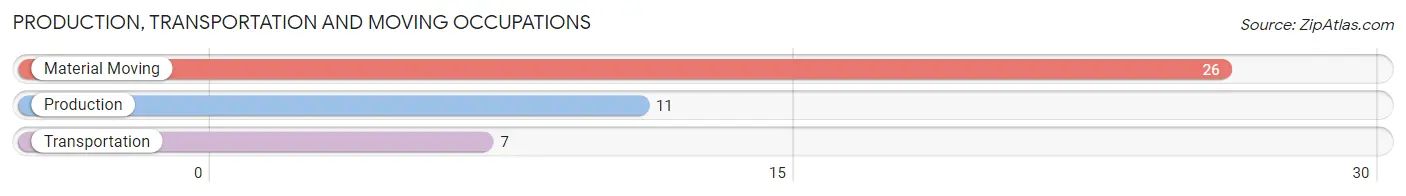
Production, Transportation and Moving Occupations by Sex
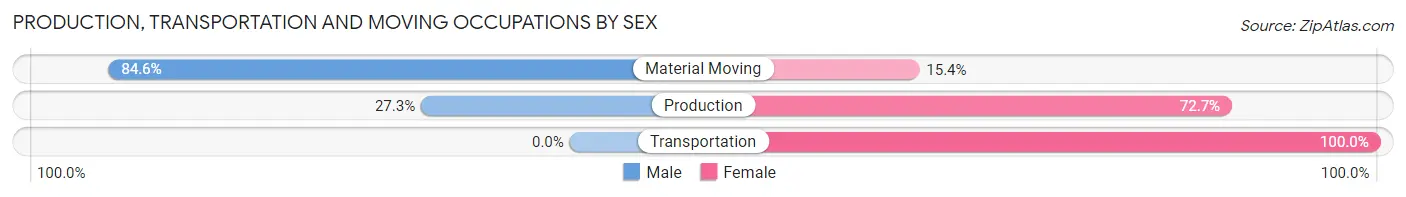
| Occupation | Male | Female |
| Production | 3 (27.3%) | 8 (72.7%) |
| Transportation | 0 (0.0%) | 7 (100.0%) |
| Material Moving | 22 (84.6%) | 4 (15.4%) |
| Total (Category) | 25 (56.8%) | 19 (43.2%) |
| Total (Overall) | 323 (51.9%) | 299 (48.1%) |
Employment Industries by Sex in Bowling Green
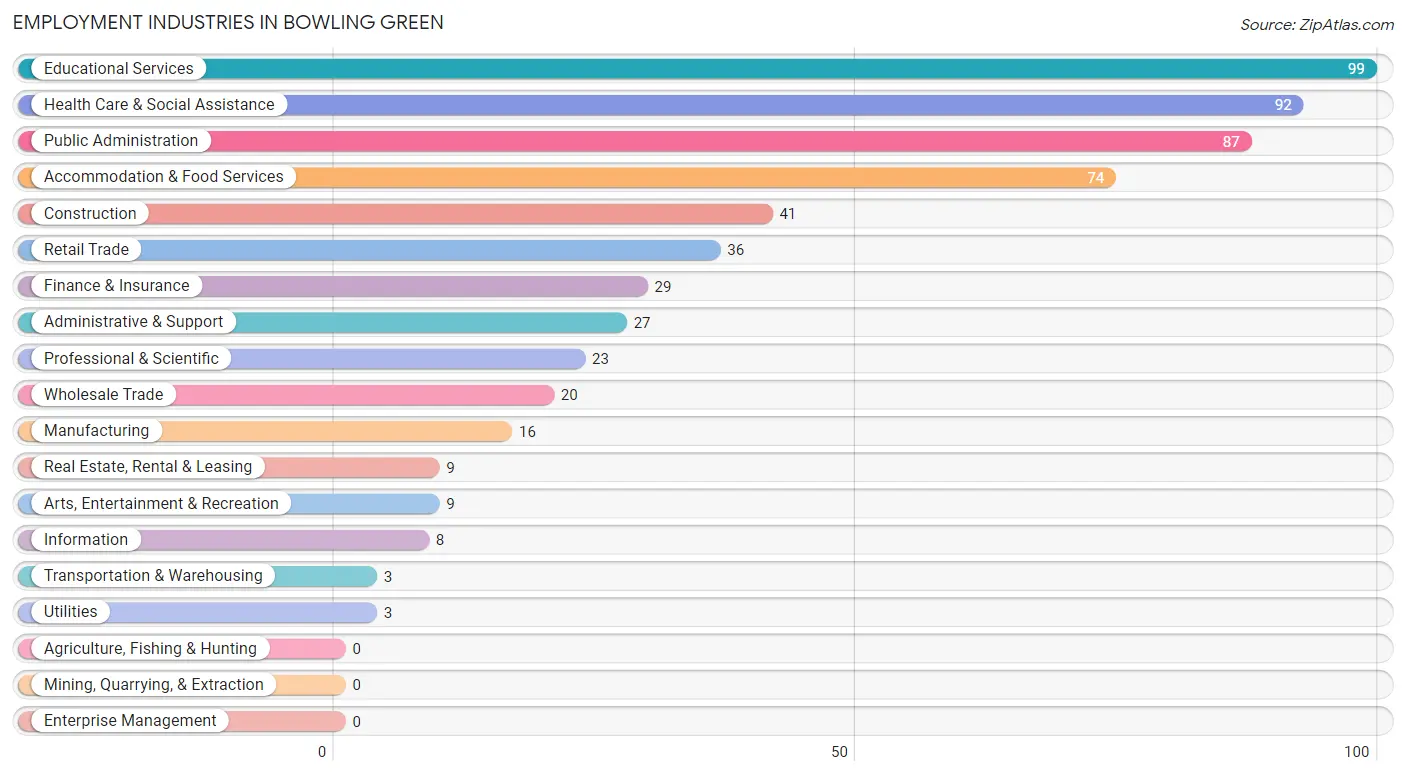
Employment Industries in Bowling Green
The major employment industries in Bowling Green include Educational Services (99 | 15.9%), Health Care & Social Assistance (92 | 14.8%), Public Administration (87 | 14.0%), Accommodation & Food Services (74 | 11.9%), and Construction (41 | 6.6%).
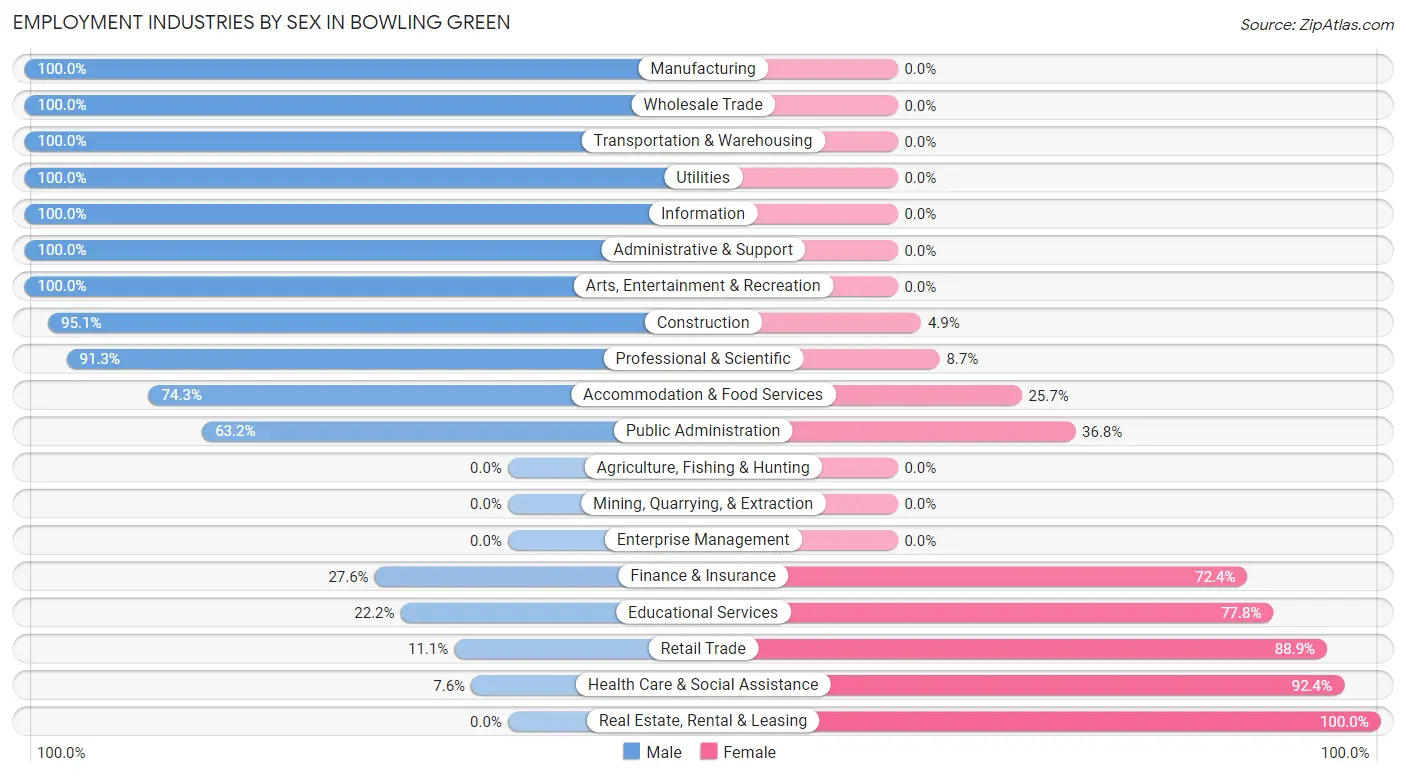
Employment Industries by Sex in Bowling Green
The Bowling Green industries that see more men than women are Manufacturing (100.0%), Wholesale Trade (100.0%), and Transportation & Warehousing (100.0%), whereas the industries that tend to have a higher number of women are Real Estate, Rental & Leasing (100.0%), Health Care & Social Assistance (92.4%), and Retail Trade (88.9%).
| Industry | Male | Female |
| Agriculture, Fishing & Hunting | 0 (0.0%) | 0 (0.0%) |
| Mining, Quarrying, & Extraction | 0 (0.0%) | 0 (0.0%) |
| Construction | 39 (95.1%) | 2 (4.9%) |
| Manufacturing | 16 (100.0%) | 0 (0.0%) |
| Wholesale Trade | 20 (100.0%) | 0 (0.0%) |
| Retail Trade | 4 (11.1%) | 32 (88.9%) |
| Transportation & Warehousing | 3 (100.0%) | 0 (0.0%) |
| Utilities | 3 (100.0%) | 0 (0.0%) |
| Information | 8 (100.0%) | 0 (0.0%) |
| Finance & Insurance | 8 (27.6%) | 21 (72.4%) |
| Real Estate, Rental & Leasing | 0 (0.0%) | 9 (100.0%) |
| Professional & Scientific | 21 (91.3%) | 2 (8.7%) |
| Enterprise Management | 0 (0.0%) | 0 (0.0%) |
| Administrative & Support | 27 (100.0%) | 0 (0.0%) |
| Educational Services | 22 (22.2%) | 77 (77.8%) |
| Health Care & Social Assistance | 7 (7.6%) | 85 (92.4%) |
| Arts, Entertainment & Recreation | 9 (100.0%) | 0 (0.0%) |
| Accommodation & Food Services | 55 (74.3%) | 19 (25.7%) |
| Public Administration | 55 (63.2%) | 32 (36.8%) |
| Total | 323 (51.9%) | 299 (48.1%) |
Education in Bowling Green
School Enrollment in Bowling Green
The most common levels of schooling among the 342 students in Bowling Green are high school (110 | 32.2%), middle school (106 | 31.0%), and elementary school (64 | 18.7%).
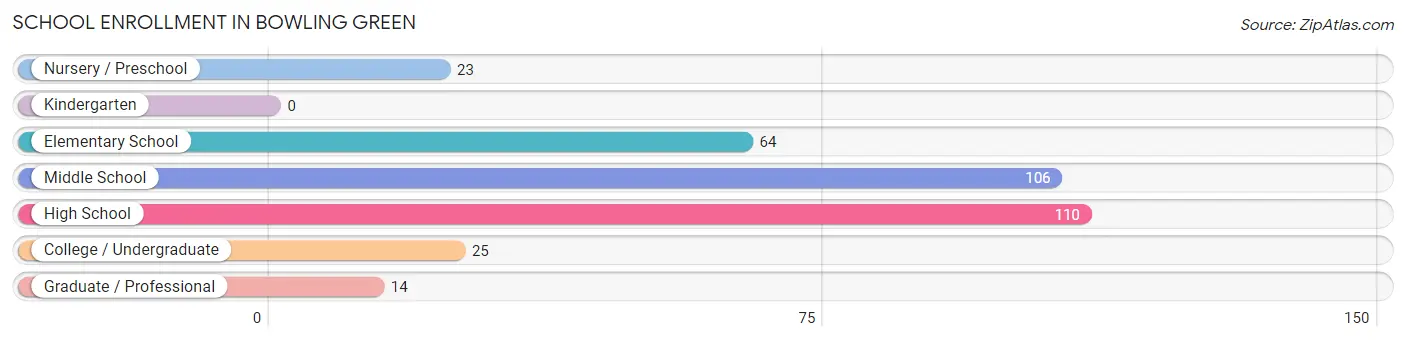
| School Level | # Students | % Students |
| Nursery / Preschool | 23 | 6.7% |
| Kindergarten | 0 | 0.0% |
| Elementary School | 64 | 18.7% |
| Middle School | 106 | 31.0% |
| High School | 110 | 32.2% |
| College / Undergraduate | 25 | 7.3% |
| Graduate / Professional | 14 | 4.1% |
| Total | 342 | 100.0% |
School Enrollment by Age by Funding Source in Bowling Green
Out of a total of 342 students who are enrolled in schools in Bowling Green, 20 (5.8%) attend a private institution, while the remaining 322 (94.2%) are enrolled in public schools. The age group of 3 to 4 year olds has the highest likelihood of being enrolled in private schools, with 8 (53.3% in the age bracket) enrolled. Conversely, the age group of 10 to 14 year olds has the lowest likelihood of being enrolled in a private school, with 130 (100.0% in the age bracket) attending a public institution.
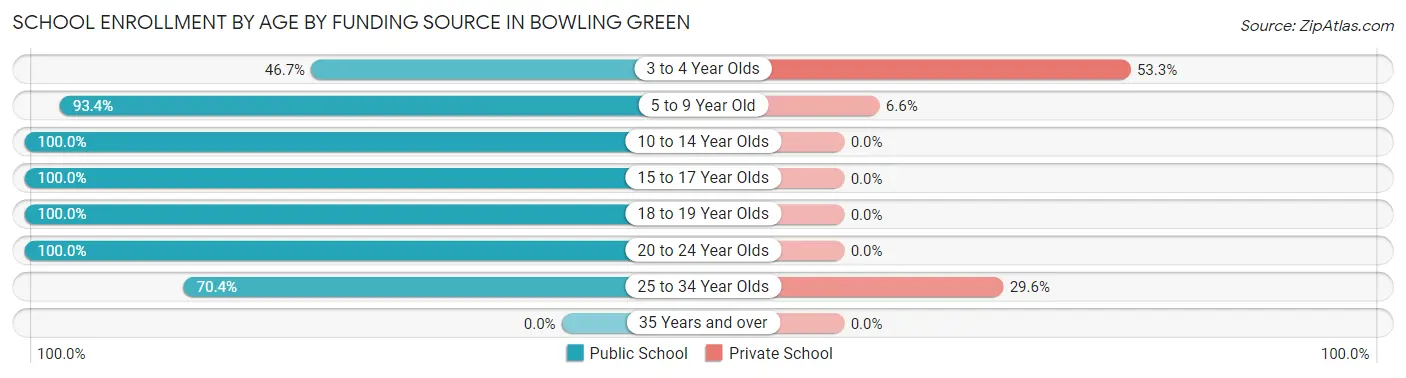
| Age Bracket | Public School | Private School |
| 3 to 4 Year Olds | 7 (46.7%) | 8 (53.3%) |
| 5 to 9 Year Old | 57 (93.4%) | 4 (6.6%) |
| 10 to 14 Year Olds | 130 (100.0%) | 0 (0.0%) |
| 15 to 17 Year Olds | 76 (100.0%) | 0 (0.0%) |
| 18 to 19 Year Olds | 20 (100.0%) | 0 (0.0%) |
| 20 to 24 Year Olds | 13 (100.0%) | 0 (0.0%) |
| 25 to 34 Year Olds | 19 (70.4%) | 8 (29.6%) |
| 35 Years and over | 0 (0.0%) | 0 (0.0%) |
| Total | 322 (94.2%) | 20 (5.8%) |
Educational Attainment by Field of Study in Bowling Green
Arts & humanities (30 | 12.8%), education (28 | 11.9%), psychology (27 | 11.5%), business (27 | 11.5%), and social sciences (24 | 10.2%) are the most common fields of study among 235 individuals in Bowling Green who have obtained a bachelor's degree or higher.
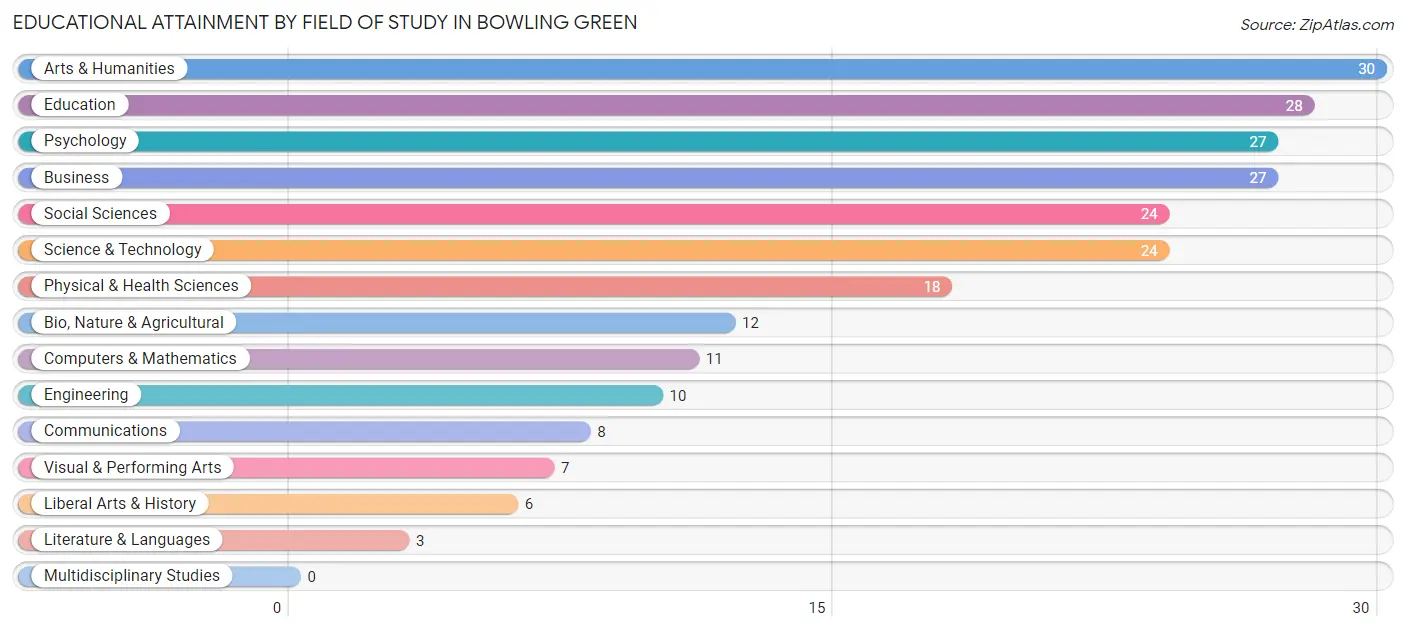
| Field of Study | # Graduates | % Graduates |
| Computers & Mathematics | 11 | 4.7% |
| Bio, Nature & Agricultural | 12 | 5.1% |
| Physical & Health Sciences | 18 | 7.7% |
| Psychology | 27 | 11.5% |
| Social Sciences | 24 | 10.2% |
| Engineering | 10 | 4.3% |
| Multidisciplinary Studies | 0 | 0.0% |
| Science & Technology | 24 | 10.2% |
| Business | 27 | 11.5% |
| Education | 28 | 11.9% |
| Literature & Languages | 3 | 1.3% |
| Liberal Arts & History | 6 | 2.5% |
| Visual & Performing Arts | 7 | 3.0% |
| Communications | 8 | 3.4% |
| Arts & Humanities | 30 | 12.8% |
| Total | 235 | 100.0% |
Transportation & Commute in Bowling Green
Vehicle Availability by Sex in Bowling Green
The most prevalent vehicle ownership categories in Bowling Green are males with 2 vehicles (156, accounting for 48.3%) and females with 2 vehicles (152, making up 53.2%).
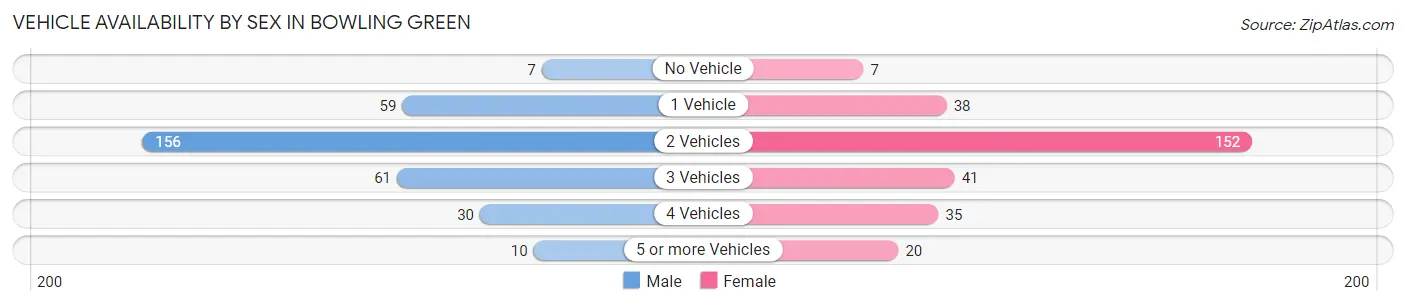
| Vehicles Available | Male | Female |
| No Vehicle | 7 (2.2%) | 7 (2.4%) |
| 1 Vehicle | 59 (18.3%) | 38 (13.0%) |
| 2 Vehicles | 156 (48.3%) | 152 (51.9%) |
| 3 Vehicles | 61 (18.9%) | 41 (14.0%) |
| 4 Vehicles | 30 (9.3%) | 35 (11.9%) |
| 5 or more Vehicles | 10 (3.1%) | 20 (6.8%) |
| Total | 323 (100.0%) | 293 (100.0%) |
Commute Time in Bowling Green
The most frequently occuring commute durations in Bowling Green are 30 to 34 minutes (90 commuters, 15.2%), 45 to 59 minutes (82 commuters, 13.9%), and 15 to 19 minutes (68 commuters, 11.5%).
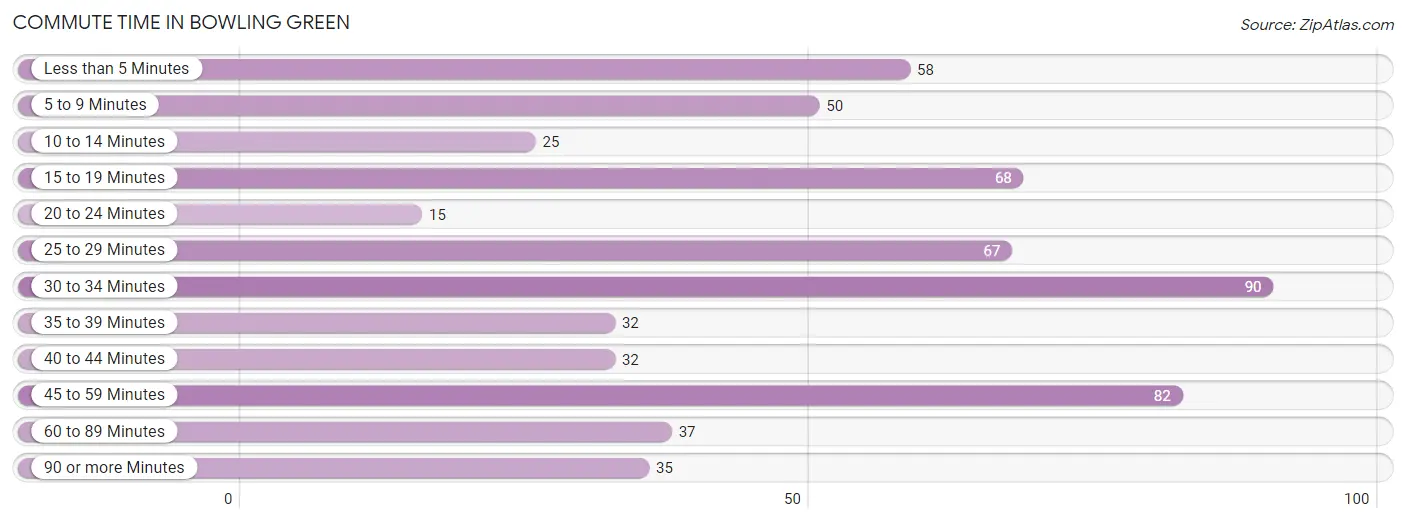
| Commute Time | # Commuters | % Commuters |
| Less than 5 Minutes | 58 | 9.8% |
| 5 to 9 Minutes | 50 | 8.5% |
| 10 to 14 Minutes | 25 | 4.2% |
| 15 to 19 Minutes | 68 | 11.5% |
| 20 to 24 Minutes | 15 | 2.5% |
| 25 to 29 Minutes | 67 | 11.3% |
| 30 to 34 Minutes | 90 | 15.2% |
| 35 to 39 Minutes | 32 | 5.4% |
| 40 to 44 Minutes | 32 | 5.4% |
| 45 to 59 Minutes | 82 | 13.9% |
| 60 to 89 Minutes | 37 | 6.3% |
| 90 or more Minutes | 35 | 5.9% |
Commute Time by Sex in Bowling Green
The most common commute times in Bowling Green are 15 to 19 minutes (47 commuters, 15.2%) for males and 30 to 34 minutes (58 commuters, 20.6%) for females.
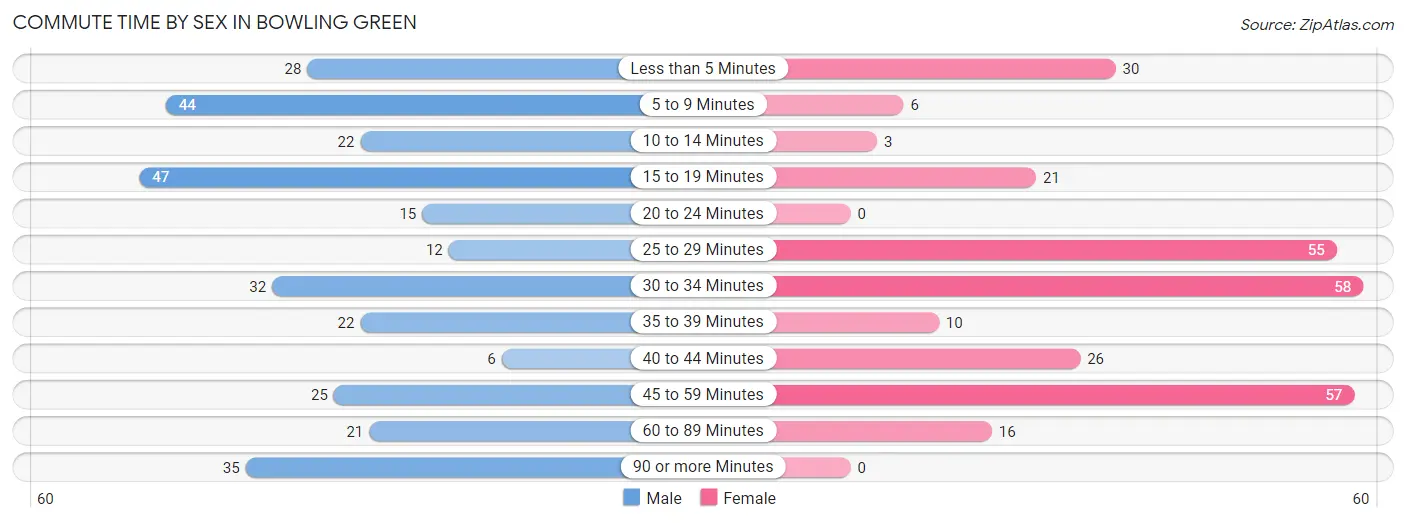
| Commute Time | Male | Female |
| Less than 5 Minutes | 28 (9.1%) | 30 (10.6%) |
| 5 to 9 Minutes | 44 (14.2%) | 6 (2.1%) |
| 10 to 14 Minutes | 22 (7.1%) | 3 (1.1%) |
| 15 to 19 Minutes | 47 (15.2%) | 21 (7.4%) |
| 20 to 24 Minutes | 15 (4.9%) | 0 (0.0%) |
| 25 to 29 Minutes | 12 (3.9%) | 55 (19.5%) |
| 30 to 34 Minutes | 32 (10.4%) | 58 (20.6%) |
| 35 to 39 Minutes | 22 (7.1%) | 10 (3.5%) |
| 40 to 44 Minutes | 6 (1.9%) | 26 (9.2%) |
| 45 to 59 Minutes | 25 (8.1%) | 57 (20.2%) |
| 60 to 89 Minutes | 21 (6.8%) | 16 (5.7%) |
| 90 or more Minutes | 35 (11.3%) | 0 (0.0%) |
Time of Departure to Work by Sex in Bowling Green
The most frequent times of departure to work in Bowling Green are 6:30 AM to 6:59 AM (44, 14.2%) for males and 6:30 AM to 6:59 AM (77, 27.3%) for females.
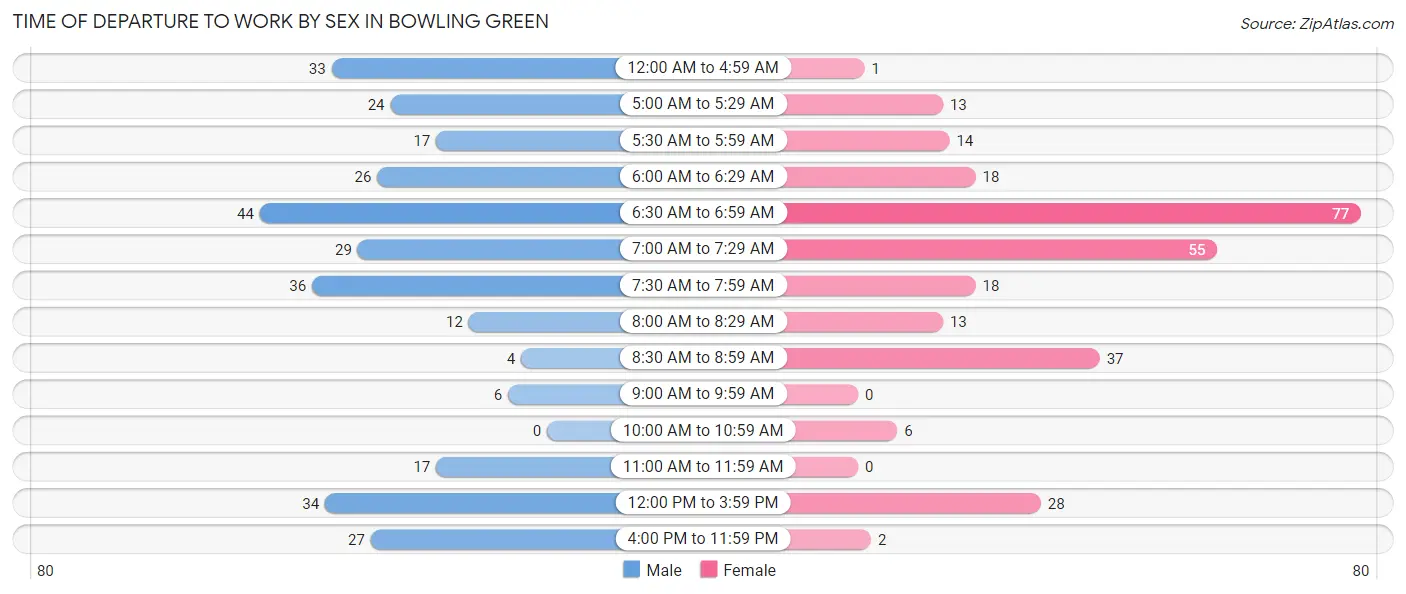
| Time of Departure | Male | Female |
| 12:00 AM to 4:59 AM | 33 (10.7%) | 1 (0.4%) |
| 5:00 AM to 5:29 AM | 24 (7.8%) | 13 (4.6%) |
| 5:30 AM to 5:59 AM | 17 (5.5%) | 14 (5.0%) |
| 6:00 AM to 6:29 AM | 26 (8.4%) | 18 (6.4%) |
| 6:30 AM to 6:59 AM | 44 (14.2%) | 77 (27.3%) |
| 7:00 AM to 7:29 AM | 29 (9.4%) | 55 (19.5%) |
| 7:30 AM to 7:59 AM | 36 (11.7%) | 18 (6.4%) |
| 8:00 AM to 8:29 AM | 12 (3.9%) | 13 (4.6%) |
| 8:30 AM to 8:59 AM | 4 (1.3%) | 37 (13.1%) |
| 9:00 AM to 9:59 AM | 6 (1.9%) | 0 (0.0%) |
| 10:00 AM to 10:59 AM | 0 (0.0%) | 6 (2.1%) |
| 11:00 AM to 11:59 AM | 17 (5.5%) | 0 (0.0%) |
| 12:00 PM to 3:59 PM | 34 (11.0%) | 28 (9.9%) |
| 4:00 PM to 11:59 PM | 27 (8.7%) | 2 (0.7%) |
| Total | 309 (100.0%) | 282 (100.0%) |
Housing Occupancy in Bowling Green
Occupancy by Ownership in Bowling Green
Of the total 596 dwellings in Bowling Green, owner-occupied units account for 385 (64.6%), while renter-occupied units make up 211 (35.4%).
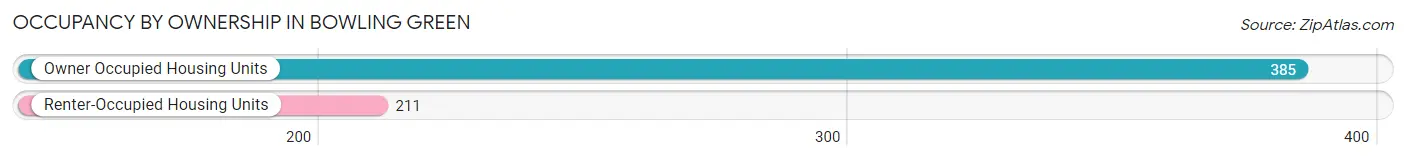
| Occupancy | # Housing Units | % Housing Units |
| Owner Occupied Housing Units | 385 | 64.6% |
| Renter-Occupied Housing Units | 211 | 35.4% |
| Total Occupied Housing Units | 596 | 100.0% |
Occupancy by Household Size in Bowling Green
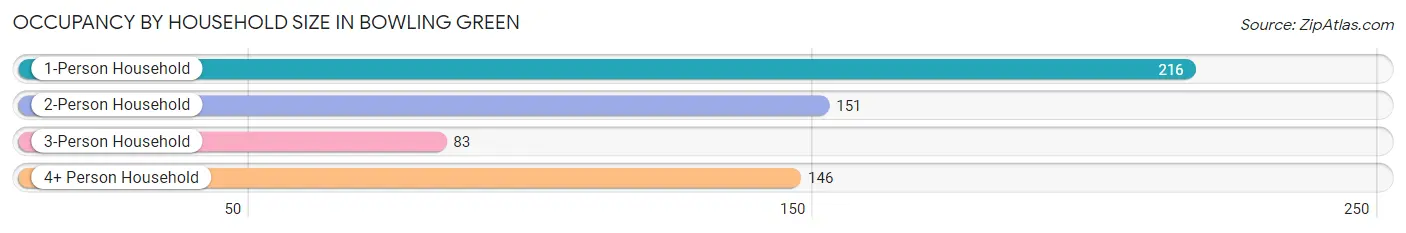
| Household Size | # Housing Units | % Housing Units |
| 1-Person Household | 216 | 36.2% |
| 2-Person Household | 151 | 25.3% |
| 3-Person Household | 83 | 13.9% |
| 4+ Person Household | 146 | 24.5% |
| Total Housing Units | 596 | 100.0% |
Occupancy by Ownership by Household Size in Bowling Green
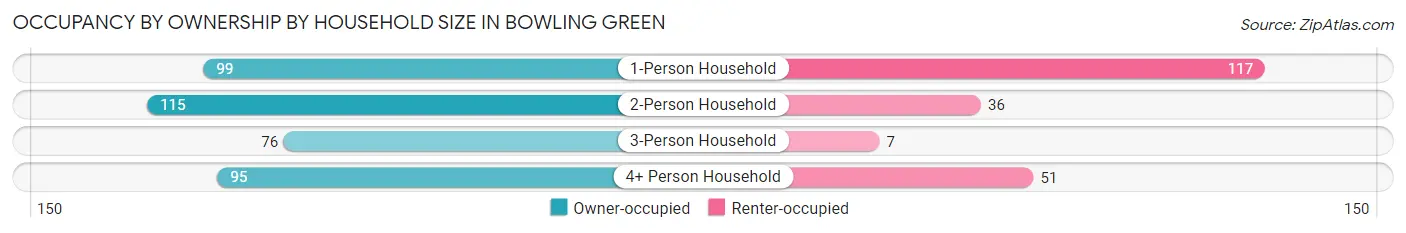
| Household Size | Owner-occupied | Renter-occupied |
| 1-Person Household | 99 (45.8%) | 117 (54.2%) |
| 2-Person Household | 115 (76.2%) | 36 (23.8%) |
| 3-Person Household | 76 (91.6%) | 7 (8.4%) |
| 4+ Person Household | 95 (65.1%) | 51 (34.9%) |
| Total Housing Units | 385 (64.6%) | 211 (35.4%) |
Occupancy by Educational Attainment in Bowling Green
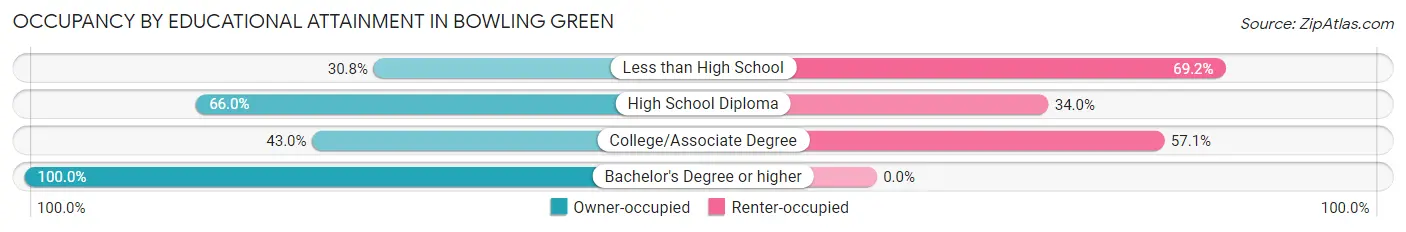
| Household Size | Owner-occupied | Renter-occupied |
| Less than High School | 20 (30.8%) | 45 (69.2%) |
| High School Diploma | 157 (66.0%) | 81 (34.0%) |
| College/Associate Degree | 64 (42.9%) | 85 (57.1%) |
| Bachelor's Degree or higher | 144 (100.0%) | 0 (0.0%) |
Occupancy by Age of Householder in Bowling Green
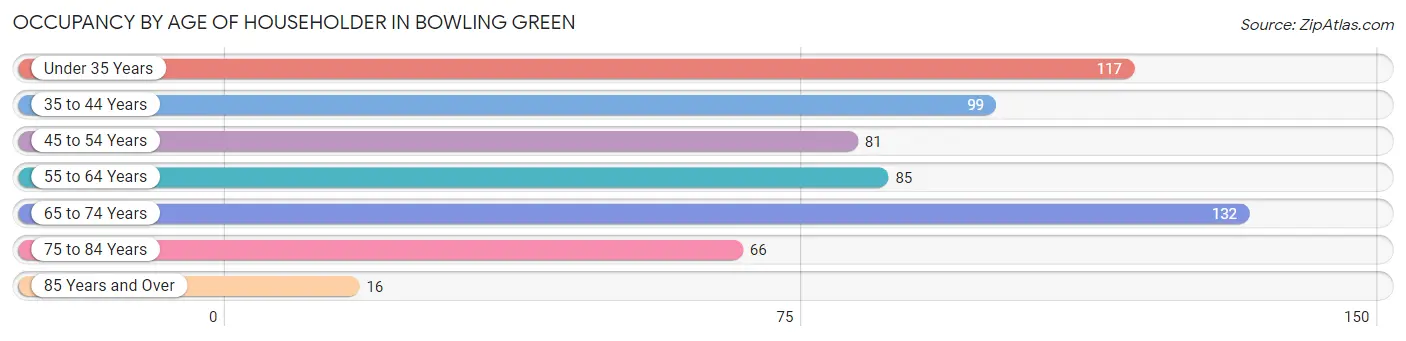
| Age Bracket | # Households | % Households |
| Under 35 Years | 117 | 19.6% |
| 35 to 44 Years | 99 | 16.6% |
| 45 to 54 Years | 81 | 13.6% |
| 55 to 64 Years | 85 | 14.3% |
| 65 to 74 Years | 132 | 22.2% |
| 75 to 84 Years | 66 | 11.1% |
| 85 Years and Over | 16 | 2.7% |
| Total | 596 | 100.0% |
Housing Finances in Bowling Green
Median Income by Occupancy in Bowling Green
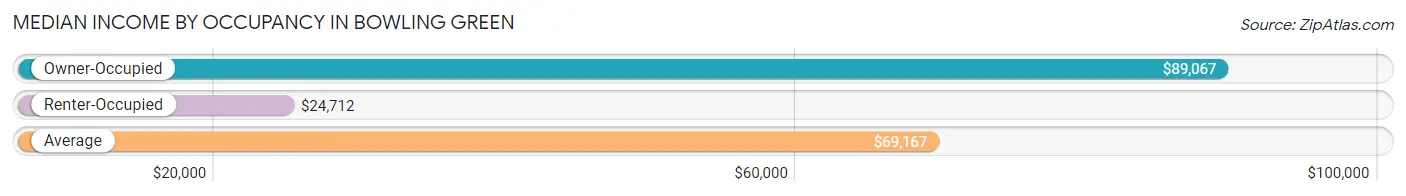
| Occupancy Type | # Households | Median Income |
| Owner-Occupied | 385 (64.6%) | $89,067 |
| Renter-Occupied | 211 (35.4%) | $24,712 |
| Average | 596 (100.0%) | $69,167 |
Occupancy by Householder Income Bracket in Bowling Green
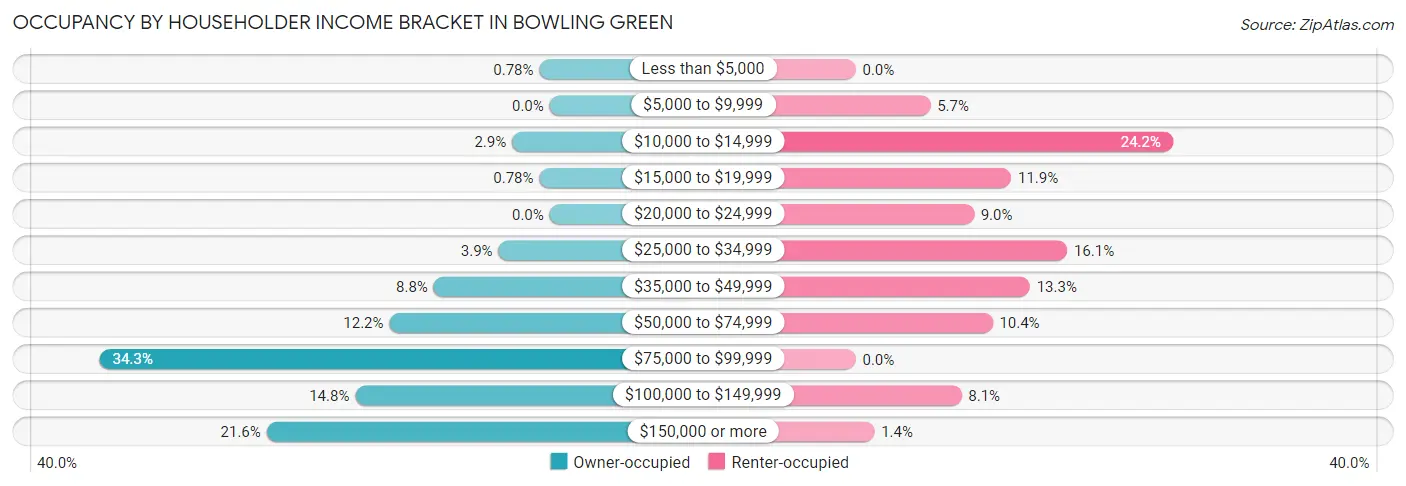
| Income Bracket | Owner-occupied | Renter-occupied |
| Less than $5,000 | 3 (0.8%) | 0 (0.0%) |
| $5,000 to $9,999 | 0 (0.0%) | 12 (5.7%) |
| $10,000 to $14,999 | 11 (2.9%) | 51 (24.2%) |
| $15,000 to $19,999 | 3 (0.8%) | 25 (11.8%) |
| $20,000 to $24,999 | 0 (0.0%) | 19 (9.0%) |
| $25,000 to $34,999 | 15 (3.9%) | 34 (16.1%) |
| $35,000 to $49,999 | 34 (8.8%) | 28 (13.3%) |
| $50,000 to $74,999 | 47 (12.2%) | 22 (10.4%) |
| $75,000 to $99,999 | 132 (34.3%) | 0 (0.0%) |
| $100,000 to $149,999 | 57 (14.8%) | 17 (8.1%) |
| $150,000 or more | 83 (21.6%) | 3 (1.4%) |
| Total | 385 (100.0%) | 211 (100.0%) |
Monthly Housing Cost Tiers in Bowling Green
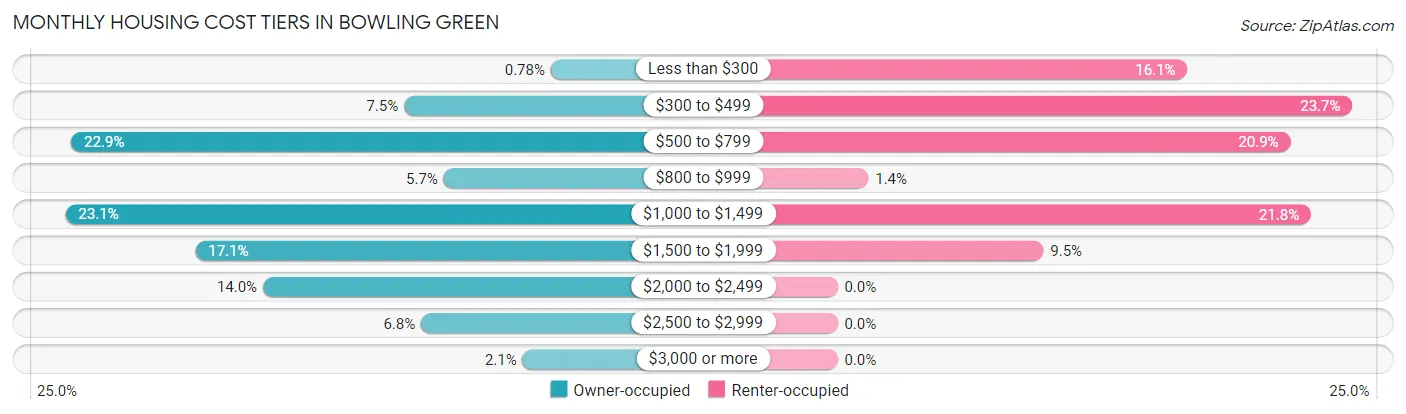
| Monthly Cost | Owner-occupied | Renter-occupied |
| Less than $300 | 3 (0.8%) | 34 (16.1%) |
| $300 to $499 | 29 (7.5%) | 50 (23.7%) |
| $500 to $799 | 88 (22.9%) | 44 (20.8%) |
| $800 to $999 | 22 (5.7%) | 3 (1.4%) |
| $1,000 to $1,499 | 89 (23.1%) | 46 (21.8%) |
| $1,500 to $1,999 | 66 (17.1%) | 20 (9.5%) |
| $2,000 to $2,499 | 54 (14.0%) | 0 (0.0%) |
| $2,500 to $2,999 | 26 (6.8%) | 0 (0.0%) |
| $3,000 or more | 8 (2.1%) | 0 (0.0%) |
| Total | 385 (100.0%) | 211 (100.0%) |
Physical Housing Characteristics in Bowling Green
Housing Structures in Bowling Green
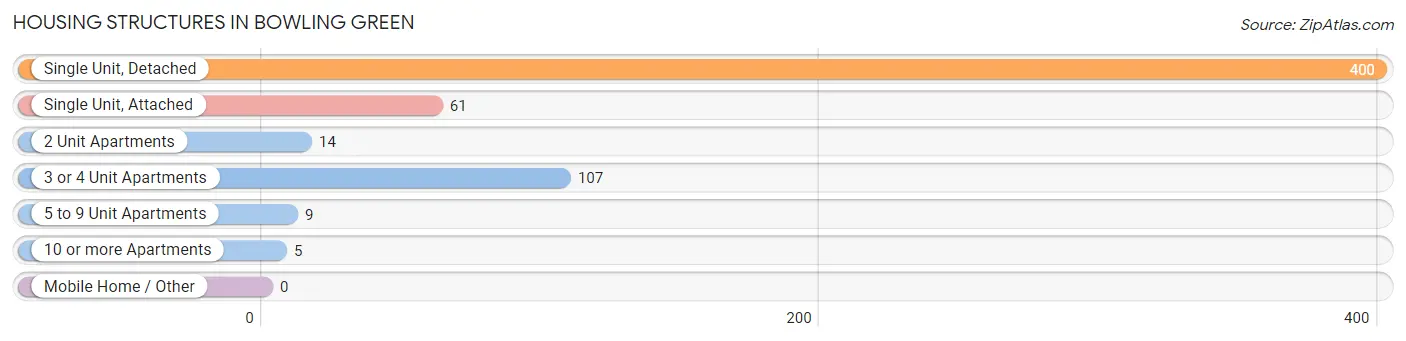
| Structure Type | # Housing Units | % Housing Units |
| Single Unit, Detached | 400 | 67.1% |
| Single Unit, Attached | 61 | 10.2% |
| 2 Unit Apartments | 14 | 2.4% |
| 3 or 4 Unit Apartments | 107 | 17.9% |
| 5 to 9 Unit Apartments | 9 | 1.5% |
| 10 or more Apartments | 5 | 0.8% |
| Mobile Home / Other | 0 | 0.0% |
| Total | 596 | 100.0% |
Housing Structures by Occupancy in Bowling Green
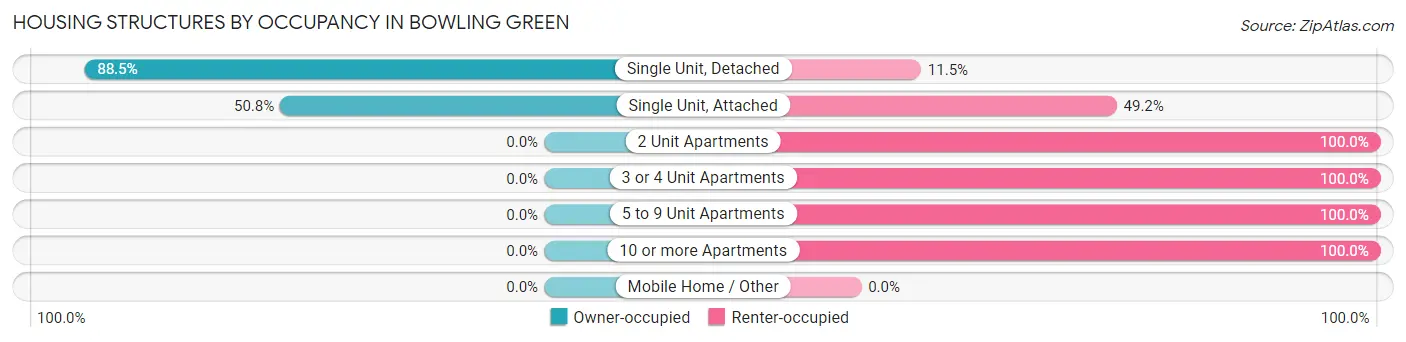
| Structure Type | Owner-occupied | Renter-occupied |
| Single Unit, Detached | 354 (88.5%) | 46 (11.5%) |
| Single Unit, Attached | 31 (50.8%) | 30 (49.2%) |
| 2 Unit Apartments | 0 (0.0%) | 14 (100.0%) |
| 3 or 4 Unit Apartments | 0 (0.0%) | 107 (100.0%) |
| 5 to 9 Unit Apartments | 0 (0.0%) | 9 (100.0%) |
| 10 or more Apartments | 0 (0.0%) | 5 (100.0%) |
| Mobile Home / Other | 0 (0.0%) | 0 (0.0%) |
| Total | 385 (64.6%) | 211 (35.4%) |
Housing Structures by Number of Rooms in Bowling Green
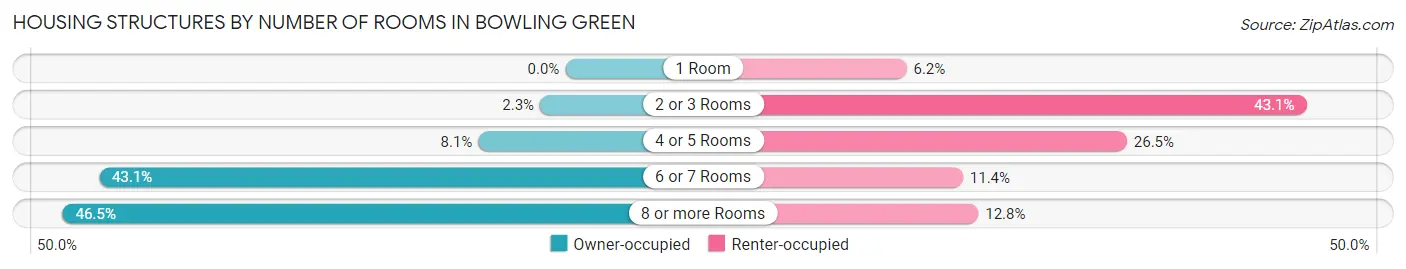
| Number of Rooms | Owner-occupied | Renter-occupied |
| 1 Room | 0 (0.0%) | 13 (6.2%) |
| 2 or 3 Rooms | 9 (2.3%) | 91 (43.1%) |
| 4 or 5 Rooms | 31 (8.1%) | 56 (26.5%) |
| 6 or 7 Rooms | 166 (43.1%) | 24 (11.4%) |
| 8 or more Rooms | 179 (46.5%) | 27 (12.8%) |
| Total | 385 (100.0%) | 211 (100.0%) |
Housing Structure by Heating Type in Bowling Green
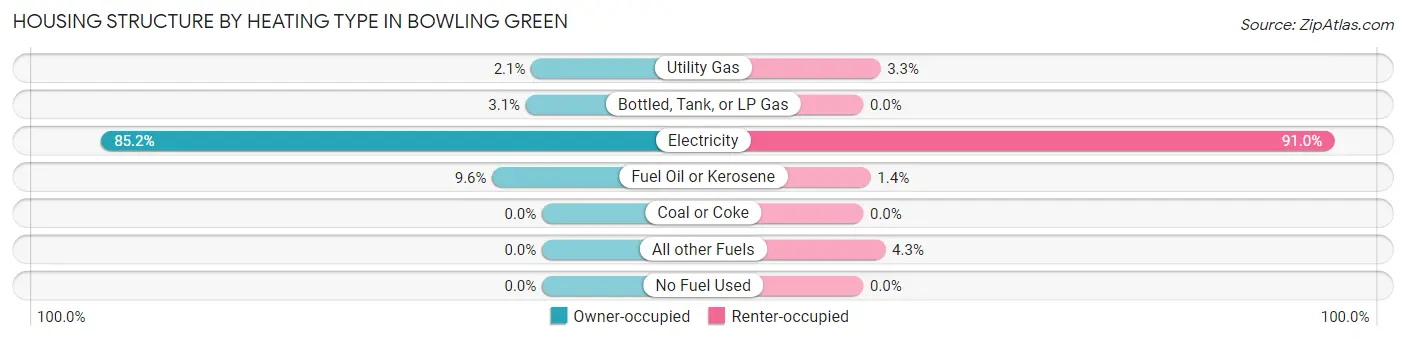
| Heating Type | Owner-occupied | Renter-occupied |
| Utility Gas | 8 (2.1%) | 7 (3.3%) |
| Bottled, Tank, or LP Gas | 12 (3.1%) | 0 (0.0%) |
| Electricity | 328 (85.2%) | 192 (91.0%) |
| Fuel Oil or Kerosene | 37 (9.6%) | 3 (1.4%) |
| Coal or Coke | 0 (0.0%) | 0 (0.0%) |
| All other Fuels | 0 (0.0%) | 9 (4.3%) |
| No Fuel Used | 0 (0.0%) | 0 (0.0%) |
| Total | 385 (100.0%) | 211 (100.0%) |
Household Vehicle Usage in Bowling Green
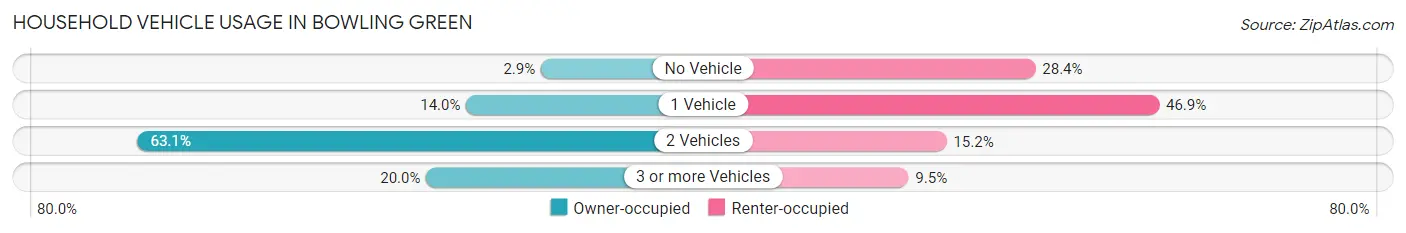
| Vehicles per Household | Owner-occupied | Renter-occupied |
| No Vehicle | 11 (2.9%) | 60 (28.4%) |
| 1 Vehicle | 54 (14.0%) | 99 (46.9%) |
| 2 Vehicles | 243 (63.1%) | 32 (15.2%) |
| 3 or more Vehicles | 77 (20.0%) | 20 (9.5%) |
| Total | 385 (100.0%) | 211 (100.0%) |
Real Estate & Mortgages in Bowling Green
Real Estate and Mortgage Overview in Bowling Green
| Characteristic | Without Mortgage | With Mortgage |
| Housing Units | 93 | 292 |
| Median Property Value | $282,100 | $283,300 |
| Median Household Income | $62,102 | $76 |
| Monthly Housing Costs | $548 | $8 |
| Real Estate Taxes | $1,862 | $0 |
Property Value by Mortgage Status in Bowling Green
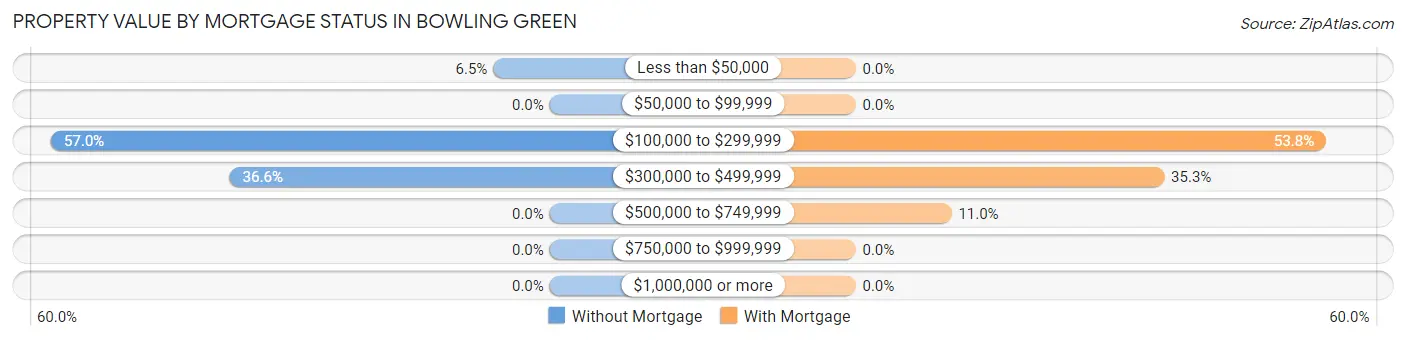
| Property Value | Without Mortgage | With Mortgage |
| Less than $50,000 | 6 (6.5%) | 0 (0.0%) |
| $50,000 to $99,999 | 0 (0.0%) | 0 (0.0%) |
| $100,000 to $299,999 | 53 (57.0%) | 157 (53.8%) |
| $300,000 to $499,999 | 34 (36.6%) | 103 (35.3%) |
| $500,000 to $749,999 | 0 (0.0%) | 32 (11.0%) |
| $750,000 to $999,999 | 0 (0.0%) | 0 (0.0%) |
| $1,000,000 or more | 0 (0.0%) | 0 (0.0%) |
| Total | 93 (100.0%) | 292 (100.0%) |
Household Income by Mortgage Status in Bowling Green
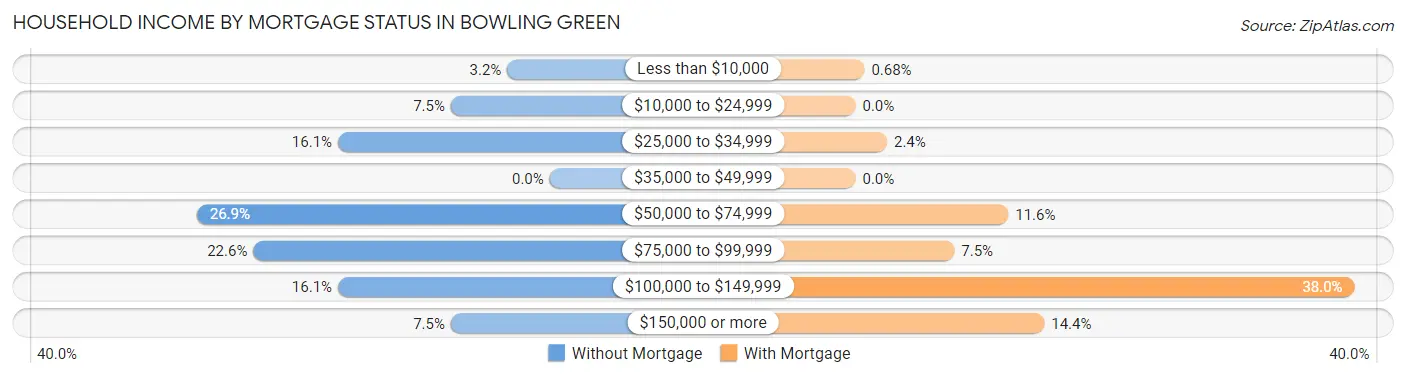
| Household Income | Without Mortgage | With Mortgage |
| Less than $10,000 | 3 (3.2%) | 2 (0.7%) |
| $10,000 to $24,999 | 7 (7.5%) | 0 (0.0%) |
| $25,000 to $34,999 | 15 (16.1%) | 7 (2.4%) |
| $35,000 to $49,999 | 0 (0.0%) | 0 (0.0%) |
| $50,000 to $74,999 | 25 (26.9%) | 34 (11.6%) |
| $75,000 to $99,999 | 21 (22.6%) | 22 (7.5%) |
| $100,000 to $149,999 | 15 (16.1%) | 111 (38.0%) |
| $150,000 or more | 7 (7.5%) | 42 (14.4%) |
| Total | 93 (100.0%) | 292 (100.0%) |
Property Value to Household Income Ratio in Bowling Green
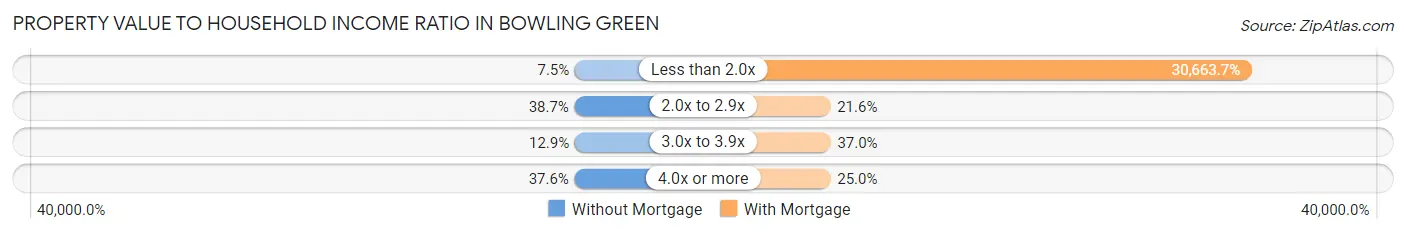
| Value-to-Income Ratio | Without Mortgage | With Mortgage |
| Less than 2.0x | 7 (7.5%) | 89,538 (30,663.7%) |
| 2.0x to 2.9x | 36 (38.7%) | 63 (21.6%) |
| 3.0x to 3.9x | 12 (12.9%) | 108 (37.0%) |
| 4.0x or more | 35 (37.6%) | 73 (25.0%) |
| Total | 93 (100.0%) | 292 (100.0%) |
Real Estate Taxes by Mortgage Status in Bowling Green
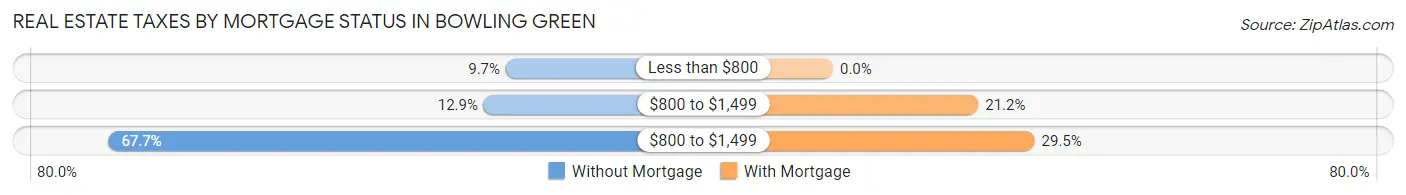
| Property Taxes | Without Mortgage | With Mortgage |
| Less than $800 | 9 (9.7%) | 0 (0.0%) |
| $800 to $1,499 | 12 (12.9%) | 62 (21.2%) |
| $800 to $1,499 | 63 (67.7%) | 86 (29.4%) |
| Total | 93 (100.0%) | 292 (100.0%) |
Health & Disability in Bowling Green
Health Insurance Coverage by Age in Bowling Green
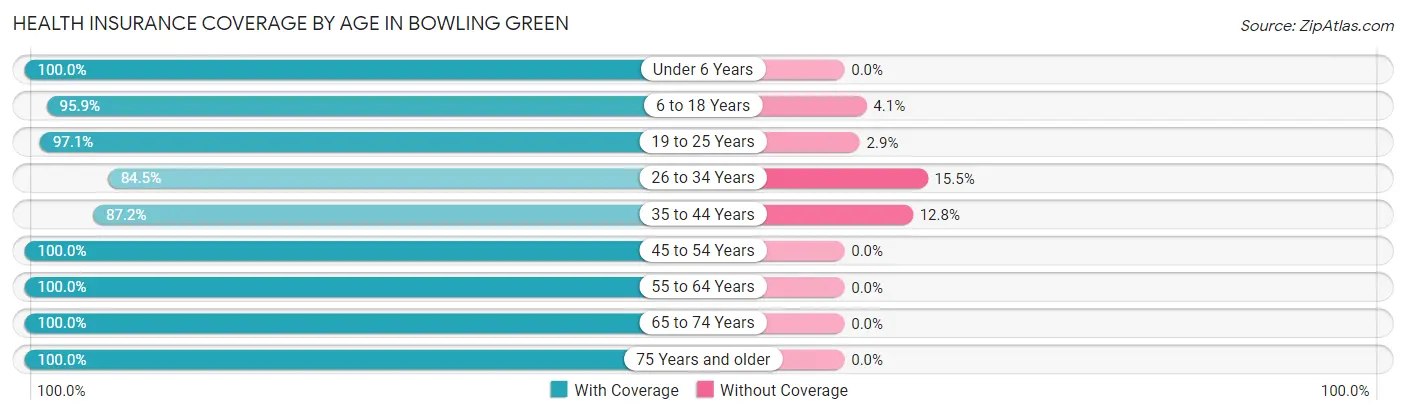
| Age Bracket | With Coverage | Without Coverage |
| Under 6 Years | 82 (100.0%) | 0 (0.0%) |
| 6 to 18 Years | 279 (95.9%) | 12 (4.1%) |
| 19 to 25 Years | 68 (97.1%) | 2 (2.9%) |
| 26 to 34 Years | 158 (84.5%) | 29 (15.5%) |
| 35 to 44 Years | 171 (87.2%) | 25 (12.8%) |
| 45 to 54 Years | 134 (100.0%) | 0 (0.0%) |
| 55 to 64 Years | 151 (100.0%) | 0 (0.0%) |
| 65 to 74 Years | 162 (100.0%) | 0 (0.0%) |
| 75 Years and older | 144 (100.0%) | 0 (0.0%) |
| Total | 1,349 (95.2%) | 68 (4.8%) |
Health Insurance Coverage by Citizenship Status in Bowling Green
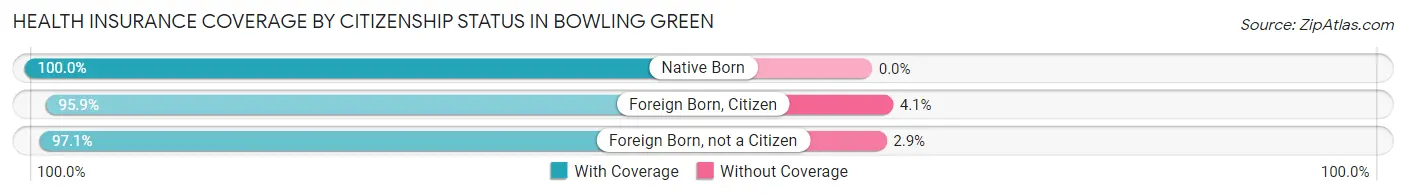
| Citizenship Status | With Coverage | Without Coverage |
| Native Born | 82 (100.0%) | 0 (0.0%) |
| Foreign Born, Citizen | 279 (95.9%) | 12 (4.1%) |
| Foreign Born, not a Citizen | 68 (97.1%) | 2 (2.9%) |
Health Insurance Coverage by Household Income in Bowling Green
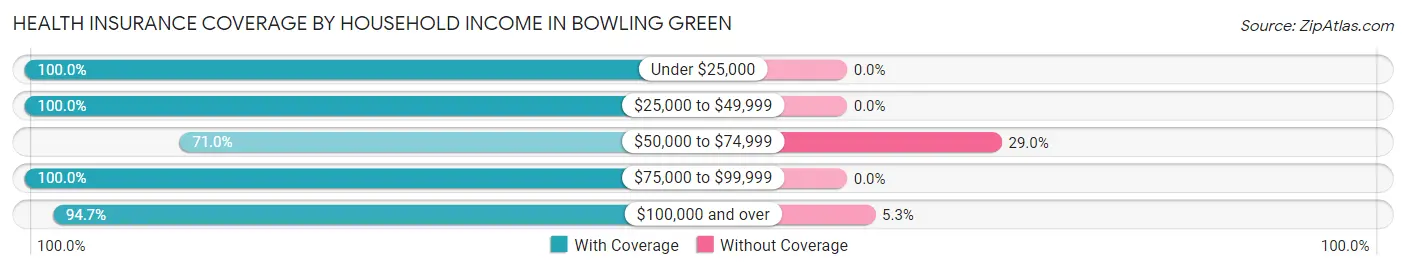
| Household Income | With Coverage | Without Coverage |
| Under $25,000 | 141 (100.0%) | 0 (0.0%) |
| $25,000 to $49,999 | 220 (100.0%) | 0 (0.0%) |
| $50,000 to $74,999 | 98 (71.0%) | 40 (29.0%) |
| $75,000 to $99,999 | 388 (100.0%) | 0 (0.0%) |
| $100,000 and over | 500 (94.7%) | 28 (5.3%) |
Public vs Private Health Insurance Coverage by Age in Bowling Green
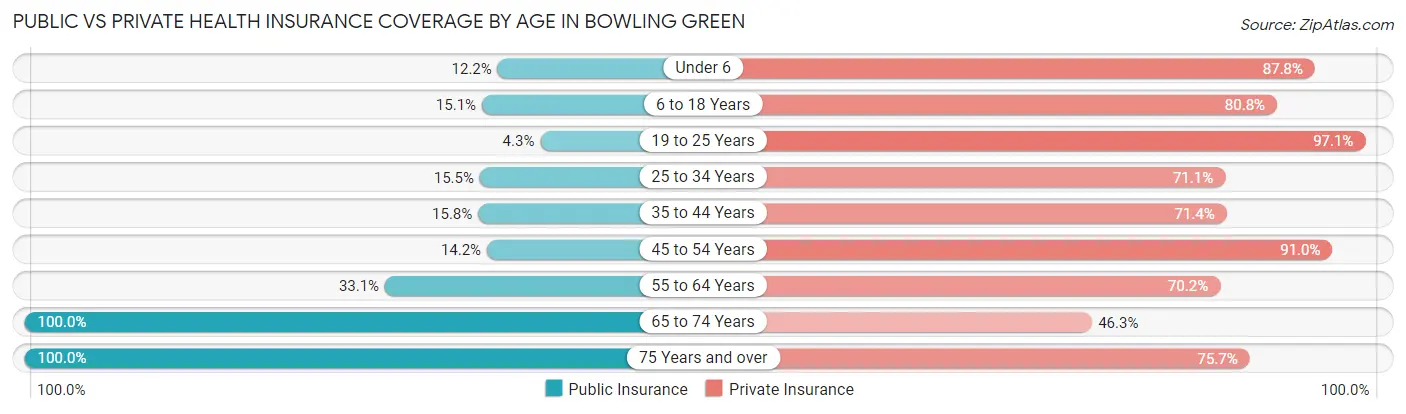
| Age Bracket | Public Insurance | Private Insurance |
| Under 6 | 10 (12.2%) | 72 (87.8%) |
| 6 to 18 Years | 44 (15.1%) | 235 (80.8%) |
| 19 to 25 Years | 3 (4.3%) | 68 (97.1%) |
| 25 to 34 Years | 29 (15.5%) | 133 (71.1%) |
| 35 to 44 Years | 31 (15.8%) | 140 (71.4%) |
| 45 to 54 Years | 19 (14.2%) | 122 (91.0%) |
| 55 to 64 Years | 50 (33.1%) | 106 (70.2%) |
| 65 to 74 Years | 162 (100.0%) | 75 (46.3%) |
| 75 Years and over | 144 (100.0%) | 109 (75.7%) |
| Total | 492 (34.7%) | 1,060 (74.8%) |
Disability Status by Sex by Age in Bowling Green
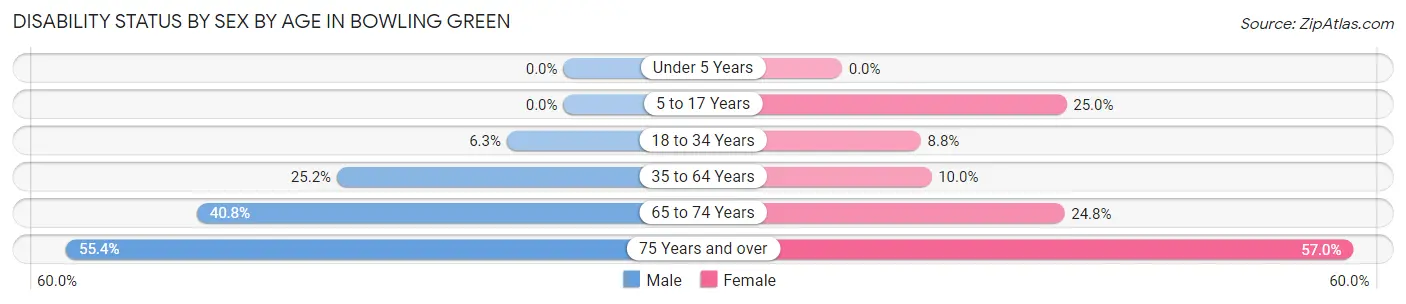
| Age Bracket | Male | Female |
| Under 5 Years | 0 (0.0%) | 0 (0.0%) |
| 5 to 17 Years | 0 (0.0%) | 41 (25.0%) |
| 18 to 34 Years | 8 (6.3%) | 13 (8.8%) |
| 35 to 64 Years | 58 (25.2%) | 25 (10.0%) |
| 65 to 74 Years | 20 (40.8%) | 28 (24.8%) |
| 75 Years and over | 36 (55.4%) | 45 (57.0%) |
Disability Class by Sex by Age in Bowling Green
Disability Class: Hearing Difficulty
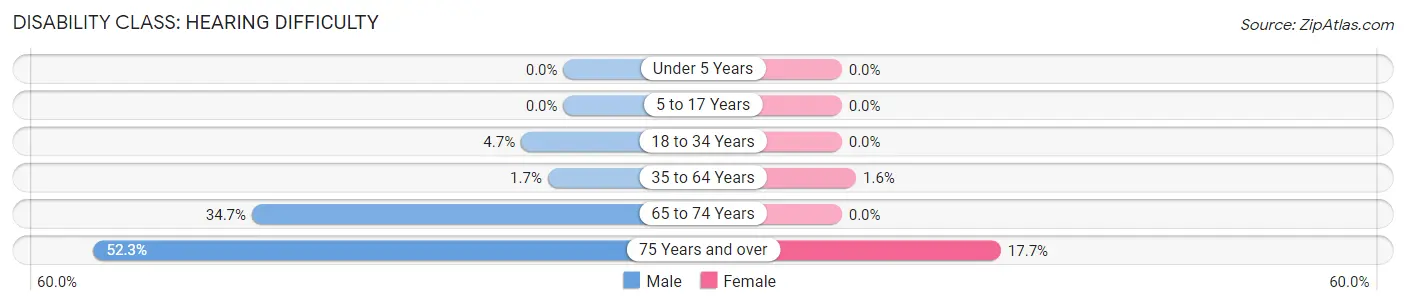
| Age Bracket | Male | Female |
| Under 5 Years | 0 (0.0%) | 0 (0.0%) |
| 5 to 17 Years | 0 (0.0%) | 0 (0.0%) |
| 18 to 34 Years | 6 (4.7%) | 0 (0.0%) |
| 35 to 64 Years | 4 (1.7%) | 4 (1.6%) |
| 65 to 74 Years | 17 (34.7%) | 0 (0.0%) |
| 75 Years and over | 34 (52.3%) | 14 (17.7%) |
Disability Class: Vision Difficulty
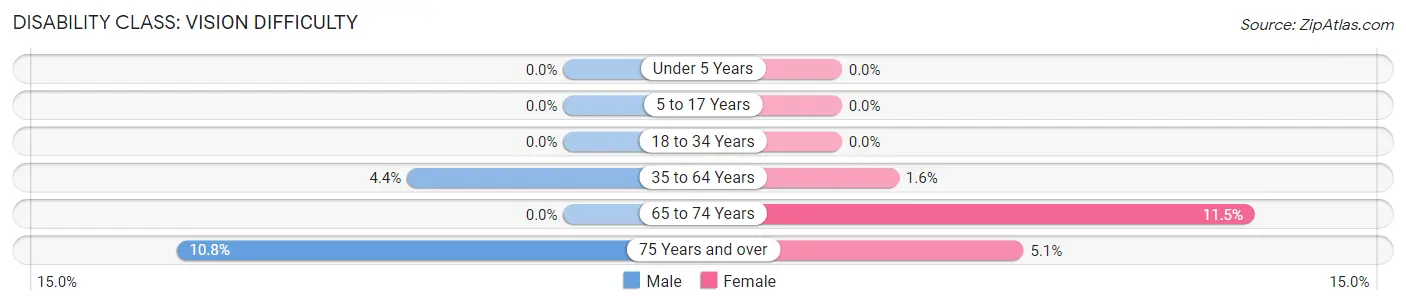
| Age Bracket | Male | Female |
| Under 5 Years | 0 (0.0%) | 0 (0.0%) |
| 5 to 17 Years | 0 (0.0%) | 0 (0.0%) |
| 18 to 34 Years | 0 (0.0%) | 0 (0.0%) |
| 35 to 64 Years | 10 (4.3%) | 4 (1.6%) |
| 65 to 74 Years | 0 (0.0%) | 13 (11.5%) |
| 75 Years and over | 7 (10.8%) | 4 (5.1%) |
Disability Class: Cognitive Difficulty
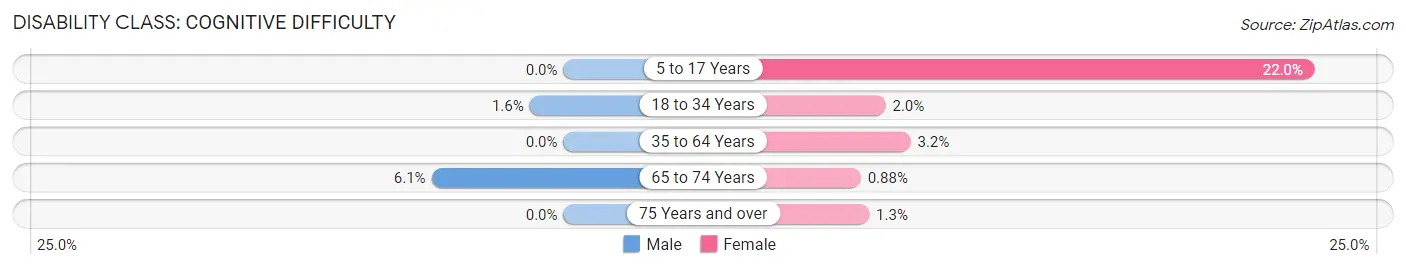
| Age Bracket | Male | Female |
| 5 to 17 Years | 0 (0.0%) | 36 (22.0%) |
| 18 to 34 Years | 2 (1.6%) | 3 (2.0%) |
| 35 to 64 Years | 0 (0.0%) | 8 (3.2%) |
| 65 to 74 Years | 3 (6.1%) | 1 (0.9%) |
| 75 Years and over | 0 (0.0%) | 1 (1.3%) |
Disability Class: Ambulatory Difficulty
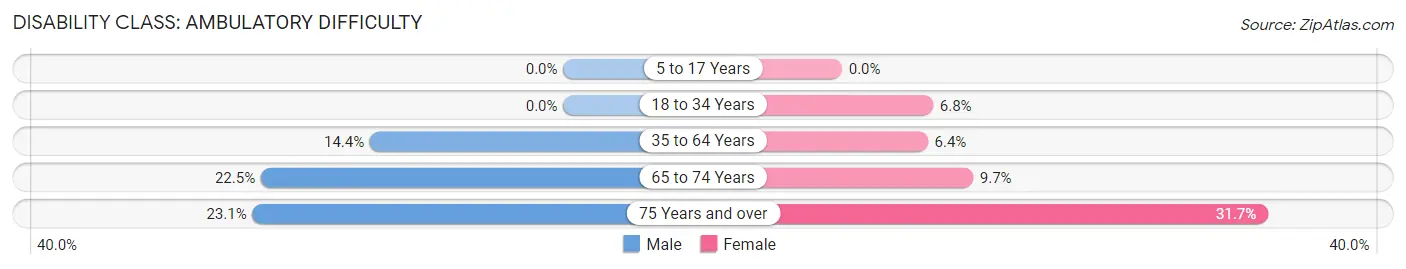
| Age Bracket | Male | Female |
| 5 to 17 Years | 0 (0.0%) | 0 (0.0%) |
| 18 to 34 Years | 0 (0.0%) | 10 (6.8%) |
| 35 to 64 Years | 33 (14.3%) | 16 (6.4%) |
| 65 to 74 Years | 11 (22.5%) | 11 (9.7%) |
| 75 Years and over | 15 (23.1%) | 25 (31.7%) |
Disability Class: Self-Care Difficulty
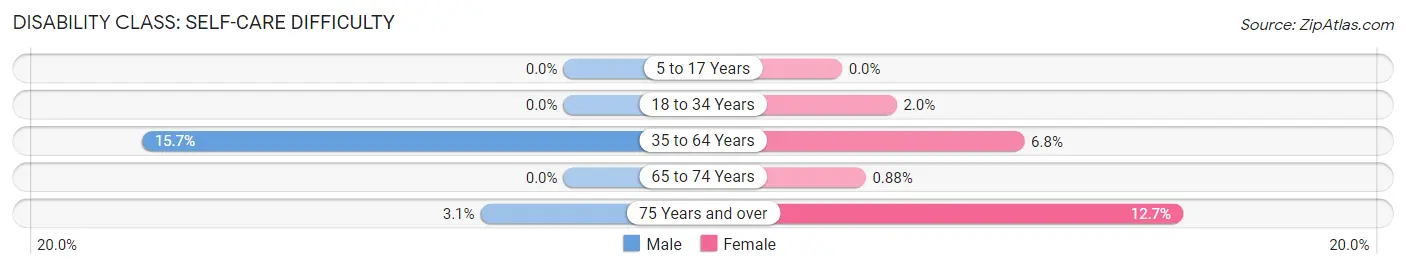
| Age Bracket | Male | Female |
| 5 to 17 Years | 0 (0.0%) | 0 (0.0%) |
| 18 to 34 Years | 0 (0.0%) | 3 (2.0%) |
| 35 to 64 Years | 36 (15.7%) | 17 (6.8%) |
| 65 to 74 Years | 0 (0.0%) | 1 (0.9%) |
| 75 Years and over | 2 (3.1%) | 10 (12.7%) |
Technology Access in Bowling Green
Computing Device Access in Bowling Green
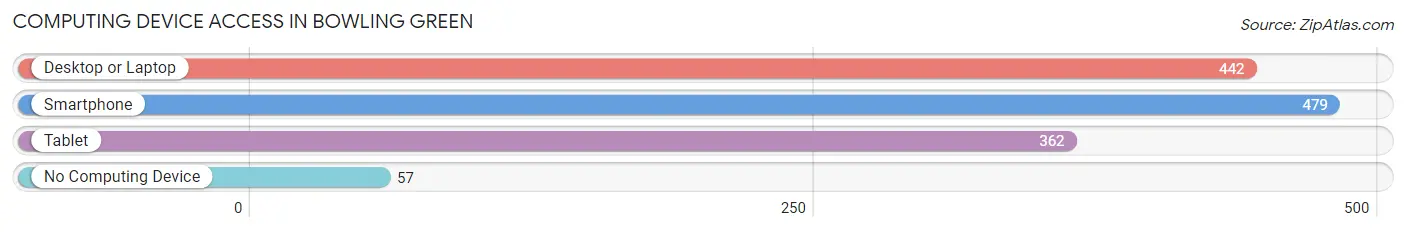
| Device Type | # Households | % Households |
| Desktop or Laptop | 442 | 74.2% |
| Smartphone | 479 | 80.4% |
| Tablet | 362 | 60.7% |
| No Computing Device | 57 | 9.6% |
| Total | 596 | 100.0% |
Internet Access in Bowling Green
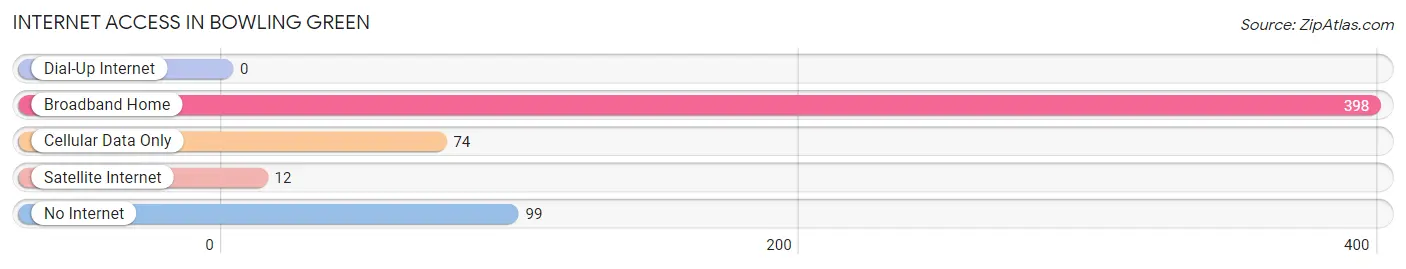
| Internet Type | # Households | % Households |
| Dial-Up Internet | 0 | 0.0% |
| Broadband Home | 398 | 66.8% |
| Cellular Data Only | 74 | 12.4% |
| Satellite Internet | 12 | 2.0% |
| No Internet | 99 | 16.6% |
| Total | 596 | 100.0% |
Bowling Green Summary
Bowling Green is a town located in Caroline County, Virginia, United States. The population was 1,111 at the 2010 census. It is the county seat of Caroline County.
History
The town of Bowling Green was established in 1786 and named after the Bowling Green Inn, which was located in the area. The inn was named after the popular sport of bowling, which was popular in the area at the time. The town was officially incorporated in 1819.
In the early 19th century, Bowling Green was a thriving port town, with a large number of ships coming in and out of the harbor. The town was also home to a number of businesses, including a tannery, a grist mill, and a sawmill.
During the Civil War, Bowling Green was the site of a major battle between Union and Confederate forces. The Battle of Bowling Green was fought on December 18, 1862, and resulted in a Confederate victory.
Geography
Bowling Green is located in the northern part of Caroline County, Virginia, at the intersection of U.S. Route 301 and State Route 207. It is approximately 40 miles north of Richmond and 60 miles south of Washington, D.C.
The town is situated on the banks of the Rappahannock River, which flows through the town and provides a natural border between Caroline County and King George County. The town is also located near the Mattaponi and Pamunkey Rivers, which flow into the Rappahannock.
The town is located in a rural area, with the nearest major city being Fredericksburg, which is approximately 25 miles to the south.
Economy
The economy of Bowling Green is largely based on agriculture and tourism. The town is home to a number of farms, which produce a variety of crops, including corn, soybeans, wheat, and hay.
The town is also home to a number of tourist attractions, including the Bowling Green Inn, which is listed on the National Register of Historic Places. The inn is a popular destination for visitors, who come to enjoy the historic atmosphere and the views of the Rappahannock River.
The town is also home to a number of small businesses, including restaurants, antique stores, and gift shops.
Demographics
As of the 2010 census, the population of Bowling Green was 1,111. The racial makeup of the town was 79.3% White, 17.2% African American, 0.7% Native American, 0.3% Asian, 0.1% Pacific Islander, and 2.4% from other races.
The median household income in Bowling Green was $41,250, and the median family income was $50,000. The per capita income was $20,945. About 11.2% of the population was below the poverty line.
Conclusion
Bowling Green is a small town located in Caroline County, Virginia. The town has a long history, dating back to the 18th century, and is home to a number of historic sites and tourist attractions. The economy of the town is largely based on agriculture and tourism, and the town is home to a number of small businesses. The population of Bowling Green is 1,111, and the median household income is $41,250.
Common Questions
What is Per Capita Income in Bowling Green?
Per Capita income in Bowling Green is $34,738.
What is the Median Family Income in Bowling Green?
Median Family Income in Bowling Green is $89,437.
What is the Median Household income in Bowling Green?
Median Household Income in Bowling Green is $69,167.
What is Income or Wage Gap in Bowling Green?
Income or Wage Gap in Bowling Green is 20.1%.
Women in Bowling Green earn 79.9 cents for every dollar earned by a man.
What is Inequality or Gini Index in Bowling Green?
Inequality or Gini Index in Bowling Green is 0.42.
What is the Total Population of Bowling Green?
Total Population of Bowling Green is 1,538.
What is the Total Male Population of Bowling Green?
Total Male Population of Bowling Green is 673.
What is the Total Female Population of Bowling Green?
Total Female Population of Bowling Green is 865.
What is the Ratio of Males per 100 Females in Bowling Green?
There are 77.80 Males per 100 Females in Bowling Green.
What is the Ratio of Females per 100 Males in Bowling Green?
There are 128.53 Females per 100 Males in Bowling Green.
What is the Median Population Age in Bowling Green?
Median Population Age in Bowling Green is 42.3 Years.
What is the Average Family Size in Bowling Green
Average Family Size in Bowling Green is 3.1 People.
What is the Average Household Size in Bowling Green
Average Household Size in Bowling Green is 2.4 People.
How Large is the Labor Force in Bowling Green?
There are 647 People in the Labor Forcein in Bowling Green.
What is the Percentage of People in the Labor Force in Bowling Green?
51.9% of People are in the Labor Force in Bowling Green.
What is the Unemployment Rate in Bowling Green?
Unemployment Rate in Bowling Green is 3.9%.