Burke Centre, VA Map & Demographics
Burke Centre Map
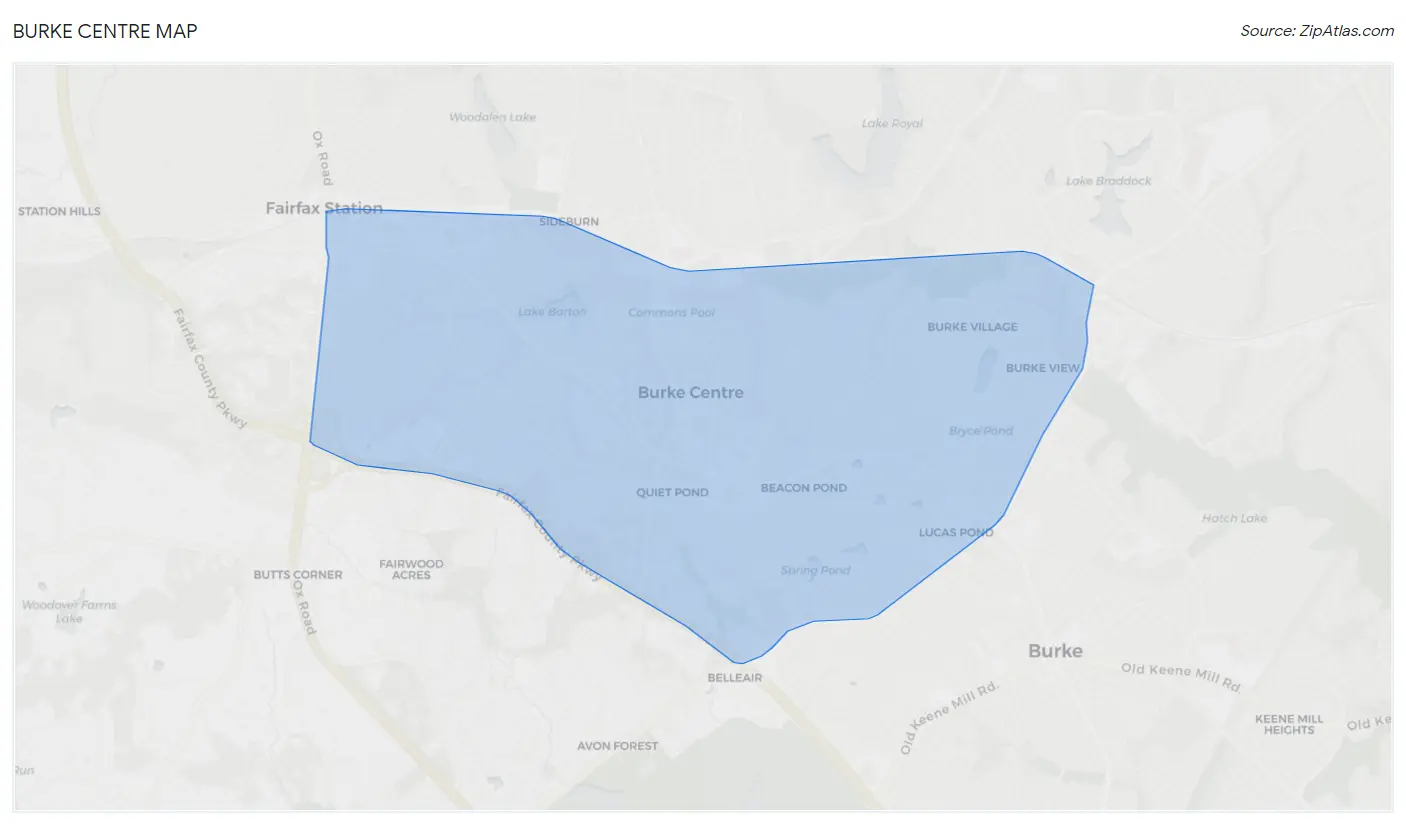
Burke Centre Overview
$63,423
PER CAPITA INCOME
$175,833
AVG FAMILY INCOME
$156,421
AVG HOUSEHOLD INCOME
42.8%
WAGE / INCOME GAP [ % ]
57.2¢/ $1
WAGE / INCOME GAP [ $ ]
0.38
INEQUALITY / GINI INDEX
17,926
TOTAL POPULATION
8,897
MALE POPULATION
9,029
FEMALE POPULATION
98.54
MALES / 100 FEMALES
101.48
FEMALES / 100 MALES
37.8
MEDIAN AGE
3.3
AVG FAMILY SIZE
2.9
AVG HOUSEHOLD SIZE
9,925
LABOR FORCE [ PEOPLE ]
69.1%
PERCENT IN LABOR FORCE
5.4%
UNEMPLOYMENT RATE
Income in Burke Centre
Income Overview in Burke Centre
Per Capita Income in Burke Centre is $63,423, while median incomes of families and households are $175,833 and $156,421 respectively.
| Characteristic | Number | Measure |
| Per Capita Income | 17,926 | $63,423 |
| Median Family Income | 4,542 | $175,833 |
| Mean Family Income | 4,542 | $204,958 |
| Median Household Income | 6,186 | $156,421 |
| Mean Household Income | 6,186 | $178,703 |
| Income Deficit | 4,542 | $0 |
| Wage / Income Gap (%) | 17,926 | 42.82% |
| Wage / Income Gap ($) | 17,926 | 57.18¢ per $1 |
| Gini / Inequality Index | 17,926 | 0.38 |
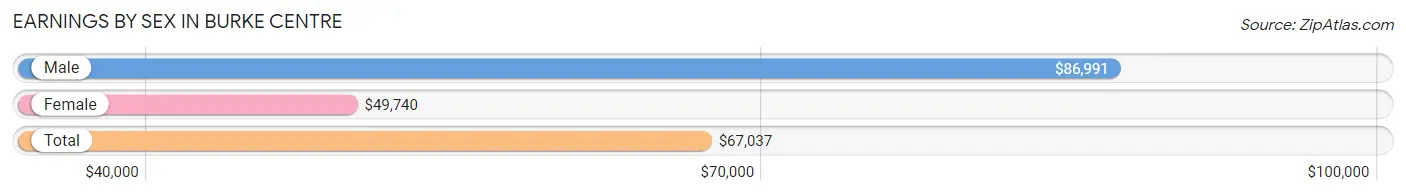
Earnings by Sex in Burke Centre
Average Earnings in Burke Centre are $67,037, $86,991 for men and $49,740 for women, a difference of 42.8%.
| Sex | Number | Average Earnings |
| Male | 5,305 (51.7%) | $86,991 |
| Female | 4,961 (48.3%) | $49,740 |
| Total | 10,266 (100.0%) | $67,037 |
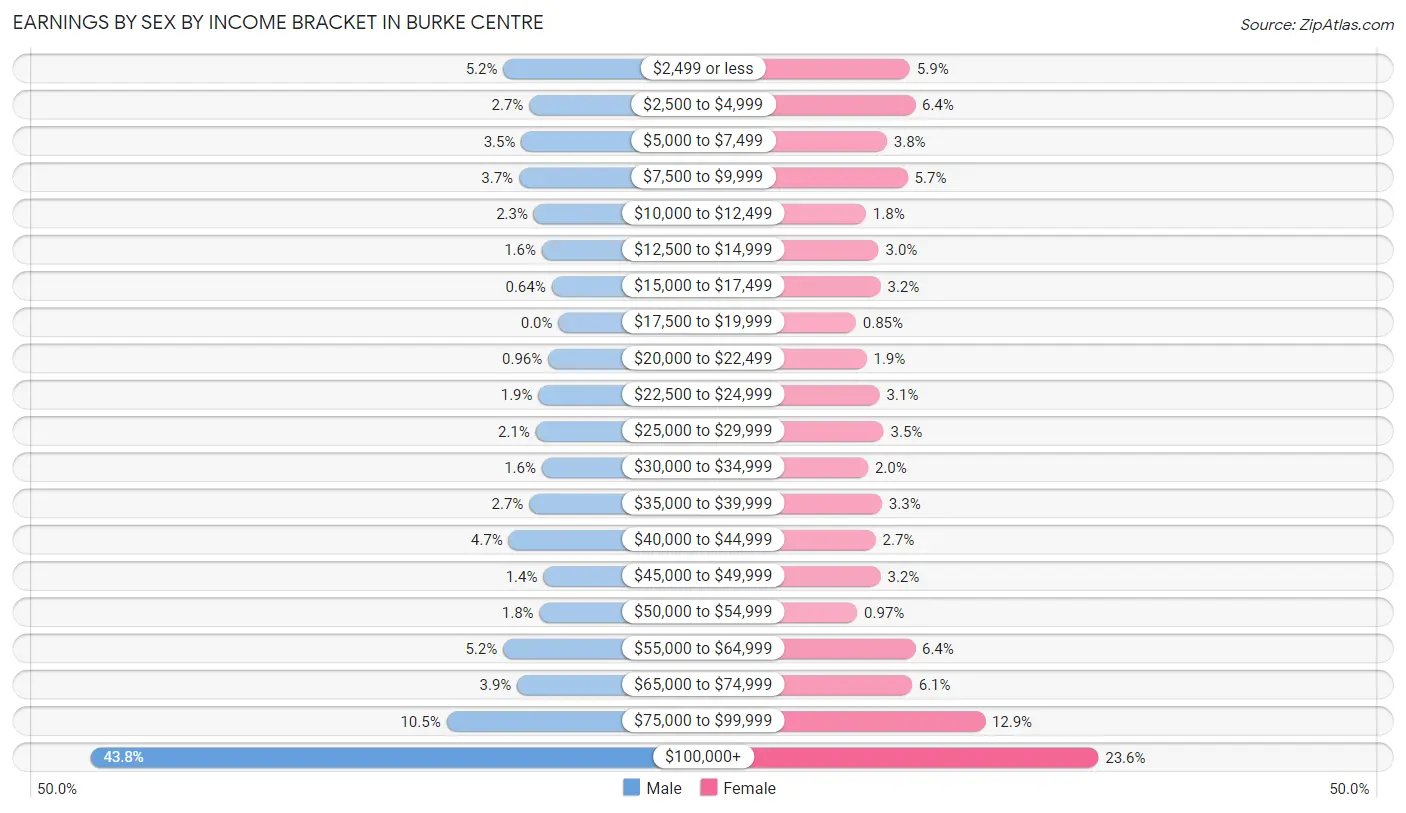
Earnings by Sex by Income Bracket in Burke Centre
The most common earnings brackets in Burke Centre are $100,000+ for men (2,325 | 43.8%) and $100,000+ for women (1,169 | 23.6%).
| Income | Male | Female |
| $2,499 or less | 274 (5.2%) | 293 (5.9%) |
| $2,500 to $4,999 | 145 (2.7%) | 317 (6.4%) |
| $5,000 to $7,499 | 184 (3.5%) | 186 (3.7%) |
| $7,500 to $9,999 | 196 (3.7%) | 283 (5.7%) |
| $10,000 to $12,499 | 122 (2.3%) | 89 (1.8%) |
| $12,500 to $14,999 | 82 (1.5%) | 148 (3.0%) |
| $15,000 to $17,499 | 34 (0.6%) | 157 (3.2%) |
| $17,500 to $19,999 | 0 (0.0%) | 42 (0.9%) |
| $20,000 to $22,499 | 51 (1.0%) | 92 (1.8%) |
| $22,500 to $24,999 | 99 (1.9%) | 153 (3.1%) |
| $25,000 to $29,999 | 113 (2.1%) | 171 (3.5%) |
| $30,000 to $34,999 | 82 (1.5%) | 98 (2.0%) |
| $35,000 to $39,999 | 145 (2.7%) | 163 (3.3%) |
| $40,000 to $44,999 | 248 (4.7%) | 134 (2.7%) |
| $45,000 to $49,999 | 75 (1.4%) | 157 (3.2%) |
| $50,000 to $54,999 | 94 (1.8%) | 48 (1.0%) |
| $55,000 to $64,999 | 275 (5.2%) | 317 (6.4%) |
| $65,000 to $74,999 | 205 (3.9%) | 302 (6.1%) |
| $75,000 to $99,999 | 556 (10.5%) | 642 (12.9%) |
| $100,000+ | 2,325 (43.8%) | 1,169 (23.6%) |
| Total | 5,305 (100.0%) | 4,961 (100.0%) |
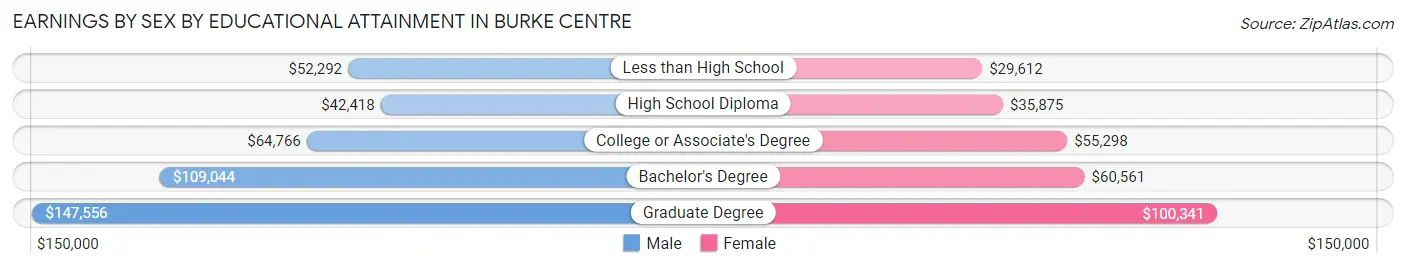
Earnings by Sex by Educational Attainment in Burke Centre
Average earnings in Burke Centre are $102,925 for men and $67,580 for women, a difference of 34.3%. Men with an educational attainment of graduate degree enjoy the highest average annual earnings of $147,556, while those with high school diploma education earn the least with $42,418. Women with an educational attainment of graduate degree earn the most with the average annual earnings of $100,341, while those with less than high school education have the smallest earnings of $29,612.
| Educational Attainment | Male Income | Female Income |
| Less than High School | $52,292 | $29,612 |
| High School Diploma | $42,418 | $35,875 |
| College or Associate's Degree | $64,766 | $55,298 |
| Bachelor's Degree | $109,044 | $60,561 |
| Graduate Degree | $147,556 | $100,341 |
| Total | $102,925 | $67,580 |
Family Income in Burke Centre
Family Income Brackets in Burke Centre
According to the Burke Centre family income data, there are 1,903 families falling into the $200,000+ income range, which is the most common income bracket and makes up 41.9% of all families. Conversely, the $10,000 to $14,999 income bracket is the least frequent group with only 14 families (0.3%) belonging to this category.
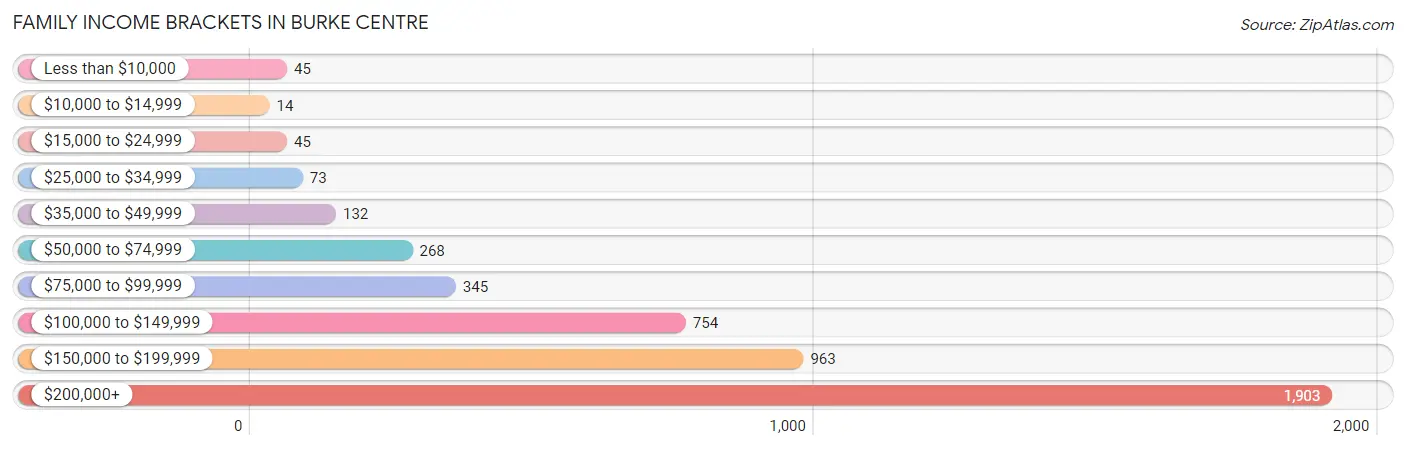
| Income Bracket | # Families | % Families |
| Less than $10,000 | 45 | 1.0% |
| $10,000 to $14,999 | 14 | 0.3% |
| $15,000 to $24,999 | 45 | 1.0% |
| $25,000 to $34,999 | 73 | 1.6% |
| $35,000 to $49,999 | 132 | 2.9% |
| $50,000 to $74,999 | 268 | 5.9% |
| $75,000 to $99,999 | 345 | 7.6% |
| $100,000 to $149,999 | 754 | 16.6% |
| $150,000 to $199,999 | 963 | 21.2% |
| $200,000+ | 1,903 | 41.9% |
Family Income by Famaliy Size in Burke Centre
7+ person families (55 | 1.2%) account for the highest median family income in Burke Centre with $250,001 per family, while 2-person families (1,748 | 38.5%) have the highest median income of $84,822 per family member.
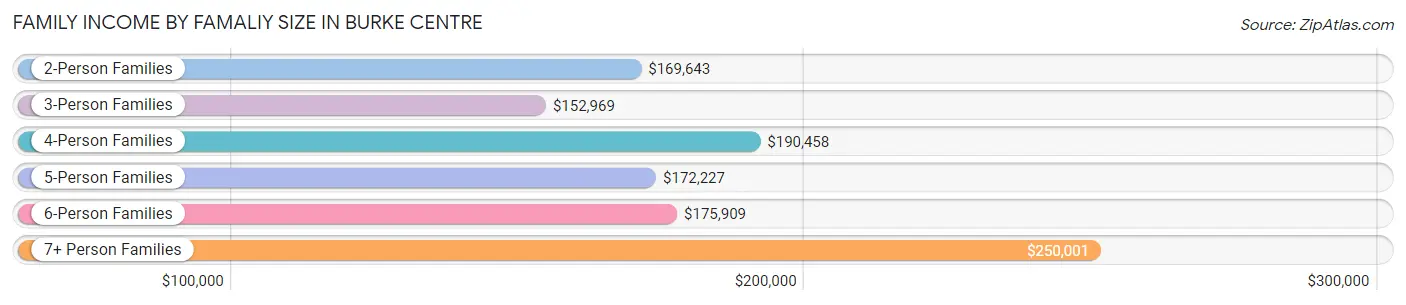
| Income Bracket | # Families | Median Income |
| 2-Person Families | 1,748 (38.5%) | $169,643 |
| 3-Person Families | 997 (22.0%) | $152,969 |
| 4-Person Families | 1,215 (26.8%) | $190,458 |
| 5-Person Families | 465 (10.2%) | $172,227 |
| 6-Person Families | 62 (1.4%) | $175,909 |
| 7+ Person Families | 55 (1.2%) | $250,001 |
| Total | 4,542 (100.0%) | $175,833 |
Family Income by Number of Earners in Burke Centre
The median family income in Burke Centre is $175,833, with families comprising 2 earners (2,198) having the highest median family income of $208,203, while families with 1 earner (1,096) have the lowest median family income of $151,429, accounting for 48.4% and 24.1% of families, respectively.
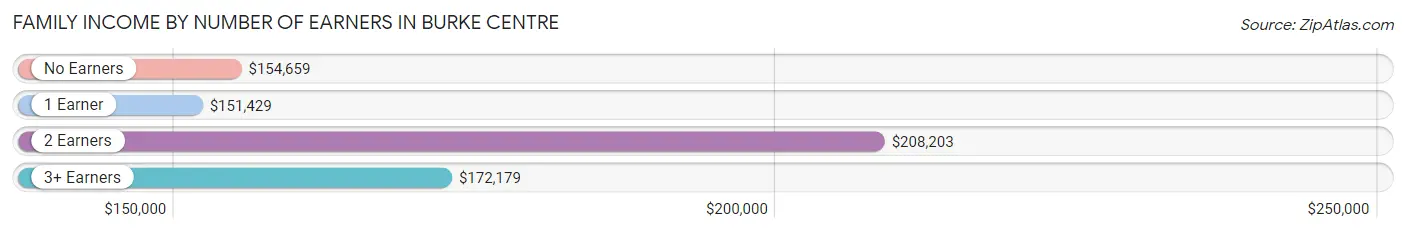
| Number of Earners | # Families | Median Income |
| No Earners | 461 (10.2%) | $154,659 |
| 1 Earner | 1,096 (24.1%) | $151,429 |
| 2 Earners | 2,198 (48.4%) | $208,203 |
| 3+ Earners | 787 (17.3%) | $172,179 |
| Total | 4,542 (100.0%) | $175,833 |
Household Income in Burke Centre
Household Income Brackets in Burke Centre
With 2,054 households falling in the category, the $200,000+ income range is the most frequent in Burke Centre, accounting for 33.2% of all households. In contrast, only 12 households (0.2%) fall into the $10,000 to $14,999 income bracket, making it the least populous group.
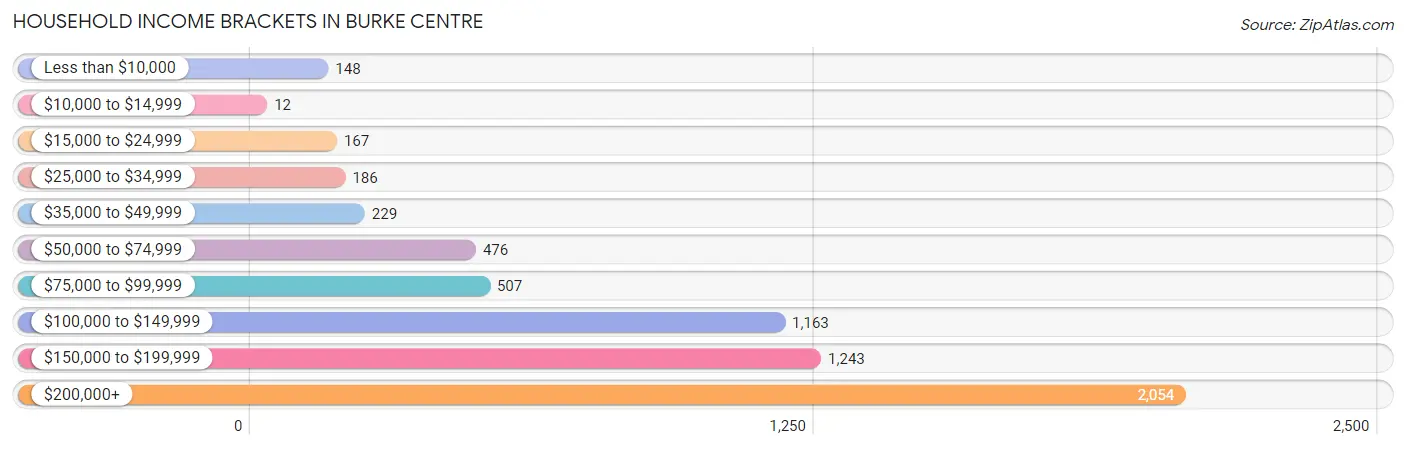
| Income Bracket | # Households | % Households |
| Less than $10,000 | 148 | 2.4% |
| $10,000 to $14,999 | 12 | 0.2% |
| $15,000 to $24,999 | 167 | 2.7% |
| $25,000 to $34,999 | 186 | 3.0% |
| $35,000 to $49,999 | 229 | 3.7% |
| $50,000 to $74,999 | 476 | 7.7% |
| $75,000 to $99,999 | 507 | 8.2% |
| $100,000 to $149,999 | 1,163 | 18.8% |
| $150,000 to $199,999 | 1,243 | 20.1% |
| $200,000+ | 2,054 | 33.2% |
Household Income by Householder Age in Burke Centre
The median household income in Burke Centre is $156,421, with the highest median household income of $179,167 found in the 45 to 64 years age bracket for the primary householder. A total of 2,340 households (37.8%) fall into this category. Meanwhile, the 15 to 24 years age bracket for the primary householder has the lowest median household income of $33,558, with 276 households (4.5%) in this group.
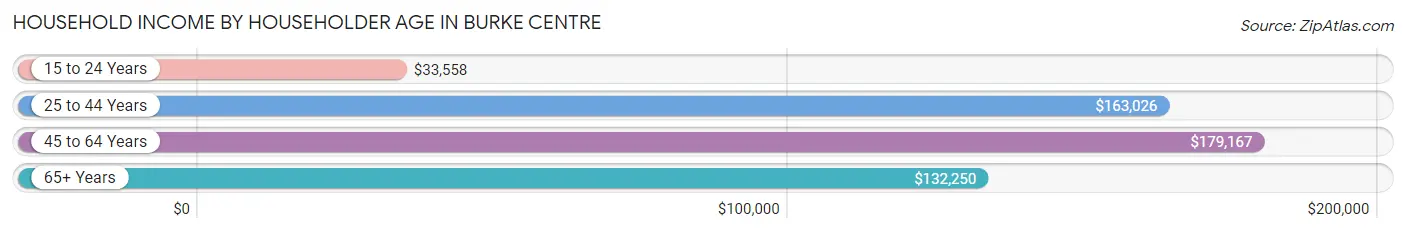
| Income Bracket | # Households | Median Income |
| 15 to 24 Years | 276 (4.5%) | $33,558 |
| 25 to 44 Years | 1,992 (32.2%) | $163,026 |
| 45 to 64 Years | 2,340 (37.8%) | $179,167 |
| 65+ Years | 1,578 (25.5%) | $132,250 |
| Total | 6,186 (100.0%) | $156,421 |
Poverty in Burke Centre
Income Below Poverty by Sex and Age in Burke Centre
With 4.7% poverty level for males and 5.8% for females among the residents of Burke Centre, 18 to 24 year old males and 18 to 24 year old females are the most vulnerable to poverty, with 233 males (19.3%) and 257 females (24.0%) in their respective age groups living below the poverty level.
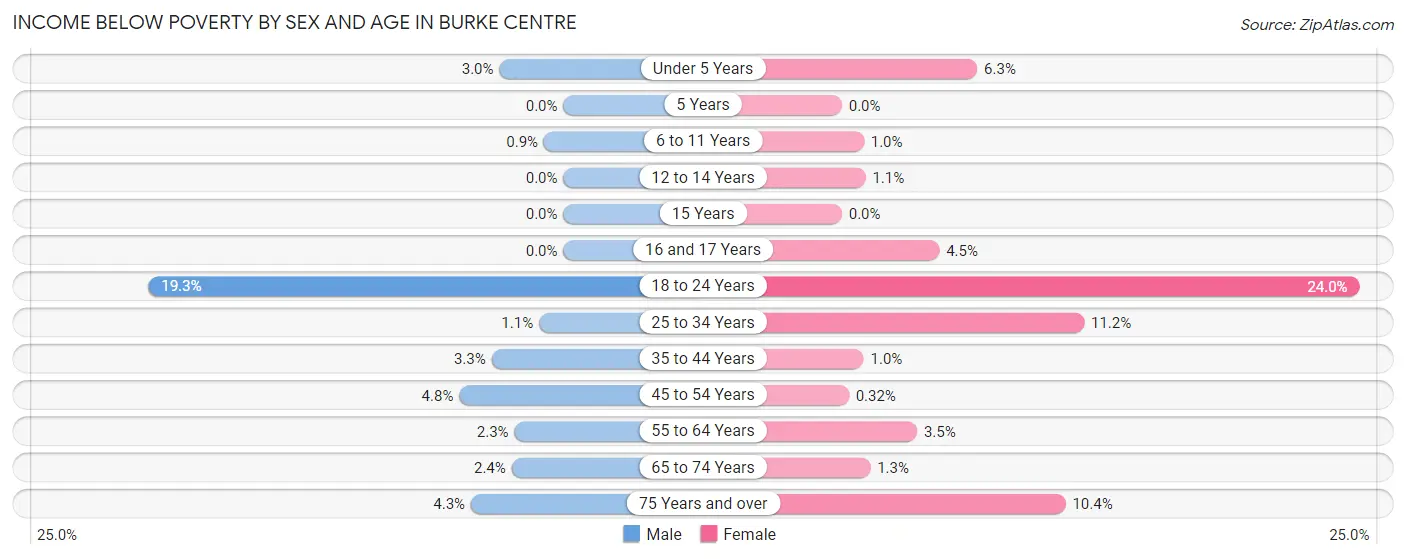
| Age Bracket | Male | Female |
| Under 5 Years | 14 (3.0%) | 24 (6.3%) |
| 5 Years | 0 (0.0%) | 0 (0.0%) |
| 6 to 11 Years | 8 (0.9%) | 7 (1.0%) |
| 12 to 14 Years | 0 (0.0%) | 4 (1.1%) |
| 15 Years | 0 (0.0%) | 0 (0.0%) |
| 16 and 17 Years | 0 (0.0%) | 10 (4.5%) |
| 18 to 24 Years | 233 (19.3%) | 257 (24.0%) |
| 25 to 34 Years | 10 (1.1%) | 84 (11.2%) |
| 35 to 44 Years | 49 (3.3%) | 15 (1.0%) |
| 45 to 54 Years | 47 (4.8%) | 4 (0.3%) |
| 55 to 64 Years | 24 (2.3%) | 40 (3.5%) |
| 65 to 74 Years | 20 (2.4%) | 12 (1.3%) |
| 75 Years and over | 12 (4.3%) | 57 (10.4%) |
| Total | 417 (4.7%) | 514 (5.8%) |
Income Above Poverty by Sex and Age in Burke Centre
According to the poverty statistics in Burke Centre, males aged 5 years and females aged 5 years are the age groups that are most secure financially, with 100.0% of males and 100.0% of females in these age groups living above the poverty line.
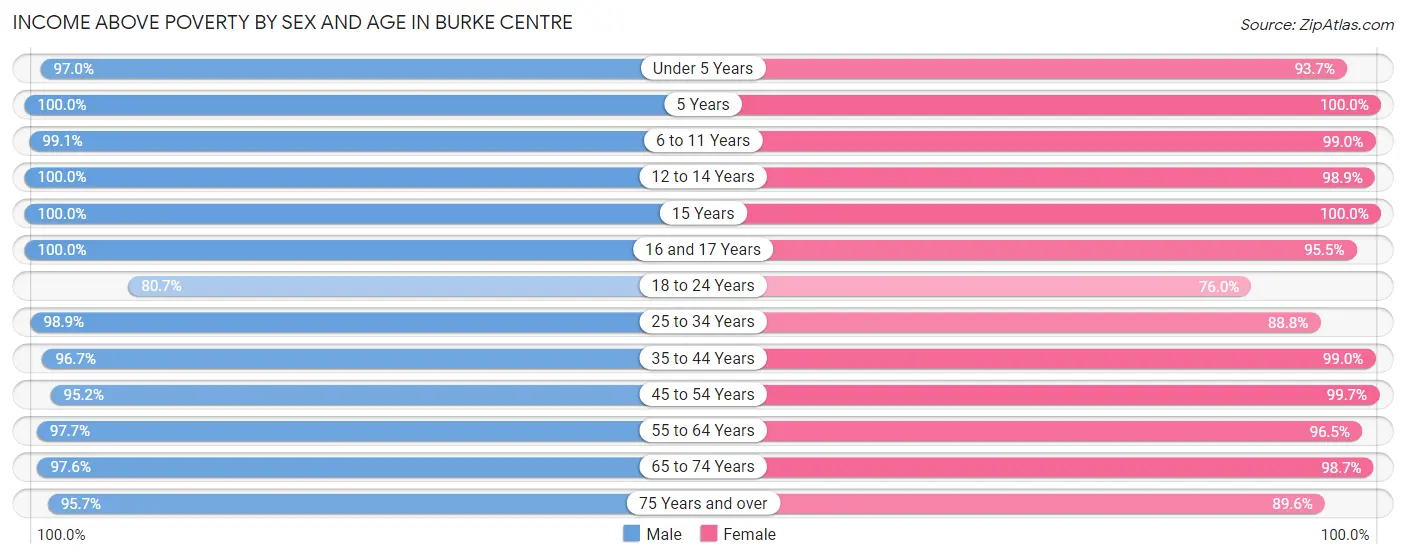
| Age Bracket | Male | Female |
| Under 5 Years | 458 (97.0%) | 358 (93.7%) |
| 5 Years | 187 (100.0%) | 41 (100.0%) |
| 6 to 11 Years | 876 (99.1%) | 678 (99.0%) |
| 12 to 14 Years | 324 (100.0%) | 360 (98.9%) |
| 15 Years | 142 (100.0%) | 74 (100.0%) |
| 16 and 17 Years | 125 (100.0%) | 211 (95.5%) |
| 18 to 24 Years | 977 (80.7%) | 813 (76.0%) |
| 25 to 34 Years | 878 (98.9%) | 663 (88.8%) |
| 35 to 44 Years | 1,424 (96.7%) | 1,467 (99.0%) |
| 45 to 54 Years | 926 (95.2%) | 1,260 (99.7%) |
| 55 to 64 Years | 1,033 (97.7%) | 1,107 (96.5%) |
| 65 to 74 Years | 815 (97.6%) | 899 (98.7%) |
| 75 Years and over | 268 (95.7%) | 492 (89.6%) |
| Total | 8,433 (95.3%) | 8,423 (94.3%) |
Income Below Poverty Among Married-Couple Families in Burke Centre
The poverty statistics for married-couple families in Burke Centre show that 2.0% or 76 of the total 3,738 families live below the poverty line. Families with no children have the highest poverty rate of 2.8%, comprising of 57 families. On the other hand, families with 3 or 4 children have the lowest poverty rate of 0.0%, which includes 0 families.
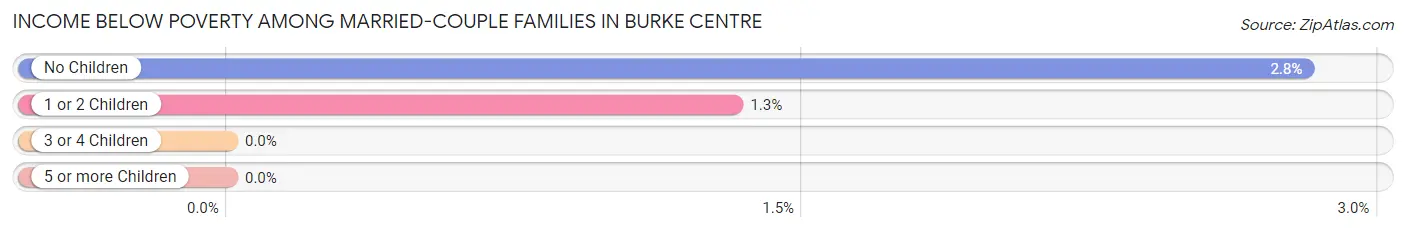
| Children | Above Poverty | Below Poverty |
| No Children | 1,972 (97.2%) | 57 (2.8%) |
| 1 or 2 Children | 1,423 (98.7%) | 19 (1.3%) |
| 3 or 4 Children | 267 (100.0%) | 0 (0.0%) |
| 5 or more Children | 0 (0.0%) | 0 (0.0%) |
| Total | 3,662 (98.0%) | 76 (2.0%) |
Income Below Poverty Among Single-Parent Households in Burke Centre
According to the poverty data in Burke Centre, 2.4% or 7 single-father households and 5.1% or 26 single-mother households are living below the poverty line. Among single-father households, those with no children have the highest poverty rate, with 7 households (7.0%) experiencing poverty. Likewise, among single-mother households, those with 1 or 2 children have the highest poverty rate, with 17 households (6.1%) falling below the poverty line.
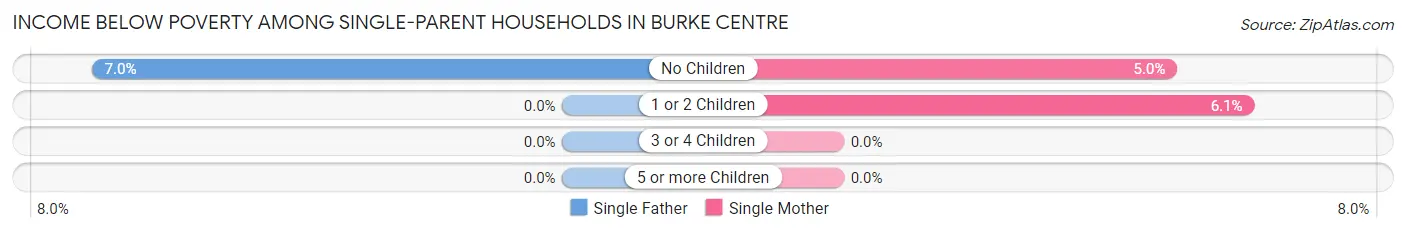
| Children | Single Father | Single Mother |
| No Children | 7 (7.0%) | 9 (5.0%) |
| 1 or 2 Children | 0 (0.0%) | 17 (6.1%) |
| 3 or 4 Children | 0 (0.0%) | 0 (0.0%) |
| 5 or more Children | 0 (0.0%) | 0 (0.0%) |
| Total | 7 (2.4%) | 26 (5.1%) |
Income Below Poverty Among Married-Couple vs Single-Parent Households in Burke Centre
The poverty data for Burke Centre shows that 76 of the married-couple family households (2.0%) and 33 of the single-parent households (4.1%) are living below the poverty level. Within the married-couple family households, those with no children have the highest poverty rate, with 57 households (2.8%) falling below the poverty line. Among the single-parent households, those with no children have the highest poverty rate, with 16 household (5.7%) living below poverty.
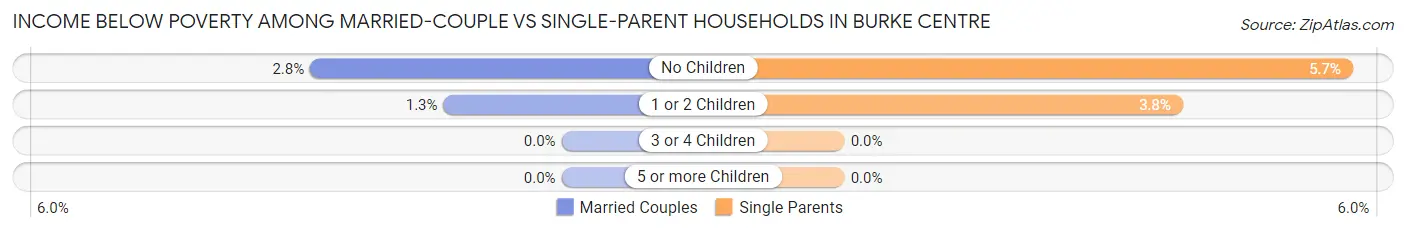
| Children | Married-Couple Families | Single-Parent Households |
| No Children | 57 (2.8%) | 16 (5.7%) |
| 1 or 2 Children | 19 (1.3%) | 17 (3.8%) |
| 3 or 4 Children | 0 (0.0%) | 0 (0.0%) |
| 5 or more Children | 0 (0.0%) | 0 (0.0%) |
| Total | 76 (2.0%) | 33 (4.1%) |
Race in Burke Centre
The most populous races in Burke Centre are White / Caucasian (11,016 | 61.5%), Asian (3,106 | 17.3%), and Hispanic or Latino (2,141 | 11.9%).
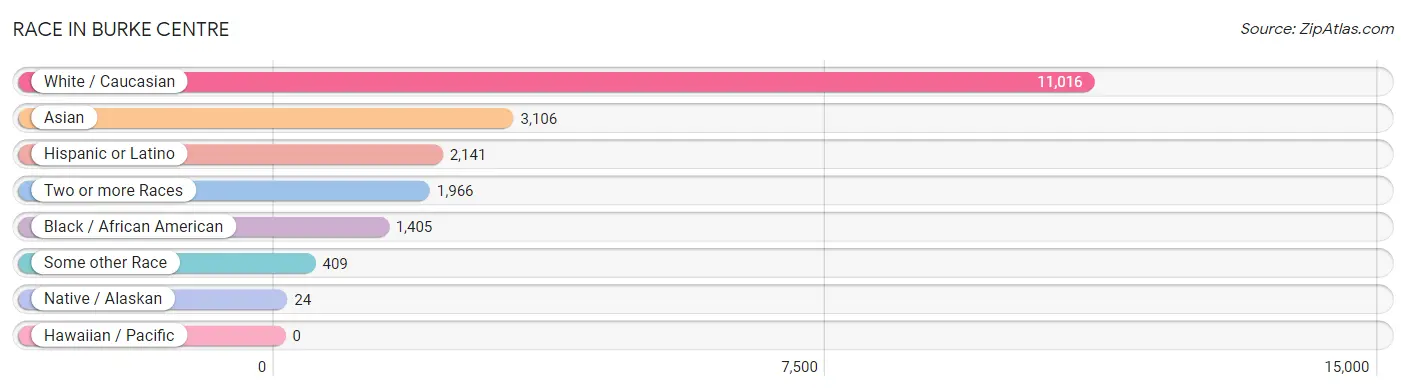
| Race | # Population | % Population |
| Asian | 3,106 | 17.3% |
| Black / African American | 1,405 | 7.8% |
| Hawaiian / Pacific | 0 | 0.0% |
| Hispanic or Latino | 2,141 | 11.9% |
| Native / Alaskan | 24 | 0.1% |
| White / Caucasian | 11,016 | 61.5% |
| Two or more Races | 1,966 | 11.0% |
| Some other Race | 409 | 2.3% |
| Total | 17,926 | 100.0% |
Ancestry in Burke Centre
The most populous ancestries reported in Burke Centre are German (2,736 | 15.3%), English (2,288 | 12.8%), Irish (2,125 | 11.8%), Italian (1,023 | 5.7%), and South American (965 | 5.4%), together accounting for 51.0% of all Burke Centre residents.
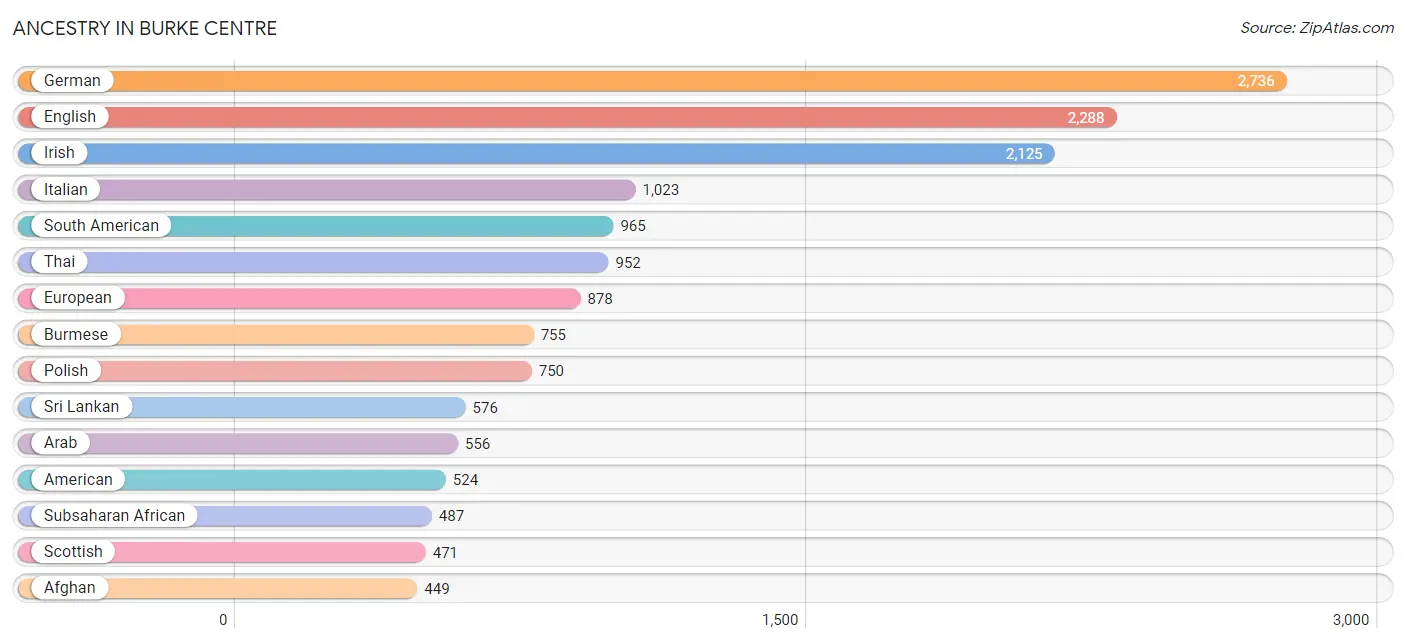
| Ancestry | # Population | % Population |
| Afghan | 449 | 2.5% |
| African | 65 | 0.4% |
| American | 524 | 2.9% |
| Arab | 556 | 3.1% |
| Armenian | 37 | 0.2% |
| Austrian | 67 | 0.4% |
| Belgian | 18 | 0.1% |
| Bhutanese | 158 | 0.9% |
| Bolivian | 381 | 2.1% |
| Brazilian | 7 | 0.0% |
| British | 245 | 1.4% |
| Bulgarian | 21 | 0.1% |
| Burmese | 755 | 4.2% |
| Cambodian | 5 | 0.0% |
| Canadian | 28 | 0.2% |
| Central American | 413 | 2.3% |
| Cherokee | 56 | 0.3% |
| Chickasaw | 22 | 0.1% |
| Chilean | 62 | 0.4% |
| Colombian | 51 | 0.3% |
| Costa Rican | 42 | 0.2% |
| Croatian | 17 | 0.1% |
| Cuban | 20 | 0.1% |
| Czech | 19 | 0.1% |
| Czechoslovakian | 41 | 0.2% |
| Danish | 29 | 0.2% |
| Dominican | 38 | 0.2% |
| Dutch | 159 | 0.9% |
| Eastern European | 95 | 0.5% |
| Ecuadorian | 24 | 0.1% |
| Egyptian | 64 | 0.4% |
| English | 2,288 | 12.8% |
| Ethiopian | 196 | 1.1% |
| European | 878 | 4.9% |
| Filipino | 25 | 0.1% |
| Finnish | 24 | 0.1% |
| French | 322 | 1.8% |
| French Canadian | 57 | 0.3% |
| German | 2,736 | 15.3% |
| German Russian | 18 | 0.1% |
| Ghanaian | 100 | 0.6% |
| Greek | 55 | 0.3% |
| Guamanian / Chamorro | 16 | 0.1% |
| Guatemalan | 83 | 0.5% |
| Haitian | 25 | 0.1% |
| Honduran | 31 | 0.2% |
| Hungarian | 53 | 0.3% |
| Indian (Asian) | 203 | 1.1% |
| Iranian | 78 | 0.4% |
| Iraqi | 60 | 0.3% |
| Irish | 2,125 | 11.8% |
| Iroquois | 19 | 0.1% |
| Italian | 1,023 | 5.7% |
| Jamaican | 72 | 0.4% |
| Japanese | 20 | 0.1% |
| Jordanian | 41 | 0.2% |
| Korean | 196 | 1.1% |
| Lebanese | 242 | 1.3% |
| Lithuanian | 62 | 0.4% |
| Malaysian | 26 | 0.2% |
| Mexican | 335 | 1.9% |
| Native Hawaiian | 22 | 0.1% |
| Nicaraguan | 12 | 0.1% |
| Nigerian | 29 | 0.2% |
| Norwegian | 201 | 1.1% |
| Pakistani | 97 | 0.5% |
| Paraguayan | 8 | 0.0% |
| Pennsylvania German | 35 | 0.2% |
| Peruvian | 433 | 2.4% |
| Polish | 750 | 4.2% |
| Portuguese | 24 | 0.1% |
| Pueblo | 5 | 0.0% |
| Puerto Rican | 236 | 1.3% |
| Romanian | 40 | 0.2% |
| Russian | 182 | 1.0% |
| Salvadoran | 245 | 1.4% |
| Scandinavian | 78 | 0.4% |
| Scotch-Irish | 215 | 1.2% |
| Scottish | 471 | 2.6% |
| Serbian | 36 | 0.2% |
| Sierra Leonean | 21 | 0.1% |
| Sioux | 23 | 0.1% |
| Slavic | 37 | 0.2% |
| Slovak | 93 | 0.5% |
| Slovene | 21 | 0.1% |
| Somali | 60 | 0.3% |
| South African | 13 | 0.1% |
| South American | 965 | 5.4% |
| Spaniard | 46 | 0.3% |
| Spanish | 13 | 0.1% |
| Sri Lankan | 576 | 3.2% |
| Subsaharan African | 487 | 2.7% |
| Swedish | 131 | 0.7% |
| Swiss | 27 | 0.2% |
| Thai | 952 | 5.3% |
| Trinidadian and Tobagonian | 7 | 0.0% |
| Turkish | 6 | 0.0% |
| Ukrainian | 134 | 0.7% |
| Venezuelan | 6 | 0.0% |
| Vietnamese | 35 | 0.2% |
| Welsh | 137 | 0.8% |
| West Indian | 25 | 0.1% | View All 102 Rows |
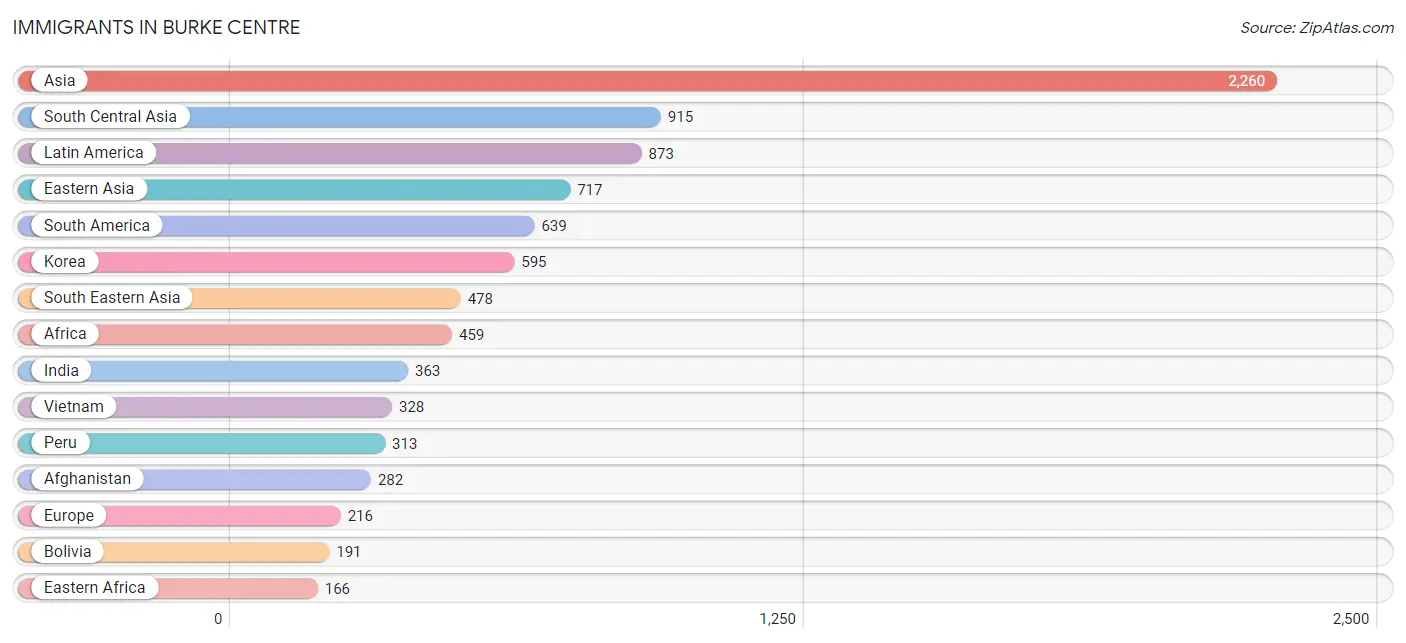
Immigrants in Burke Centre
The most numerous immigrant groups reported in Burke Centre came from Asia (2,260 | 12.6%), South Central Asia (915 | 5.1%), Latin America (873 | 4.9%), Eastern Asia (717 | 4.0%), and South America (639 | 3.6%), together accounting for 30.1% of all Burke Centre residents.
| Immigration Origin | # Population | % Population |
| Afghanistan | 282 | 1.6% |
| Africa | 459 | 2.6% |
| Argentina | 8 | 0.0% |
| Asia | 2,260 | 12.6% |
| Austria | 26 | 0.2% |
| Bangladesh | 26 | 0.2% |
| Belgium | 8 | 0.0% |
| Bolivia | 191 | 1.1% |
| Brazil | 14 | 0.1% |
| Bulgaria | 15 | 0.1% |
| Cambodia | 20 | 0.1% |
| Cameroon | 32 | 0.2% |
| Canada | 11 | 0.1% |
| Caribbean | 83 | 0.5% |
| Central America | 151 | 0.8% |
| Chile | 41 | 0.2% |
| China | 118 | 0.7% |
| Colombia | 40 | 0.2% |
| Costa Rica | 24 | 0.1% |
| Cuba | 11 | 0.1% |
| Eastern Africa | 166 | 0.9% |
| Eastern Asia | 717 | 4.0% |
| Eastern Europe | 52 | 0.3% |
| Ecuador | 6 | 0.0% |
| Egypt | 64 | 0.4% |
| El Salvador | 65 | 0.4% |
| Ethiopia | 149 | 0.8% |
| Europe | 216 | 1.2% |
| France | 17 | 0.1% |
| Germany | 42 | 0.2% |
| Ghana | 100 | 0.6% |
| Greece | 4 | 0.0% |
| Guatemala | 16 | 0.1% |
| Guyana | 18 | 0.1% |
| Honduras | 22 | 0.1% |
| Hong Kong | 16 | 0.1% |
| India | 363 | 2.0% |
| Indonesia | 23 | 0.1% |
| Iran | 69 | 0.4% |
| Iraq | 69 | 0.4% |
| Ireland | 8 | 0.0% |
| Israel | 6 | 0.0% |
| Italy | 3 | 0.0% |
| Jamaica | 72 | 0.4% |
| Jordan | 41 | 0.2% |
| Korea | 595 | 3.3% |
| Laos | 4 | 0.0% |
| Latin America | 873 | 4.9% |
| Lebanon | 15 | 0.1% |
| Mexico | 24 | 0.1% |
| Middle Africa | 32 | 0.2% |
| Morocco | 18 | 0.1% |
| Nepal | 45 | 0.3% |
| Nigeria | 6 | 0.0% |
| Northern Africa | 105 | 0.6% |
| Northern Europe | 52 | 0.3% |
| Pakistan | 130 | 0.7% |
| Peru | 313 | 1.8% |
| Philippines | 62 | 0.4% |
| Russia | 28 | 0.2% |
| Saudi Arabia | 19 | 0.1% |
| Sierra Leone | 37 | 0.2% |
| Somalia | 17 | 0.1% |
| South Africa | 13 | 0.1% |
| South America | 639 | 3.6% |
| South Central Asia | 915 | 5.1% |
| South Eastern Asia | 478 | 2.7% |
| Southern Europe | 19 | 0.1% |
| Spain | 12 | 0.1% |
| Sweden | 17 | 0.1% |
| Taiwan | 16 | 0.1% |
| Thailand | 41 | 0.2% |
| Vietnam | 328 | 1.8% |
| Western Africa | 143 | 0.8% |
| Western Asia | 150 | 0.8% |
| Western Europe | 93 | 0.5% | View All 76 Rows |
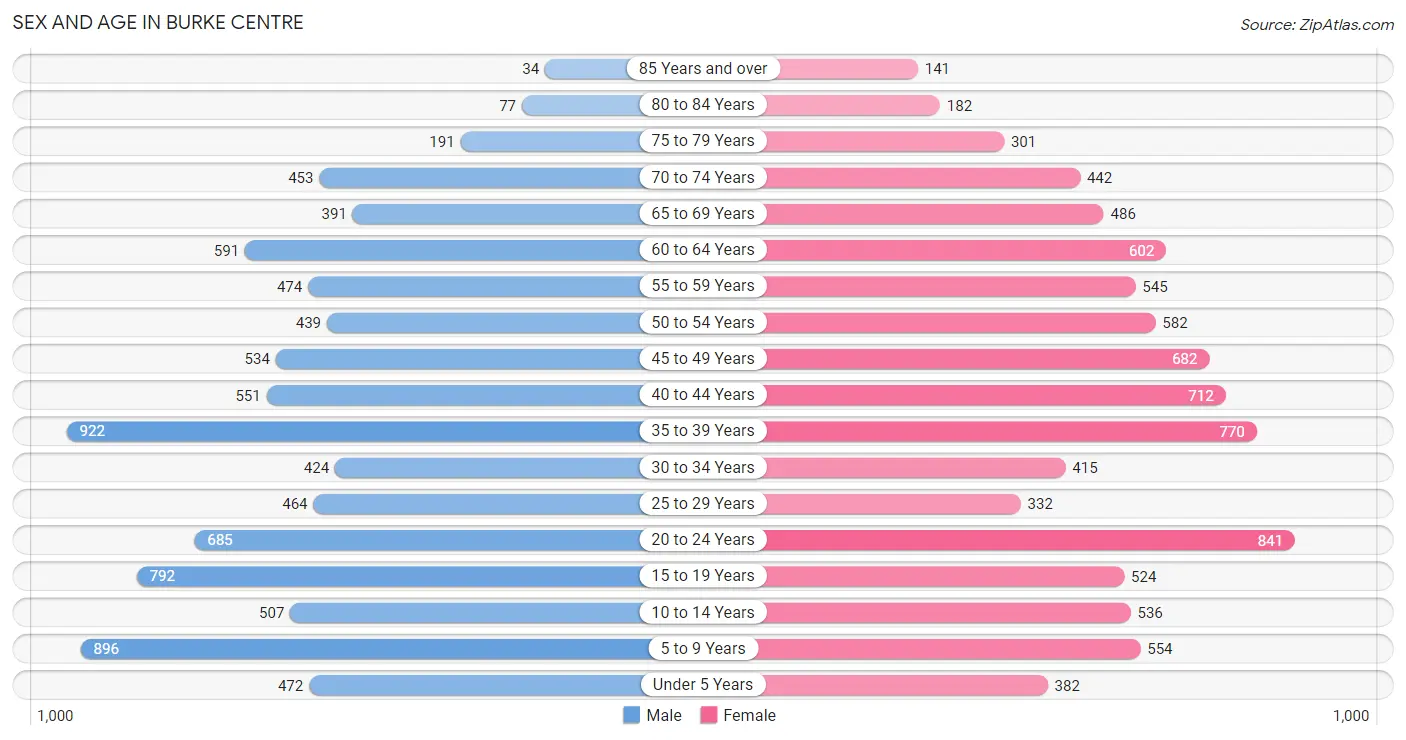
Sex and Age in Burke Centre
Sex and Age in Burke Centre
The most populous age groups in Burke Centre are 35 to 39 Years (922 | 10.4%) for men and 20 to 24 Years (841 | 9.3%) for women.
| Age Bracket | Male | Female |
| Under 5 Years | 472 (5.3%) | 382 (4.2%) |
| 5 to 9 Years | 896 (10.1%) | 554 (6.1%) |
| 10 to 14 Years | 507 (5.7%) | 536 (5.9%) |
| 15 to 19 Years | 792 (8.9%) | 524 (5.8%) |
| 20 to 24 Years | 685 (7.7%) | 841 (9.3%) |
| 25 to 29 Years | 464 (5.2%) | 332 (3.7%) |
| 30 to 34 Years | 424 (4.8%) | 415 (4.6%) |
| 35 to 39 Years | 922 (10.4%) | 770 (8.5%) |
| 40 to 44 Years | 551 (6.2%) | 712 (7.9%) |
| 45 to 49 Years | 534 (6.0%) | 682 (7.5%) |
| 50 to 54 Years | 439 (4.9%) | 582 (6.5%) |
| 55 to 59 Years | 474 (5.3%) | 545 (6.0%) |
| 60 to 64 Years | 591 (6.6%) | 602 (6.7%) |
| 65 to 69 Years | 391 (4.4%) | 486 (5.4%) |
| 70 to 74 Years | 453 (5.1%) | 442 (4.9%) |
| 75 to 79 Years | 191 (2.1%) | 301 (3.3%) |
| 80 to 84 Years | 77 (0.9%) | 182 (2.0%) |
| 85 Years and over | 34 (0.4%) | 141 (1.6%) |
| Total | 8,897 (100.0%) | 9,029 (100.0%) |
Families and Households in Burke Centre
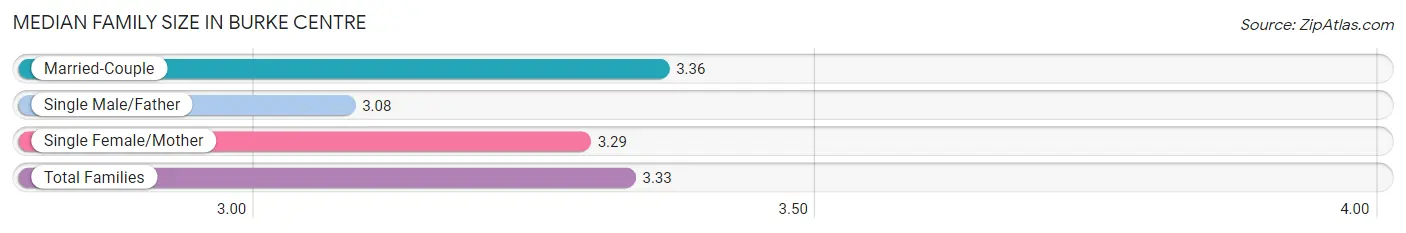
Median Family Size in Burke Centre
The median family size in Burke Centre is 3.33 persons per family, with married-couple families (3,738 | 82.3%) accounting for the largest median family size of 3.36 persons per family. On the other hand, single male/father families (292 | 6.4%) represent the smallest median family size with 3.08 persons per family.
| Family Type | # Families | Family Size |
| Married-Couple | 3,738 (82.3%) | 3.36 |
| Single Male/Father | 292 (6.4%) | 3.08 |
| Single Female/Mother | 512 (11.3%) | 3.29 |
| Total Families | 4,542 (100.0%) | 3.33 |
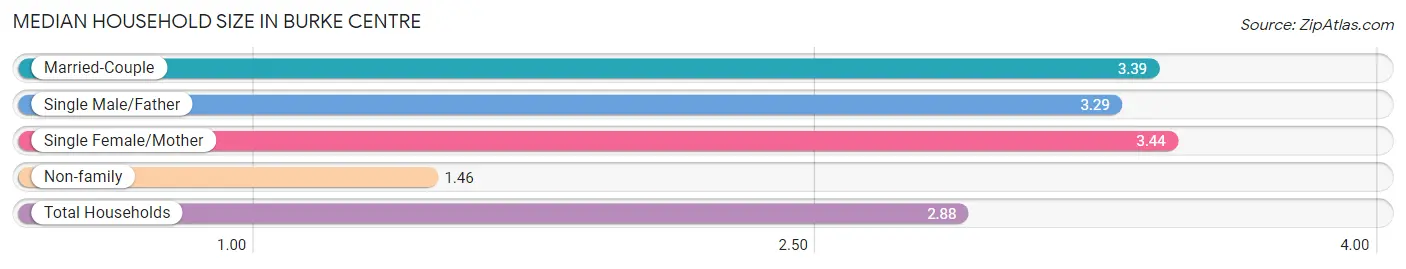
Median Household Size in Burke Centre
The median household size in Burke Centre is 2.88 persons per household, with single female/mother households (512 | 8.3%) accounting for the largest median household size of 3.44 persons per household. non-family households (1,644 | 26.6%) represent the smallest median household size with 1.46 persons per household.
| Household Type | # Households | Household Size |
| Married-Couple | 3,738 (60.4%) | 3.39 |
| Single Male/Father | 292 (4.7%) | 3.29 |
| Single Female/Mother | 512 (8.3%) | 3.44 |
| Non-family | 1,644 (26.6%) | 1.46 |
| Total Households | 6,186 (100.0%) | 2.88 |
Household Size by Marriage Status in Burke Centre
Out of a total of 6,186 households in Burke Centre, 4,542 (73.4%) are family households, while 1,644 (26.6%) are nonfamily households. The most numerous type of family households are 2-person households, comprising 1,688, and the most common type of nonfamily households are 1-person households, comprising 1,202.
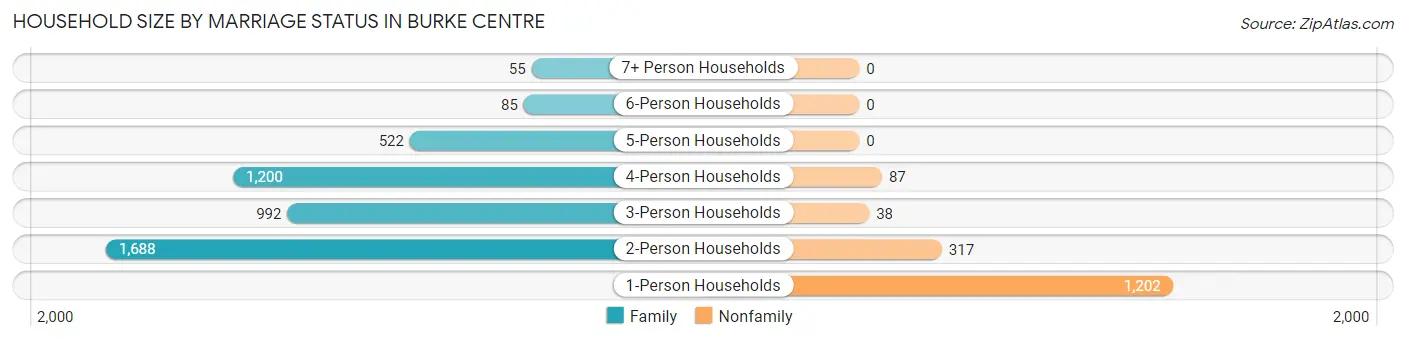
| Household Size | Family Households | Nonfamily Households |
| 1-Person Households | - | 1,202 (19.4%) |
| 2-Person Households | 1,688 (27.3%) | 317 (5.1%) |
| 3-Person Households | 992 (16.0%) | 38 (0.6%) |
| 4-Person Households | 1,200 (19.4%) | 87 (1.4%) |
| 5-Person Households | 522 (8.4%) | 0 (0.0%) |
| 6-Person Households | 85 (1.4%) | 0 (0.0%) |
| 7+ Person Households | 55 (0.9%) | 0 (0.0%) |
| Total | 4,542 (73.4%) | 1,644 (26.6%) |
Female Fertility in Burke Centre
Fertility by Age in Burke Centre
Average fertility rate in Burke Centre is 34.0 births per 1,000 women. Women in the age bracket of 20 to 34 years have the highest fertility rate with 52.0 births per 1,000 women. Women in the age bracket of 20 to 34 years acount for 55.0% of all women with births.
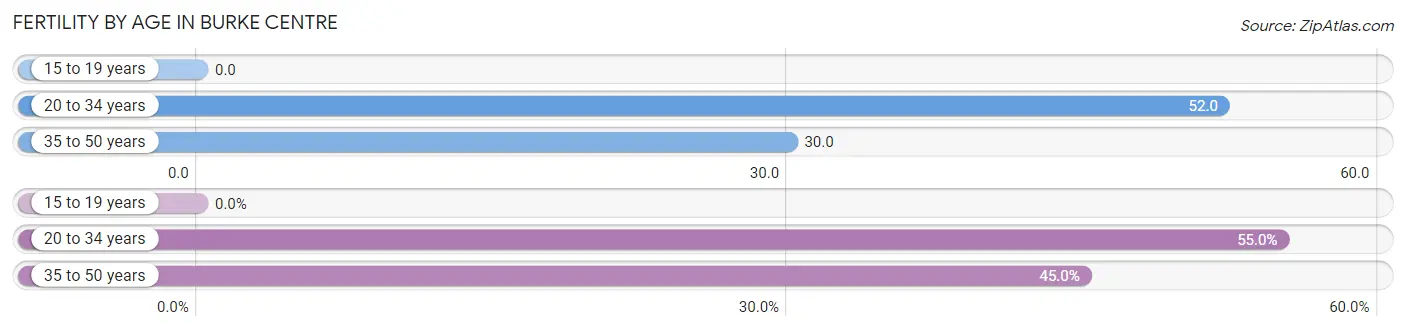
| Age Bracket | Women with Births | Births / 1,000 Women |
| 15 to 19 years | 0 (0.0%) | 0.0 |
| 20 to 34 years | 82 (55.0%) | 52.0 |
| 35 to 50 years | 67 (45.0%) | 30.0 |
| Total | 149 (100.0%) | 34.0 |
Fertility by Age by Marriage Status in Burke Centre
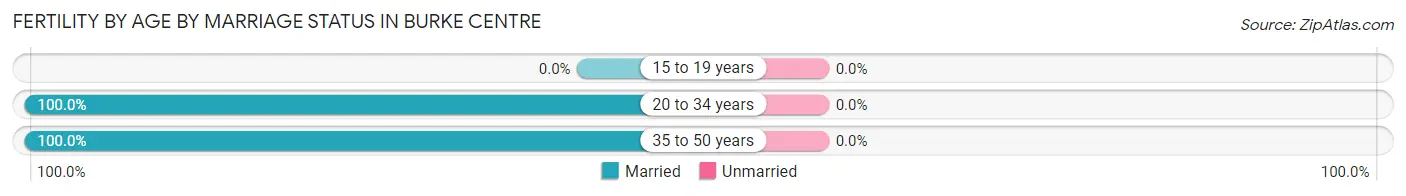
| Age Bracket | Married | Unmarried |
| 15 to 19 years | 0 (0.0%) | 0 (0.0%) |
| 20 to 34 years | 82 (100.0%) | 0 (0.0%) |
| 35 to 50 years | 67 (100.0%) | 0 (0.0%) |
| Total | 149 (100.0%) | 0 (0.0%) |
Fertility by Education in Burke Centre
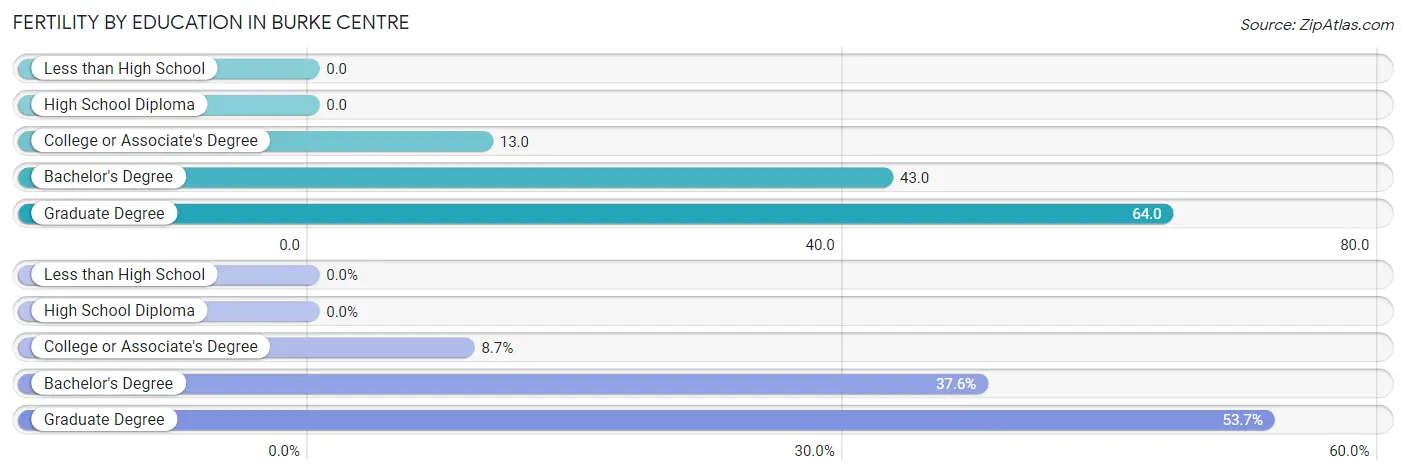
| Educational Attainment | Women with Births | Births / 1,000 Women |
| Less than High School | 0 (0.0%) | 0.0 |
| High School Diploma | 0 (0.0%) | 0.0 |
| College or Associate's Degree | 13 (8.7%) | 13.0 |
| Bachelor's Degree | 56 (37.6%) | 43.0 |
| Graduate Degree | 80 (53.7%) | 64.0 |
| Total | 149 (100.0%) | 34.0 |
Fertility by Education by Marriage Status in Burke Centre
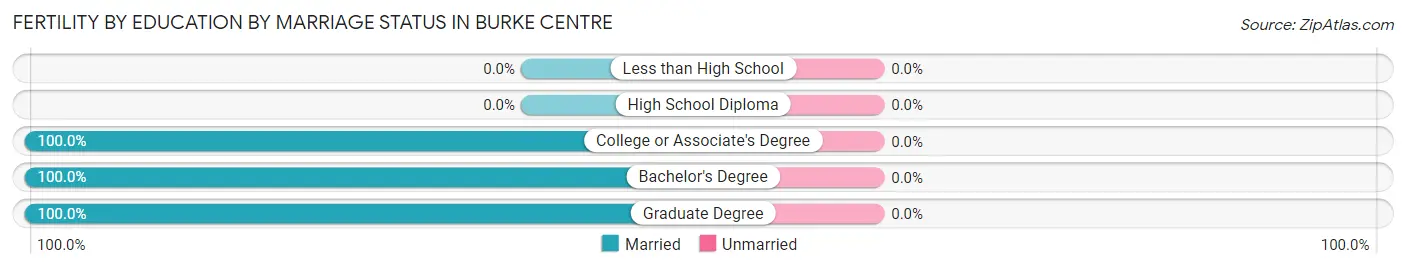
| Educational Attainment | Married | Unmarried |
| Less than High School | 0 (0.0%) | 0 (0.0%) |
| High School Diploma | 0 (0.0%) | 0 (0.0%) |
| College or Associate's Degree | 13 (100.0%) | 0 (0.0%) |
| Bachelor's Degree | 56 (100.0%) | 0 (0.0%) |
| Graduate Degree | 80 (100.0%) | 0 (0.0%) |
| Total | 149 (100.0%) | 0 (0.0%) |
Employment Characteristics in Burke Centre
Employment by Class of Employer in Burke Centre
Among the 9,163 employed individuals in Burke Centre, private company employees (4,530 | 49.4%), federal government employees (1,596 | 17.4%), and local government employees (1,073 | 11.7%) make up the most common classes of employment.
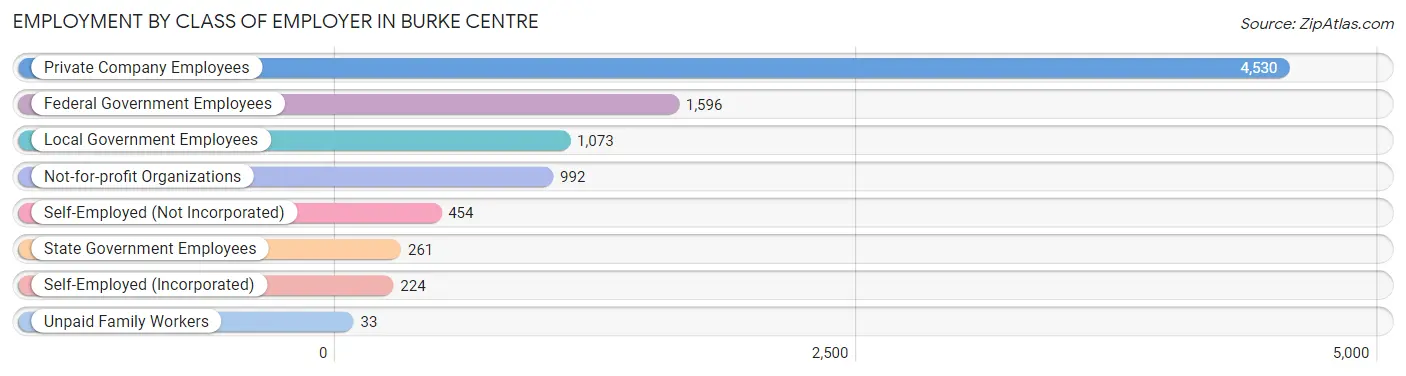
| Employer Class | # Employees | % Employees |
| Private Company Employees | 4,530 | 49.4% |
| Self-Employed (Incorporated) | 224 | 2.4% |
| Self-Employed (Not Incorporated) | 454 | 5.0% |
| Not-for-profit Organizations | 992 | 10.8% |
| Local Government Employees | 1,073 | 11.7% |
| State Government Employees | 261 | 2.9% |
| Federal Government Employees | 1,596 | 17.4% |
| Unpaid Family Workers | 33 | 0.4% |
| Total | 9,163 | 100.0% |
Employment Status by Age in Burke Centre
According to the labor force statistics for Burke Centre, out of the total population over 16 years of age (14,363), 69.1% or 9,925 individuals are in the labor force, with 5.4% or 536 of them unemployed. The age group with the highest labor force participation rate is 30 to 34 years, with 88.8% or 745 individuals in the labor force. Within the labor force, the 65 to 74 years age range has the highest percentage of unemployed individuals, with 12.6% or 79 of them being unemployed.
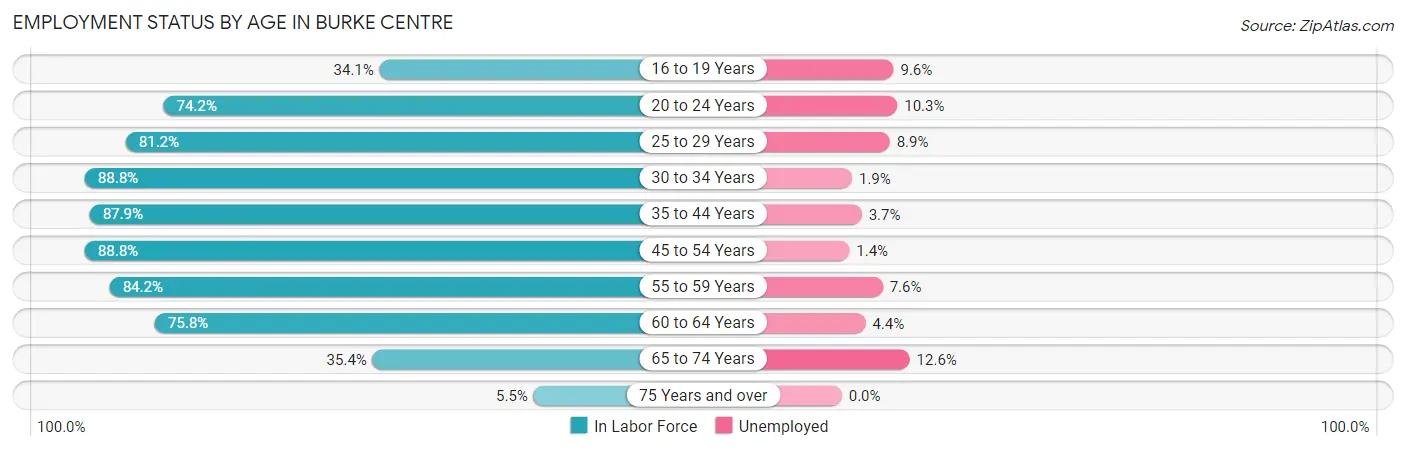
| Age Bracket | In Labor Force | Unemployed |
| 16 to 19 Years | 375 (34.1%) | 36 (9.6%) |
| 20 to 24 Years | 1,132 (74.2%) | 117 (10.3%) |
| 25 to 29 Years | 646 (81.2%) | 57 (8.9%) |
| 30 to 34 Years | 745 (88.8%) | 14 (1.9%) |
| 35 to 44 Years | 2,597 (87.9%) | 96 (3.7%) |
| 45 to 54 Years | 1,986 (88.8%) | 28 (1.4%) |
| 55 to 59 Years | 858 (84.2%) | 65 (7.6%) |
| 60 to 64 Years | 904 (75.8%) | 40 (4.4%) |
| 65 to 74 Years | 627 (35.4%) | 79 (12.6%) |
| 75 Years and over | 51 (5.5%) | 0 (0.0%) |
| Total | 9,925 (69.1%) | 536 (5.4%) |
Employment Status by Educational Attainment in Burke Centre
According to labor force statistics for Burke Centre, 85.6% of individuals (7,737) out of the total population between 25 and 64 years of age (9,039) are in the labor force, with 3.9% or 302 of them being unemployed. The group with the highest labor force participation rate are those with the educational attainment of less than high school, with 97.5% or 312 individuals in the labor force. Within the labor force, individuals with college / associate degree education have the highest percentage of unemployment, with 6.2% or 83 of them being unemployed.
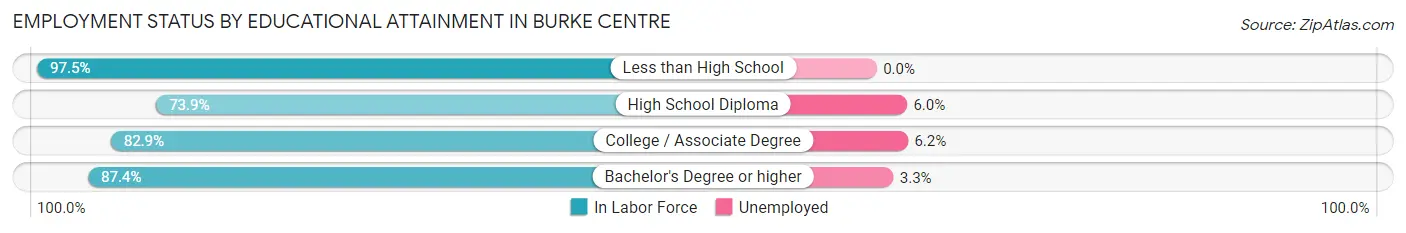
| Educational Attainment | In Labor Force | Unemployed |
| Less than High School | 312 (97.5%) | 0 (0.0%) |
| High School Diploma | 698 (73.9%) | 57 (6.0%) |
| College / Associate Degree | 1,331 (82.9%) | 100 (6.2%) |
| Bachelor's Degree or higher | 5,391 (87.4%) | 204 (3.3%) |
| Total | 7,737 (85.6%) | 353 (3.9%) |
Employment Occupations by Sex in Burke Centre
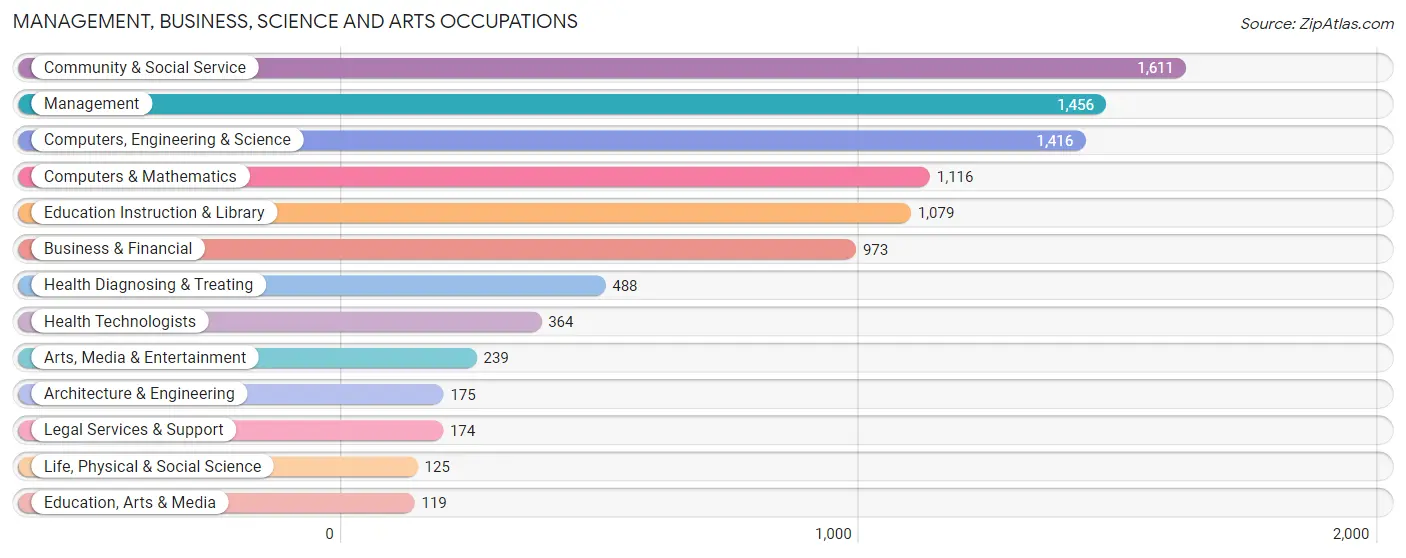
Management, Business, Science and Arts Occupations
The most common Management, Business, Science and Arts occupations in Burke Centre are Community & Social Service (1,611 | 17.5%), Management (1,456 | 15.9%), Computers, Engineering & Science (1,416 | 15.4%), Computers & Mathematics (1,116 | 12.2%), and Education Instruction & Library (1,079 | 11.8%).
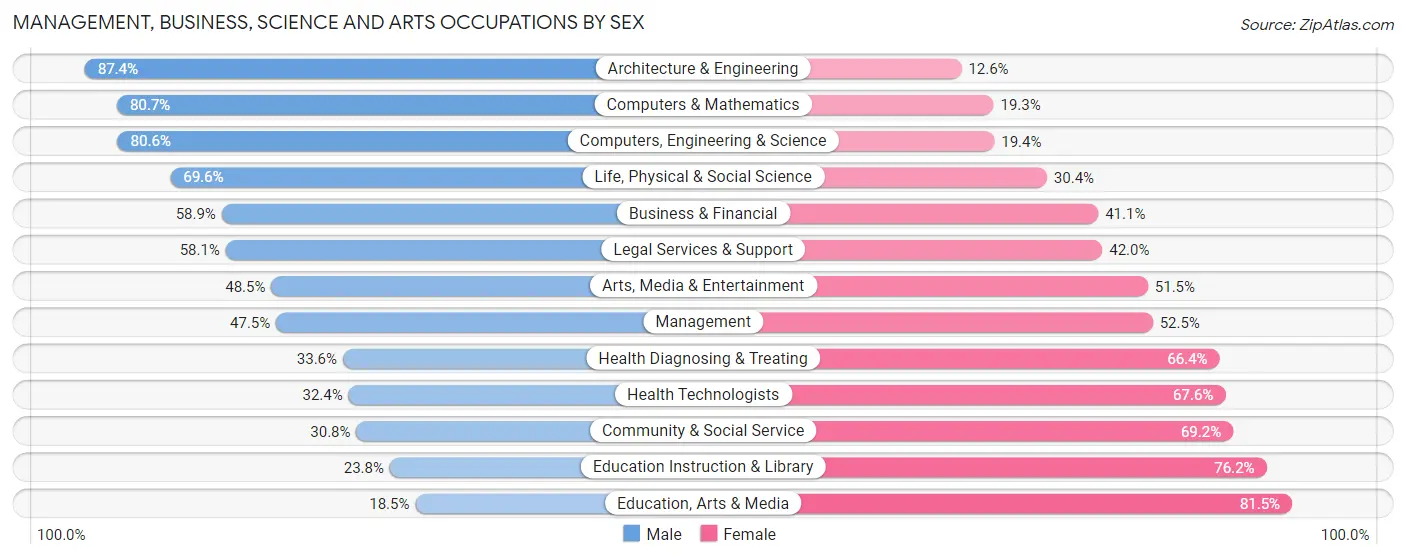
Management, Business, Science and Arts Occupations by Sex
Within the Management, Business, Science and Arts occupations in Burke Centre, the most male-oriented occupations are Architecture & Engineering (87.4%), Computers & Mathematics (80.7%), and Computers, Engineering & Science (80.6%), while the most female-oriented occupations are Education, Arts & Media (81.5%), Education Instruction & Library (76.2%), and Community & Social Service (69.2%).
| Occupation | Male | Female |
| Management | 692 (47.5%) | 764 (52.5%) |
| Business & Financial | 573 (58.9%) | 400 (41.1%) |
| Computers, Engineering & Science | 1,141 (80.6%) | 275 (19.4%) |
| Computers & Mathematics | 901 (80.7%) | 215 (19.3%) |
| Architecture & Engineering | 153 (87.4%) | 22 (12.6%) |
| Life, Physical & Social Science | 87 (69.6%) | 38 (30.4%) |
| Community & Social Service | 496 (30.8%) | 1,115 (69.2%) |
| Education, Arts & Media | 22 (18.5%) | 97 (81.5%) |
| Legal Services & Support | 101 (58.1%) | 73 (41.9%) |
| Education Instruction & Library | 257 (23.8%) | 822 (76.2%) |
| Arts, Media & Entertainment | 116 (48.5%) | 123 (51.5%) |
| Health Diagnosing & Treating | 164 (33.6%) | 324 (66.4%) |
| Health Technologists | 118 (32.4%) | 246 (67.6%) |
| Total (Category) | 3,066 (51.6%) | 2,878 (48.4%) |
| Total (Overall) | 4,700 (51.2%) | 4,478 (48.8%) |
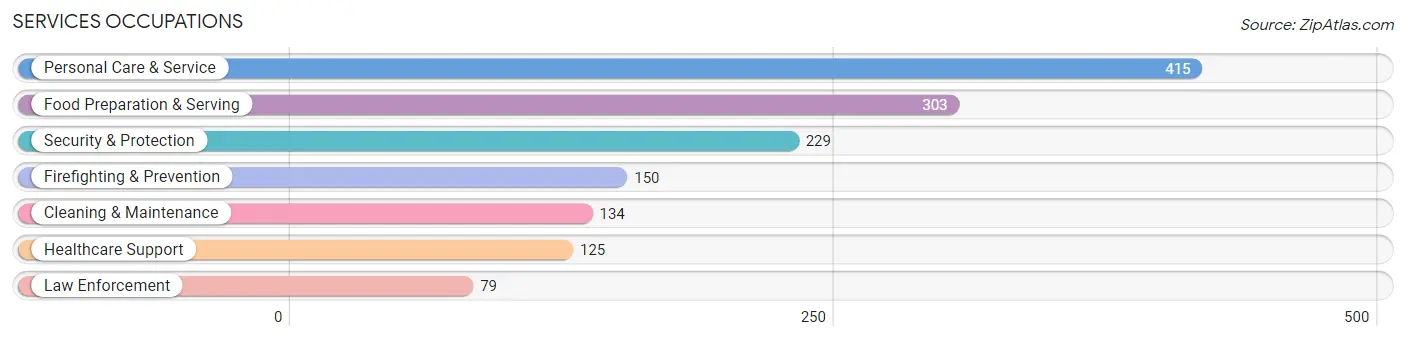
Services Occupations
The most common Services occupations in Burke Centre are Personal Care & Service (415 | 4.5%), Food Preparation & Serving (303 | 3.3%), Security & Protection (229 | 2.5%), Firefighting & Prevention (150 | 1.6%), and Cleaning & Maintenance (134 | 1.5%).
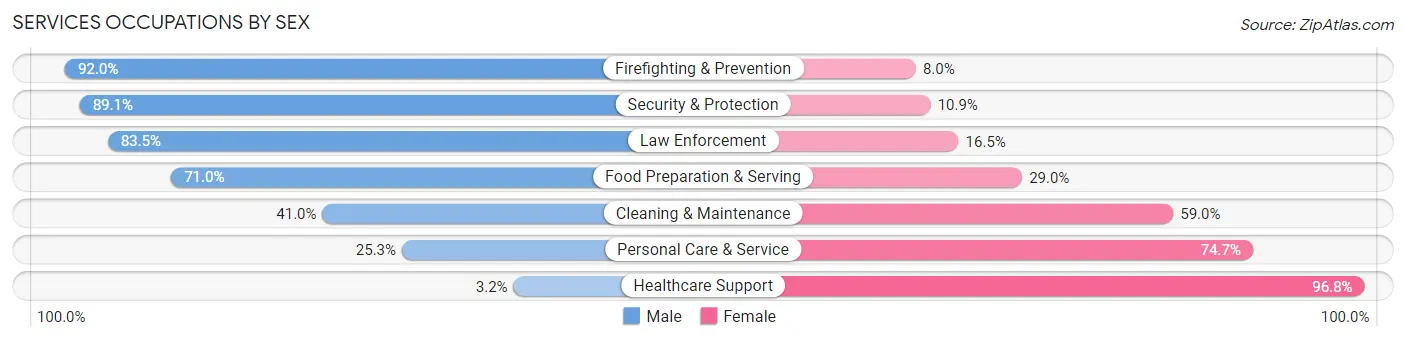
Services Occupations by Sex
Within the Services occupations in Burke Centre, the most male-oriented occupations are Firefighting & Prevention (92.0%), Security & Protection (89.1%), and Law Enforcement (83.5%), while the most female-oriented occupations are Healthcare Support (96.8%), Personal Care & Service (74.7%), and Cleaning & Maintenance (59.0%).
| Occupation | Male | Female |
| Healthcare Support | 4 (3.2%) | 121 (96.8%) |
| Security & Protection | 204 (89.1%) | 25 (10.9%) |
| Firefighting & Prevention | 138 (92.0%) | 12 (8.0%) |
| Law Enforcement | 66 (83.5%) | 13 (16.5%) |
| Food Preparation & Serving | 215 (71.0%) | 88 (29.0%) |
| Cleaning & Maintenance | 55 (41.0%) | 79 (59.0%) |
| Personal Care & Service | 105 (25.3%) | 310 (74.7%) |
| Total (Category) | 583 (48.3%) | 623 (51.7%) |
| Total (Overall) | 4,700 (51.2%) | 4,478 (48.8%) |
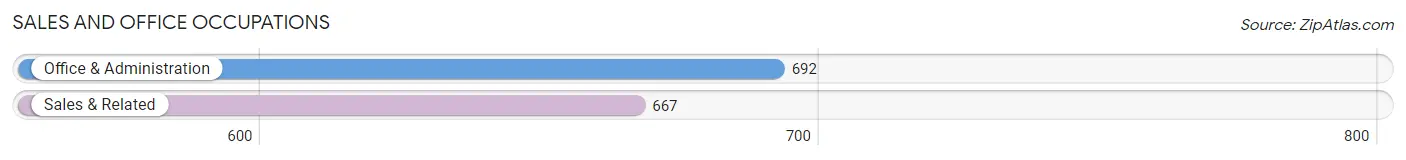
Sales and Office Occupations
The most common Sales and Office occupations in Burke Centre are Office & Administration (692 | 7.5%), and Sales & Related (667 | 7.3%).
Sales and Office Occupations by Sex
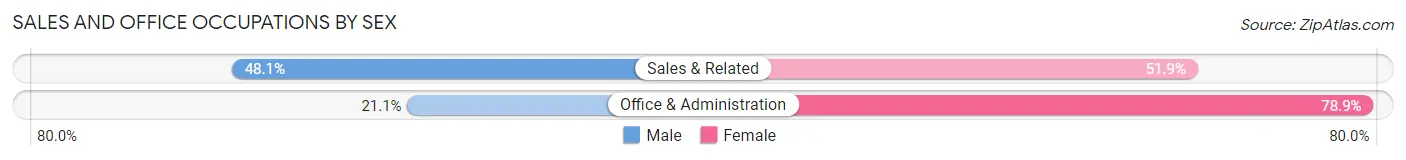
| Occupation | Male | Female |
| Sales & Related | 321 (48.1%) | 346 (51.9%) |
| Office & Administration | 146 (21.1%) | 546 (78.9%) |
| Total (Category) | 467 (34.4%) | 892 (65.6%) |
| Total (Overall) | 4,700 (51.2%) | 4,478 (48.8%) |
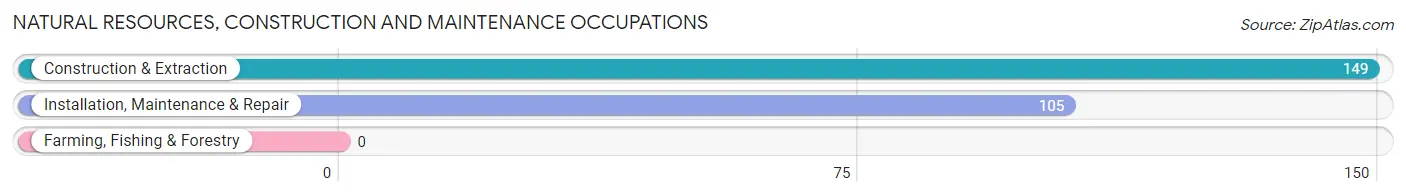
Natural Resources, Construction and Maintenance Occupations
The most common Natural Resources, Construction and Maintenance occupations in Burke Centre are Construction & Extraction (149 | 1.6%), and Installation, Maintenance & Repair (105 | 1.1%).
Natural Resources, Construction and Maintenance Occupations by Sex
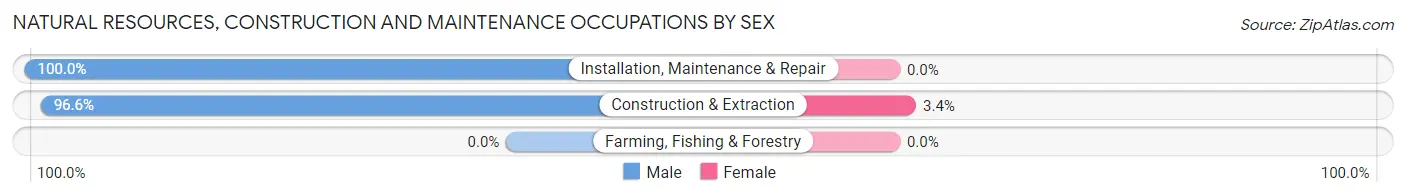
| Occupation | Male | Female |
| Farming, Fishing & Forestry | 0 (0.0%) | 0 (0.0%) |
| Construction & Extraction | 144 (96.6%) | 5 (3.4%) |
| Installation, Maintenance & Repair | 105 (100.0%) | 0 (0.0%) |
| Total (Category) | 249 (98.0%) | 5 (2.0%) |
| Total (Overall) | 4,700 (51.2%) | 4,478 (48.8%) |
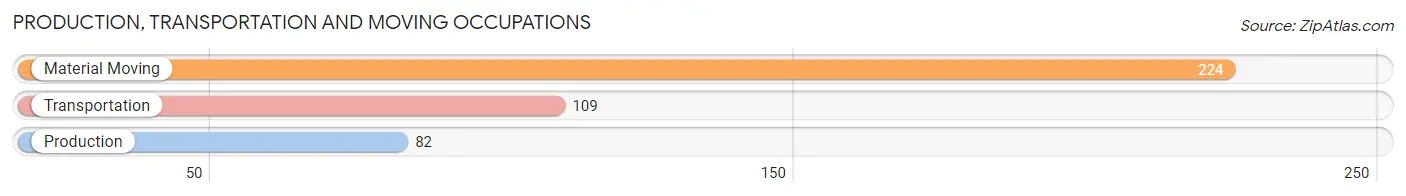
Production, Transportation and Moving Occupations
The most common Production, Transportation and Moving occupations in Burke Centre are Material Moving (224 | 2.4%), Transportation (109 | 1.2%), and Production (82 | 0.9%).
Production, Transportation and Moving Occupations by Sex
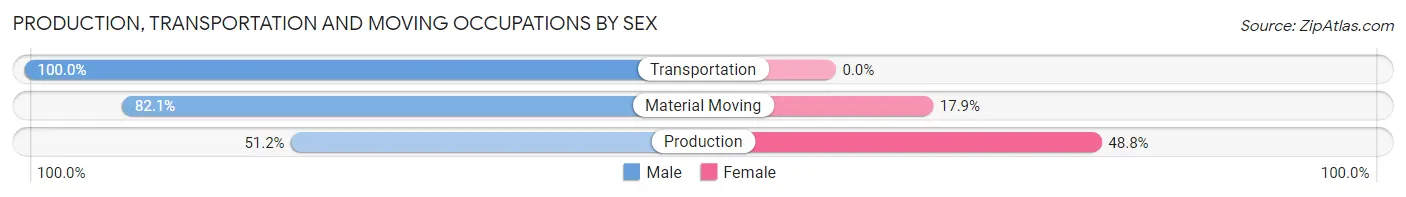
| Occupation | Male | Female |
| Production | 42 (51.2%) | 40 (48.8%) |
| Transportation | 109 (100.0%) | 0 (0.0%) |
| Material Moving | 184 (82.1%) | 40 (17.9%) |
| Total (Category) | 335 (80.7%) | 80 (19.3%) |
| Total (Overall) | 4,700 (51.2%) | 4,478 (48.8%) |
Employment Industries by Sex in Burke Centre
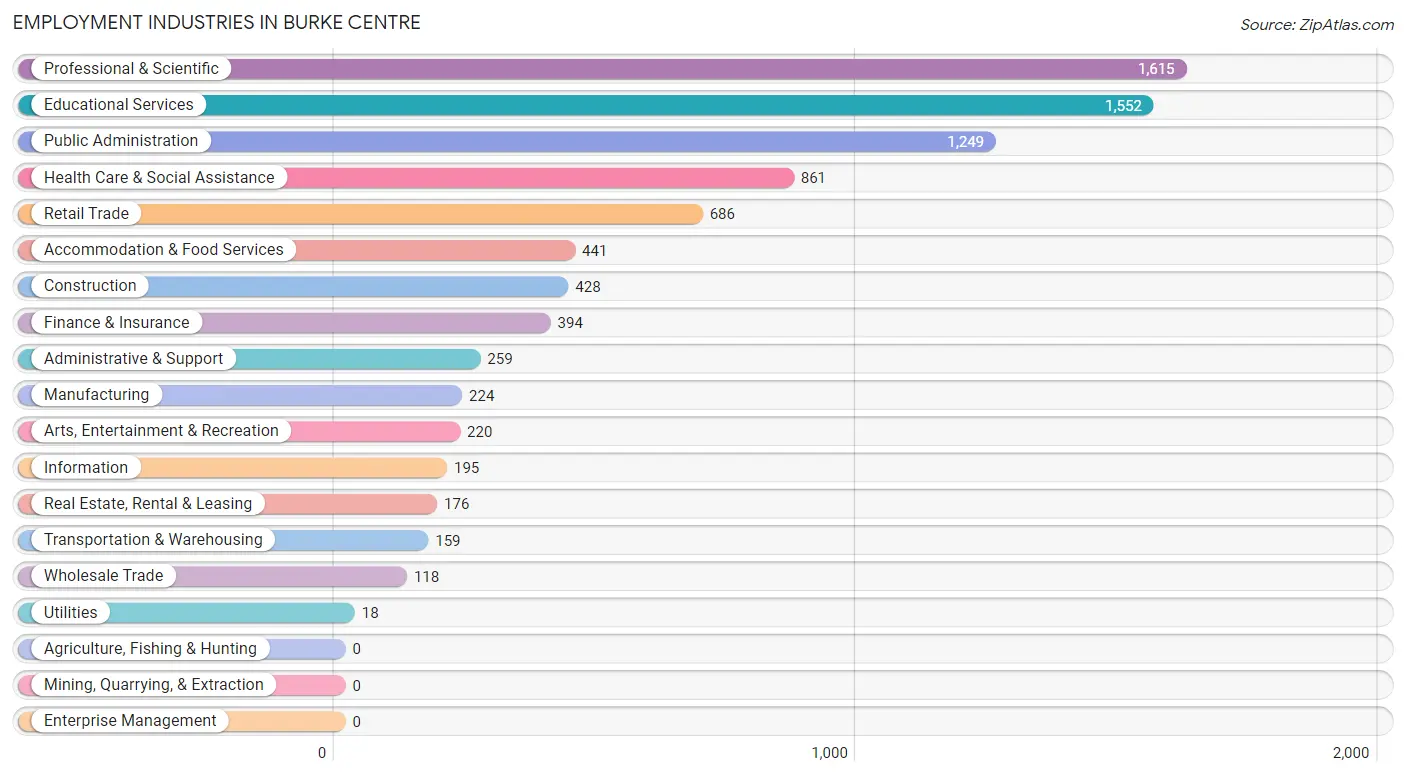
Employment Industries in Burke Centre
The major employment industries in Burke Centre include Professional & Scientific (1,615 | 17.6%), Educational Services (1,552 | 16.9%), Public Administration (1,249 | 13.6%), Health Care & Social Assistance (861 | 9.4%), and Retail Trade (686 | 7.5%).
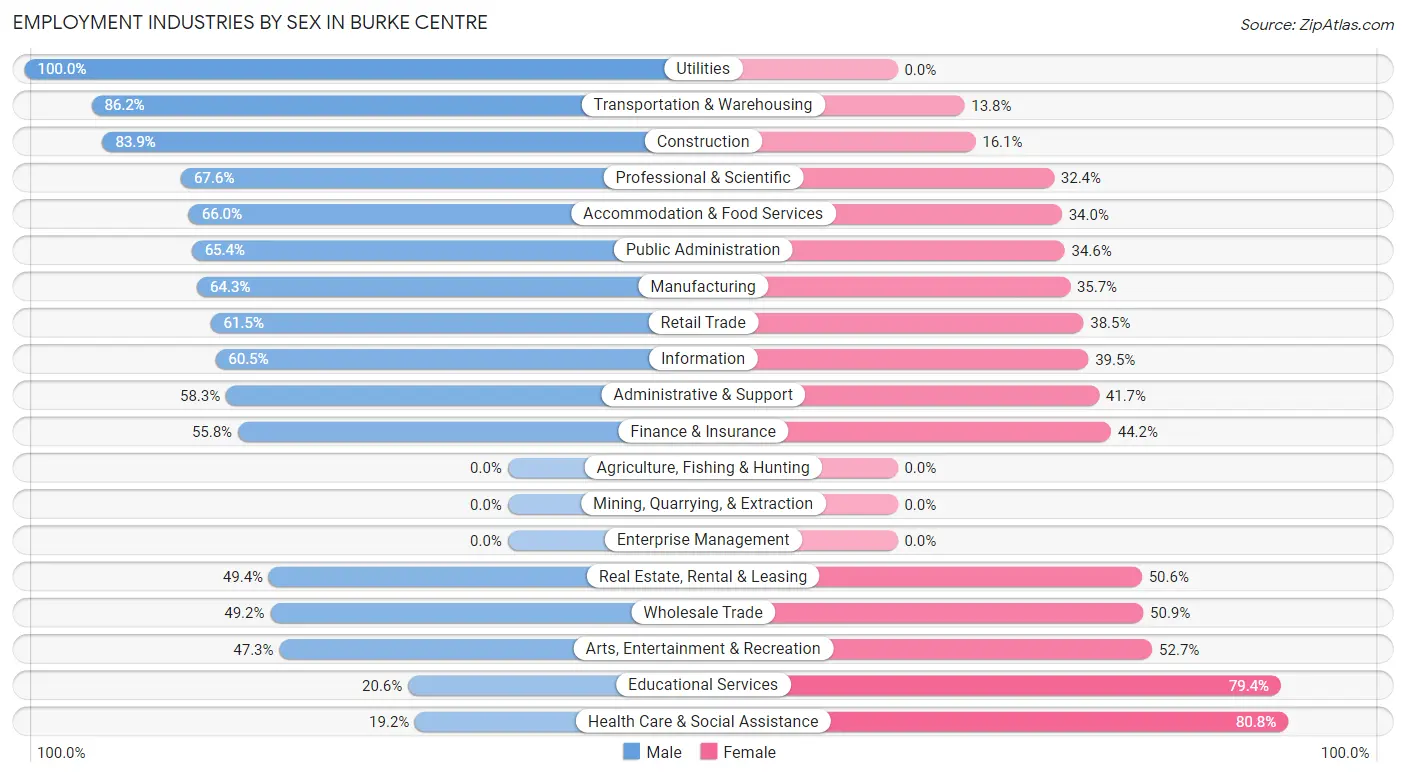
Employment Industries by Sex in Burke Centre
The Burke Centre industries that see more men than women are Utilities (100.0%), Transportation & Warehousing (86.2%), and Construction (83.9%), whereas the industries that tend to have a higher number of women are Health Care & Social Assistance (80.8%), Educational Services (79.4%), and Arts, Entertainment & Recreation (52.7%).
| Industry | Male | Female |
| Agriculture, Fishing & Hunting | 0 (0.0%) | 0 (0.0%) |
| Mining, Quarrying, & Extraction | 0 (0.0%) | 0 (0.0%) |
| Construction | 359 (83.9%) | 69 (16.1%) |
| Manufacturing | 144 (64.3%) | 80 (35.7%) |
| Wholesale Trade | 58 (49.1%) | 60 (50.8%) |
| Retail Trade | 422 (61.5%) | 264 (38.5%) |
| Transportation & Warehousing | 137 (86.2%) | 22 (13.8%) |
| Utilities | 18 (100.0%) | 0 (0.0%) |
| Information | 118 (60.5%) | 77 (39.5%) |
| Finance & Insurance | 220 (55.8%) | 174 (44.2%) |
| Real Estate, Rental & Leasing | 87 (49.4%) | 89 (50.6%) |
| Professional & Scientific | 1,092 (67.6%) | 523 (32.4%) |
| Enterprise Management | 0 (0.0%) | 0 (0.0%) |
| Administrative & Support | 151 (58.3%) | 108 (41.7%) |
| Educational Services | 320 (20.6%) | 1,232 (79.4%) |
| Health Care & Social Assistance | 165 (19.2%) | 696 (80.8%) |
| Arts, Entertainment & Recreation | 104 (47.3%) | 116 (52.7%) |
| Accommodation & Food Services | 291 (66.0%) | 150 (34.0%) |
| Public Administration | 817 (65.4%) | 432 (34.6%) |
| Total | 4,700 (51.2%) | 4,478 (48.8%) |
Education in Burke Centre
School Enrollment in Burke Centre
The most common levels of schooling among the 5,648 students in Burke Centre are college / undergraduate (1,498 | 26.5%), high school (1,164 | 20.6%), and elementary school (1,058 | 18.7%).
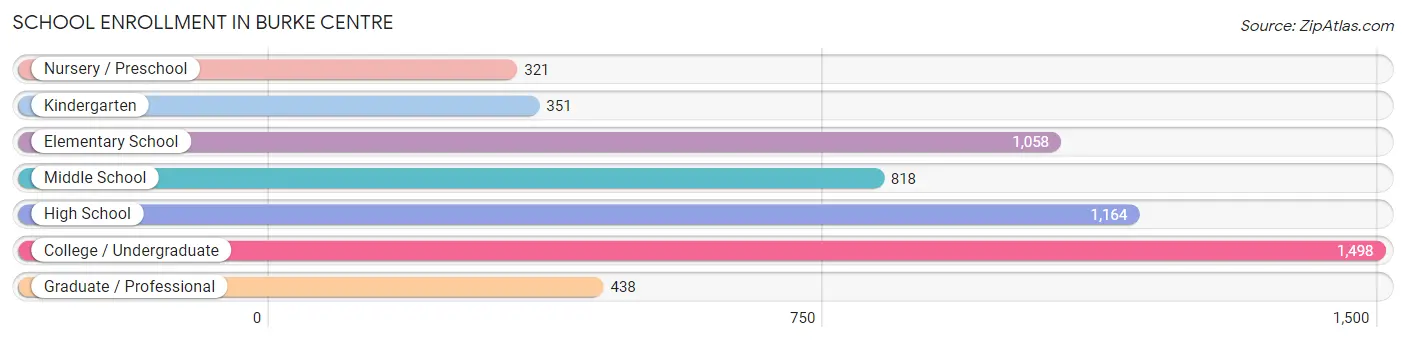
| School Level | # Students | % Students |
| Nursery / Preschool | 321 | 5.7% |
| Kindergarten | 351 | 6.2% |
| Elementary School | 1,058 | 18.7% |
| Middle School | 818 | 14.5% |
| High School | 1,164 | 20.6% |
| College / Undergraduate | 1,498 | 26.5% |
| Graduate / Professional | 438 | 7.7% |
| Total | 5,648 | 100.0% |
School Enrollment by Age by Funding Source in Burke Centre
Out of a total of 5,648 students who are enrolled in schools in Burke Centre, 994 (17.6%) attend a private institution, while the remaining 4,654 (82.4%) are enrolled in public schools. The age group of 3 to 4 year olds has the highest likelihood of being enrolled in private schools, with 167 (68.4% in the age bracket) enrolled. Conversely, the age group of 15 to 17 year olds has the lowest likelihood of being enrolled in a private school, with 536 (95.4% in the age bracket) attending a public institution.
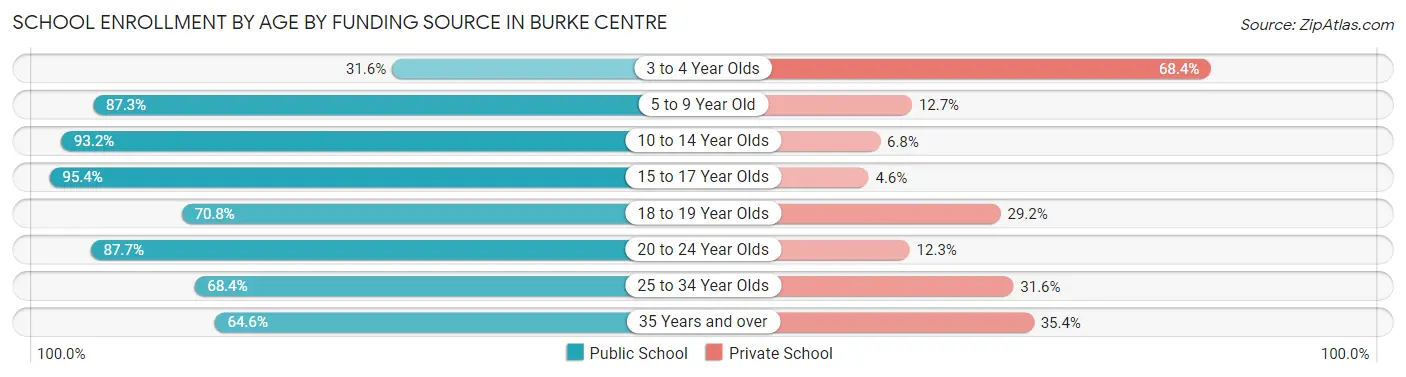
| Age Bracket | Public School | Private School |
| 3 to 4 Year Olds | 77 (31.6%) | 167 (68.4%) |
| 5 to 9 Year Old | 1,235 (87.3%) | 180 (12.7%) |
| 10 to 14 Year Olds | 964 (93.2%) | 70 (6.8%) |
| 15 to 17 Year Olds | 536 (95.4%) | 26 (4.6%) |
| 18 to 19 Year Olds | 516 (70.8%) | 213 (29.2%) |
| 20 to 24 Year Olds | 921 (87.7%) | 129 (12.3%) |
| 25 to 34 Year Olds | 132 (68.4%) | 61 (31.6%) |
| 35 Years and over | 272 (64.6%) | 149 (35.4%) |
| Total | 4,654 (82.4%) | 994 (17.6%) |
Educational Attainment by Field of Study in Burke Centre
Social sciences (1,197 | 13.4%), business (1,036 | 11.6%), computers & mathematics (861 | 9.6%), science & technology (786 | 8.8%), and education (769 | 8.6%) are the most common fields of study among 8,965 individuals in Burke Centre who have obtained a bachelor's degree or higher.
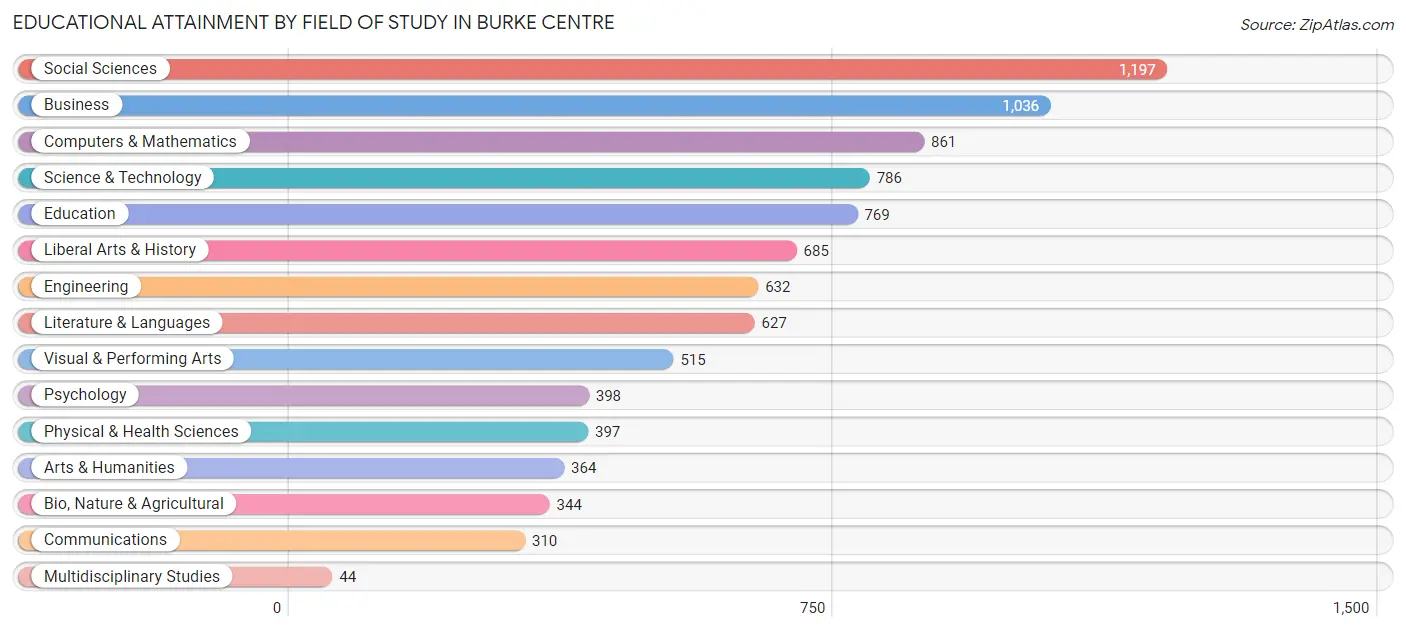
| Field of Study | # Graduates | % Graduates |
| Computers & Mathematics | 861 | 9.6% |
| Bio, Nature & Agricultural | 344 | 3.8% |
| Physical & Health Sciences | 397 | 4.4% |
| Psychology | 398 | 4.4% |
| Social Sciences | 1,197 | 13.4% |
| Engineering | 632 | 7.0% |
| Multidisciplinary Studies | 44 | 0.5% |
| Science & Technology | 786 | 8.8% |
| Business | 1,036 | 11.6% |
| Education | 769 | 8.6% |
| Literature & Languages | 627 | 7.0% |
| Liberal Arts & History | 685 | 7.6% |
| Visual & Performing Arts | 515 | 5.7% |
| Communications | 310 | 3.5% |
| Arts & Humanities | 364 | 4.1% |
| Total | 8,965 | 100.0% |
Transportation & Commute in Burke Centre
Vehicle Availability by Sex in Burke Centre
The most prevalent vehicle ownership categories in Burke Centre are males with 2 vehicles (2,528, accounting for 53.0%) and females with 2 vehicles (2,154, making up 57.5%).
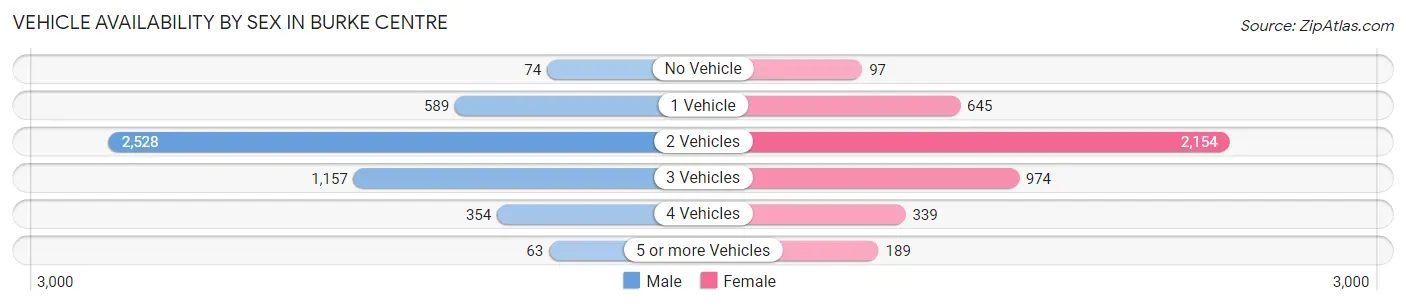
| Vehicles Available | Male | Female |
| No Vehicle | 74 (1.5%) | 97 (2.2%) |
| 1 Vehicle | 589 (12.4%) | 645 (14.7%) |
| 2 Vehicles | 2,528 (53.0%) | 2,154 (49.0%) |
| 3 Vehicles | 1,157 (24.3%) | 974 (22.2%) |
| 4 Vehicles | 354 (7.4%) | 339 (7.7%) |
| 5 or more Vehicles | 63 (1.3%) | 189 (4.3%) |
| Total | 4,765 (100.0%) | 4,398 (100.0%) |
Commute Time in Burke Centre
The most frequently occuring commute durations in Burke Centre are 30 to 34 minutes (1,449 commuters, 20.1%), 45 to 59 minutes (997 commuters, 13.9%), and 20 to 24 minutes (878 commuters, 12.2%).
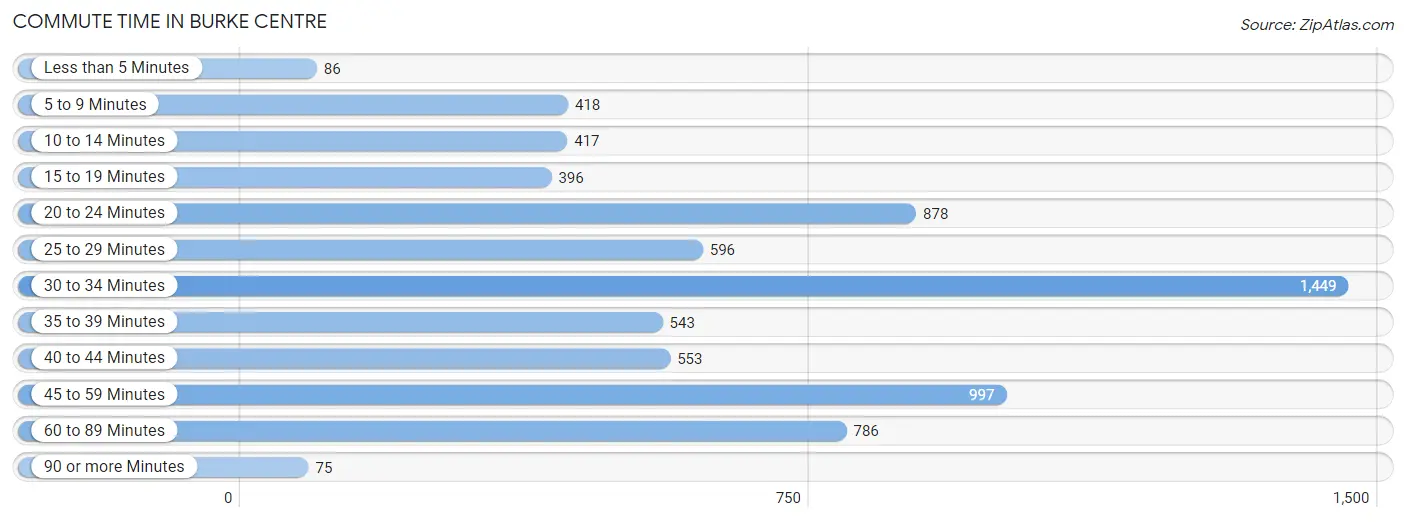
| Commute Time | # Commuters | % Commuters |
| Less than 5 Minutes | 86 | 1.2% |
| 5 to 9 Minutes | 418 | 5.8% |
| 10 to 14 Minutes | 417 | 5.8% |
| 15 to 19 Minutes | 396 | 5.5% |
| 20 to 24 Minutes | 878 | 12.2% |
| 25 to 29 Minutes | 596 | 8.3% |
| 30 to 34 Minutes | 1,449 | 20.1% |
| 35 to 39 Minutes | 543 | 7.5% |
| 40 to 44 Minutes | 553 | 7.7% |
| 45 to 59 Minutes | 997 | 13.9% |
| 60 to 89 Minutes | 786 | 10.9% |
| 90 or more Minutes | 75 | 1.0% |
Commute Time by Sex in Burke Centre
The most common commute times in Burke Centre are 30 to 34 minutes (867 commuters, 23.0%) for males and 30 to 34 minutes (582 commuters, 17.0%) for females.
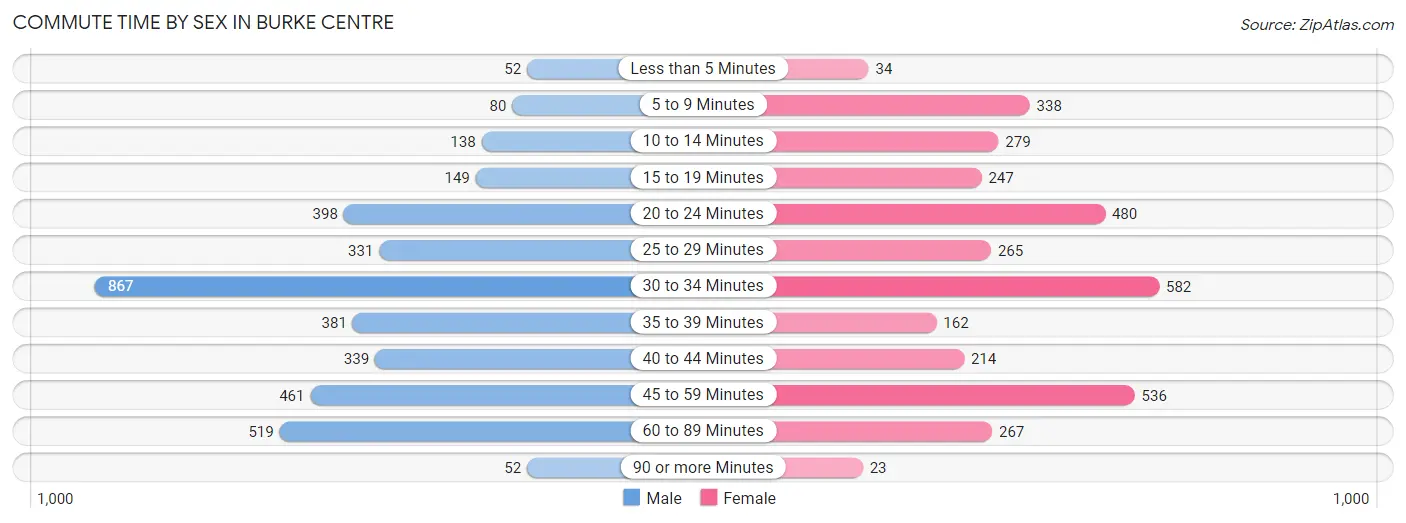
| Commute Time | Male | Female |
| Less than 5 Minutes | 52 (1.4%) | 34 (1.0%) |
| 5 to 9 Minutes | 80 (2.1%) | 338 (9.9%) |
| 10 to 14 Minutes | 138 (3.7%) | 279 (8.1%) |
| 15 to 19 Minutes | 149 (4.0%) | 247 (7.2%) |
| 20 to 24 Minutes | 398 (10.6%) | 480 (14.0%) |
| 25 to 29 Minutes | 331 (8.8%) | 265 (7.7%) |
| 30 to 34 Minutes | 867 (23.0%) | 582 (17.0%) |
| 35 to 39 Minutes | 381 (10.1%) | 162 (4.7%) |
| 40 to 44 Minutes | 339 (9.0%) | 214 (6.2%) |
| 45 to 59 Minutes | 461 (12.2%) | 536 (15.6%) |
| 60 to 89 Minutes | 519 (13.8%) | 267 (7.8%) |
| 90 or more Minutes | 52 (1.4%) | 23 (0.7%) |
Time of Departure to Work by Sex in Burke Centre
The most frequent times of departure to work in Burke Centre are 7:30 AM to 7:59 AM (597, 15.9%) for males and 7:00 AM to 7:29 AM (582, 17.0%) for females.
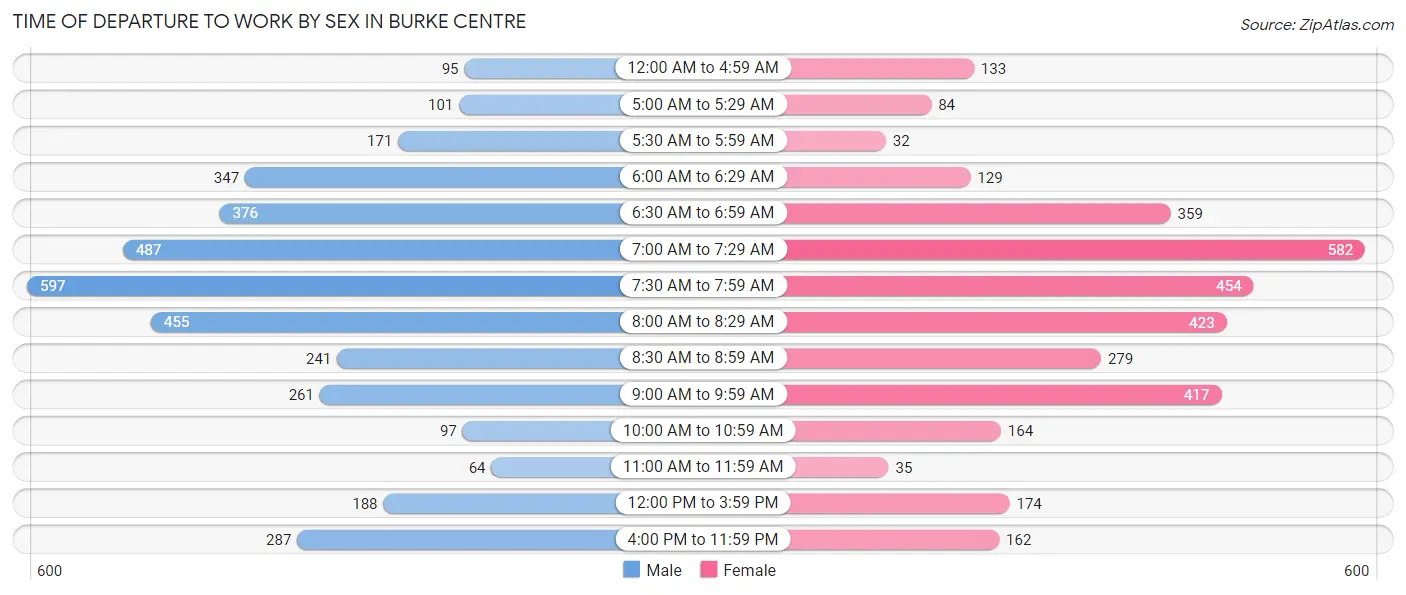
| Time of Departure | Male | Female |
| 12:00 AM to 4:59 AM | 95 (2.5%) | 133 (3.9%) |
| 5:00 AM to 5:29 AM | 101 (2.7%) | 84 (2.5%) |
| 5:30 AM to 5:59 AM | 171 (4.5%) | 32 (0.9%) |
| 6:00 AM to 6:29 AM | 347 (9.2%) | 129 (3.8%) |
| 6:30 AM to 6:59 AM | 376 (10.0%) | 359 (10.5%) |
| 7:00 AM to 7:29 AM | 487 (12.9%) | 582 (17.0%) |
| 7:30 AM to 7:59 AM | 597 (15.9%) | 454 (13.3%) |
| 8:00 AM to 8:29 AM | 455 (12.1%) | 423 (12.3%) |
| 8:30 AM to 8:59 AM | 241 (6.4%) | 279 (8.1%) |
| 9:00 AM to 9:59 AM | 261 (6.9%) | 417 (12.2%) |
| 10:00 AM to 10:59 AM | 97 (2.6%) | 164 (4.8%) |
| 11:00 AM to 11:59 AM | 64 (1.7%) | 35 (1.0%) |
| 12:00 PM to 3:59 PM | 188 (5.0%) | 174 (5.1%) |
| 4:00 PM to 11:59 PM | 287 (7.6%) | 162 (4.7%) |
| Total | 3,767 (100.0%) | 3,427 (100.0%) |
Housing Occupancy in Burke Centre
Occupancy by Ownership in Burke Centre
Of the total 6,186 dwellings in Burke Centre, owner-occupied units account for 4,853 (78.4%), while renter-occupied units make up 1,333 (21.5%).
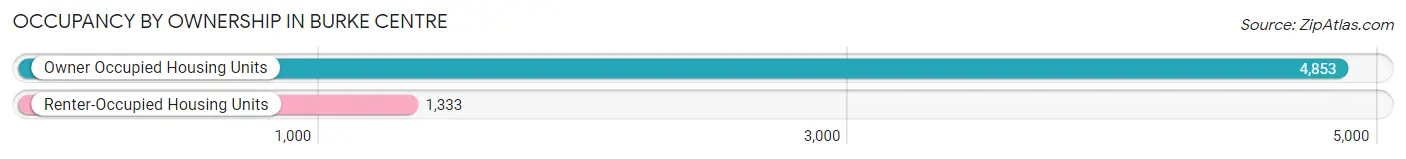
| Occupancy | # Housing Units | % Housing Units |
| Owner Occupied Housing Units | 4,853 | 78.4% |
| Renter-Occupied Housing Units | 1,333 | 21.5% |
| Total Occupied Housing Units | 6,186 | 100.0% |
Occupancy by Household Size in Burke Centre
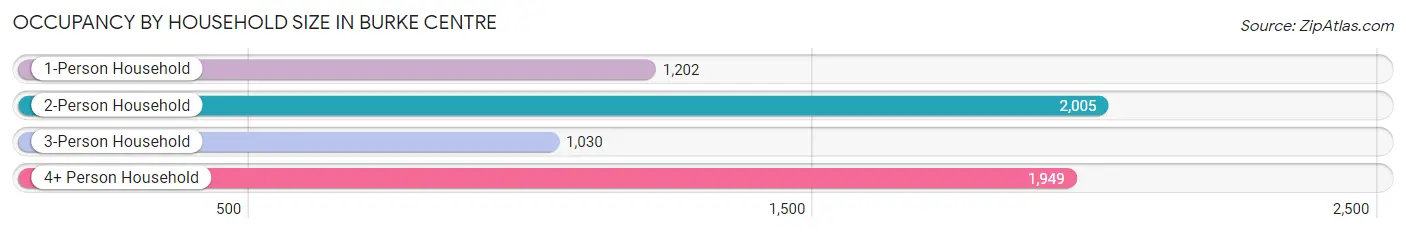
| Household Size | # Housing Units | % Housing Units |
| 1-Person Household | 1,202 | 19.4% |
| 2-Person Household | 2,005 | 32.4% |
| 3-Person Household | 1,030 | 16.7% |
| 4+ Person Household | 1,949 | 31.5% |
| Total Housing Units | 6,186 | 100.0% |
Occupancy by Ownership by Household Size in Burke Centre
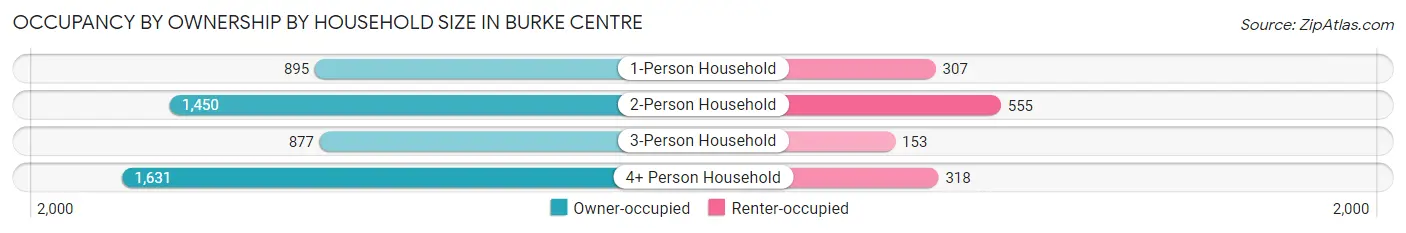
| Household Size | Owner-occupied | Renter-occupied |
| 1-Person Household | 895 (74.5%) | 307 (25.5%) |
| 2-Person Household | 1,450 (72.3%) | 555 (27.7%) |
| 3-Person Household | 877 (85.2%) | 153 (14.8%) |
| 4+ Person Household | 1,631 (83.7%) | 318 (16.3%) |
| Total Housing Units | 4,853 (78.4%) | 1,333 (21.5%) |
Occupancy by Educational Attainment in Burke Centre
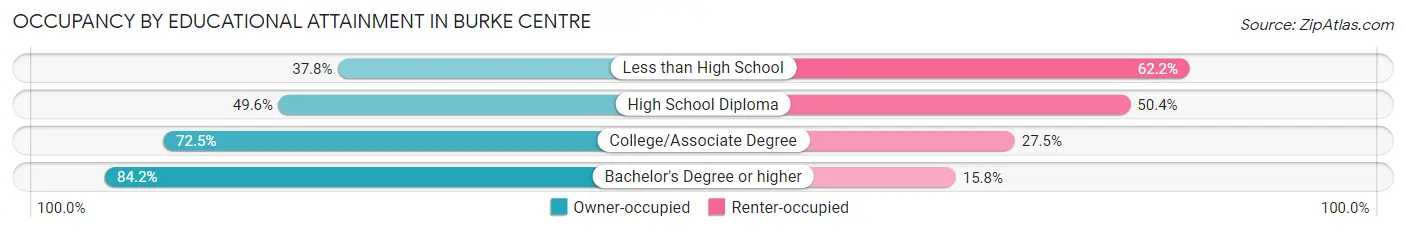
| Household Size | Owner-occupied | Renter-occupied |
| Less than High School | 76 (37.8%) | 125 (62.2%) |
| High School Diploma | 180 (49.6%) | 183 (50.4%) |
| College/Associate Degree | 855 (72.5%) | 324 (27.5%) |
| Bachelor's Degree or higher | 3,742 (84.2%) | 701 (15.8%) |
Occupancy by Age of Householder in Burke Centre
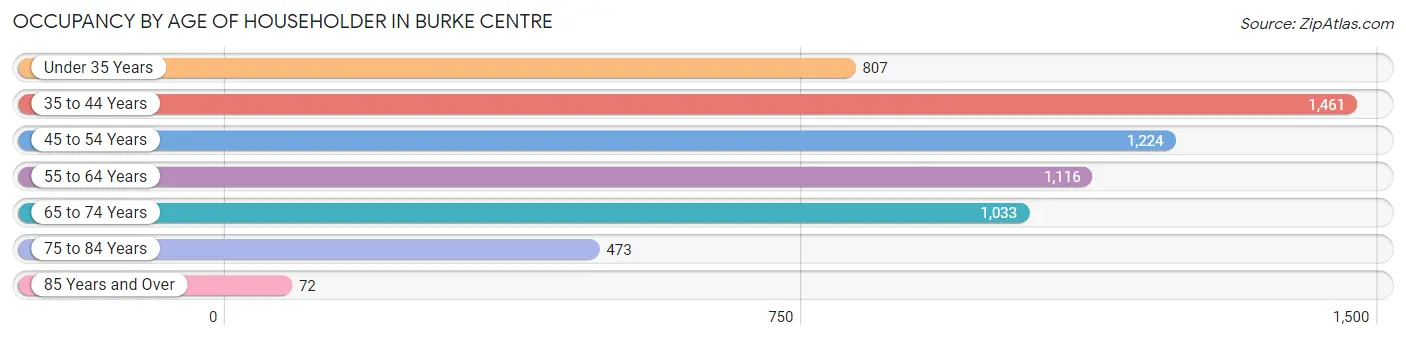
| Age Bracket | # Households | % Households |
| Under 35 Years | 807 | 13.1% |
| 35 to 44 Years | 1,461 | 23.6% |
| 45 to 54 Years | 1,224 | 19.8% |
| 55 to 64 Years | 1,116 | 18.0% |
| 65 to 74 Years | 1,033 | 16.7% |
| 75 to 84 Years | 473 | 7.6% |
| 85 Years and Over | 72 | 1.2% |
| Total | 6,186 | 100.0% |
Housing Finances in Burke Centre
Median Income by Occupancy in Burke Centre
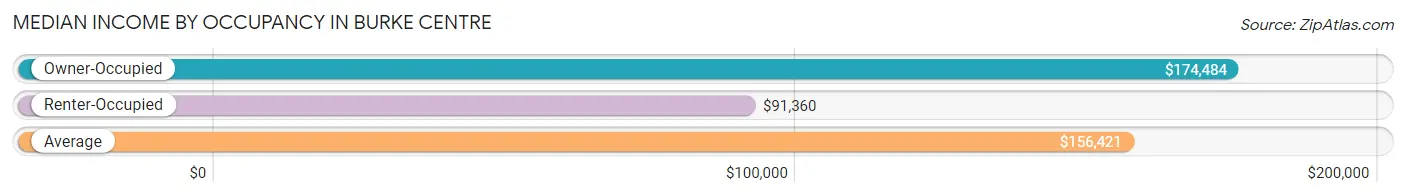
| Occupancy Type | # Households | Median Income |
| Owner-Occupied | 4,853 (78.4%) | $174,484 |
| Renter-Occupied | 1,333 (21.5%) | $91,360 |
| Average | 6,186 (100.0%) | $156,421 |
Occupancy by Householder Income Bracket in Burke Centre
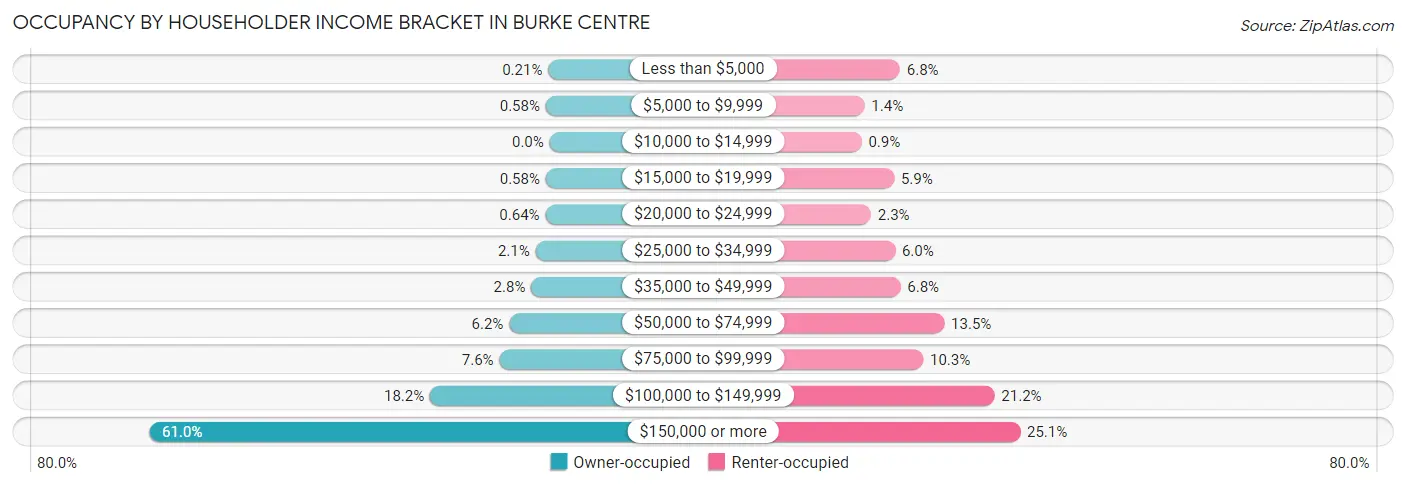
| Income Bracket | Owner-occupied | Renter-occupied |
| Less than $5,000 | 10 (0.2%) | 90 (6.8%) |
| $5,000 to $9,999 | 28 (0.6%) | 18 (1.3%) |
| $10,000 to $14,999 | 0 (0.0%) | 12 (0.9%) |
| $15,000 to $19,999 | 28 (0.6%) | 78 (5.9%) |
| $20,000 to $24,999 | 31 (0.6%) | 31 (2.3%) |
| $25,000 to $34,999 | 104 (2.1%) | 80 (6.0%) |
| $35,000 to $49,999 | 136 (2.8%) | 91 (6.8%) |
| $50,000 to $74,999 | 299 (6.2%) | 180 (13.5%) |
| $75,000 to $99,999 | 371 (7.6%) | 137 (10.3%) |
| $100,000 to $149,999 | 884 (18.2%) | 282 (21.2%) |
| $150,000 or more | 2,962 (61.0%) | 334 (25.1%) |
| Total | 4,853 (100.0%) | 1,333 (100.0%) |
Monthly Housing Cost Tiers in Burke Centre
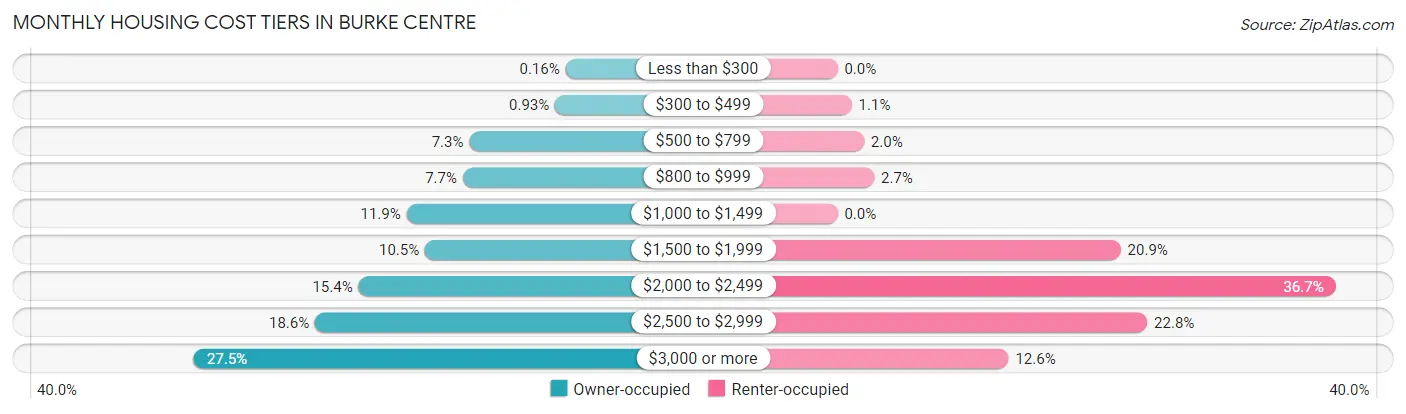
| Monthly Cost | Owner-occupied | Renter-occupied |
| Less than $300 | 8 (0.2%) | 0 (0.0%) |
| $300 to $499 | 45 (0.9%) | 14 (1.1%) |
| $500 to $799 | 352 (7.2%) | 26 (1.9%) |
| $800 to $999 | 375 (7.7%) | 36 (2.7%) |
| $1,000 to $1,499 | 576 (11.9%) | 0 (0.0%) |
| $1,500 to $1,999 | 510 (10.5%) | 278 (20.9%) |
| $2,000 to $2,499 | 748 (15.4%) | 489 (36.7%) |
| $2,500 to $2,999 | 903 (18.6%) | 304 (22.8%) |
| $3,000 or more | 1,336 (27.5%) | 168 (12.6%) |
| Total | 4,853 (100.0%) | 1,333 (100.0%) |
Physical Housing Characteristics in Burke Centre
Housing Structures in Burke Centre
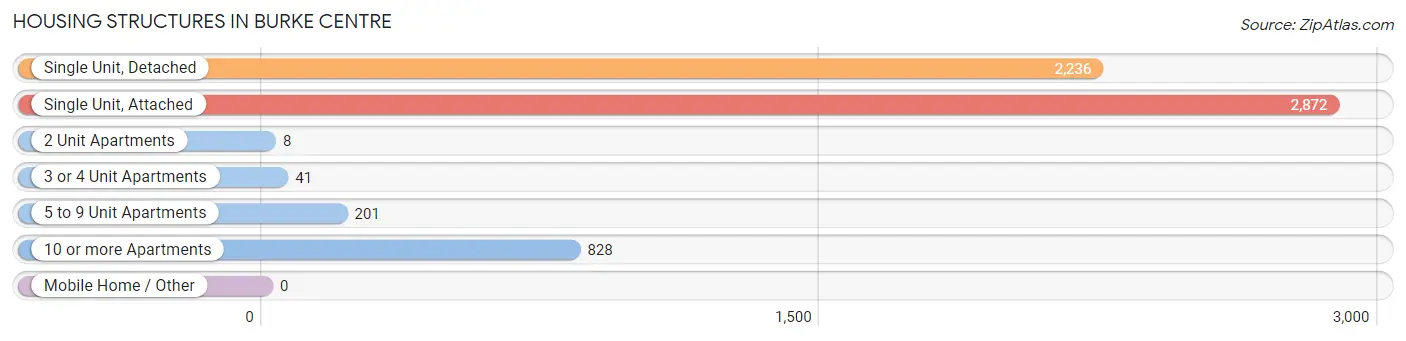
| Structure Type | # Housing Units | % Housing Units |
| Single Unit, Detached | 2,236 | 36.1% |
| Single Unit, Attached | 2,872 | 46.4% |
| 2 Unit Apartments | 8 | 0.1% |
| 3 or 4 Unit Apartments | 41 | 0.7% |
| 5 to 9 Unit Apartments | 201 | 3.3% |
| 10 or more Apartments | 828 | 13.4% |
| Mobile Home / Other | 0 | 0.0% |
| Total | 6,186 | 100.0% |
Housing Structures by Occupancy in Burke Centre
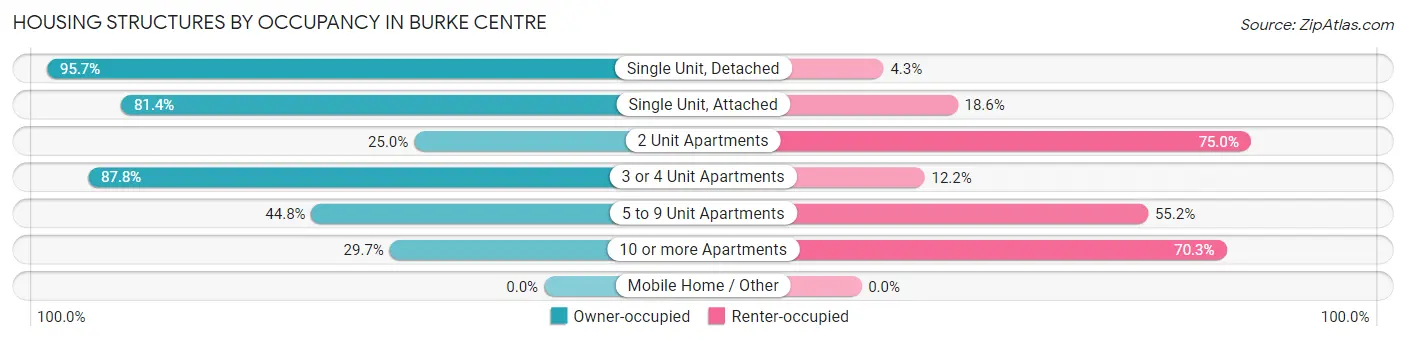
| Structure Type | Owner-occupied | Renter-occupied |
| Single Unit, Detached | 2,140 (95.7%) | 96 (4.3%) |
| Single Unit, Attached | 2,339 (81.4%) | 533 (18.6%) |
| 2 Unit Apartments | 2 (25.0%) | 6 (75.0%) |
| 3 or 4 Unit Apartments | 36 (87.8%) | 5 (12.2%) |
| 5 to 9 Unit Apartments | 90 (44.8%) | 111 (55.2%) |
| 10 or more Apartments | 246 (29.7%) | 582 (70.3%) |
| Mobile Home / Other | 0 (0.0%) | 0 (0.0%) |
| Total | 4,853 (78.4%) | 1,333 (21.5%) |
Housing Structures by Number of Rooms in Burke Centre
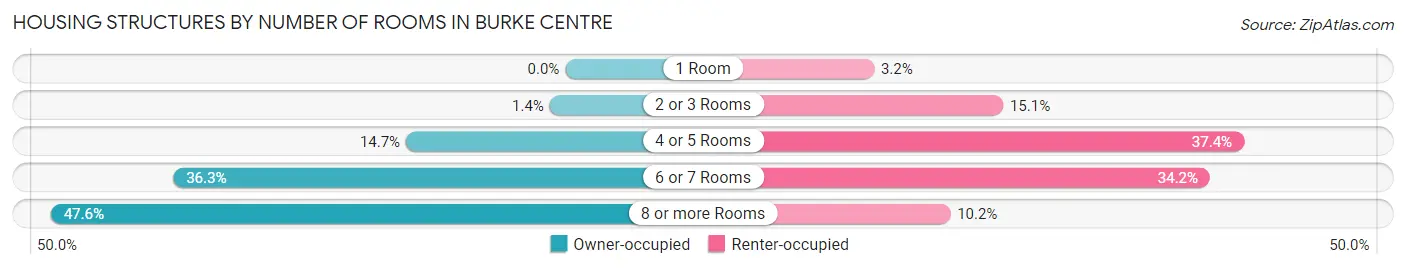
| Number of Rooms | Owner-occupied | Renter-occupied |
| 1 Room | 0 (0.0%) | 42 (3.2%) |
| 2 or 3 Rooms | 70 (1.4%) | 201 (15.1%) |
| 4 or 5 Rooms | 715 (14.7%) | 498 (37.4%) |
| 6 or 7 Rooms | 1,759 (36.2%) | 456 (34.2%) |
| 8 or more Rooms | 2,309 (47.6%) | 136 (10.2%) |
| Total | 4,853 (100.0%) | 1,333 (100.0%) |
Housing Structure by Heating Type in Burke Centre
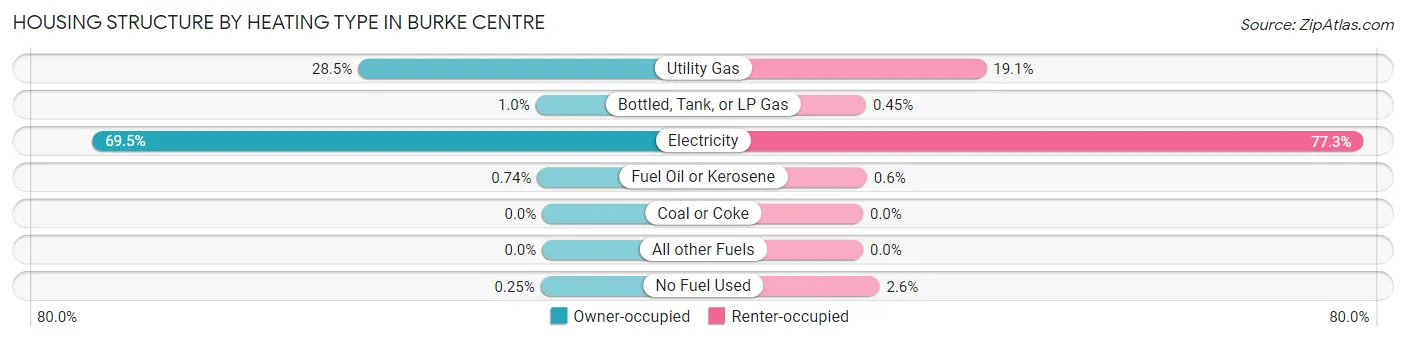
| Heating Type | Owner-occupied | Renter-occupied |
| Utility Gas | 1,381 (28.5%) | 254 (19.1%) |
| Bottled, Tank, or LP Gas | 49 (1.0%) | 6 (0.4%) |
| Electricity | 3,375 (69.5%) | 1,031 (77.3%) |
| Fuel Oil or Kerosene | 36 (0.7%) | 8 (0.6%) |
| Coal or Coke | 0 (0.0%) | 0 (0.0%) |
| All other Fuels | 0 (0.0%) | 0 (0.0%) |
| No Fuel Used | 12 (0.3%) | 34 (2.5%) |
| Total | 4,853 (100.0%) | 1,333 (100.0%) |
Household Vehicle Usage in Burke Centre
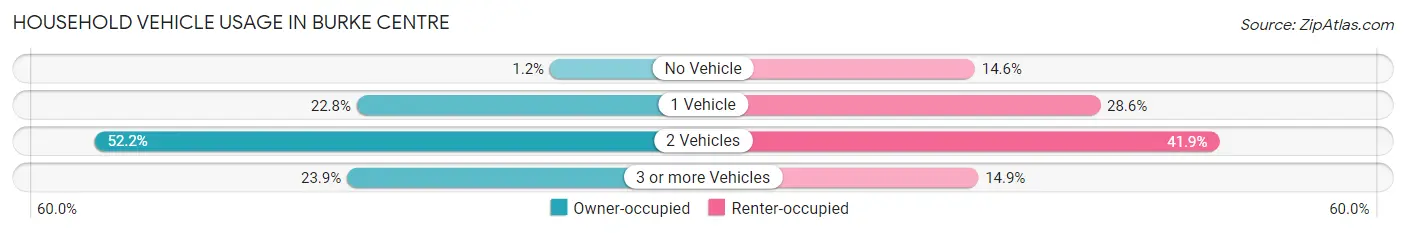
| Vehicles per Household | Owner-occupied | Renter-occupied |
| No Vehicle | 56 (1.1%) | 194 (14.5%) |
| 1 Vehicle | 1,106 (22.8%) | 381 (28.6%) |
| 2 Vehicles | 2,532 (52.2%) | 559 (41.9%) |
| 3 or more Vehicles | 1,159 (23.9%) | 199 (14.9%) |
| Total | 4,853 (100.0%) | 1,333 (100.0%) |
Real Estate & Mortgages in Burke Centre
Real Estate and Mortgage Overview in Burke Centre
| Characteristic | Without Mortgage | With Mortgage |
| Housing Units | 993 | 3,860 |
| Median Property Value | $564,700 | $567,500 |
| Median Household Income | $154,761 | $2,414 |
| Monthly Housing Costs | $876 | $1,336 |
| Real Estate Taxes | $6,394 | $82 |
Property Value by Mortgage Status in Burke Centre
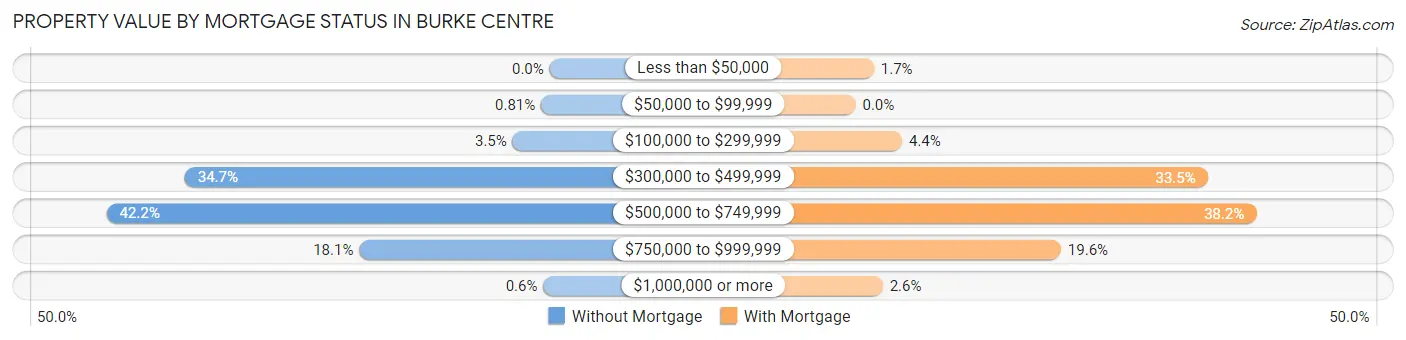
| Property Value | Without Mortgage | With Mortgage |
| Less than $50,000 | 0 (0.0%) | 67 (1.7%) |
| $50,000 to $99,999 | 8 (0.8%) | 0 (0.0%) |
| $100,000 to $299,999 | 35 (3.5%) | 171 (4.4%) |
| $300,000 to $499,999 | 345 (34.7%) | 1,294 (33.5%) |
| $500,000 to $749,999 | 419 (42.2%) | 1,473 (38.2%) |
| $750,000 to $999,999 | 180 (18.1%) | 755 (19.6%) |
| $1,000,000 or more | 6 (0.6%) | 100 (2.6%) |
| Total | 993 (100.0%) | 3,860 (100.0%) |
Household Income by Mortgage Status in Burke Centre
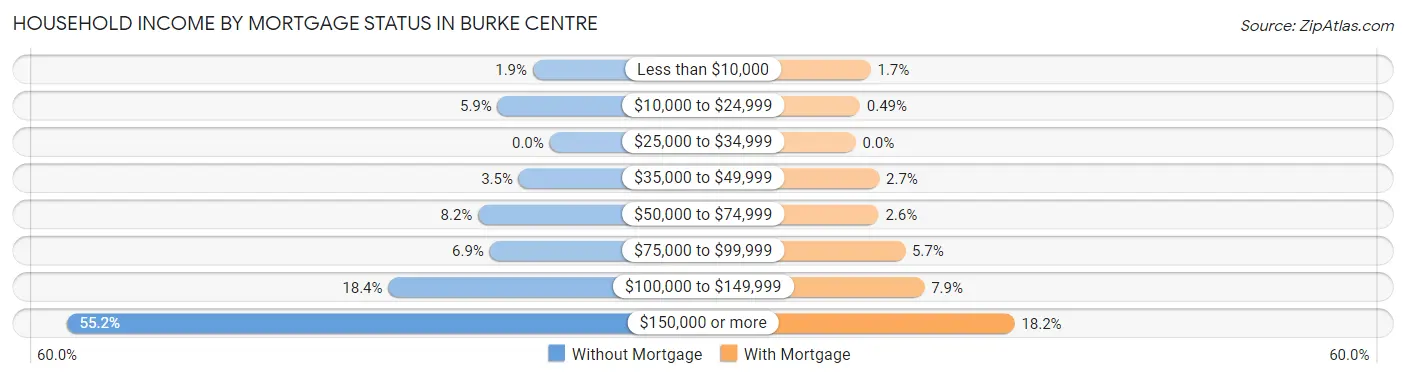
| Household Income | Without Mortgage | With Mortgage |
| Less than $10,000 | 19 (1.9%) | 66 (1.7%) |
| $10,000 to $24,999 | 59 (5.9%) | 19 (0.5%) |
| $25,000 to $34,999 | 0 (0.0%) | 0 (0.0%) |
| $35,000 to $49,999 | 35 (3.5%) | 104 (2.7%) |
| $50,000 to $74,999 | 81 (8.2%) | 101 (2.6%) |
| $75,000 to $99,999 | 68 (6.9%) | 218 (5.7%) |
| $100,000 to $149,999 | 183 (18.4%) | 303 (7.9%) |
| $150,000 or more | 548 (55.2%) | 701 (18.2%) |
| Total | 993 (100.0%) | 3,860 (100.0%) |
Property Value to Household Income Ratio in Burke Centre
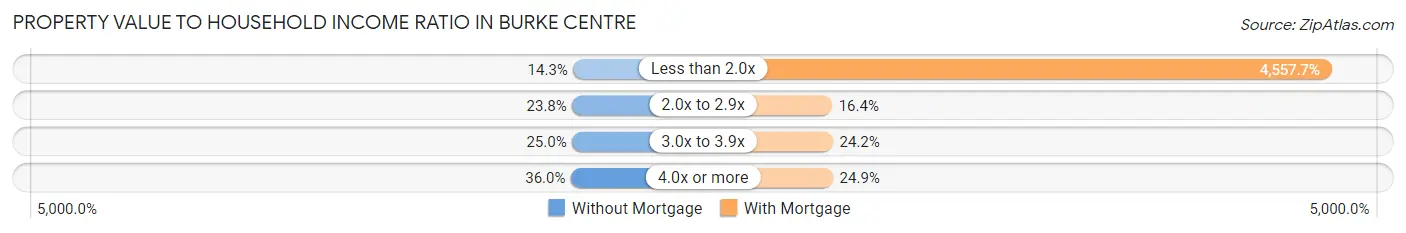
| Value-to-Income Ratio | Without Mortgage | With Mortgage |
| Less than 2.0x | 142 (14.3%) | 175,926 (4,557.7%) |
| 2.0x to 2.9x | 236 (23.8%) | 633 (16.4%) |
| 3.0x to 3.9x | 248 (25.0%) | 935 (24.2%) |
| 4.0x or more | 357 (35.9%) | 962 (24.9%) |
| Total | 993 (100.0%) | 3,860 (100.0%) |
Real Estate Taxes by Mortgage Status in Burke Centre
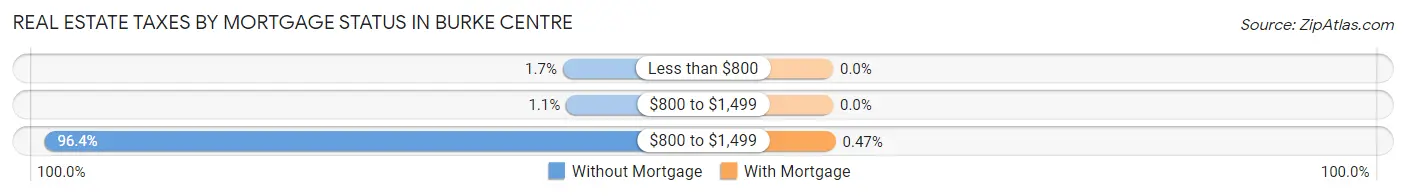
| Property Taxes | Without Mortgage | With Mortgage |
| Less than $800 | 17 (1.7%) | 0 (0.0%) |
| $800 to $1,499 | 11 (1.1%) | 0 (0.0%) |
| $800 to $1,499 | 957 (96.4%) | 18 (0.5%) |
| Total | 993 (100.0%) | 3,860 (100.0%) |
Health & Disability in Burke Centre
Health Insurance Coverage by Age in Burke Centre
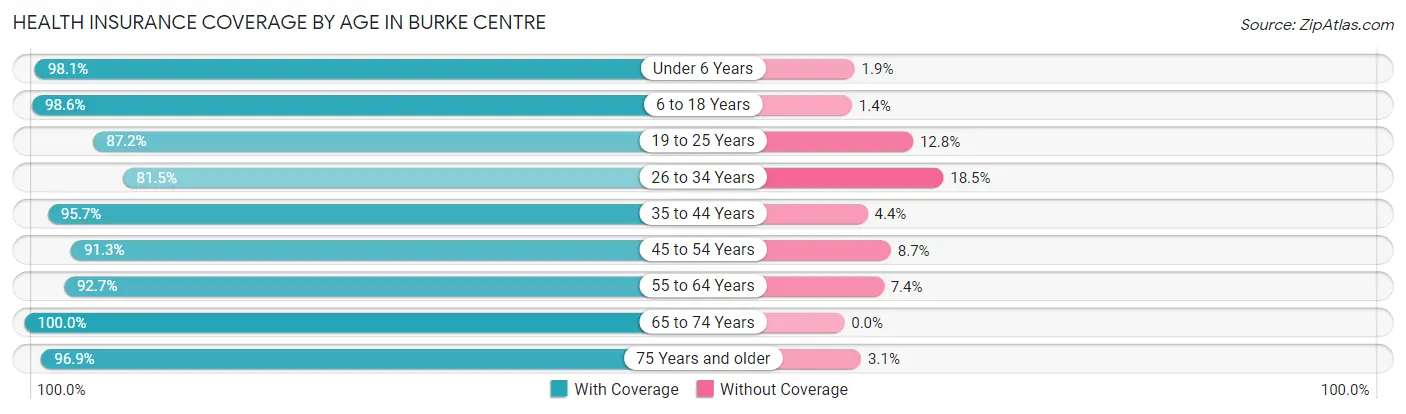
| Age Bracket | With Coverage | Without Coverage |
| Under 6 Years | 1,069 (98.1%) | 21 (1.9%) |
| 6 to 18 Years | 3,327 (98.6%) | 48 (1.4%) |
| 19 to 25 Years | 1,627 (87.2%) | 239 (12.8%) |
| 26 to 34 Years | 1,193 (81.5%) | 270 (18.5%) |
| 35 to 44 Years | 2,726 (95.7%) | 124 (4.3%) |
| 45 to 54 Years | 1,968 (91.3%) | 187 (8.7%) |
| 55 to 64 Years | 2,042 (92.6%) | 162 (7.3%) |
| 65 to 74 Years | 1,746 (100.0%) | 0 (0.0%) |
| 75 Years and older | 803 (96.9%) | 26 (3.1%) |
| Total | 16,501 (93.9%) | 1,077 (6.1%) |
Health Insurance Coverage by Citizenship Status in Burke Centre
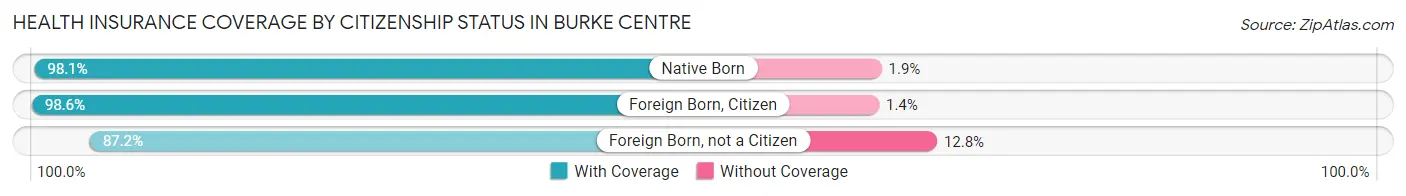
| Citizenship Status | With Coverage | Without Coverage |
| Native Born | 1,069 (98.1%) | 21 (1.9%) |
| Foreign Born, Citizen | 3,327 (98.6%) | 48 (1.4%) |
| Foreign Born, not a Citizen | 1,627 (87.2%) | 239 (12.8%) |
Health Insurance Coverage by Household Income in Burke Centre
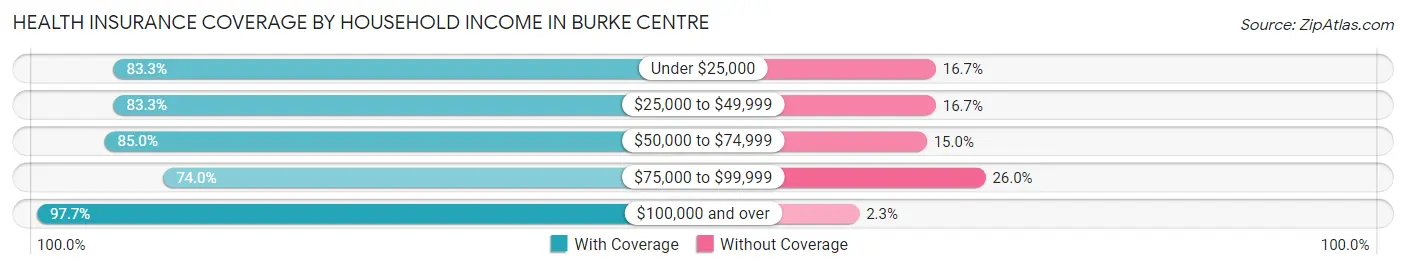
| Household Income | With Coverage | Without Coverage |
| Under $25,000 | 585 (83.3%) | 117 (16.7%) |
| $25,000 to $49,999 | 784 (83.3%) | 157 (16.7%) |
| $50,000 to $74,999 | 874 (85.0%) | 154 (15.0%) |
| $75,000 to $99,999 | 949 (74.0%) | 333 (26.0%) |
| $100,000 and over | 13,308 (97.7%) | 316 (2.3%) |
Public vs Private Health Insurance Coverage by Age in Burke Centre
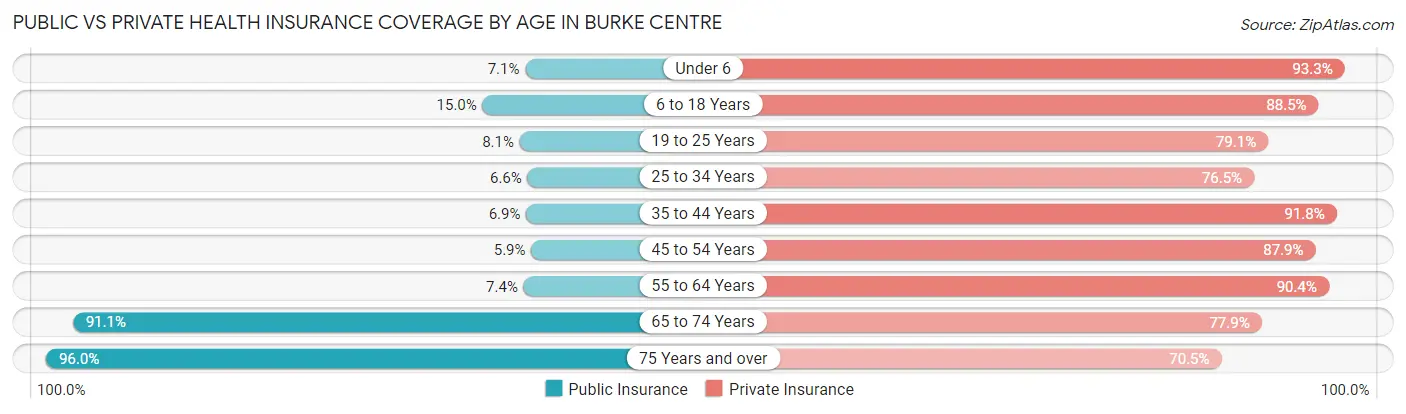
| Age Bracket | Public Insurance | Private Insurance |
| Under 6 | 77 (7.1%) | 1,017 (93.3%) |
| 6 to 18 Years | 506 (15.0%) | 2,986 (88.5%) |
| 19 to 25 Years | 151 (8.1%) | 1,476 (79.1%) |
| 25 to 34 Years | 97 (6.6%) | 1,119 (76.5%) |
| 35 to 44 Years | 196 (6.9%) | 2,617 (91.8%) |
| 45 to 54 Years | 128 (5.9%) | 1,894 (87.9%) |
| 55 to 64 Years | 162 (7.3%) | 1,992 (90.4%) |
| 65 to 74 Years | 1,590 (91.1%) | 1,360 (77.9%) |
| 75 Years and over | 796 (96.0%) | 584 (70.5%) |
| Total | 3,703 (21.1%) | 15,045 (85.6%) |
Disability Status by Sex by Age in Burke Centre
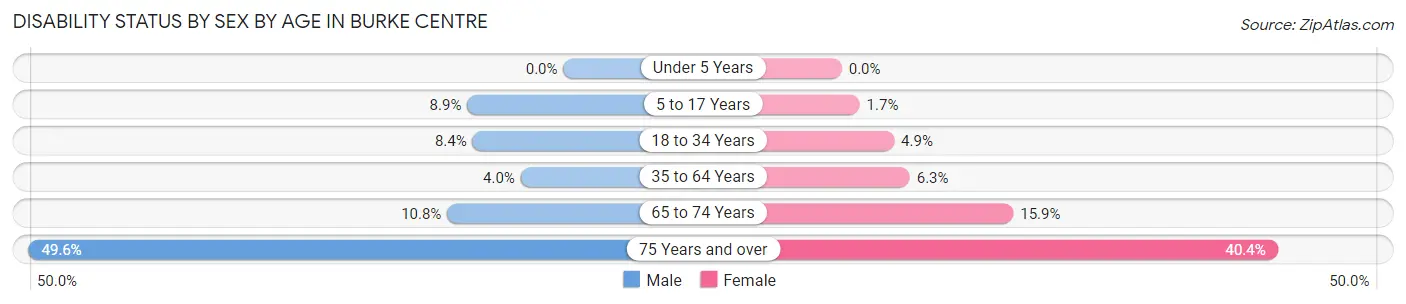
| Age Bracket | Male | Female |
| Under 5 Years | 0 (0.0%) | 0 (0.0%) |
| 5 to 17 Years | 149 (8.9%) | 23 (1.7%) |
| 18 to 34 Years | 175 (8.4%) | 88 (4.9%) |
| 35 to 64 Years | 133 (4.0%) | 243 (6.3%) |
| 65 to 74 Years | 90 (10.8%) | 145 (15.9%) |
| 75 Years and over | 139 (49.6%) | 222 (40.4%) |
Disability Class by Sex by Age in Burke Centre
Disability Class: Hearing Difficulty
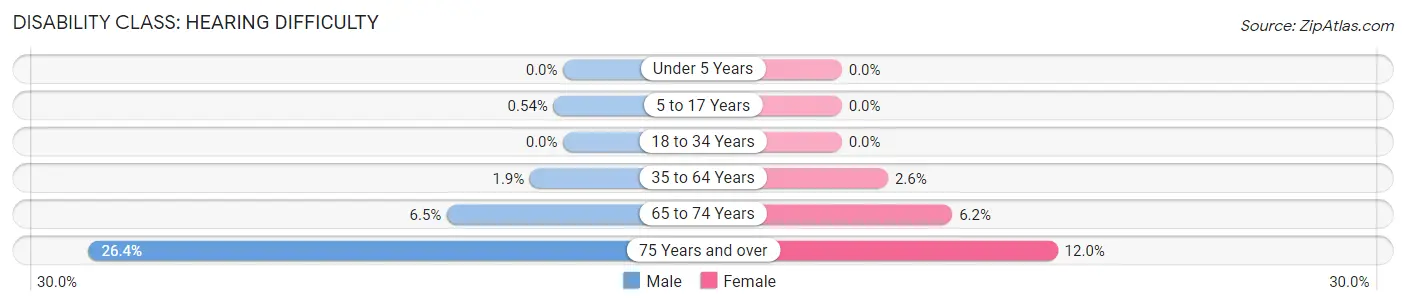
| Age Bracket | Male | Female |
| Under 5 Years | 0 (0.0%) | 0 (0.0%) |
| 5 to 17 Years | 9 (0.5%) | 0 (0.0%) |
| 18 to 34 Years | 0 (0.0%) | 0 (0.0%) |
| 35 to 64 Years | 62 (1.8%) | 99 (2.6%) |
| 65 to 74 Years | 54 (6.5%) | 56 (6.1%) |
| 75 Years and over | 74 (26.4%) | 66 (12.0%) |
Disability Class: Vision Difficulty
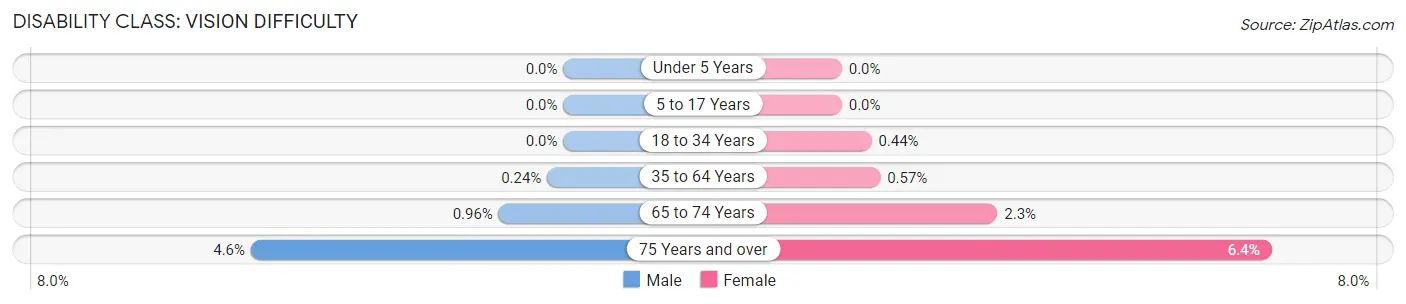
| Age Bracket | Male | Female |
| Under 5 Years | 0 (0.0%) | 0 (0.0%) |
| 5 to 17 Years | 0 (0.0%) | 0 (0.0%) |
| 18 to 34 Years | 0 (0.0%) | 8 (0.4%) |
| 35 to 64 Years | 8 (0.2%) | 22 (0.6%) |
| 65 to 74 Years | 8 (1.0%) | 21 (2.3%) |
| 75 Years and over | 13 (4.6%) | 35 (6.4%) |
Disability Class: Cognitive Difficulty
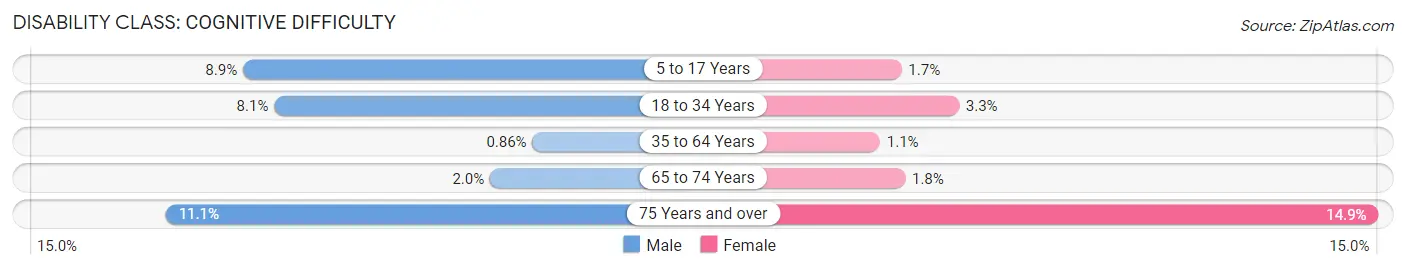
| Age Bracket | Male | Female |
| 5 to 17 Years | 149 (8.9%) | 23 (1.7%) |
| 18 to 34 Years | 167 (8.1%) | 59 (3.3%) |
| 35 to 64 Years | 29 (0.9%) | 41 (1.1%) |
| 65 to 74 Years | 17 (2.0%) | 16 (1.8%) |
| 75 Years and over | 31 (11.1%) | 82 (14.9%) |
Disability Class: Ambulatory Difficulty
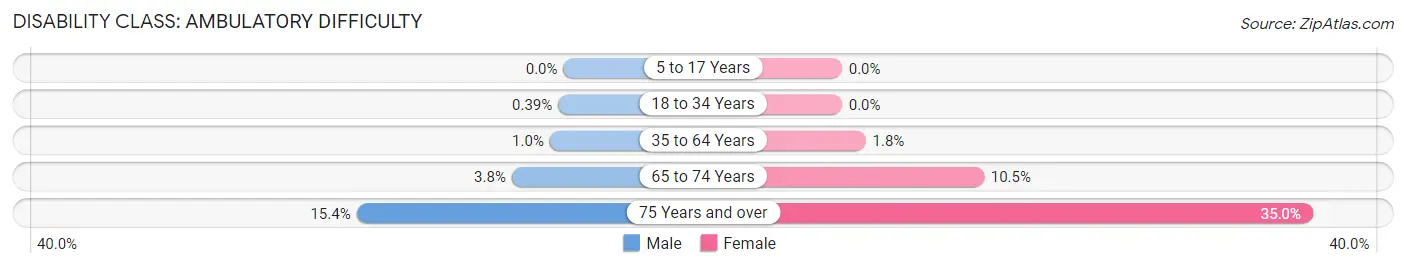
| Age Bracket | Male | Female |
| 5 to 17 Years | 0 (0.0%) | 0 (0.0%) |
| 18 to 34 Years | 8 (0.4%) | 0 (0.0%) |
| 35 to 64 Years | 34 (1.0%) | 68 (1.8%) |
| 65 to 74 Years | 32 (3.8%) | 96 (10.5%) |
| 75 Years and over | 43 (15.4%) | 192 (35.0%) |
Disability Class: Self-Care Difficulty
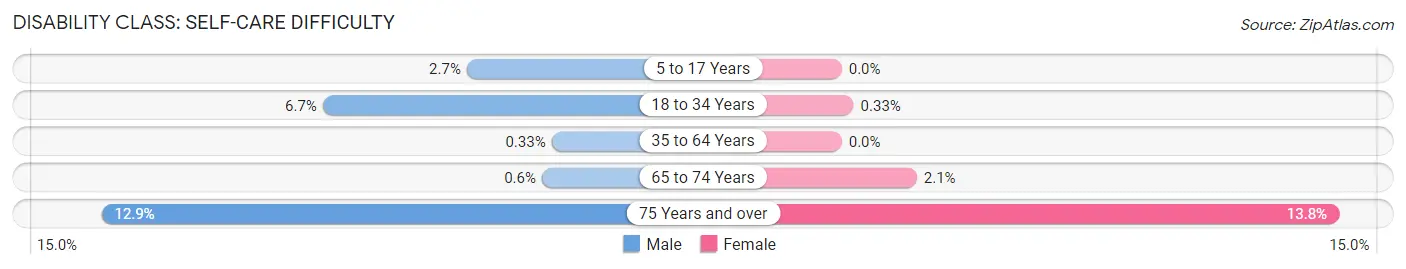
| Age Bracket | Male | Female |
| 5 to 17 Years | 45 (2.7%) | 0 (0.0%) |
| 18 to 34 Years | 139 (6.7%) | 6 (0.3%) |
| 35 to 64 Years | 11 (0.3%) | 0 (0.0%) |
| 65 to 74 Years | 5 (0.6%) | 19 (2.1%) |
| 75 Years and over | 36 (12.9%) | 76 (13.8%) |
Technology Access in Burke Centre
Computing Device Access in Burke Centre
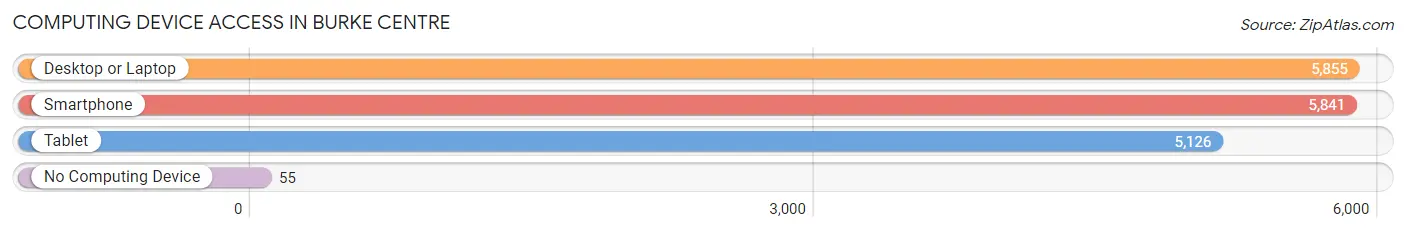
| Device Type | # Households | % Households |
| Desktop or Laptop | 5,855 | 94.7% |
| Smartphone | 5,841 | 94.4% |
| Tablet | 5,126 | 82.9% |
| No Computing Device | 55 | 0.9% |
| Total | 6,186 | 100.0% |
Internet Access in Burke Centre
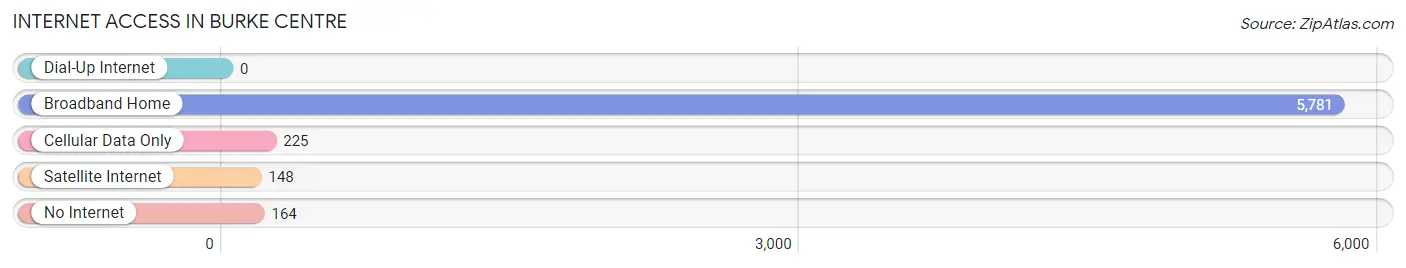
| Internet Type | # Households | % Households |
| Dial-Up Internet | 0 | 0.0% |
| Broadband Home | 5,781 | 93.4% |
| Cellular Data Only | 225 | 3.6% |
| Satellite Internet | 148 | 2.4% |
| No Internet | 164 | 2.6% |
| Total | 6,186 | 100.0% |
Burke Centre Summary
Burke Centre is a census-designated place (CDP) located in Fairfax County, Virginia. It is a planned community that was developed in the 1970s and is located approximately 20 miles southwest of Washington, D.C. The population of Burke Centre was 22,567 at the 2010 census.
History
Burke Centre was originally part of the land owned by the Fairfax family, which included the area now known as Burke. The area was first settled in the late 1700s and was known as the “Burke Settlement”. The area was primarily used for farming and was home to a few small businesses. In the early 1900s, the area began to experience rapid growth due to the development of the Washington and Old Dominion Railroad. This allowed for easy access to Washington, D.C. and other nearby cities.
In the late 1960s, the area was purchased by the Burke Development Corporation and was developed into a planned community. The community was designed to be a self-contained community with its own shopping centers, schools, parks, and recreational facilities. The community was officially incorporated in 1972 and was named after the original Burke Settlement.
Geography
Burke Centre is located in Fairfax County, Virginia. It is situated approximately 20 miles southwest of Washington, D.C. The CDP has a total area of 8.2 square miles, all of which is land. The terrain is mostly flat with some rolling hills. The area is home to several parks, including Burke Lake Park, which is a popular destination for fishing, boating, and other outdoor activities.
Economy
The economy of Burke Centre is largely based on the service industry. The area is home to several large employers, including the Fairfax County Government, the U.S. Department of Defense, and the U.S. Department of Homeland Security. The area is also home to several retail stores, restaurants, and other businesses.
Demographics
As of the 2010 census, the population of Burke Centre was 22,567. The racial makeup of the CDP was 75.3% White, 11.2% African American, 0.3% Native American, 8.2% Asian, 0.1% Pacific Islander, and 4.9% from other races. The median household income was $107,945 and the median family income was $118,945. The per capita income was $41,945.
Burke Centre is a diverse community with a variety of cultures and backgrounds. The area is home to a large number of immigrants from around the world, including India, China, and the Philippines. The area is also home to a large number of families with children, as well as a large number of retirees.
Common Questions
What is Per Capita Income in Burke Centre?
Per Capita income in Burke Centre is $63,423.
What is the Median Family Income in Burke Centre?
Median Family Income in Burke Centre is $175,833.
What is the Median Household income in Burke Centre?
Median Household Income in Burke Centre is $156,421.
What is Income or Wage Gap in Burke Centre?
Income or Wage Gap in Burke Centre is 42.8%.
Women in Burke Centre earn 57.2 cents for every dollar earned by a man.
What is Inequality or Gini Index in Burke Centre?
Inequality or Gini Index in Burke Centre is 0.38.
What is the Total Population of Burke Centre?
Total Population of Burke Centre is 17,926.
What is the Total Male Population of Burke Centre?
Total Male Population of Burke Centre is 8,897.
What is the Total Female Population of Burke Centre?
Total Female Population of Burke Centre is 9,029.
What is the Ratio of Males per 100 Females in Burke Centre?
There are 98.54 Males per 100 Females in Burke Centre.
What is the Ratio of Females per 100 Males in Burke Centre?
There are 101.48 Females per 100 Males in Burke Centre.
What is the Median Population Age in Burke Centre?
Median Population Age in Burke Centre is 37.8 Years.
What is the Average Family Size in Burke Centre
Average Family Size in Burke Centre is 3.3 People.
What is the Average Household Size in Burke Centre
Average Household Size in Burke Centre is 2.9 People.
How Large is the Labor Force in Burke Centre?
There are 9,925 People in the Labor Forcein in Burke Centre.
What is the Percentage of People in the Labor Force in Burke Centre?
69.1% of People are in the Labor Force in Burke Centre.
What is the Unemployment Rate in Burke Centre?
Unemployment Rate in Burke Centre is 5.4%.