Madison Heights, VA Map & Demographics
Madison Heights Map
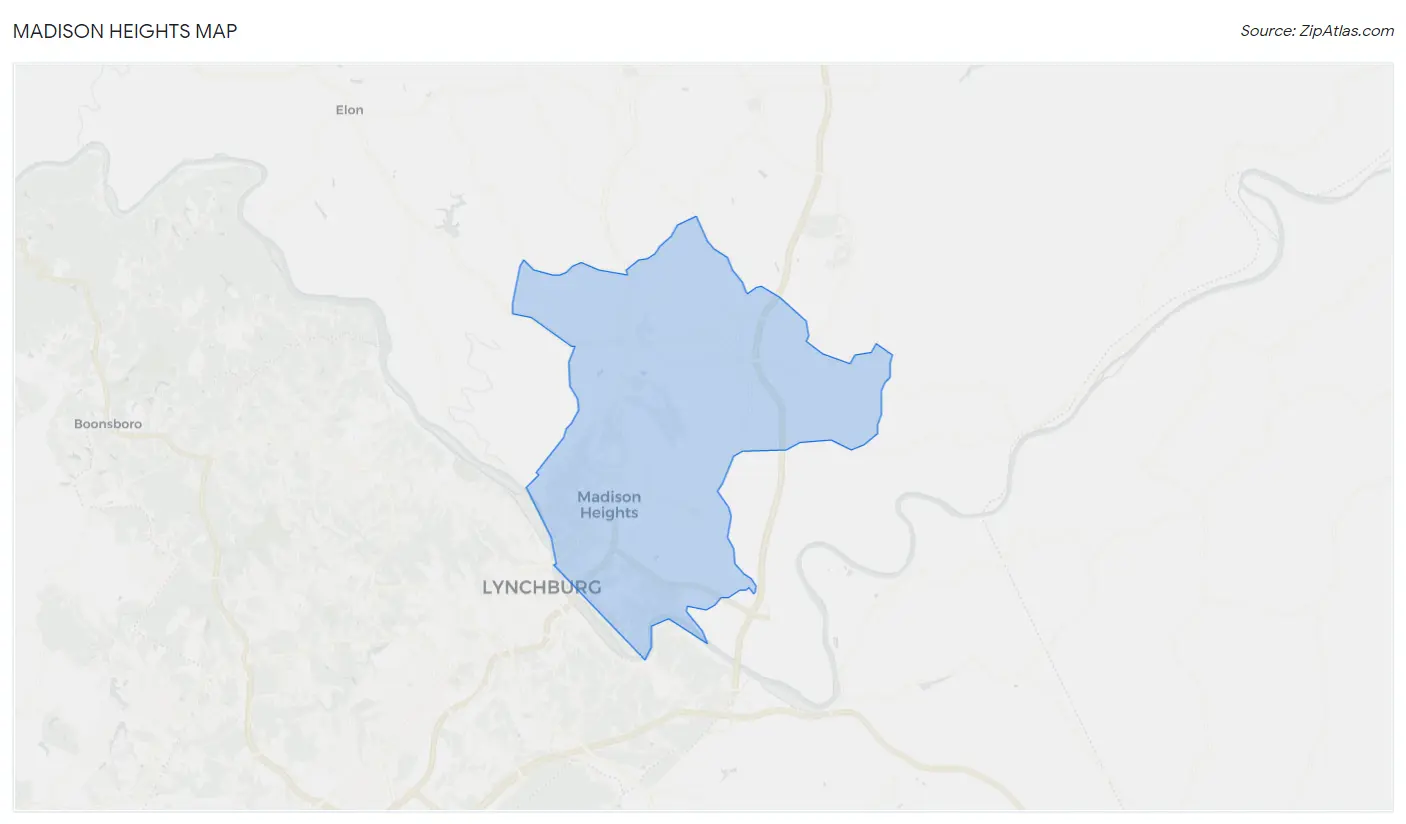
Madison Heights Overview
$32,380
PER CAPITA INCOME
$78,150
AVG FAMILY INCOME
$59,570
AVG HOUSEHOLD INCOME
14.0%
WAGE / INCOME GAP [ % ]
86.0¢/ $1
WAGE / INCOME GAP [ $ ]
0.45
INEQUALITY / GINI INDEX
10,694
TOTAL POPULATION
5,191
MALE POPULATION
5,503
FEMALE POPULATION
94.33
MALES / 100 FEMALES
106.01
FEMALES / 100 MALES
44.1
MEDIAN AGE
3.0
AVG FAMILY SIZE
2.3
AVG HOUSEHOLD SIZE
5,472
LABOR FORCE [ PEOPLE ]
62.6%
PERCENT IN LABOR FORCE
5.1%
UNEMPLOYMENT RATE
Madison Heights Zip Codes
Madison Heights Area Codes
Income in Madison Heights
Income Overview in Madison Heights
Per Capita Income in Madison Heights is $32,380, while median incomes of families and households are $78,150 and $59,570 respectively.
| Characteristic | Number | Measure |
| Per Capita Income | 10,694 | $32,380 |
| Median Family Income | 2,712 | $78,150 |
| Mean Family Income | 2,712 | $99,440 |
| Median Household Income | 4,656 | $59,570 |
| Mean Household Income | 4,656 | $75,363 |
| Income Deficit | 2,712 | $0 |
| Wage / Income Gap (%) | 10,694 | 13.96% |
| Wage / Income Gap ($) | 10,694 | 86.04¢ per $1 |
| Gini / Inequality Index | 10,694 | 0.45 |
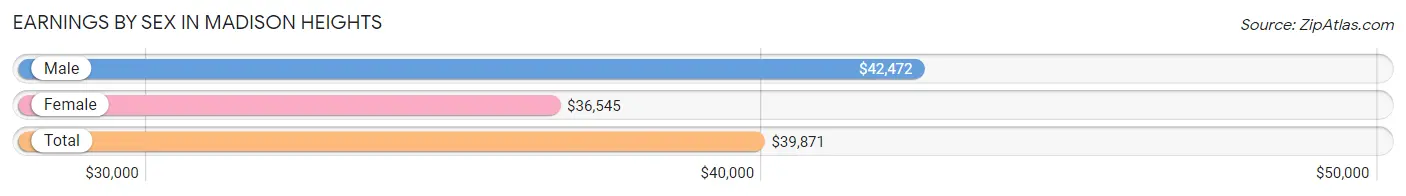
Earnings by Sex in Madison Heights
Average Earnings in Madison Heights are $39,871, $42,472 for men and $36,545 for women, a difference of 14.0%.
| Sex | Number | Average Earnings |
| Male | 2,673 (48.6%) | $42,472 |
| Female | 2,825 (51.4%) | $36,545 |
| Total | 5,498 (100.0%) | $39,871 |
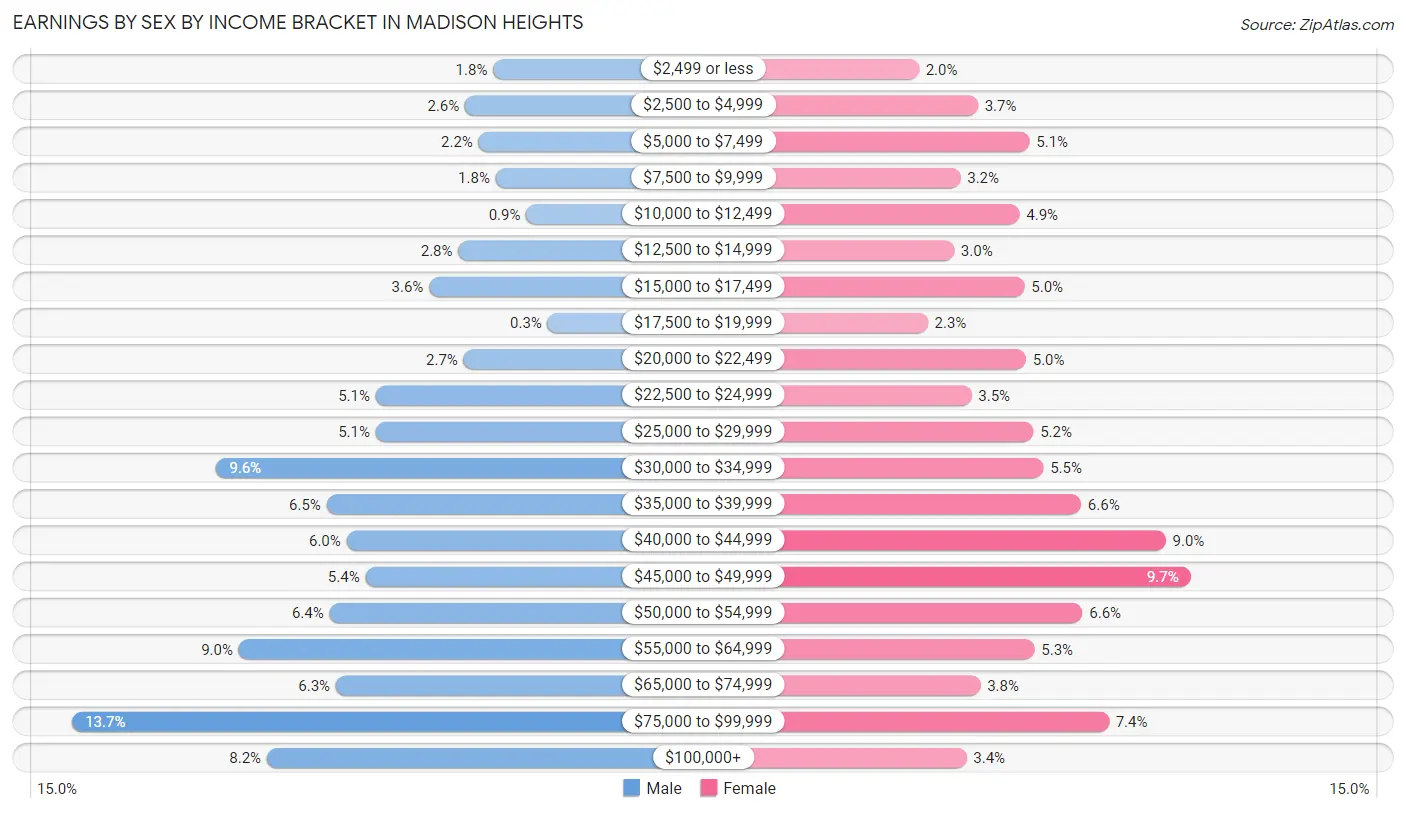
Earnings by Sex by Income Bracket in Madison Heights
The most common earnings brackets in Madison Heights are $75,000 to $99,999 for men (365 | 13.7%) and $45,000 to $49,999 for women (273 | 9.7%).
| Income | Male | Female |
| $2,499 or less | 49 (1.8%) | 57 (2.0%) |
| $2,500 to $4,999 | 70 (2.6%) | 104 (3.7%) |
| $5,000 to $7,499 | 60 (2.2%) | 145 (5.1%) |
| $7,500 to $9,999 | 47 (1.8%) | 90 (3.2%) |
| $10,000 to $12,499 | 24 (0.9%) | 137 (4.9%) |
| $12,500 to $14,999 | 75 (2.8%) | 85 (3.0%) |
| $15,000 to $17,499 | 97 (3.6%) | 141 (5.0%) |
| $17,500 to $19,999 | 8 (0.3%) | 64 (2.3%) |
| $20,000 to $22,499 | 71 (2.7%) | 142 (5.0%) |
| $22,500 to $24,999 | 137 (5.1%) | 99 (3.5%) |
| $25,000 to $29,999 | 137 (5.1%) | 148 (5.2%) |
| $30,000 to $34,999 | 257 (9.6%) | 156 (5.5%) |
| $35,000 to $39,999 | 174 (6.5%) | 186 (6.6%) |
| $40,000 to $44,999 | 159 (5.9%) | 253 (9.0%) |
| $45,000 to $49,999 | 145 (5.4%) | 273 (9.7%) |
| $50,000 to $54,999 | 172 (6.4%) | 187 (6.6%) |
| $55,000 to $64,999 | 240 (9.0%) | 149 (5.3%) |
| $65,000 to $74,999 | 167 (6.2%) | 106 (3.7%) |
| $75,000 to $99,999 | 365 (13.7%) | 208 (7.4%) |
| $100,000+ | 219 (8.2%) | 95 (3.4%) |
| Total | 2,673 (100.0%) | 2,825 (100.0%) |
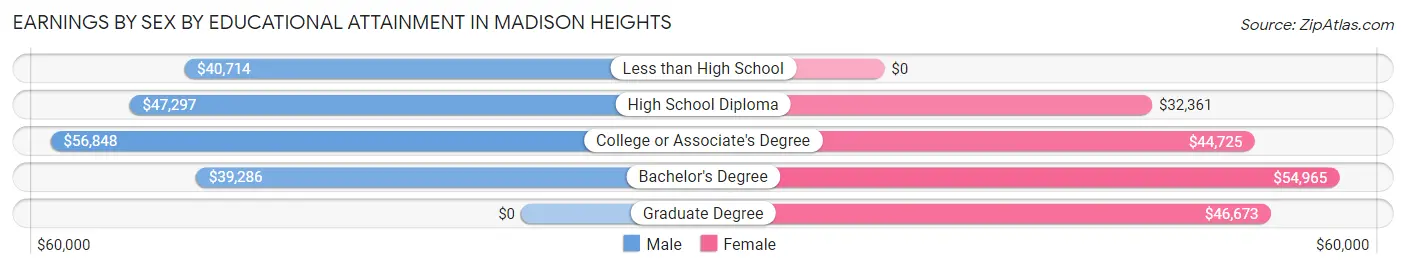
Earnings by Sex by Educational Attainment in Madison Heights
Average earnings in Madison Heights are $49,130 for men and $41,920 for women, a difference of 14.7%. Men with an educational attainment of college or associate's degree enjoy the highest average annual earnings of $56,848, while those with bachelor's degree education earn the least with $39,286. Women with an educational attainment of bachelor's degree earn the most with the average annual earnings of $54,965, while those with high school diploma education have the smallest earnings of $32,361.
| Educational Attainment | Male Income | Female Income |
| Less than High School | $40,714 | $0 |
| High School Diploma | $47,297 | $32,361 |
| College or Associate's Degree | $56,848 | $44,725 |
| Bachelor's Degree | $39,286 | $54,965 |
| Graduate Degree | - | - |
| Total | $49,130 | $41,920 |
Family Income in Madison Heights
Family Income Brackets in Madison Heights
According to the Madison Heights family income data, there are 705 families falling into the $100,000 to $149,999 income range, which is the most common income bracket and makes up 26.0% of all families. Conversely, the $10,000 to $14,999 income bracket is the least frequent group with only 19 families (0.7%) belonging to this category.
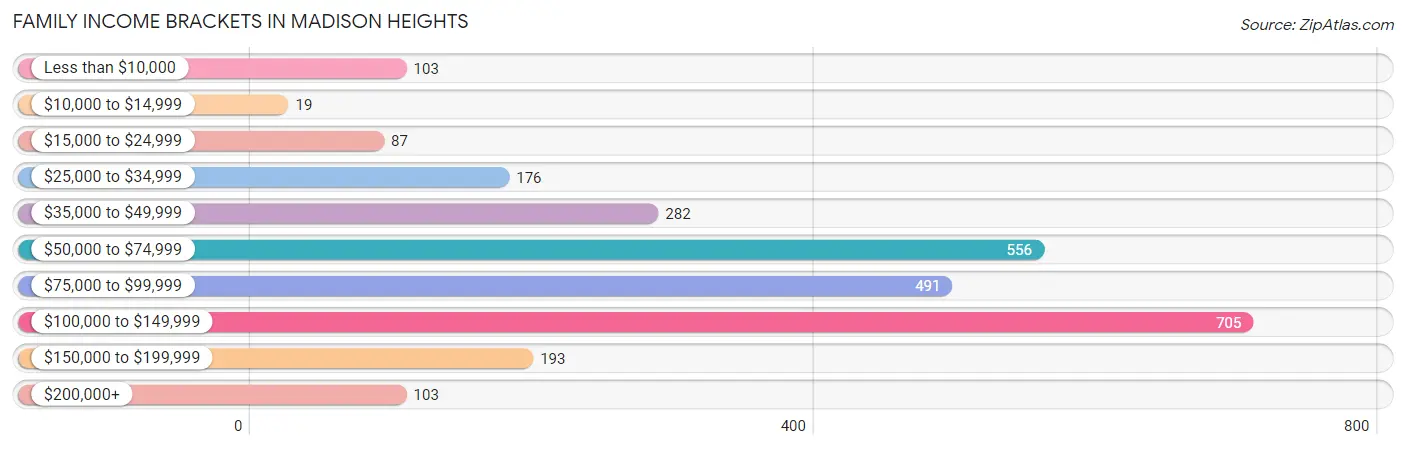
| Income Bracket | # Families | % Families |
| Less than $10,000 | 103 | 3.8% |
| $10,000 to $14,999 | 19 | 0.7% |
| $15,000 to $24,999 | 87 | 3.2% |
| $25,000 to $34,999 | 176 | 6.5% |
| $35,000 to $49,999 | 282 | 10.4% |
| $50,000 to $74,999 | 556 | 20.5% |
| $75,000 to $99,999 | 491 | 18.1% |
| $100,000 to $149,999 | 705 | 26.0% |
| $150,000 to $199,999 | 193 | 7.1% |
| $200,000+ | 103 | 3.8% |
Family Income by Famaliy Size in Madison Heights
6-person families (83 | 3.1%) account for the highest median family income in Madison Heights with $133,542 per family, while 3-person families (560 | 20.6%) have the highest median income of $33,258 per family member.
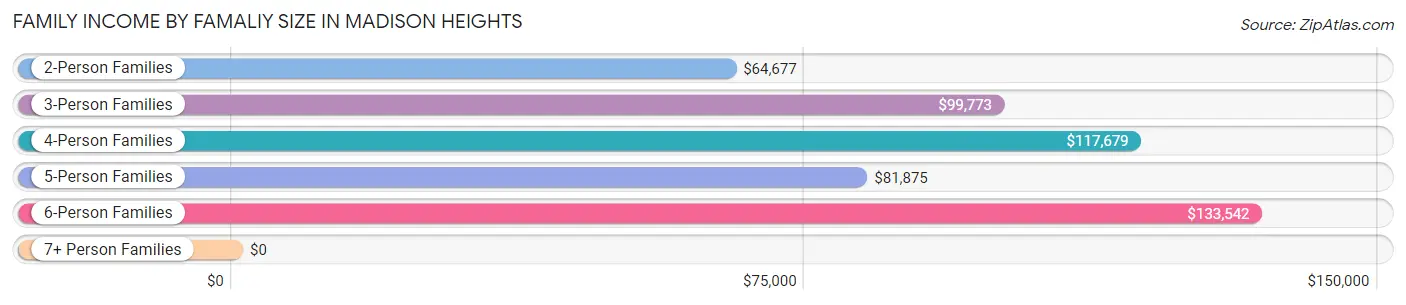
| Income Bracket | # Families | Median Income |
| 2-Person Families | 1,372 (50.6%) | $64,677 |
| 3-Person Families | 560 (20.6%) | $99,773 |
| 4-Person Families | 451 (16.6%) | $117,679 |
| 5-Person Families | 213 (7.9%) | $81,875 |
| 6-Person Families | 83 (3.1%) | $133,542 |
| 7+ Person Families | 33 (1.2%) | $0 |
| Total | 2,712 (100.0%) | $78,150 |
Family Income by Number of Earners in Madison Heights
The median family income in Madison Heights is $78,150, with families comprising 3+ earners (282) having the highest median family income of $134,722, while families with no earners (484) have the lowest median family income of $35,132, accounting for 10.4% and 17.8% of families, respectively.
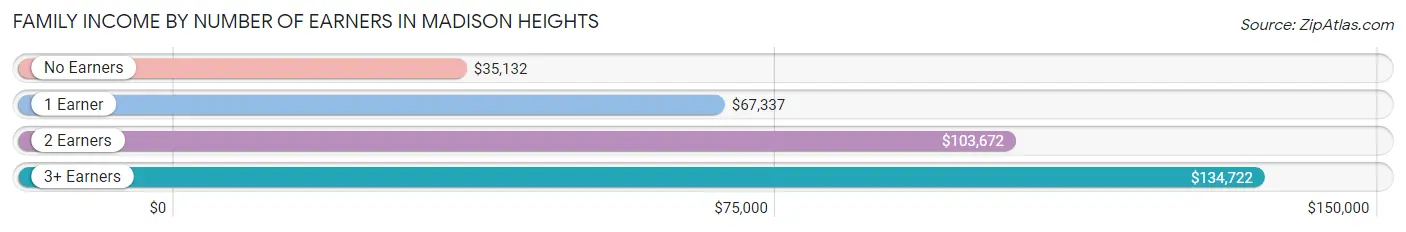
| Number of Earners | # Families | Median Income |
| No Earners | 484 (17.8%) | $35,132 |
| 1 Earner | 963 (35.5%) | $67,337 |
| 2 Earners | 983 (36.2%) | $103,672 |
| 3+ Earners | 282 (10.4%) | $134,722 |
| Total | 2,712 (100.0%) | $78,150 |
Household Income in Madison Heights
Household Income Brackets in Madison Heights
With 843 households falling in the category, the $100,000 to $149,999 income range is the most frequent in Madison Heights, accounting for 18.1% of all households. In contrast, only 102 households (2.2%) fall into the $200,000+ income bracket, making it the least populous group.
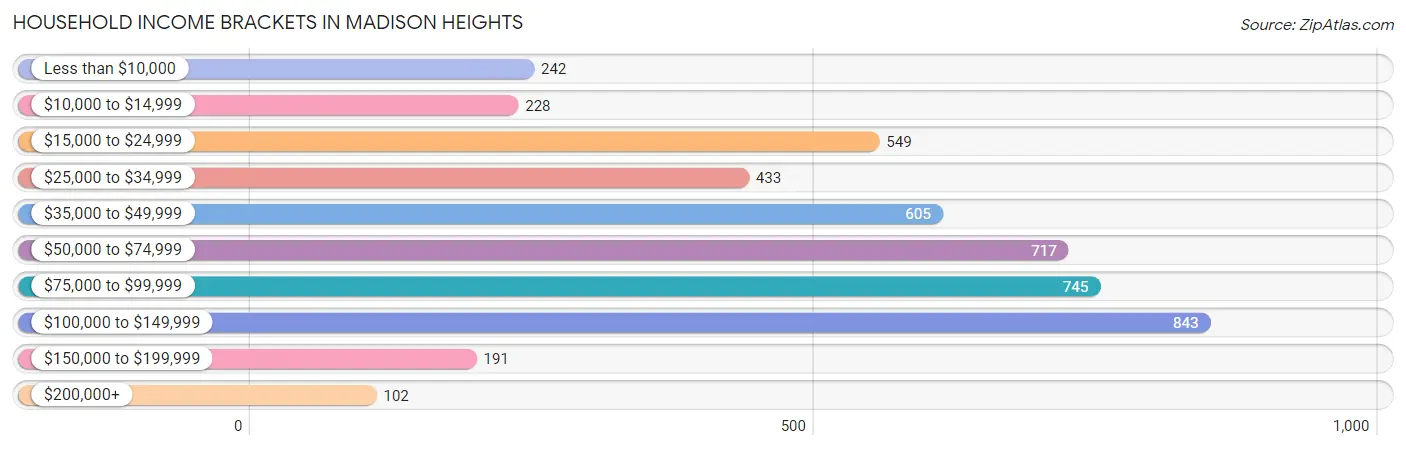
| Income Bracket | # Households | % Households |
| Less than $10,000 | 242 | 5.2% |
| $10,000 to $14,999 | 228 | 4.9% |
| $15,000 to $24,999 | 549 | 11.8% |
| $25,000 to $34,999 | 433 | 9.3% |
| $35,000 to $49,999 | 605 | 13.0% |
| $50,000 to $74,999 | 717 | 15.4% |
| $75,000 to $99,999 | 745 | 16.0% |
| $100,000 to $149,999 | 843 | 18.1% |
| $150,000 to $199,999 | 191 | 4.1% |
| $200,000+ | 102 | 2.2% |
Household Income by Householder Age in Madison Heights
The median household income in Madison Heights is $59,570, with the highest median household income of $82,500 found in the 15 to 24 years age bracket for the primary householder. A total of 138 households (3.0%) fall into this category. Meanwhile, the 65+ years age bracket for the primary householder has the lowest median household income of $42,469, with 1,573 households (33.8%) in this group.
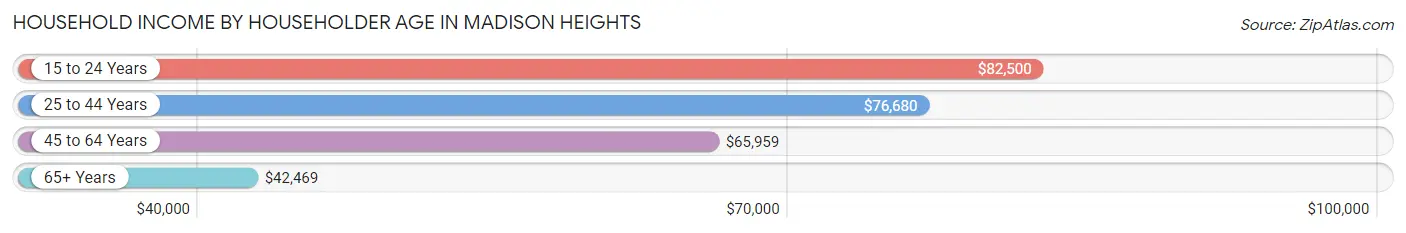
| Income Bracket | # Households | Median Income |
| 15 to 24 Years | 138 (3.0%) | $82,500 |
| 25 to 44 Years | 1,336 (28.7%) | $76,680 |
| 45 to 64 Years | 1,609 (34.6%) | $65,959 |
| 65+ Years | 1,573 (33.8%) | $42,469 |
| Total | 4,656 (100.0%) | $59,570 |
Poverty in Madison Heights
Income Below Poverty by Sex and Age in Madison Heights
With 10.0% poverty level for males and 9.6% for females among the residents of Madison Heights, 6 to 11 year old males and 16 and 17 year old females are the most vulnerable to poverty, with 78 males (18.4%) and 32 females (30.8%) in their respective age groups living below the poverty level.
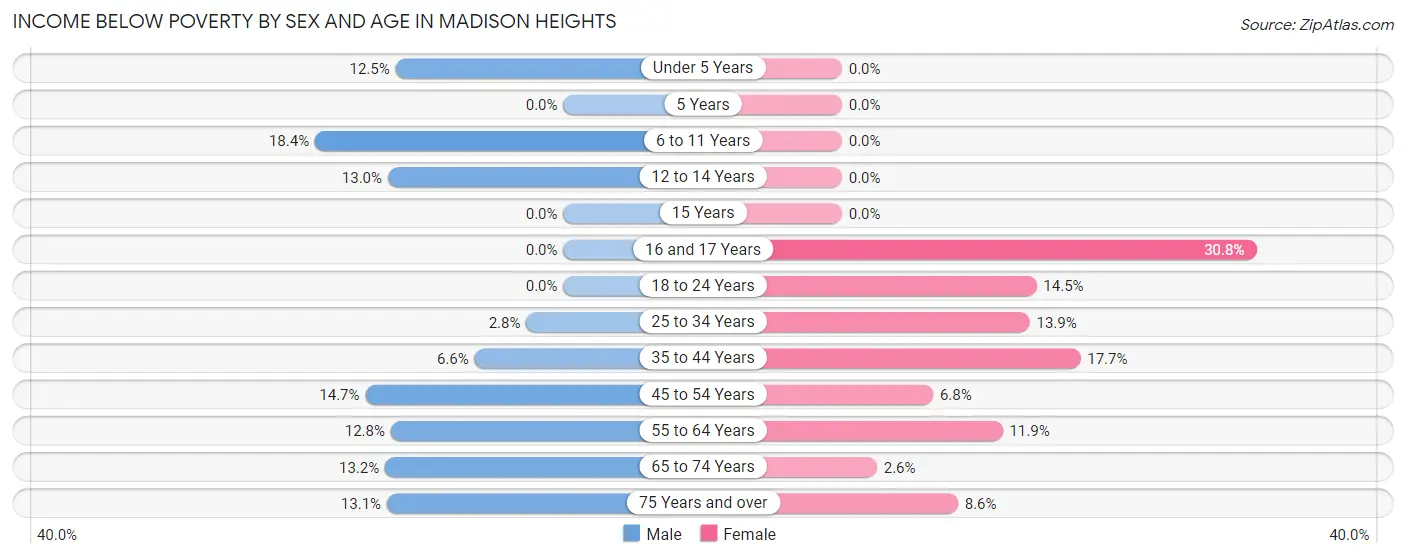
| Age Bracket | Male | Female |
| Under 5 Years | 41 (12.5%) | 0 (0.0%) |
| 5 Years | 0 (0.0%) | 0 (0.0%) |
| 6 to 11 Years | 78 (18.4%) | 0 (0.0%) |
| 12 to 14 Years | 31 (13.0%) | 0 (0.0%) |
| 15 Years | 0 (0.0%) | 0 (0.0%) |
| 16 and 17 Years | 0 (0.0%) | 32 (30.8%) |
| 18 to 24 Years | 0 (0.0%) | 62 (14.4%) |
| 25 to 34 Years | 16 (2.8%) | 69 (13.9%) |
| 35 to 44 Years | 38 (6.6%) | 136 (17.7%) |
| 45 to 54 Years | 97 (14.7%) | 41 (6.8%) |
| 55 to 64 Years | 93 (12.8%) | 109 (11.9%) |
| 65 to 74 Years | 67 (13.2%) | 17 (2.6%) |
| 75 Years and over | 55 (13.1%) | 62 (8.6%) |
| Total | 516 (10.0%) | 528 (9.6%) |
Income Above Poverty by Sex and Age in Madison Heights
According to the poverty statistics in Madison Heights, males aged 5 years and females aged under 5 years are the age groups that are most secure financially, with 100.0% of males and 100.0% of females in these age groups living above the poverty line.
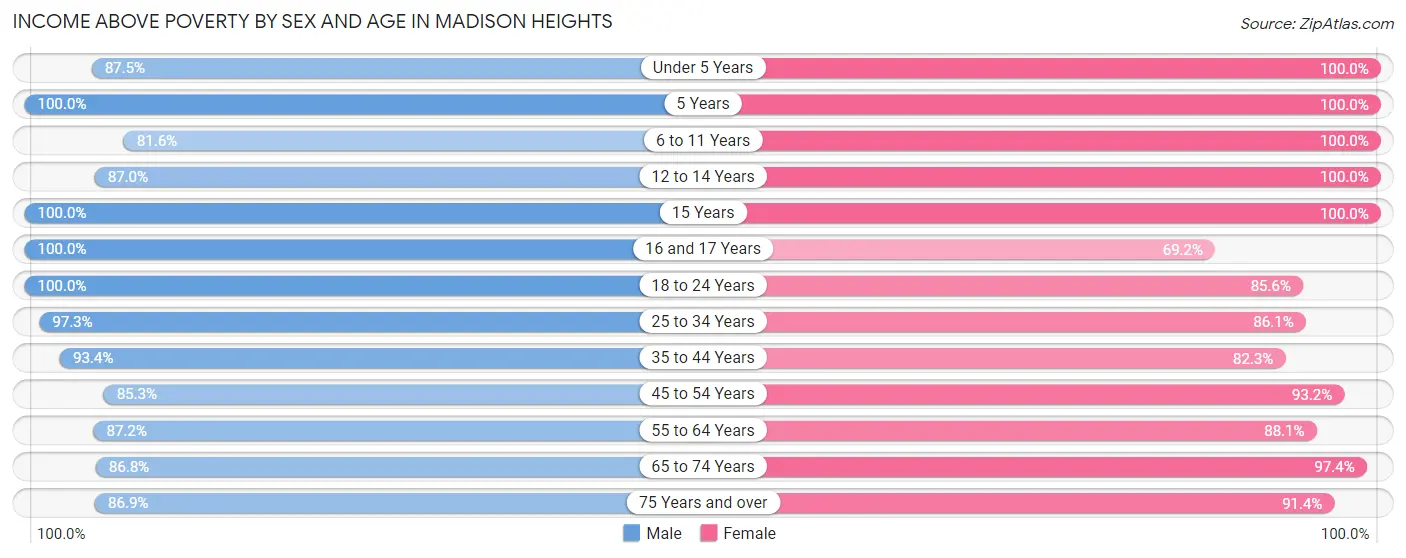
| Age Bracket | Male | Female |
| Under 5 Years | 288 (87.5%) | 248 (100.0%) |
| 5 Years | 29 (100.0%) | 96 (100.0%) |
| 6 to 11 Years | 345 (81.6%) | 251 (100.0%) |
| 12 to 14 Years | 207 (87.0%) | 126 (100.0%) |
| 15 Years | 112 (100.0%) | 79 (100.0%) |
| 16 and 17 Years | 99 (100.0%) | 72 (69.2%) |
| 18 to 24 Years | 481 (100.0%) | 367 (85.6%) |
| 25 to 34 Years | 566 (97.3%) | 426 (86.1%) |
| 35 to 44 Years | 539 (93.4%) | 632 (82.3%) |
| 45 to 54 Years | 563 (85.3%) | 565 (93.2%) |
| 55 to 64 Years | 633 (87.2%) | 805 (88.1%) |
| 65 to 74 Years | 439 (86.8%) | 638 (97.4%) |
| 75 Years and over | 365 (86.9%) | 658 (91.4%) |
| Total | 4,666 (90.0%) | 4,963 (90.4%) |
Income Below Poverty Among Married-Couple Families in Madison Heights
The poverty statistics for married-couple families in Madison Heights show that 3.0% or 56 of the total 1,888 families live below the poverty line. Families with no children have the highest poverty rate of 3.8%, comprising of 44 families. On the other hand, families with 3 or 4 children have the lowest poverty rate of 0.0%, which includes 0 families.
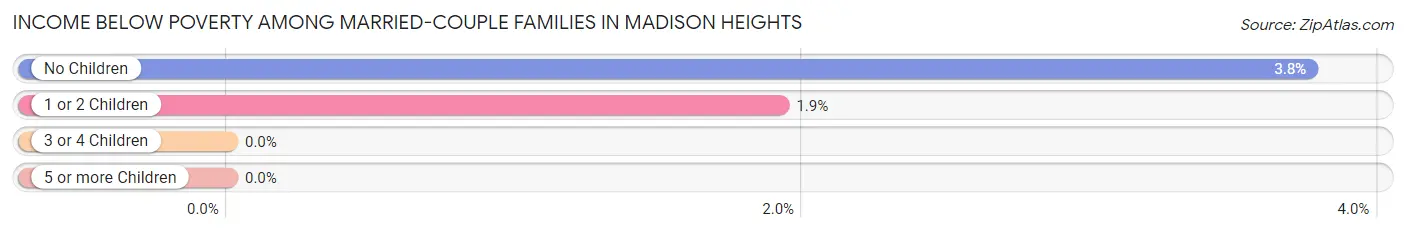
| Children | Above Poverty | Below Poverty |
| No Children | 1,127 (96.2%) | 44 (3.8%) |
| 1 or 2 Children | 613 (98.1%) | 12 (1.9%) |
| 3 or 4 Children | 92 (100.0%) | 0 (0.0%) |
| 5 or more Children | 0 (0.0%) | 0 (0.0%) |
| Total | 1,832 (97.0%) | 56 (3.0%) |
Income Below Poverty Among Single-Parent Households in Madison Heights
According to the poverty data in Madison Heights, 14.7% or 23 single-father households and 12.6% or 84 single-mother households are living below the poverty line. Among single-father households, those with no children have the highest poverty rate, with 23 households (31.5%) experiencing poverty. Likewise, among single-mother households, those with 3 or 4 children have the highest poverty rate, with 32 households (42.7%) falling below the poverty line.
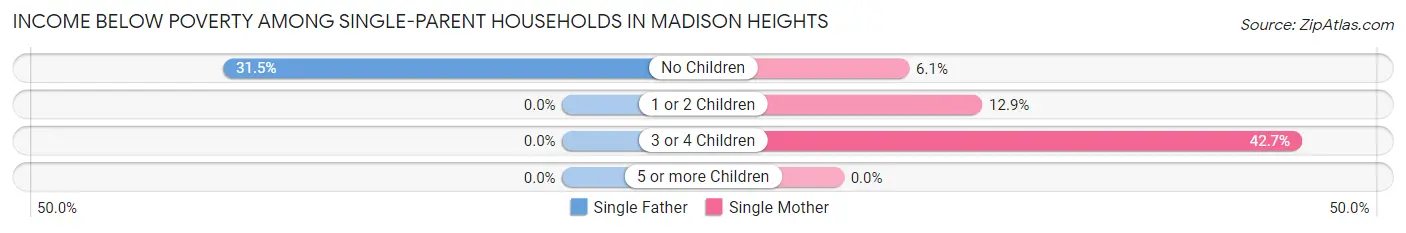
| Children | Single Father | Single Mother |
| No Children | 23 (31.5%) | 20 (6.1%) |
| 1 or 2 Children | 0 (0.0%) | 32 (12.9%) |
| 3 or 4 Children | 0 (0.0%) | 32 (42.7%) |
| 5 or more Children | 0 (0.0%) | 0 (0.0%) |
| Total | 23 (14.7%) | 84 (12.6%) |
Income Below Poverty Among Married-Couple vs Single-Parent Households in Madison Heights
The poverty data for Madison Heights shows that 56 of the married-couple family households (3.0%) and 107 of the single-parent households (13.0%) are living below the poverty level. Within the married-couple family households, those with no children have the highest poverty rate, with 44 households (3.8%) falling below the poverty line. Among the single-parent households, those with 3 or 4 children have the highest poverty rate, with 32 household (29.1%) living below poverty.
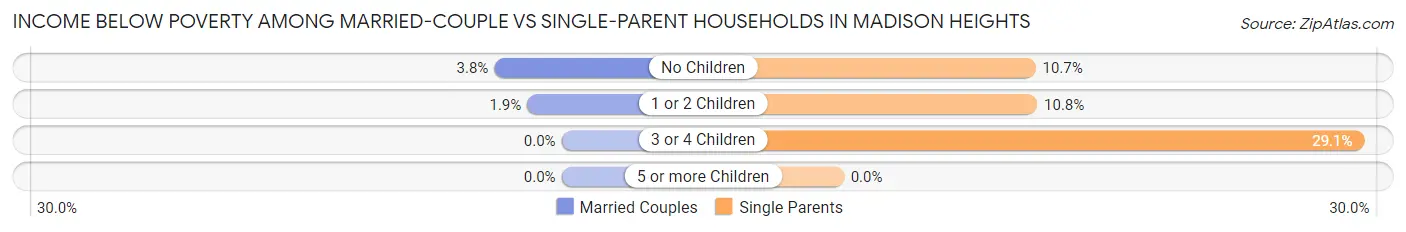
| Children | Married-Couple Families | Single-Parent Households |
| No Children | 44 (3.8%) | 43 (10.7%) |
| 1 or 2 Children | 12 (1.9%) | 32 (10.8%) |
| 3 or 4 Children | 0 (0.0%) | 32 (29.1%) |
| 5 or more Children | 0 (0.0%) | 0 (0.0%) |
| Total | 56 (3.0%) | 107 (13.0%) |
Race in Madison Heights
The most populous races in Madison Heights are White / Caucasian (7,643 | 71.5%), Black / African American (2,453 | 22.9%), and Two or more Races (372 | 3.5%).
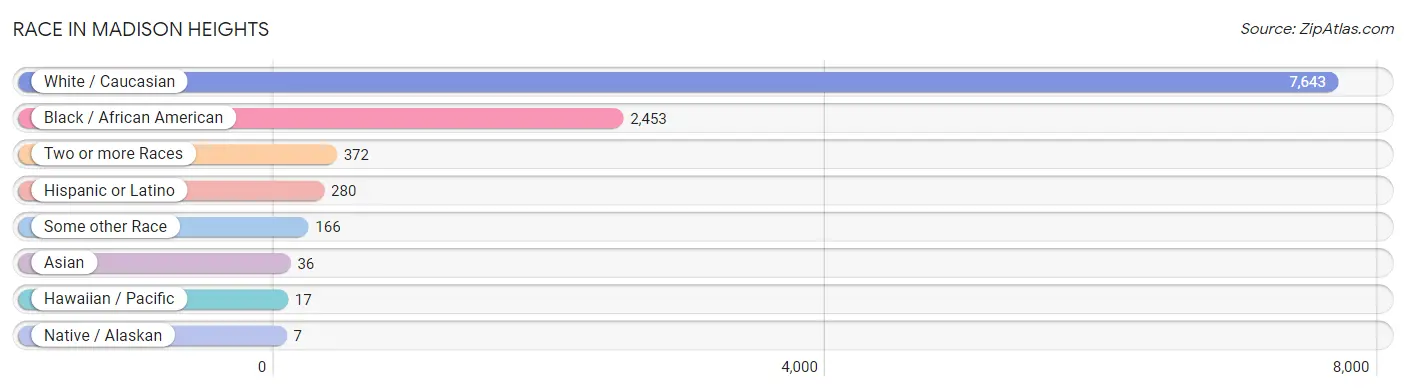
| Race | # Population | % Population |
| Asian | 36 | 0.3% |
| Black / African American | 2,453 | 22.9% |
| Hawaiian / Pacific | 17 | 0.2% |
| Hispanic or Latino | 280 | 2.6% |
| Native / Alaskan | 7 | 0.1% |
| White / Caucasian | 7,643 | 71.5% |
| Two or more Races | 372 | 3.5% |
| Some other Race | 166 | 1.5% |
| Total | 10,694 | 100.0% |
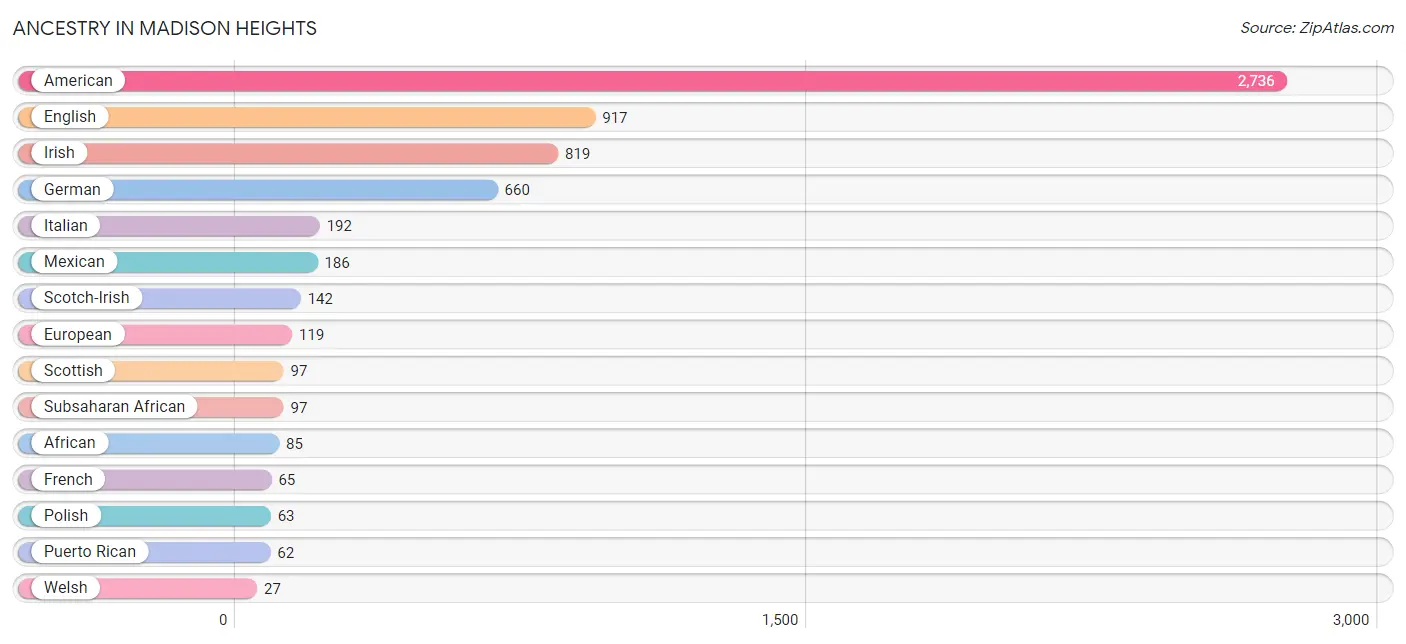
Ancestry in Madison Heights
The most populous ancestries reported in Madison Heights are American (2,736 | 25.6%), English (917 | 8.6%), Irish (819 | 7.7%), German (660 | 6.2%), and Italian (192 | 1.8%), together accounting for 49.8% of all Madison Heights residents.
| Ancestry | # Population | % Population |
| African | 85 | 0.8% |
| American | 2,736 | 25.6% |
| Austrian | 17 | 0.2% |
| British | 25 | 0.2% |
| Central American | 14 | 0.1% |
| Cherokee | 1 | 0.0% |
| Chippewa | 7 | 0.1% |
| Dutch | 25 | 0.2% |
| English | 917 | 8.6% |
| European | 119 | 1.1% |
| Filipino | 14 | 0.1% |
| Finnish | 4 | 0.0% |
| French | 65 | 0.6% |
| French Canadian | 14 | 0.1% |
| German | 660 | 6.2% |
| Hungarian | 22 | 0.2% |
| Indian (Asian) | 5 | 0.1% |
| Irish | 819 | 7.7% |
| Italian | 192 | 1.8% |
| Korean | 17 | 0.2% |
| Mexican | 186 | 1.7% |
| Native Hawaiian | 17 | 0.2% |
| Nicaraguan | 14 | 0.1% |
| Nigerian | 12 | 0.1% |
| Northern European | 21 | 0.2% |
| Norwegian | 12 | 0.1% |
| Polish | 63 | 0.6% |
| Puerto Rican | 62 | 0.6% |
| Russian | 3 | 0.0% |
| Scandinavian | 24 | 0.2% |
| Scotch-Irish | 142 | 1.3% |
| Scottish | 97 | 0.9% |
| Slovak | 12 | 0.1% |
| Spaniard | 15 | 0.1% |
| Sri Lankan | 14 | 0.1% |
| Subsaharan African | 97 | 0.9% |
| Swedish | 5 | 0.1% |
| Ukrainian | 6 | 0.1% |
| Welsh | 27 | 0.3% | View All 39 Rows |
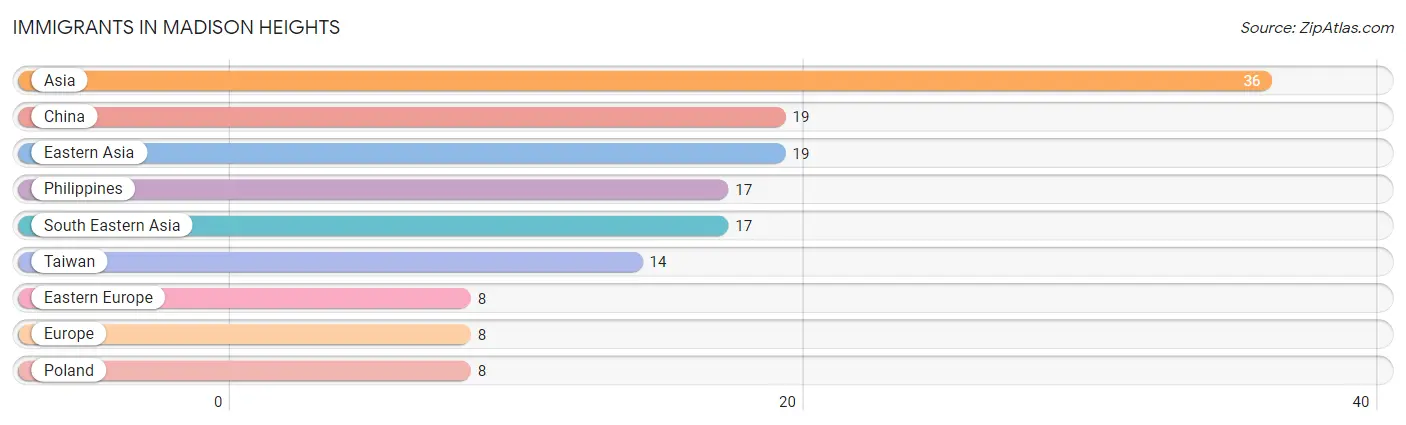
Immigrants in Madison Heights
The most numerous immigrant groups reported in Madison Heights came from Asia (36 | 0.3%), China (19 | 0.2%), Eastern Asia (19 | 0.2%), Philippines (17 | 0.2%), and South Eastern Asia (17 | 0.2%), together accounting for 1.0% of all Madison Heights residents.
| Immigration Origin | # Population | % Population |
| Asia | 36 | 0.3% |
| China | 19 | 0.2% |
| Eastern Asia | 19 | 0.2% |
| Eastern Europe | 8 | 0.1% |
| Europe | 8 | 0.1% |
| Philippines | 17 | 0.2% |
| Poland | 8 | 0.1% |
| South Eastern Asia | 17 | 0.2% |
| Taiwan | 14 | 0.1% | View All 9 Rows |
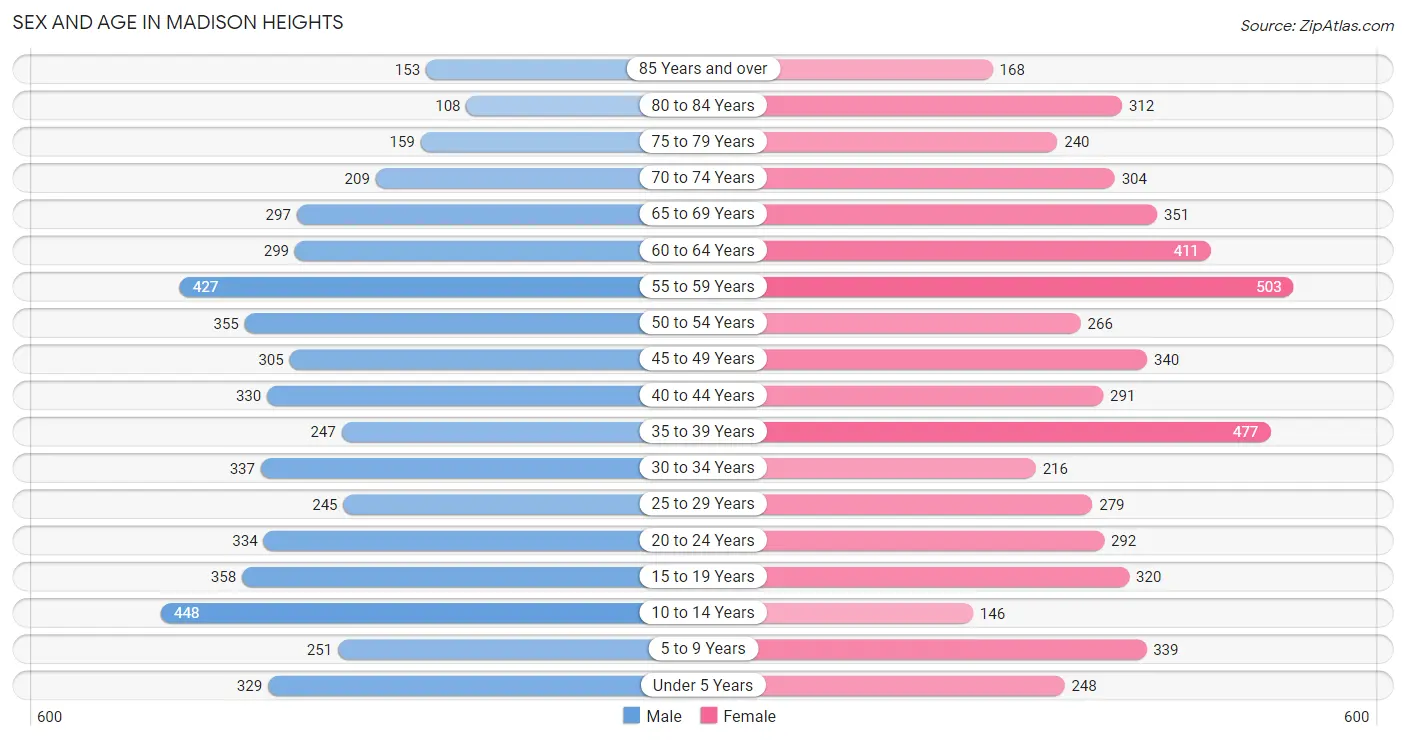
Sex and Age in Madison Heights
Sex and Age in Madison Heights
The most populous age groups in Madison Heights are 10 to 14 Years (448 | 8.6%) for men and 55 to 59 Years (503 | 9.1%) for women.
| Age Bracket | Male | Female |
| Under 5 Years | 329 (6.3%) | 248 (4.5%) |
| 5 to 9 Years | 251 (4.8%) | 339 (6.2%) |
| 10 to 14 Years | 448 (8.6%) | 146 (2.6%) |
| 15 to 19 Years | 358 (6.9%) | 320 (5.8%) |
| 20 to 24 Years | 334 (6.4%) | 292 (5.3%) |
| 25 to 29 Years | 245 (4.7%) | 279 (5.1%) |
| 30 to 34 Years | 337 (6.5%) | 216 (3.9%) |
| 35 to 39 Years | 247 (4.8%) | 477 (8.7%) |
| 40 to 44 Years | 330 (6.4%) | 291 (5.3%) |
| 45 to 49 Years | 305 (5.9%) | 340 (6.2%) |
| 50 to 54 Years | 355 (6.8%) | 266 (4.8%) |
| 55 to 59 Years | 427 (8.2%) | 503 (9.1%) |
| 60 to 64 Years | 299 (5.8%) | 411 (7.5%) |
| 65 to 69 Years | 297 (5.7%) | 351 (6.4%) |
| 70 to 74 Years | 209 (4.0%) | 304 (5.5%) |
| 75 to 79 Years | 159 (3.1%) | 240 (4.4%) |
| 80 to 84 Years | 108 (2.1%) | 312 (5.7%) |
| 85 Years and over | 153 (2.9%) | 168 (3.0%) |
| Total | 5,191 (100.0%) | 5,503 (100.0%) |
Families and Households in Madison Heights
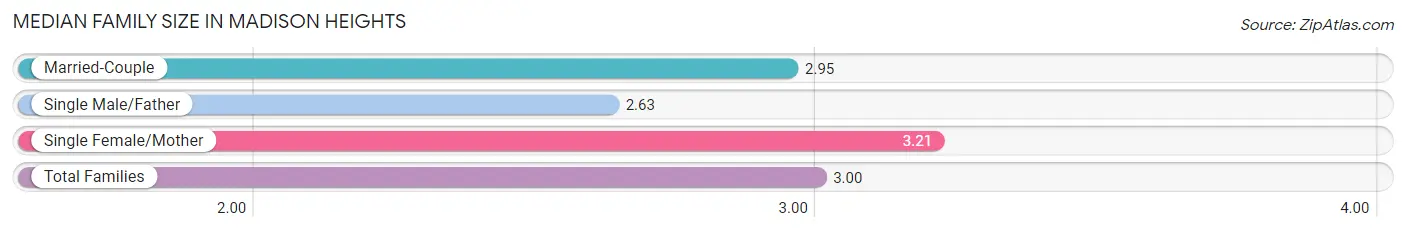
Median Family Size in Madison Heights
The median family size in Madison Heights is 3.00 persons per family, with single female/mother families (668 | 24.6%) accounting for the largest median family size of 3.21 persons per family. On the other hand, single male/father families (156 | 5.8%) represent the smallest median family size with 2.63 persons per family.
| Family Type | # Families | Family Size |
| Married-Couple | 1,888 (69.6%) | 2.95 |
| Single Male/Father | 156 (5.8%) | 2.63 |
| Single Female/Mother | 668 (24.6%) | 3.21 |
| Total Families | 2,712 (100.0%) | 3.00 |
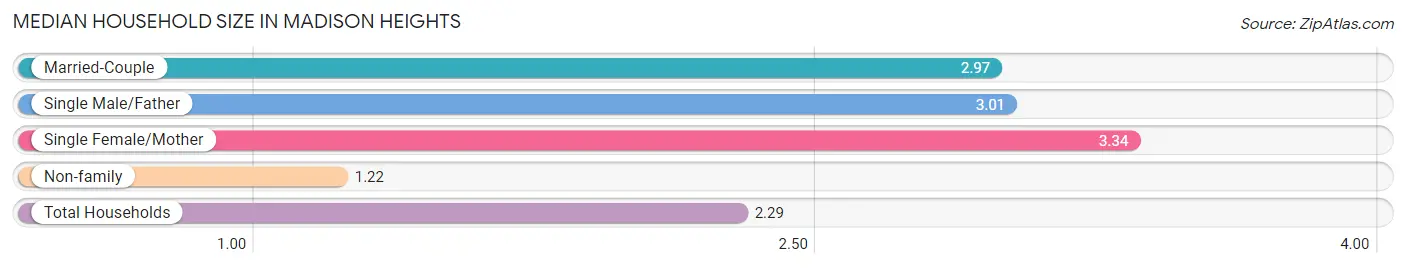
Median Household Size in Madison Heights
The median household size in Madison Heights is 2.29 persons per household, with single female/mother households (668 | 14.3%) accounting for the largest median household size of 3.34 persons per household. non-family households (1,944 | 41.7%) represent the smallest median household size with 1.22 persons per household.
| Household Type | # Households | Household Size |
| Married-Couple | 1,888 (40.6%) | 2.97 |
| Single Male/Father | 156 (3.4%) | 3.01 |
| Single Female/Mother | 668 (14.3%) | 3.34 |
| Non-family | 1,944 (41.7%) | 1.22 |
| Total Households | 4,656 (100.0%) | 2.29 |
Household Size by Marriage Status in Madison Heights
Out of a total of 4,656 households in Madison Heights, 2,712 (58.3%) are family households, while 1,944 (41.7%) are nonfamily households. The most numerous type of family households are 2-person households, comprising 1,312, and the most common type of nonfamily households are 1-person households, comprising 1,595.
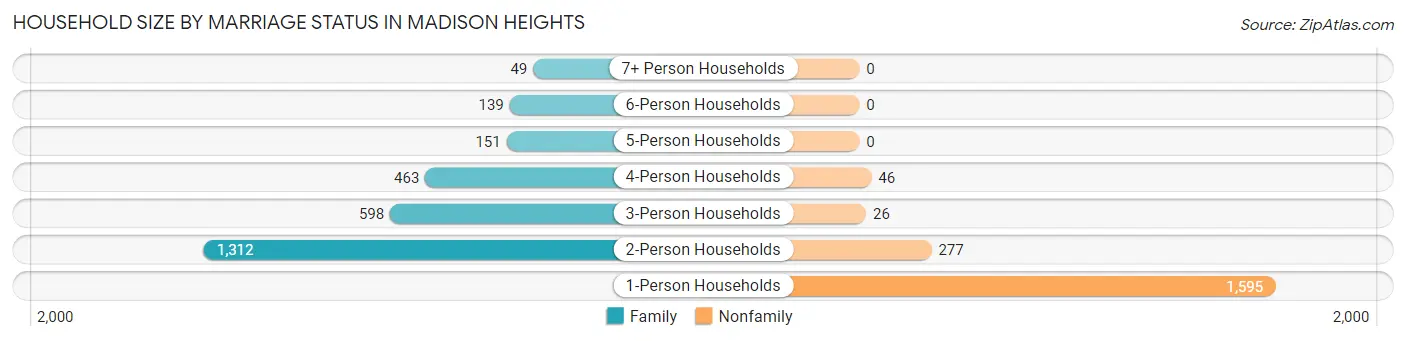
| Household Size | Family Households | Nonfamily Households |
| 1-Person Households | - | 1,595 (34.3%) |
| 2-Person Households | 1,312 (28.2%) | 277 (5.9%) |
| 3-Person Households | 598 (12.8%) | 26 (0.6%) |
| 4-Person Households | 463 (9.9%) | 46 (1.0%) |
| 5-Person Households | 151 (3.2%) | 0 (0.0%) |
| 6-Person Households | 139 (3.0%) | 0 (0.0%) |
| 7+ Person Households | 49 (1.1%) | 0 (0.0%) |
| Total | 2,712 (58.3%) | 1,944 (41.7%) |
Female Fertility in Madison Heights
Fertility by Age in Madison Heights
Average fertility rate in Madison Heights is 55.0 births per 1,000 women. Women in the age bracket of 20 to 34 years have the highest fertility rate with 140.0 births per 1,000 women. Women in the age bracket of 20 to 34 years acount for 88.7% of all women with births.
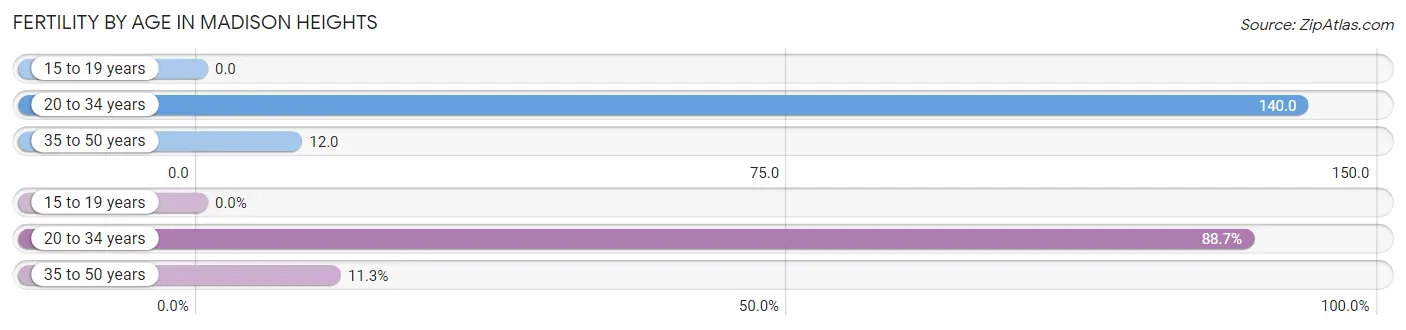
| Age Bracket | Women with Births | Births / 1,000 Women |
| 15 to 19 years | 0 (0.0%) | 0.0 |
| 20 to 34 years | 110 (88.7%) | 140.0 |
| 35 to 50 years | 14 (11.3%) | 12.0 |
| Total | 124 (100.0%) | 55.0 |
Fertility by Age by Marriage Status in Madison Heights
33.1% of women with births (124) in Madison Heights are married. The highest percentage of unmarried women with births falls into 35 to 50 years age bracket with 100.0% of them unmarried at the time of birth, while the lowest percentage of unmarried women with births belong to 20 to 34 years age bracket with 62.7% of them unmarried.
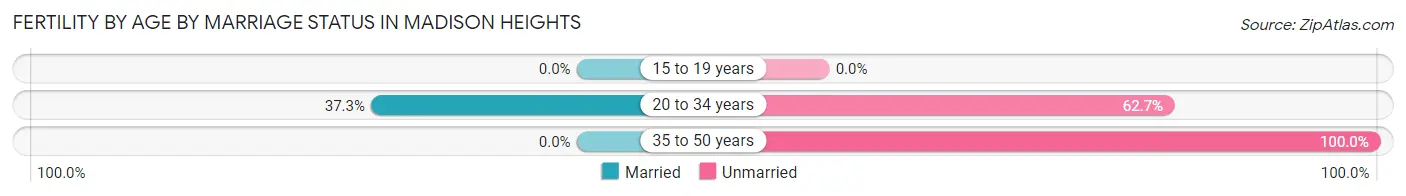
| Age Bracket | Married | Unmarried |
| 15 to 19 years | 0 (0.0%) | 0 (0.0%) |
| 20 to 34 years | 41 (37.3%) | 69 (62.7%) |
| 35 to 50 years | 0 (0.0%) | 14 (100.0%) |
| Total | 41 (33.1%) | 83 (66.9%) |
Fertility by Education in Madison Heights
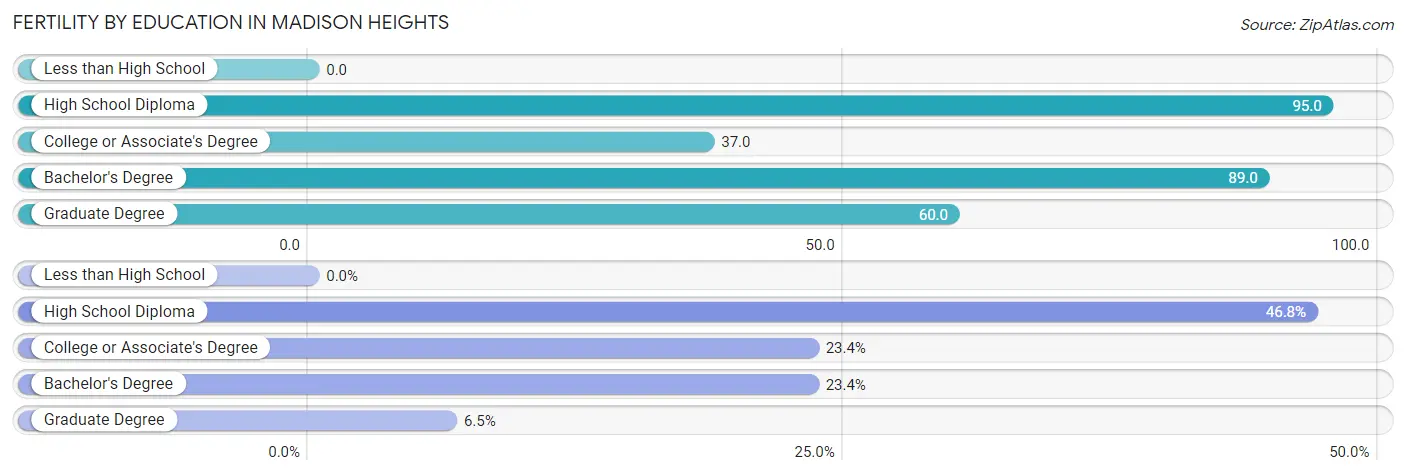
| Educational Attainment | Women with Births | Births / 1,000 Women |
| Less than High School | 0 (0.0%) | 0.0 |
| High School Diploma | 58 (46.8%) | 95.0 |
| College or Associate's Degree | 29 (23.4%) | 37.0 |
| Bachelor's Degree | 29 (23.4%) | 89.0 |
| Graduate Degree | 8 (6.5%) | 60.0 |
| Total | 124 (100.0%) | 55.0 |
Fertility by Education by Marriage Status in Madison Heights
66.9% of women with births in Madison Heights are unmarried. Women with the educational attainment of graduate degree are most likely to be married with 100.0% of them married at childbirth, while women with the educational attainment of high school diploma are least likely to be married with 100.0% of them unmarried at childbirth.
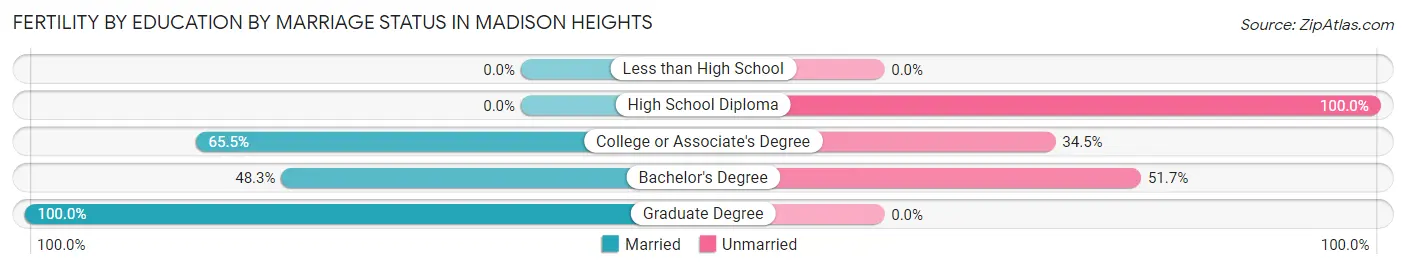
| Educational Attainment | Married | Unmarried |
| Less than High School | 0 (0.0%) | 0 (0.0%) |
| High School Diploma | 0 (0.0%) | 58 (100.0%) |
| College or Associate's Degree | 19 (65.5%) | 10 (34.5%) |
| Bachelor's Degree | 14 (48.3%) | 15 (51.7%) |
| Graduate Degree | 8 (100.0%) | 0 (0.0%) |
| Total | 41 (33.1%) | 83 (66.9%) |
Employment Characteristics in Madison Heights
Employment by Class of Employer in Madison Heights
Among the 5,053 employed individuals in Madison Heights, private company employees (3,418 | 67.6%), not-for-profit organizations (522 | 10.3%), and state government employees (346 | 6.9%) make up the most common classes of employment.
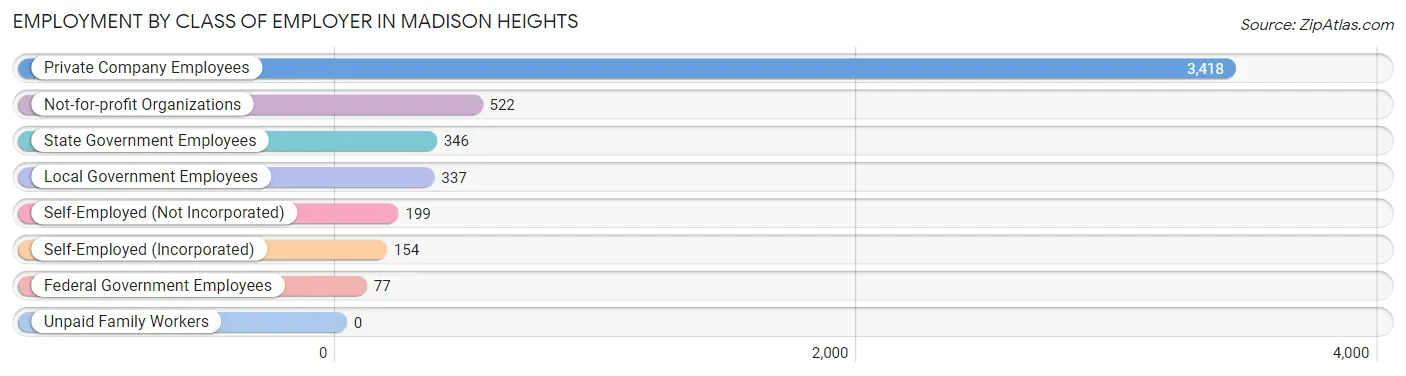
| Employer Class | # Employees | % Employees |
| Private Company Employees | 3,418 | 67.6% |
| Self-Employed (Incorporated) | 154 | 3.0% |
| Self-Employed (Not Incorporated) | 199 | 3.9% |
| Not-for-profit Organizations | 522 | 10.3% |
| Local Government Employees | 337 | 6.7% |
| State Government Employees | 346 | 6.9% |
| Federal Government Employees | 77 | 1.5% |
| Unpaid Family Workers | 0 | 0.0% |
| Total | 5,053 | 100.0% |
Employment Status by Age in Madison Heights
According to the labor force statistics for Madison Heights, out of the total population over 16 years of age (8,742), 62.6% or 5,472 individuals are in the labor force, with 5.1% or 279 of them unemployed. The age group with the highest labor force participation rate is 35 to 44 years, with 92.1% or 1,239 individuals in the labor force. Within the labor force, the 45 to 54 years age range has the highest percentage of unemployed individuals, with 10.3% or 105 of them being unemployed.
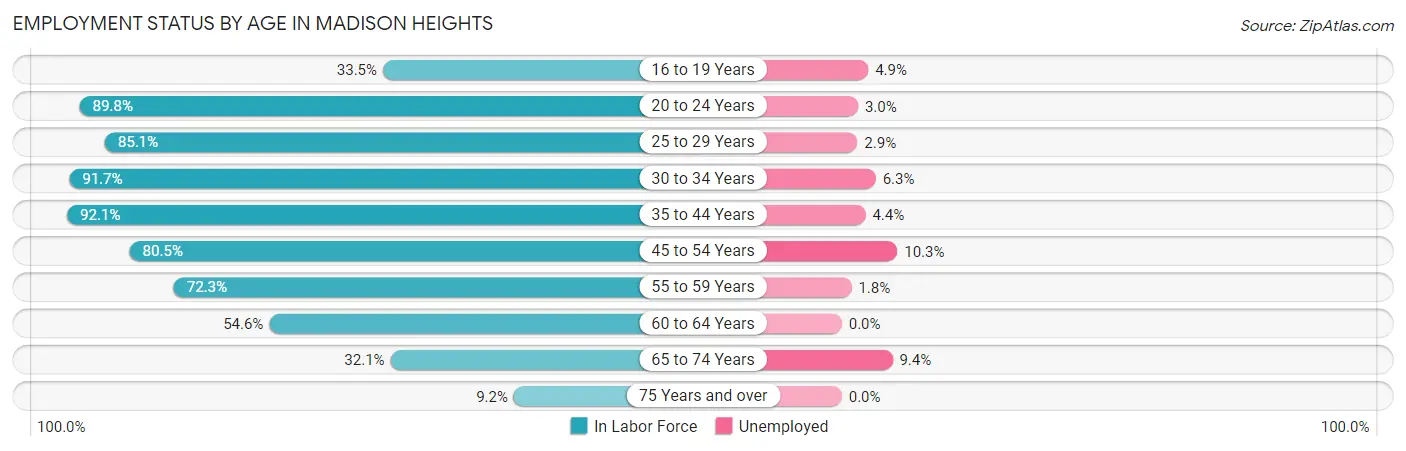
| Age Bracket | In Labor Force | Unemployed |
| 16 to 19 Years | 163 (33.5%) | 8 (4.9%) |
| 20 to 24 Years | 562 (89.8%) | 17 (3.0%) |
| 25 to 29 Years | 446 (85.1%) | 13 (2.9%) |
| 30 to 34 Years | 507 (91.7%) | 32 (6.3%) |
| 35 to 44 Years | 1,239 (92.1%) | 55 (4.4%) |
| 45 to 54 Years | 1,019 (80.5%) | 105 (10.3%) |
| 55 to 59 Years | 672 (72.3%) | 12 (1.8%) |
| 60 to 64 Years | 388 (54.6%) | 0 (0.0%) |
| 65 to 74 Years | 373 (32.1%) | 35 (9.4%) |
| 75 Years and over | 105 (9.2%) | 0 (0.0%) |
| Total | 5,472 (62.6%) | 279 (5.1%) |
Employment Status by Educational Attainment in Madison Heights
According to labor force statistics for Madison Heights, 80.2% of individuals (4,273) out of the total population between 25 and 64 years of age (5,328) are in the labor force, with 5.1% or 218 of them being unemployed. The group with the highest labor force participation rate are those with the educational attainment of bachelor's degree or higher, with 87.0% or 822 individuals in the labor force. Within the labor force, individuals with less than high school education have the highest percentage of unemployment, with 12.4% or 45 of them being unemployed.
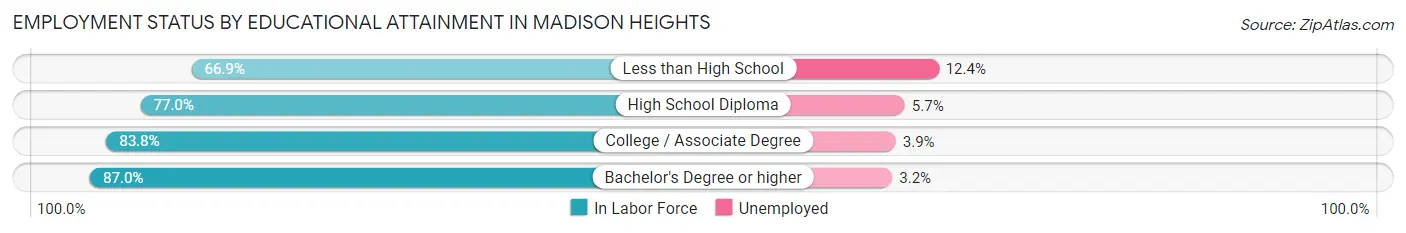
| Educational Attainment | In Labor Force | Unemployed |
| Less than High School | 364 (66.9%) | 67 (12.4%) |
| High School Diploma | 1,478 (77.0%) | 109 (5.7%) |
| College / Associate Degree | 1,609 (83.8%) | 75 (3.9%) |
| Bachelor's Degree or higher | 822 (87.0%) | 30 (3.2%) |
| Total | 4,273 (80.2%) | 272 (5.1%) |
Employment Occupations by Sex in Madison Heights
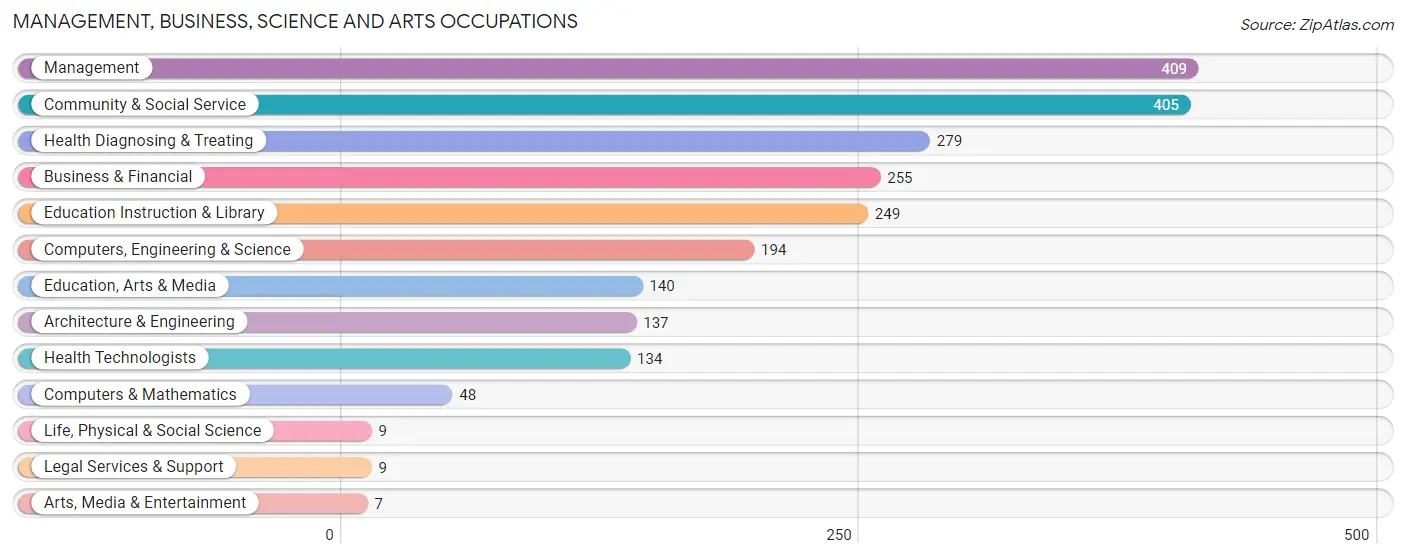
Management, Business, Science and Arts Occupations
The most common Management, Business, Science and Arts occupations in Madison Heights are Management (409 | 7.9%), Community & Social Service (405 | 7.8%), Health Diagnosing & Treating (279 | 5.4%), Business & Financial (255 | 4.9%), and Education Instruction & Library (249 | 4.8%).
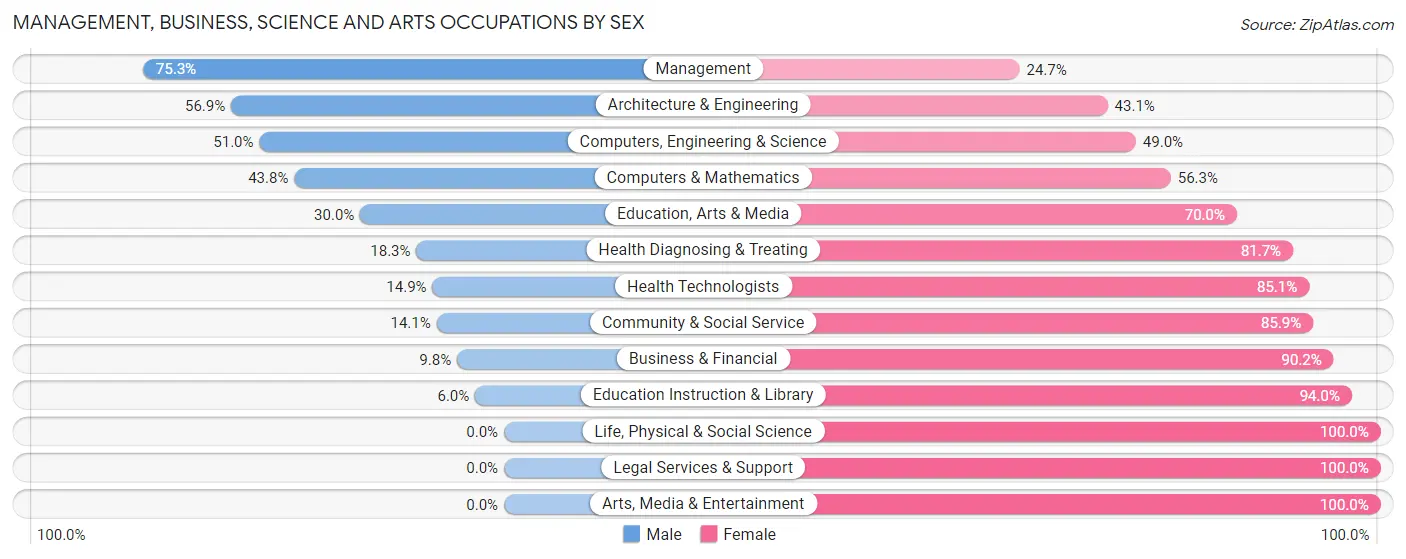
Management, Business, Science and Arts Occupations by Sex
Within the Management, Business, Science and Arts occupations in Madison Heights, the most male-oriented occupations are Management (75.3%), Architecture & Engineering (56.9%), and Computers, Engineering & Science (51.0%), while the most female-oriented occupations are Life, Physical & Social Science (100.0%), Legal Services & Support (100.0%), and Arts, Media & Entertainment (100.0%).
| Occupation | Male | Female |
| Management | 308 (75.3%) | 101 (24.7%) |
| Business & Financial | 25 (9.8%) | 230 (90.2%) |
| Computers, Engineering & Science | 99 (51.0%) | 95 (49.0%) |
| Computers & Mathematics | 21 (43.8%) | 27 (56.2%) |
| Architecture & Engineering | 78 (56.9%) | 59 (43.1%) |
| Life, Physical & Social Science | 0 (0.0%) | 9 (100.0%) |
| Community & Social Service | 57 (14.1%) | 348 (85.9%) |
| Education, Arts & Media | 42 (30.0%) | 98 (70.0%) |
| Legal Services & Support | 0 (0.0%) | 9 (100.0%) |
| Education Instruction & Library | 15 (6.0%) | 234 (94.0%) |
| Arts, Media & Entertainment | 0 (0.0%) | 7 (100.0%) |
| Health Diagnosing & Treating | 51 (18.3%) | 228 (81.7%) |
| Health Technologists | 20 (14.9%) | 114 (85.1%) |
| Total (Category) | 540 (35.0%) | 1,002 (65.0%) |
| Total (Overall) | 2,536 (48.8%) | 2,661 (51.2%) |
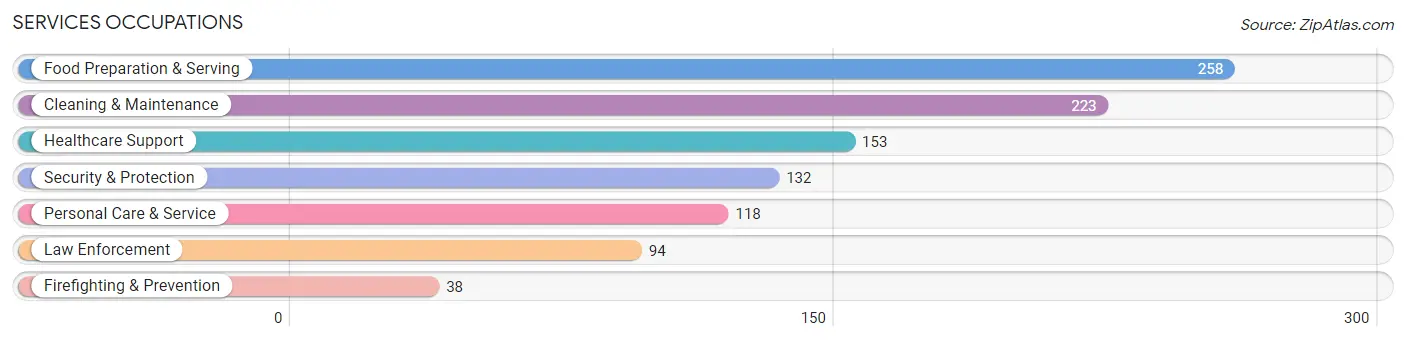
Services Occupations
The most common Services occupations in Madison Heights are Food Preparation & Serving (258 | 5.0%), Cleaning & Maintenance (223 | 4.3%), Healthcare Support (153 | 2.9%), Security & Protection (132 | 2.5%), and Personal Care & Service (118 | 2.3%).
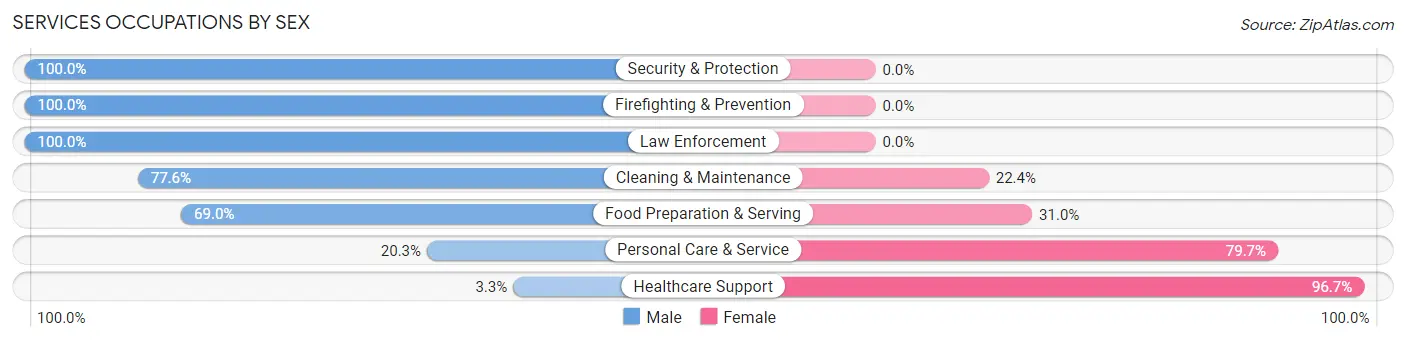
Services Occupations by Sex
Within the Services occupations in Madison Heights, the most male-oriented occupations are Security & Protection (100.0%), Firefighting & Prevention (100.0%), and Law Enforcement (100.0%), while the most female-oriented occupations are Healthcare Support (96.7%), Personal Care & Service (79.7%), and Food Preparation & Serving (31.0%).
| Occupation | Male | Female |
| Healthcare Support | 5 (3.3%) | 148 (96.7%) |
| Security & Protection | 132 (100.0%) | 0 (0.0%) |
| Firefighting & Prevention | 38 (100.0%) | 0 (0.0%) |
| Law Enforcement | 94 (100.0%) | 0 (0.0%) |
| Food Preparation & Serving | 178 (69.0%) | 80 (31.0%) |
| Cleaning & Maintenance | 173 (77.6%) | 50 (22.4%) |
| Personal Care & Service | 24 (20.3%) | 94 (79.7%) |
| Total (Category) | 512 (57.9%) | 372 (42.1%) |
| Total (Overall) | 2,536 (48.8%) | 2,661 (51.2%) |
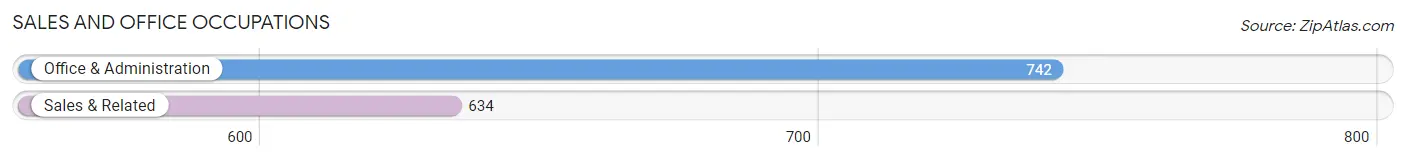
Sales and Office Occupations
The most common Sales and Office occupations in Madison Heights are Office & Administration (742 | 14.3%), and Sales & Related (634 | 12.2%).
Sales and Office Occupations by Sex
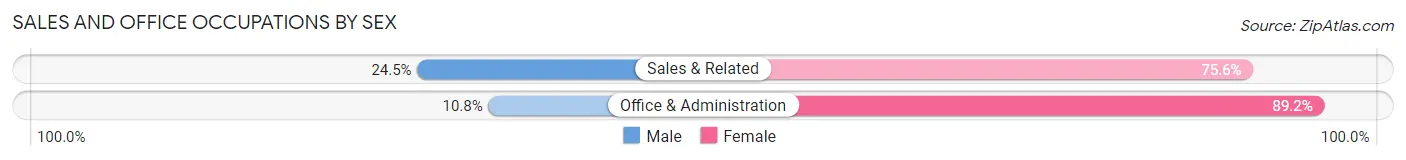
| Occupation | Male | Female |
| Sales & Related | 155 (24.4%) | 479 (75.5%) |
| Office & Administration | 80 (10.8%) | 662 (89.2%) |
| Total (Category) | 235 (17.1%) | 1,141 (82.9%) |
| Total (Overall) | 2,536 (48.8%) | 2,661 (51.2%) |
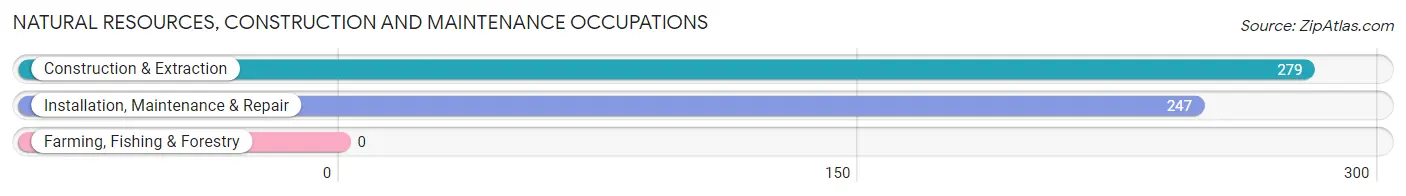
Natural Resources, Construction and Maintenance Occupations
The most common Natural Resources, Construction and Maintenance occupations in Madison Heights are Construction & Extraction (279 | 5.4%), and Installation, Maintenance & Repair (247 | 4.8%).
Natural Resources, Construction and Maintenance Occupations by Sex
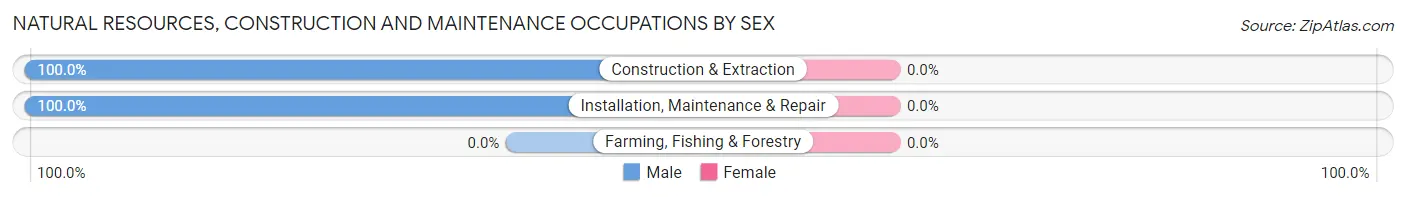
| Occupation | Male | Female |
| Farming, Fishing & Forestry | 0 (0.0%) | 0 (0.0%) |
| Construction & Extraction | 279 (100.0%) | 0 (0.0%) |
| Installation, Maintenance & Repair | 247 (100.0%) | 0 (0.0%) |
| Total (Category) | 526 (100.0%) | 0 (0.0%) |
| Total (Overall) | 2,536 (48.8%) | 2,661 (51.2%) |
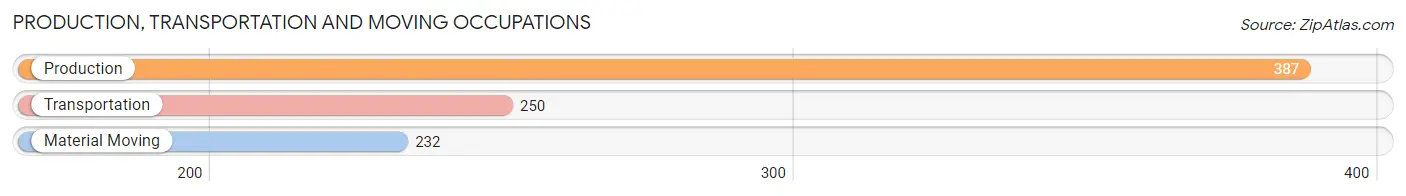
Production, Transportation and Moving Occupations
The most common Production, Transportation and Moving occupations in Madison Heights are Production (387 | 7.4%), Transportation (250 | 4.8%), and Material Moving (232 | 4.5%).
Production, Transportation and Moving Occupations by Sex
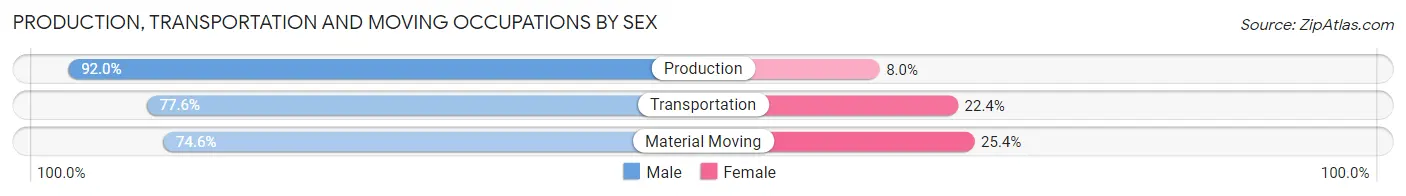
| Occupation | Male | Female |
| Production | 356 (92.0%) | 31 (8.0%) |
| Transportation | 194 (77.6%) | 56 (22.4%) |
| Material Moving | 173 (74.6%) | 59 (25.4%) |
| Total (Category) | 723 (83.2%) | 146 (16.8%) |
| Total (Overall) | 2,536 (48.8%) | 2,661 (51.2%) |
Employment Industries by Sex in Madison Heights
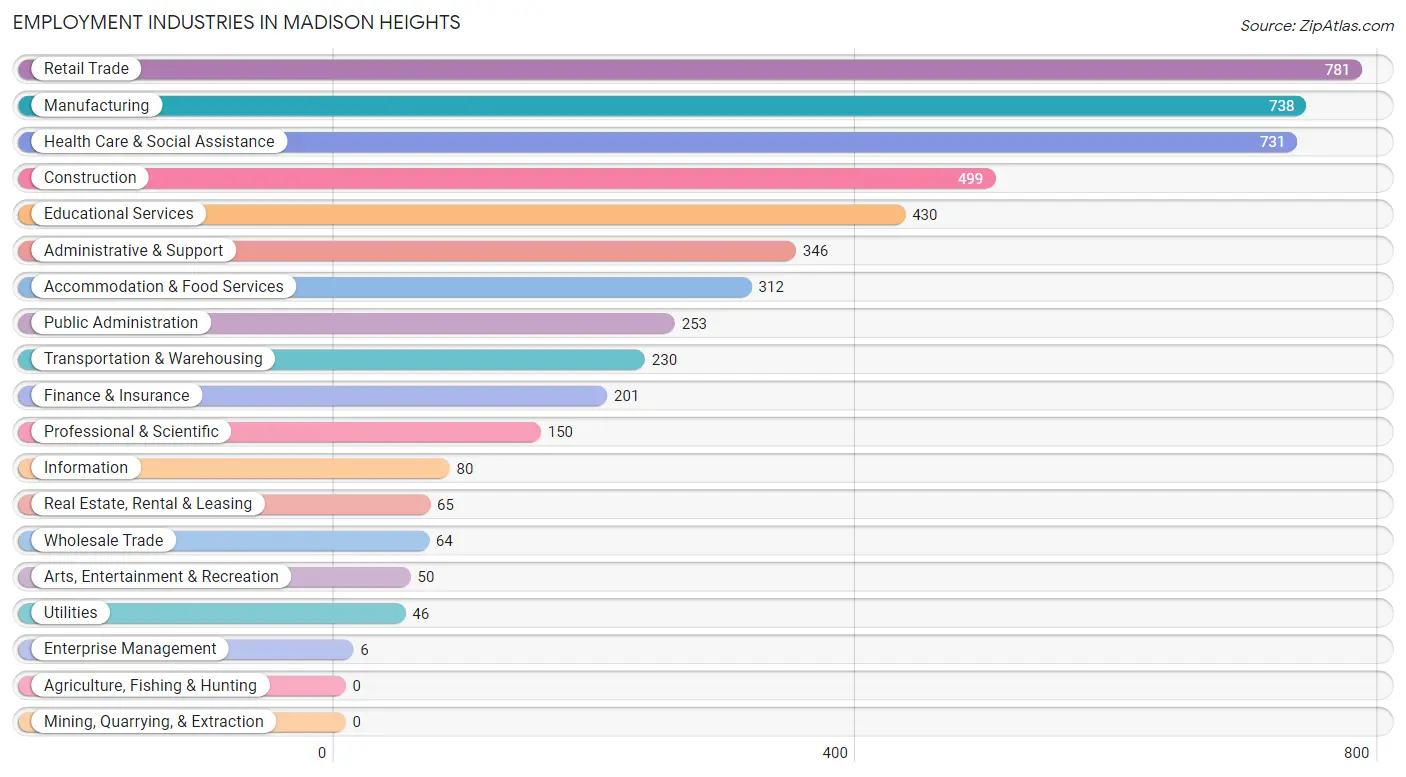
Employment Industries in Madison Heights
The major employment industries in Madison Heights include Retail Trade (781 | 15.0%), Manufacturing (738 | 14.2%), Health Care & Social Assistance (731 | 14.1%), Construction (499 | 9.6%), and Educational Services (430 | 8.3%).
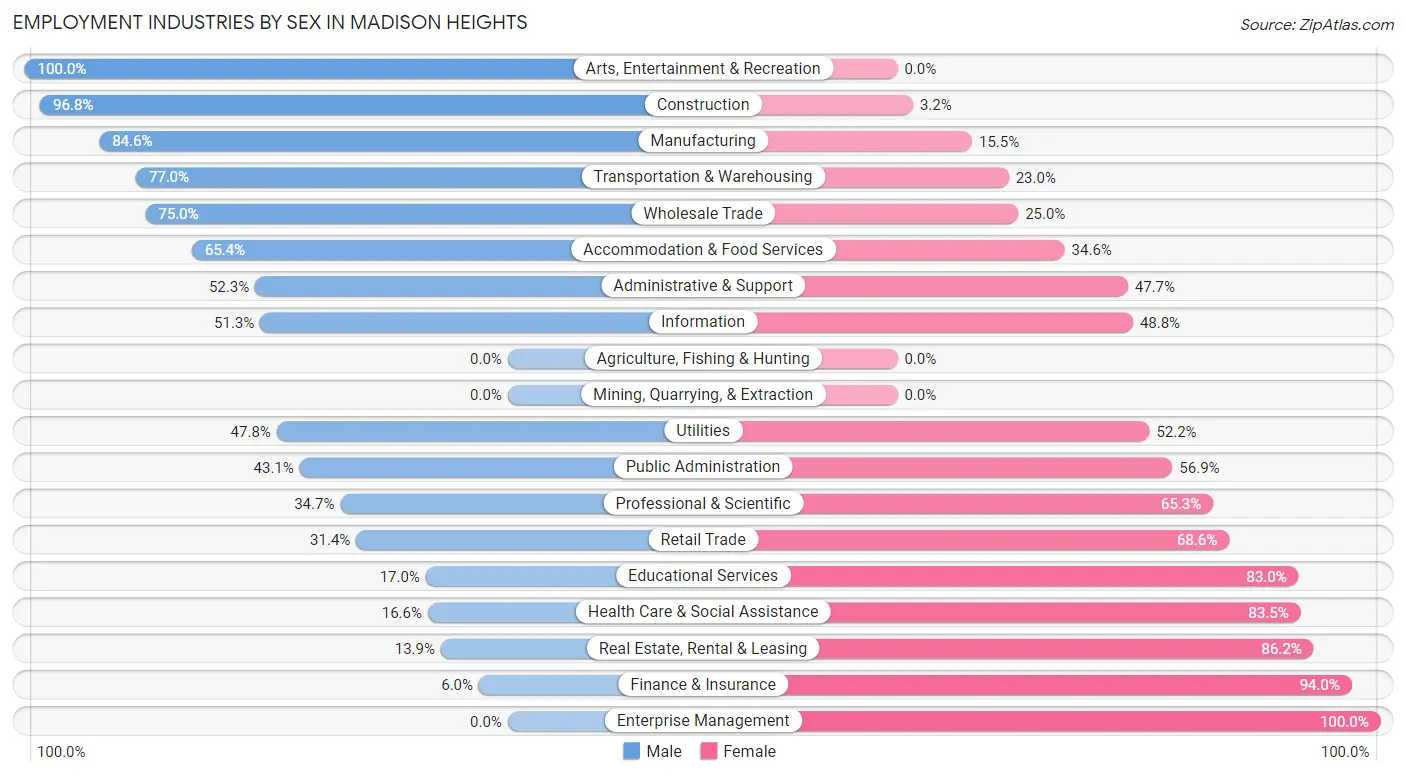
Employment Industries by Sex in Madison Heights
The Madison Heights industries that see more men than women are Arts, Entertainment & Recreation (100.0%), Construction (96.8%), and Manufacturing (84.6%), whereas the industries that tend to have a higher number of women are Enterprise Management (100.0%), Finance & Insurance (94.0%), and Real Estate, Rental & Leasing (86.2%).
| Industry | Male | Female |
| Agriculture, Fishing & Hunting | 0 (0.0%) | 0 (0.0%) |
| Mining, Quarrying, & Extraction | 0 (0.0%) | 0 (0.0%) |
| Construction | 483 (96.8%) | 16 (3.2%) |
| Manufacturing | 624 (84.6%) | 114 (15.4%) |
| Wholesale Trade | 48 (75.0%) | 16 (25.0%) |
| Retail Trade | 245 (31.4%) | 536 (68.6%) |
| Transportation & Warehousing | 177 (77.0%) | 53 (23.0%) |
| Utilities | 22 (47.8%) | 24 (52.2%) |
| Information | 41 (51.2%) | 39 (48.7%) |
| Finance & Insurance | 12 (6.0%) | 189 (94.0%) |
| Real Estate, Rental & Leasing | 9 (13.9%) | 56 (86.2%) |
| Professional & Scientific | 52 (34.7%) | 98 (65.3%) |
| Enterprise Management | 0 (0.0%) | 6 (100.0%) |
| Administrative & Support | 181 (52.3%) | 165 (47.7%) |
| Educational Services | 73 (17.0%) | 357 (83.0%) |
| Health Care & Social Assistance | 121 (16.6%) | 610 (83.5%) |
| Arts, Entertainment & Recreation | 50 (100.0%) | 0 (0.0%) |
| Accommodation & Food Services | 204 (65.4%) | 108 (34.6%) |
| Public Administration | 109 (43.1%) | 144 (56.9%) |
| Total | 2,536 (48.8%) | 2,661 (51.2%) |
Education in Madison Heights
School Enrollment in Madison Heights
The most common levels of schooling among the 1,995 students in Madison Heights are elementary school (488 | 24.5%), high school (485 | 24.3%), and middle school (412 | 20.6%).
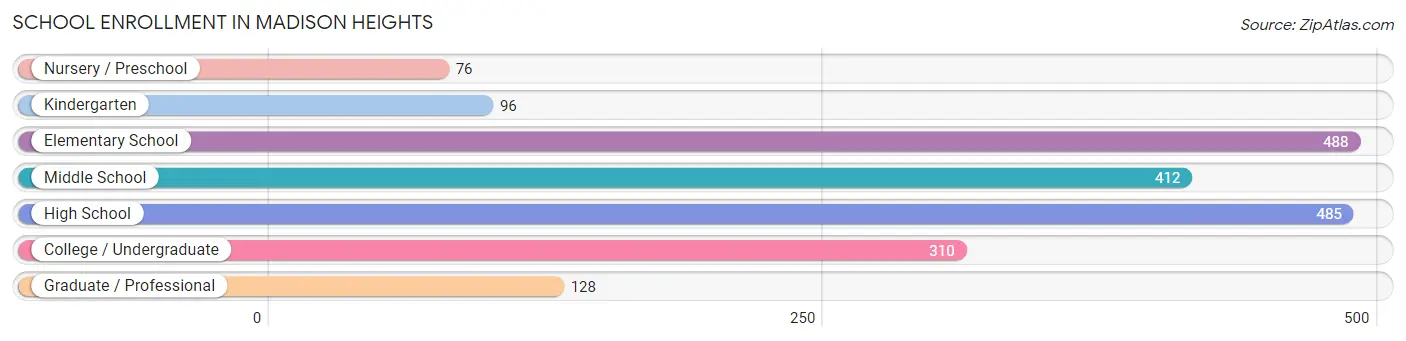
| School Level | # Students | % Students |
| Nursery / Preschool | 76 | 3.8% |
| Kindergarten | 96 | 4.8% |
| Elementary School | 488 | 24.5% |
| Middle School | 412 | 20.6% |
| High School | 485 | 24.3% |
| College / Undergraduate | 310 | 15.5% |
| Graduate / Professional | 128 | 6.4% |
| Total | 1,995 | 100.0% |
School Enrollment by Age by Funding Source in Madison Heights
Out of a total of 1,995 students who are enrolled in schools in Madison Heights, 319 (16.0%) attend a private institution, while the remaining 1,676 (84.0%) are enrolled in public schools. The age group of 25 to 34 year olds has the highest likelihood of being enrolled in private schools, with 67 (59.3% in the age bracket) enrolled. Conversely, the age group of 10 to 14 year olds has the lowest likelihood of being enrolled in a private school, with 506 (96.4% in the age bracket) attending a public institution.
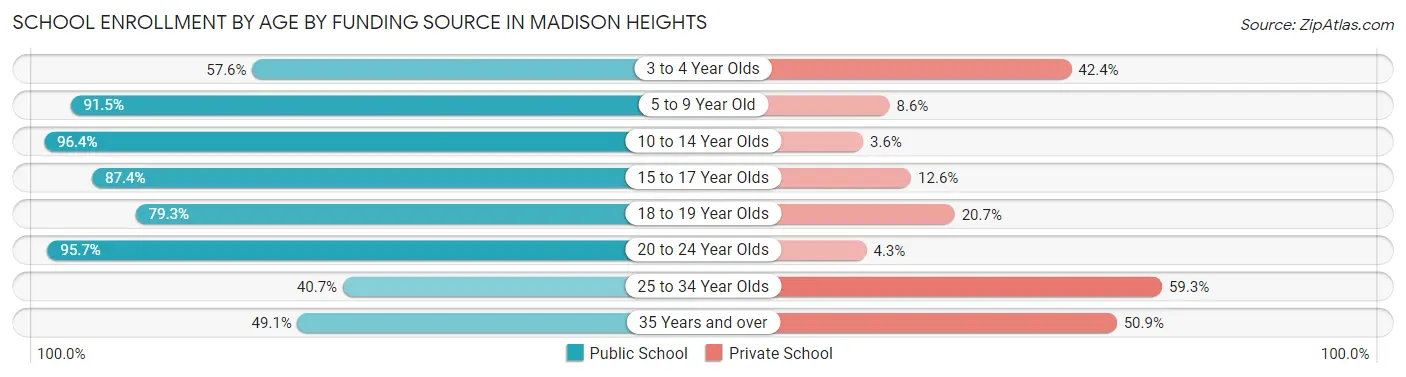
| Age Bracket | Public School | Private School |
| 3 to 4 Year Olds | 57 (57.6%) | 42 (42.4%) |
| 5 to 9 Year Old | 460 (91.4%) | 43 (8.6%) |
| 10 to 14 Year Olds | 506 (96.4%) | 19 (3.6%) |
| 15 to 17 Year Olds | 299 (87.4%) | 43 (12.6%) |
| 18 to 19 Year Olds | 161 (79.3%) | 42 (20.7%) |
| 20 to 24 Year Olds | 90 (95.7%) | 4 (4.3%) |
| 25 to 34 Year Olds | 46 (40.7%) | 67 (59.3%) |
| 35 Years and over | 57 (49.1%) | 59 (50.9%) |
| Total | 1,676 (84.0%) | 319 (16.0%) |
Educational Attainment by Field of Study in Madison Heights
Education (229 | 17.6%), business (215 | 16.5%), science & technology (199 | 15.3%), arts & humanities (106 | 8.1%), and social sciences (94 | 7.2%) are the most common fields of study among 1,304 individuals in Madison Heights who have obtained a bachelor's degree or higher.
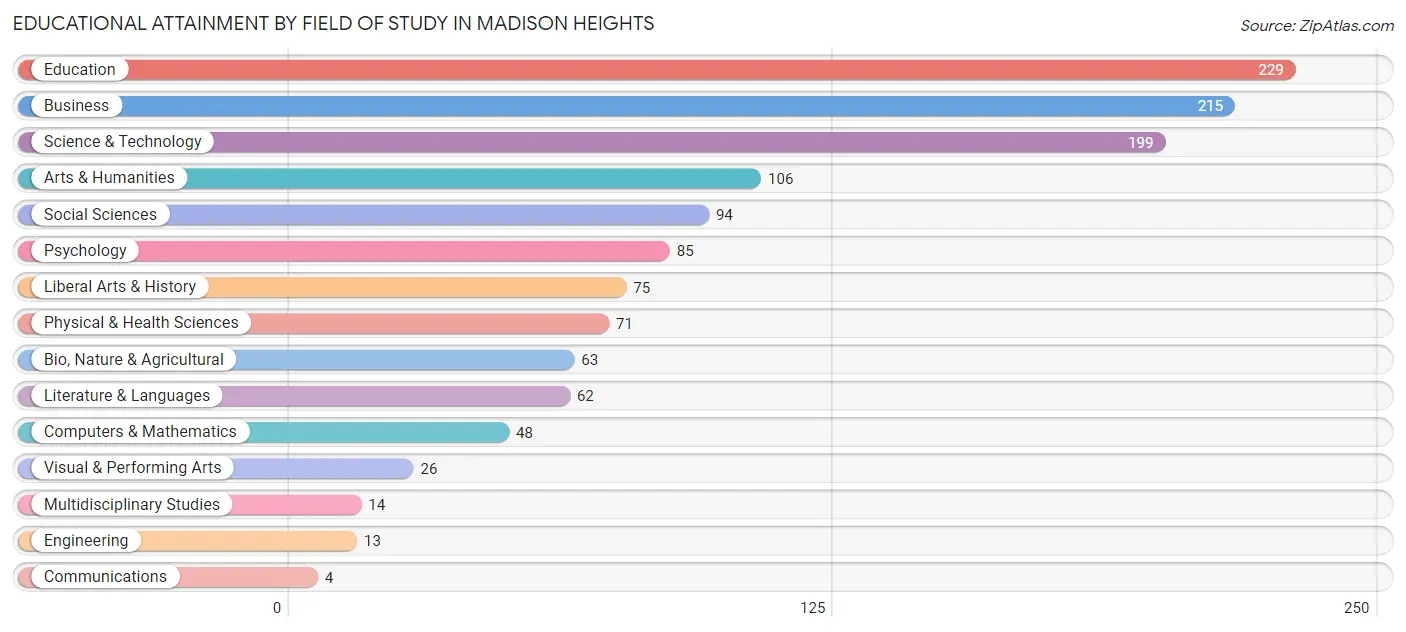
| Field of Study | # Graduates | % Graduates |
| Computers & Mathematics | 48 | 3.7% |
| Bio, Nature & Agricultural | 63 | 4.8% |
| Physical & Health Sciences | 71 | 5.4% |
| Psychology | 85 | 6.5% |
| Social Sciences | 94 | 7.2% |
| Engineering | 13 | 1.0% |
| Multidisciplinary Studies | 14 | 1.1% |
| Science & Technology | 199 | 15.3% |
| Business | 215 | 16.5% |
| Education | 229 | 17.6% |
| Literature & Languages | 62 | 4.8% |
| Liberal Arts & History | 75 | 5.8% |
| Visual & Performing Arts | 26 | 2.0% |
| Communications | 4 | 0.3% |
| Arts & Humanities | 106 | 8.1% |
| Total | 1,304 | 100.0% |
Transportation & Commute in Madison Heights
Vehicle Availability by Sex in Madison Heights
The most prevalent vehicle ownership categories in Madison Heights are males with 2 vehicles (889, accounting for 36.3%) and females with 2 vehicles (791, making up 34.2%).
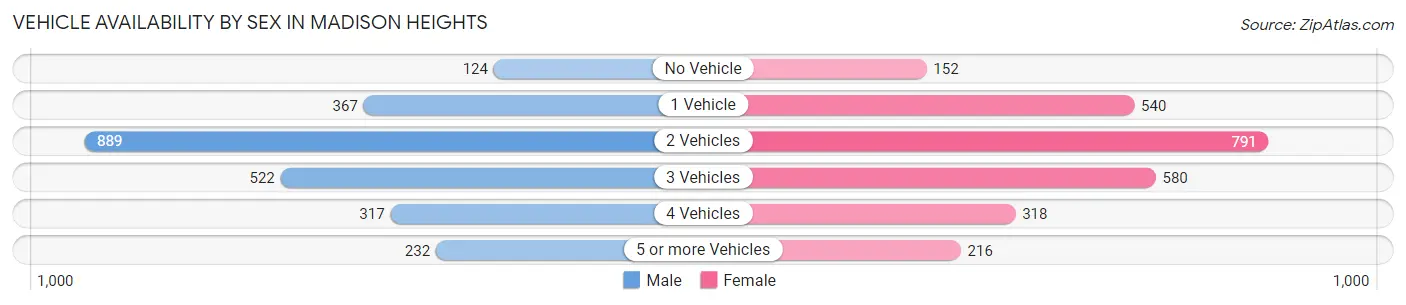
| Vehicles Available | Male | Female |
| No Vehicle | 124 (5.1%) | 152 (5.9%) |
| 1 Vehicle | 367 (15.0%) | 540 (20.8%) |
| 2 Vehicles | 889 (36.3%) | 791 (30.5%) |
| 3 Vehicles | 522 (21.3%) | 580 (22.3%) |
| 4 Vehicles | 317 (12.9%) | 318 (12.2%) |
| 5 or more Vehicles | 232 (9.5%) | 216 (8.3%) |
| Total | 2,451 (100.0%) | 2,597 (100.0%) |
Commute Time in Madison Heights
The most frequently occuring commute durations in Madison Heights are 20 to 24 minutes (1,371 commuters, 29.3%), 15 to 19 minutes (1,018 commuters, 21.7%), and 10 to 14 minutes (647 commuters, 13.8%).
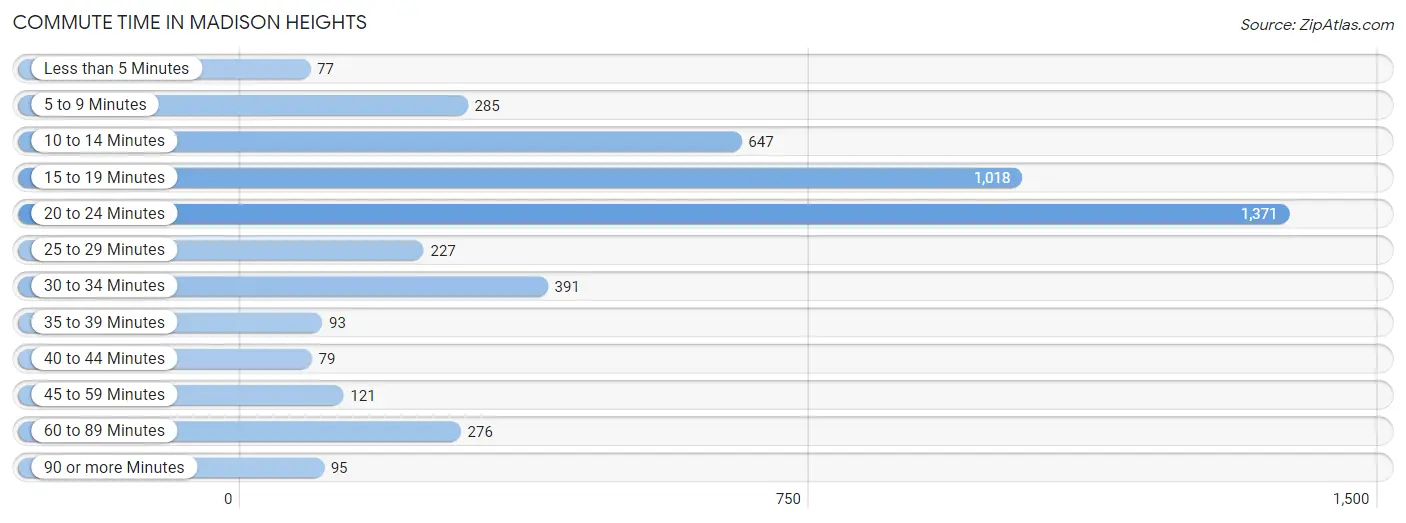
| Commute Time | # Commuters | % Commuters |
| Less than 5 Minutes | 77 | 1.7% |
| 5 to 9 Minutes | 285 | 6.1% |
| 10 to 14 Minutes | 647 | 13.8% |
| 15 to 19 Minutes | 1,018 | 21.7% |
| 20 to 24 Minutes | 1,371 | 29.3% |
| 25 to 29 Minutes | 227 | 4.9% |
| 30 to 34 Minutes | 391 | 8.4% |
| 35 to 39 Minutes | 93 | 2.0% |
| 40 to 44 Minutes | 79 | 1.7% |
| 45 to 59 Minutes | 121 | 2.6% |
| 60 to 89 Minutes | 276 | 5.9% |
| 90 or more Minutes | 95 | 2.0% |
Commute Time by Sex in Madison Heights
The most common commute times in Madison Heights are 20 to 24 minutes (746 commuters, 32.3%) for males and 20 to 24 minutes (625 commuters, 26.4%) for females.
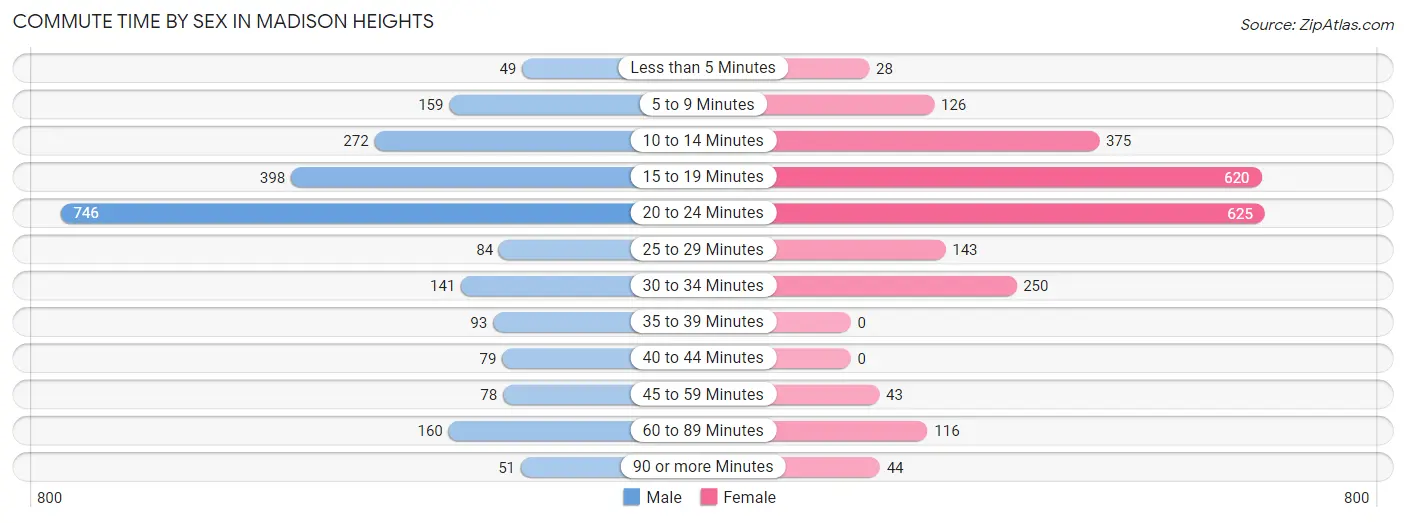
| Commute Time | Male | Female |
| Less than 5 Minutes | 49 (2.1%) | 28 (1.2%) |
| 5 to 9 Minutes | 159 (6.9%) | 126 (5.3%) |
| 10 to 14 Minutes | 272 (11.8%) | 375 (15.8%) |
| 15 to 19 Minutes | 398 (17.2%) | 620 (26.2%) |
| 20 to 24 Minutes | 746 (32.3%) | 625 (26.4%) |
| 25 to 29 Minutes | 84 (3.6%) | 143 (6.0%) |
| 30 to 34 Minutes | 141 (6.1%) | 250 (10.5%) |
| 35 to 39 Minutes | 93 (4.0%) | 0 (0.0%) |
| 40 to 44 Minutes | 79 (3.4%) | 0 (0.0%) |
| 45 to 59 Minutes | 78 (3.4%) | 43 (1.8%) |
| 60 to 89 Minutes | 160 (6.9%) | 116 (4.9%) |
| 90 or more Minutes | 51 (2.2%) | 44 (1.9%) |
Time of Departure to Work by Sex in Madison Heights
The most frequent times of departure to work in Madison Heights are 5:00 AM to 5:29 AM (308, 13.3%) for males and 8:00 AM to 8:29 AM (519, 21.9%) for females.
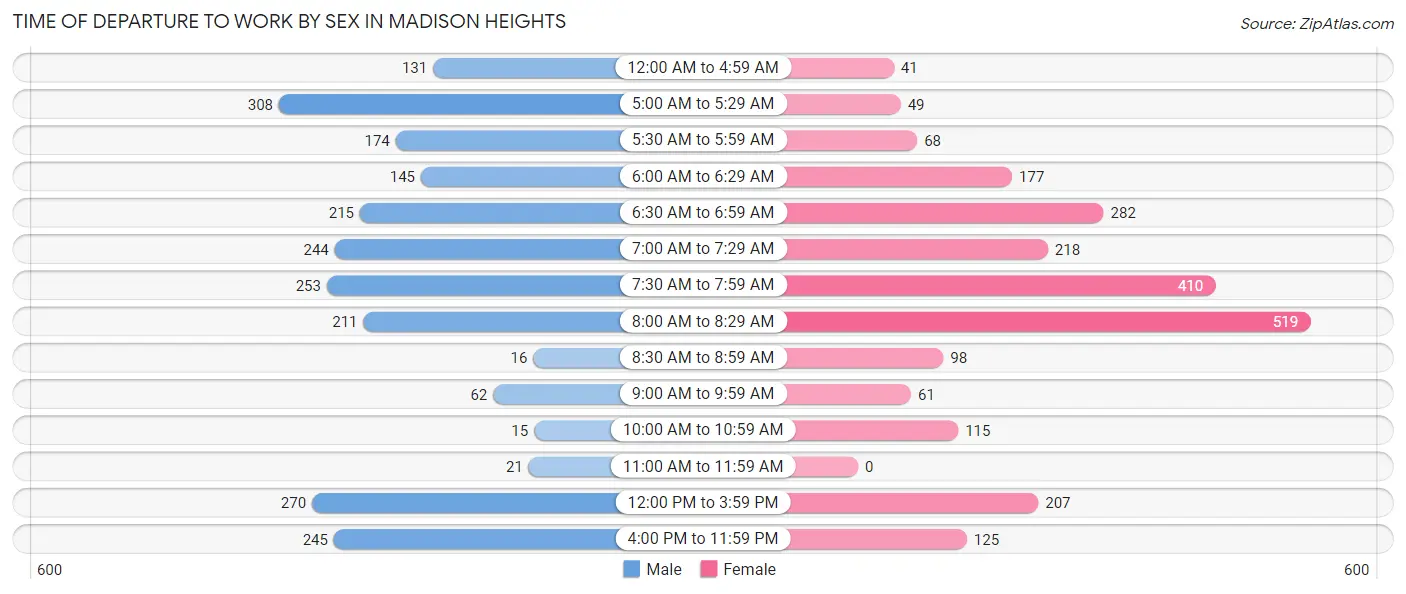
| Time of Departure | Male | Female |
| 12:00 AM to 4:59 AM | 131 (5.7%) | 41 (1.7%) |
| 5:00 AM to 5:29 AM | 308 (13.3%) | 49 (2.1%) |
| 5:30 AM to 5:59 AM | 174 (7.5%) | 68 (2.9%) |
| 6:00 AM to 6:29 AM | 145 (6.3%) | 177 (7.5%) |
| 6:30 AM to 6:59 AM | 215 (9.3%) | 282 (11.9%) |
| 7:00 AM to 7:29 AM | 244 (10.6%) | 218 (9.2%) |
| 7:30 AM to 7:59 AM | 253 (11.0%) | 410 (17.3%) |
| 8:00 AM to 8:29 AM | 211 (9.1%) | 519 (21.9%) |
| 8:30 AM to 8:59 AM | 16 (0.7%) | 98 (4.1%) |
| 9:00 AM to 9:59 AM | 62 (2.7%) | 61 (2.6%) |
| 10:00 AM to 10:59 AM | 15 (0.6%) | 115 (4.9%) |
| 11:00 AM to 11:59 AM | 21 (0.9%) | 0 (0.0%) |
| 12:00 PM to 3:59 PM | 270 (11.7%) | 207 (8.7%) |
| 4:00 PM to 11:59 PM | 245 (10.6%) | 125 (5.3%) |
| Total | 2,310 (100.0%) | 2,370 (100.0%) |
Housing Occupancy in Madison Heights
Occupancy by Ownership in Madison Heights
Of the total 4,656 dwellings in Madison Heights, owner-occupied units account for 3,240 (69.6%), while renter-occupied units make up 1,416 (30.4%).
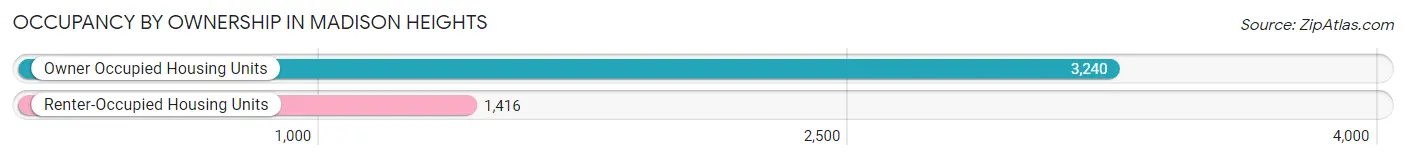
| Occupancy | # Housing Units | % Housing Units |
| Owner Occupied Housing Units | 3,240 | 69.6% |
| Renter-Occupied Housing Units | 1,416 | 30.4% |
| Total Occupied Housing Units | 4,656 | 100.0% |
Occupancy by Household Size in Madison Heights
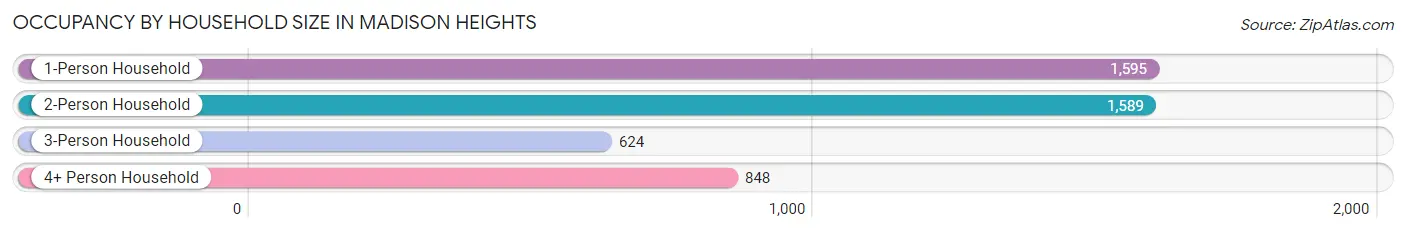
| Household Size | # Housing Units | % Housing Units |
| 1-Person Household | 1,595 | 34.3% |
| 2-Person Household | 1,589 | 34.1% |
| 3-Person Household | 624 | 13.4% |
| 4+ Person Household | 848 | 18.2% |
| Total Housing Units | 4,656 | 100.0% |
Occupancy by Ownership by Household Size in Madison Heights
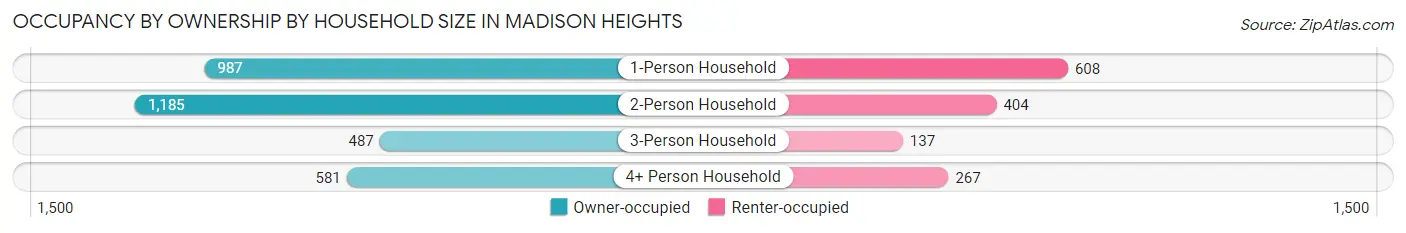
| Household Size | Owner-occupied | Renter-occupied |
| 1-Person Household | 987 (61.9%) | 608 (38.1%) |
| 2-Person Household | 1,185 (74.6%) | 404 (25.4%) |
| 3-Person Household | 487 (78.0%) | 137 (22.0%) |
| 4+ Person Household | 581 (68.5%) | 267 (31.5%) |
| Total Housing Units | 3,240 (69.6%) | 1,416 (30.4%) |
Occupancy by Educational Attainment in Madison Heights
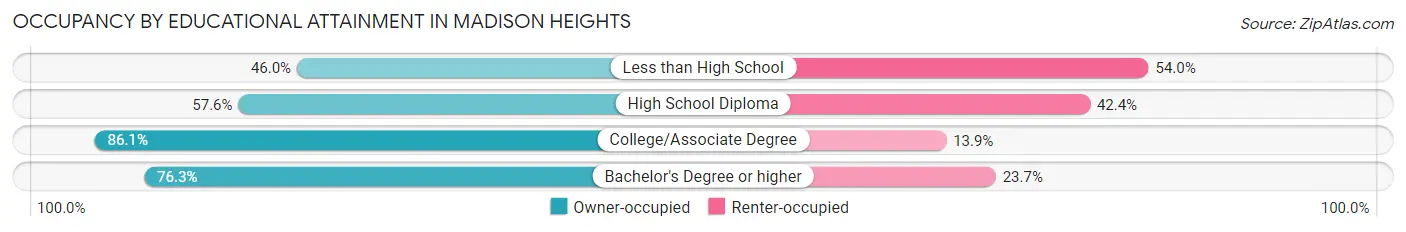
| Household Size | Owner-occupied | Renter-occupied |
| Less than High School | 259 (46.0%) | 304 (54.0%) |
| High School Diploma | 957 (57.6%) | 704 (42.4%) |
| College/Associate Degree | 1,477 (86.1%) | 238 (13.9%) |
| Bachelor's Degree or higher | 547 (76.3%) | 170 (23.7%) |
Occupancy by Age of Householder in Madison Heights
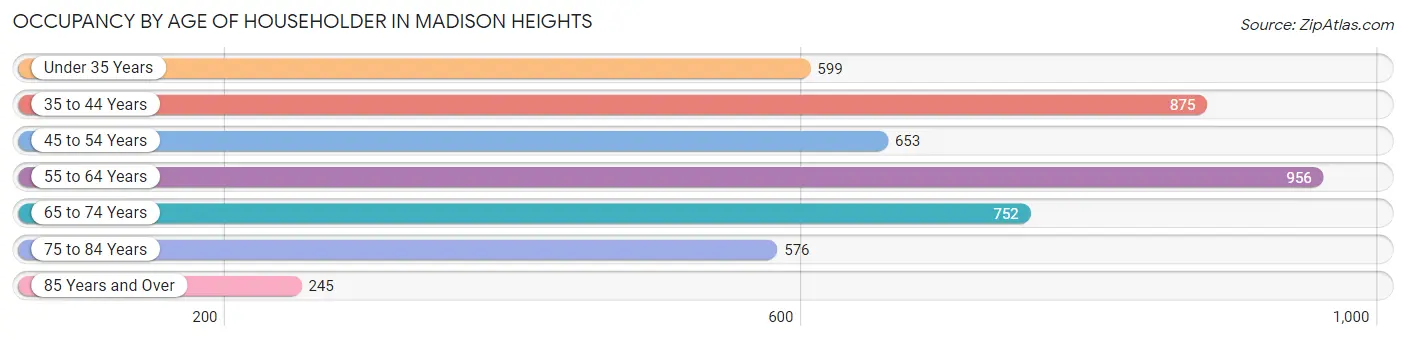
| Age Bracket | # Households | % Households |
| Under 35 Years | 599 | 12.9% |
| 35 to 44 Years | 875 | 18.8% |
| 45 to 54 Years | 653 | 14.0% |
| 55 to 64 Years | 956 | 20.5% |
| 65 to 74 Years | 752 | 16.2% |
| 75 to 84 Years | 576 | 12.4% |
| 85 Years and Over | 245 | 5.3% |
| Total | 4,656 | 100.0% |
Housing Finances in Madison Heights
Median Income by Occupancy in Madison Heights
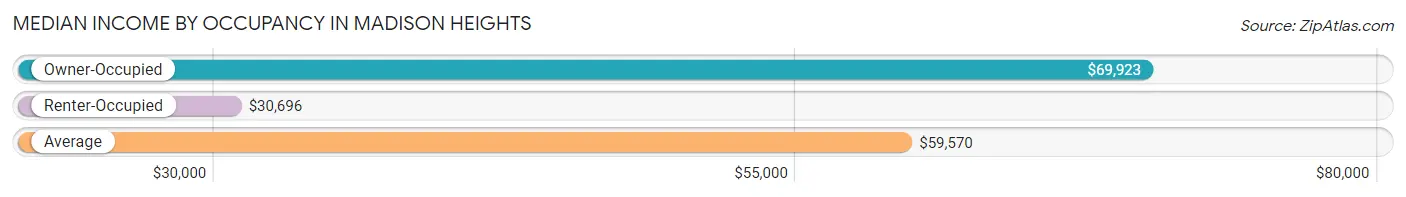
| Occupancy Type | # Households | Median Income |
| Owner-Occupied | 3,240 (69.6%) | $69,923 |
| Renter-Occupied | 1,416 (30.4%) | $30,696 |
| Average | 4,656 (100.0%) | $59,570 |
Occupancy by Householder Income Bracket in Madison Heights
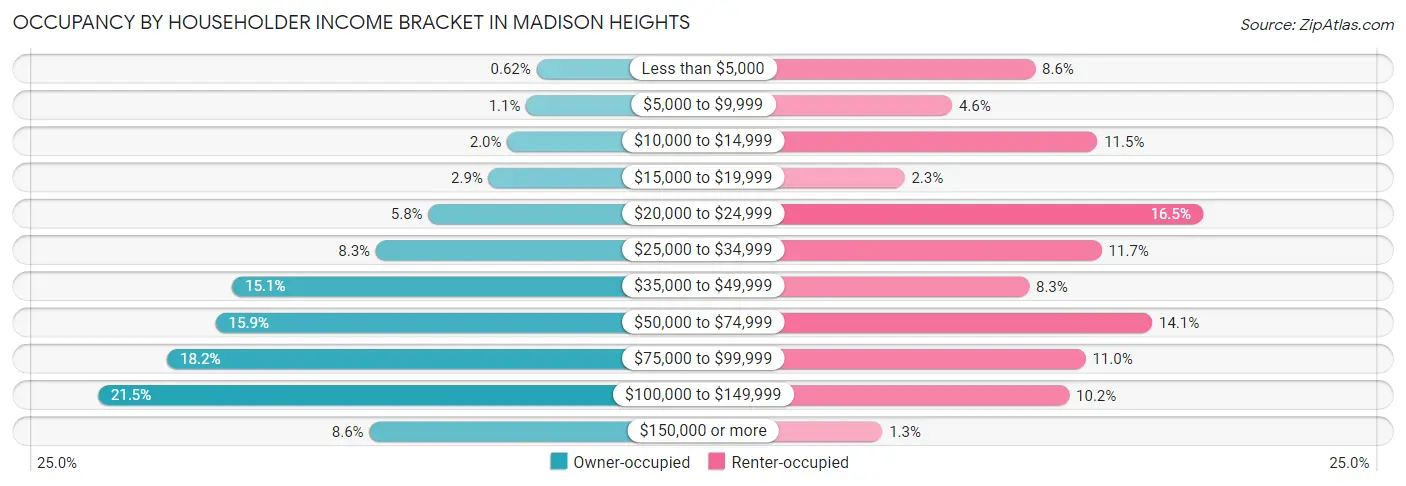
| Income Bracket | Owner-occupied | Renter-occupied |
| Less than $5,000 | 20 (0.6%) | 121 (8.6%) |
| $5,000 to $9,999 | 36 (1.1%) | 65 (4.6%) |
| $10,000 to $14,999 | 65 (2.0%) | 163 (11.5%) |
| $15,000 to $19,999 | 94 (2.9%) | 33 (2.3%) |
| $20,000 to $24,999 | 187 (5.8%) | 234 (16.5%) |
| $25,000 to $34,999 | 268 (8.3%) | 166 (11.7%) |
| $35,000 to $49,999 | 490 (15.1%) | 117 (8.3%) |
| $50,000 to $74,999 | 515 (15.9%) | 200 (14.1%) |
| $75,000 to $99,999 | 590 (18.2%) | 155 (11.0%) |
| $100,000 to $149,999 | 697 (21.5%) | 144 (10.2%) |
| $150,000 or more | 278 (8.6%) | 18 (1.3%) |
| Total | 3,240 (100.0%) | 1,416 (100.0%) |
Monthly Housing Cost Tiers in Madison Heights
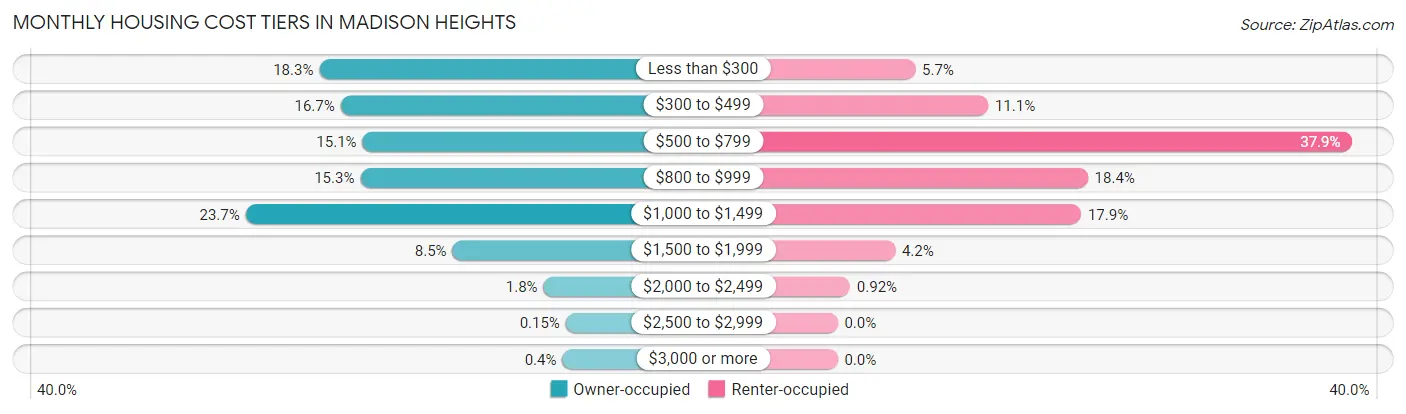
| Monthly Cost | Owner-occupied | Renter-occupied |
| Less than $300 | 593 (18.3%) | 81 (5.7%) |
| $300 to $499 | 542 (16.7%) | 157 (11.1%) |
| $500 to $799 | 490 (15.1%) | 537 (37.9%) |
| $800 to $999 | 495 (15.3%) | 261 (18.4%) |
| $1,000 to $1,499 | 769 (23.7%) | 254 (17.9%) |
| $1,500 to $1,999 | 275 (8.5%) | 60 (4.2%) |
| $2,000 to $2,499 | 58 (1.8%) | 13 (0.9%) |
| $2,500 to $2,999 | 5 (0.2%) | 0 (0.0%) |
| $3,000 or more | 13 (0.4%) | 0 (0.0%) |
| Total | 3,240 (100.0%) | 1,416 (100.0%) |
Physical Housing Characteristics in Madison Heights
Housing Structures in Madison Heights
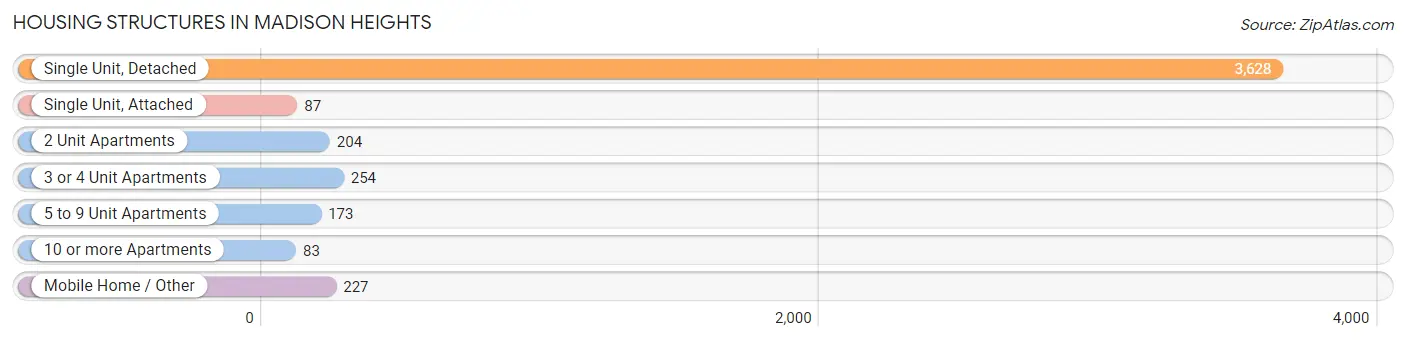
| Structure Type | # Housing Units | % Housing Units |
| Single Unit, Detached | 3,628 | 77.9% |
| Single Unit, Attached | 87 | 1.9% |
| 2 Unit Apartments | 204 | 4.4% |
| 3 or 4 Unit Apartments | 254 | 5.5% |
| 5 to 9 Unit Apartments | 173 | 3.7% |
| 10 or more Apartments | 83 | 1.8% |
| Mobile Home / Other | 227 | 4.9% |
| Total | 4,656 | 100.0% |
Housing Structures by Occupancy in Madison Heights
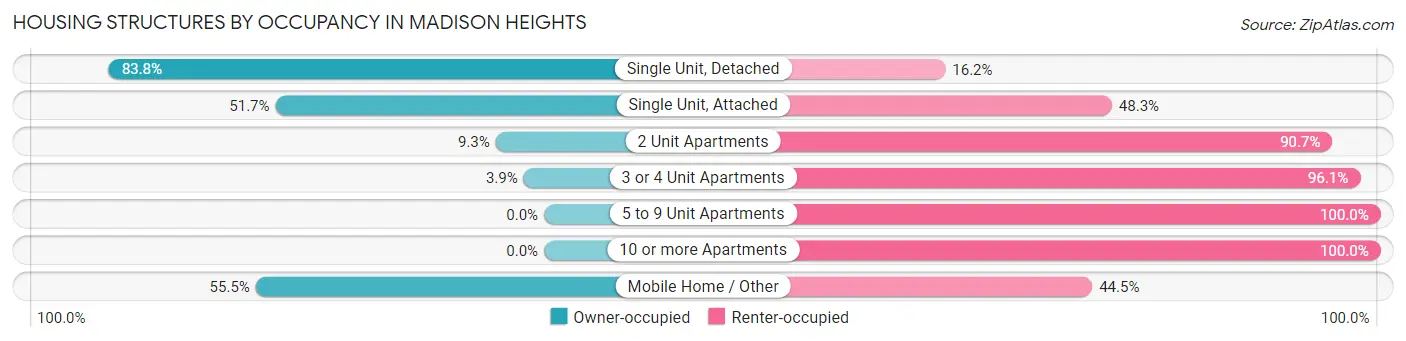
| Structure Type | Owner-occupied | Renter-occupied |
| Single Unit, Detached | 3,040 (83.8%) | 588 (16.2%) |
| Single Unit, Attached | 45 (51.7%) | 42 (48.3%) |
| 2 Unit Apartments | 19 (9.3%) | 185 (90.7%) |
| 3 or 4 Unit Apartments | 10 (3.9%) | 244 (96.1%) |
| 5 to 9 Unit Apartments | 0 (0.0%) | 173 (100.0%) |
| 10 or more Apartments | 0 (0.0%) | 83 (100.0%) |
| Mobile Home / Other | 126 (55.5%) | 101 (44.5%) |
| Total | 3,240 (69.6%) | 1,416 (30.4%) |
Housing Structures by Number of Rooms in Madison Heights
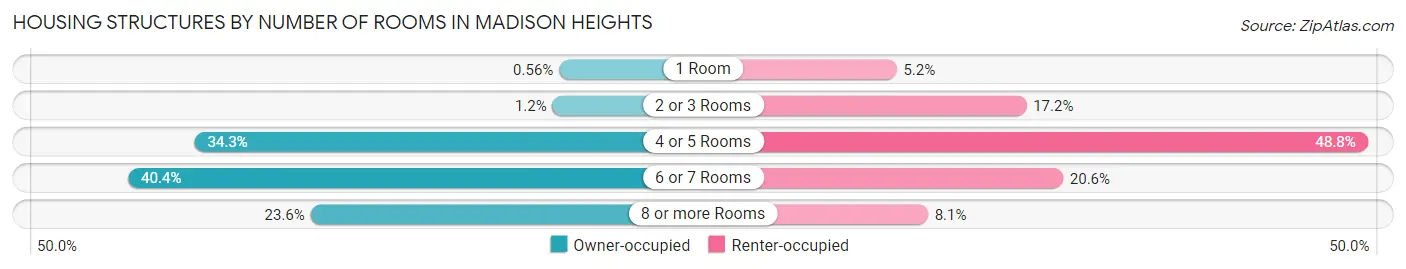
| Number of Rooms | Owner-occupied | Renter-occupied |
| 1 Room | 18 (0.6%) | 74 (5.2%) |
| 2 or 3 Rooms | 38 (1.2%) | 244 (17.2%) |
| 4 or 5 Rooms | 1,111 (34.3%) | 691 (48.8%) |
| 6 or 7 Rooms | 1,310 (40.4%) | 292 (20.6%) |
| 8 or more Rooms | 763 (23.5%) | 115 (8.1%) |
| Total | 3,240 (100.0%) | 1,416 (100.0%) |
Housing Structure by Heating Type in Madison Heights
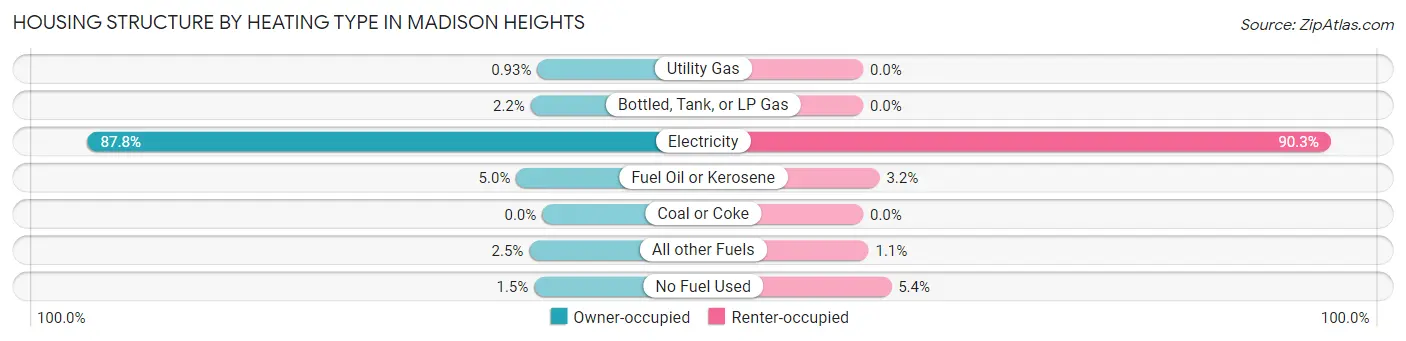
| Heating Type | Owner-occupied | Renter-occupied |
| Utility Gas | 30 (0.9%) | 0 (0.0%) |
| Bottled, Tank, or LP Gas | 72 (2.2%) | 0 (0.0%) |
| Electricity | 2,845 (87.8%) | 1,279 (90.3%) |
| Fuel Oil or Kerosene | 162 (5.0%) | 45 (3.2%) |
| Coal or Coke | 0 (0.0%) | 0 (0.0%) |
| All other Fuels | 81 (2.5%) | 15 (1.1%) |
| No Fuel Used | 50 (1.5%) | 77 (5.4%) |
| Total | 3,240 (100.0%) | 1,416 (100.0%) |
Household Vehicle Usage in Madison Heights
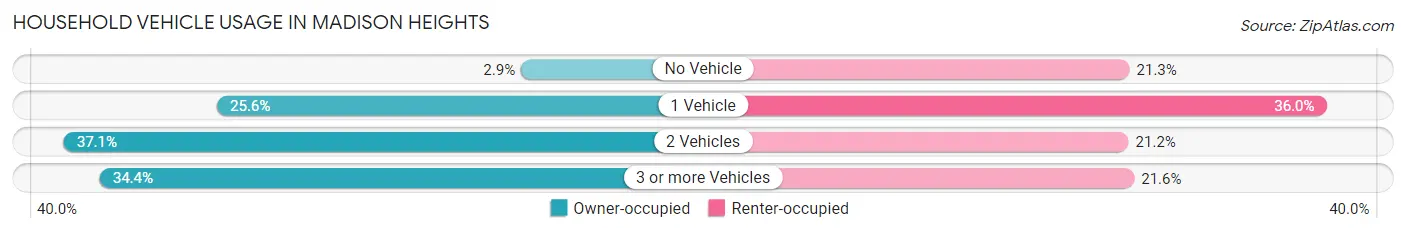
| Vehicles per Household | Owner-occupied | Renter-occupied |
| No Vehicle | 95 (2.9%) | 301 (21.3%) |
| 1 Vehicle | 830 (25.6%) | 509 (35.9%) |
| 2 Vehicles | 1,201 (37.1%) | 300 (21.2%) |
| 3 or more Vehicles | 1,114 (34.4%) | 306 (21.6%) |
| Total | 3,240 (100.0%) | 1,416 (100.0%) |
Real Estate & Mortgages in Madison Heights
Real Estate and Mortgage Overview in Madison Heights
| Characteristic | Without Mortgage | With Mortgage |
| Housing Units | 1,309 | 1,931 |
| Median Property Value | $141,600 | $176,400 |
| Median Household Income | $44,557 | $247 |
| Monthly Housing Costs | $317 | $13 |
| Real Estate Taxes | $701 | $39 |
Property Value by Mortgage Status in Madison Heights
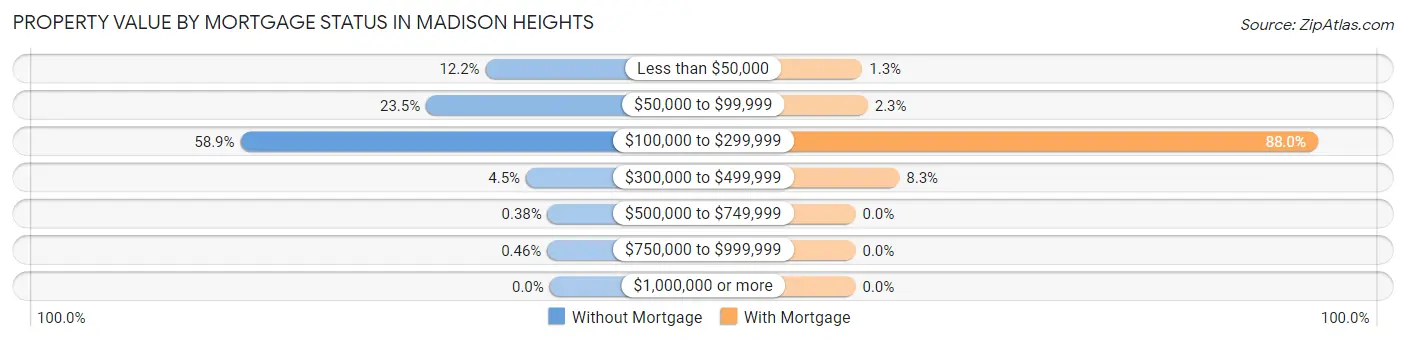
| Property Value | Without Mortgage | With Mortgage |
| Less than $50,000 | 160 (12.2%) | 25 (1.3%) |
| $50,000 to $99,999 | 308 (23.5%) | 45 (2.3%) |
| $100,000 to $299,999 | 771 (58.9%) | 1,700 (88.0%) |
| $300,000 to $499,999 | 59 (4.5%) | 161 (8.3%) |
| $500,000 to $749,999 | 5 (0.4%) | 0 (0.0%) |
| $750,000 to $999,999 | 6 (0.5%) | 0 (0.0%) |
| $1,000,000 or more | 0 (0.0%) | 0 (0.0%) |
| Total | 1,309 (100.0%) | 1,931 (100.0%) |
Household Income by Mortgage Status in Madison Heights
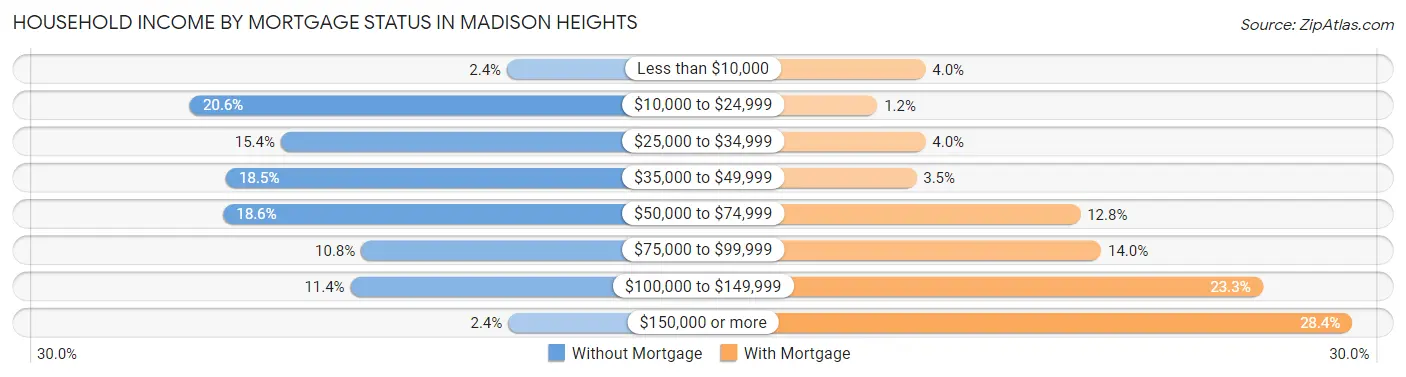
| Household Income | Without Mortgage | With Mortgage |
| Less than $10,000 | 32 (2.4%) | 77 (4.0%) |
| $10,000 to $24,999 | 269 (20.5%) | 24 (1.2%) |
| $25,000 to $34,999 | 201 (15.4%) | 77 (4.0%) |
| $35,000 to $49,999 | 242 (18.5%) | 67 (3.5%) |
| $50,000 to $74,999 | 244 (18.6%) | 248 (12.8%) |
| $75,000 to $99,999 | 141 (10.8%) | 271 (14.0%) |
| $100,000 to $149,999 | 149 (11.4%) | 449 (23.3%) |
| $150,000 or more | 31 (2.4%) | 548 (28.4%) |
| Total | 1,309 (100.0%) | 1,931 (100.0%) |
Property Value to Household Income Ratio in Madison Heights
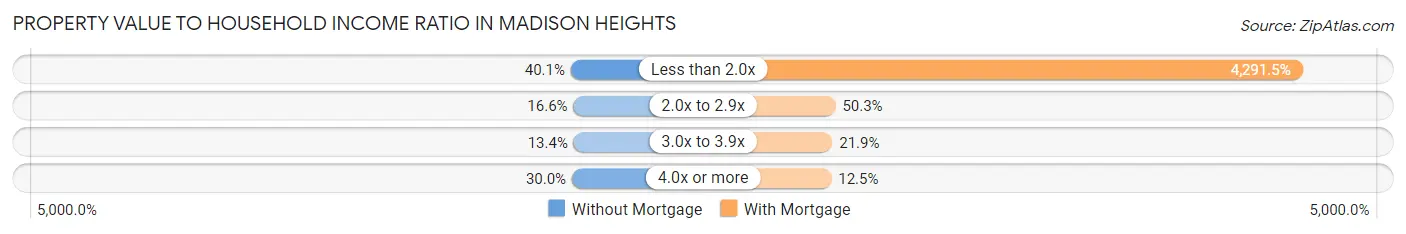
| Value-to-Income Ratio | Without Mortgage | With Mortgage |
| Less than 2.0x | 525 (40.1%) | 82,868 (4,291.5%) |
| 2.0x to 2.9x | 217 (16.6%) | 971 (50.3%) |
| 3.0x to 3.9x | 175 (13.4%) | 423 (21.9%) |
| 4.0x or more | 392 (29.9%) | 242 (12.5%) |
| Total | 1,309 (100.0%) | 1,931 (100.0%) |
Real Estate Taxes by Mortgage Status in Madison Heights
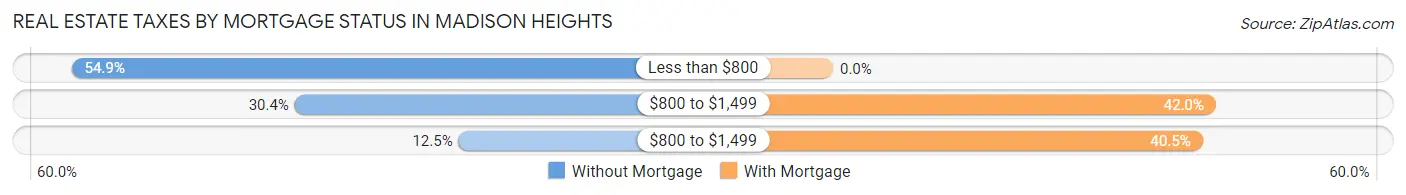
| Property Taxes | Without Mortgage | With Mortgage |
| Less than $800 | 718 (54.8%) | 0 (0.0%) |
| $800 to $1,499 | 398 (30.4%) | 810 (41.9%) |
| $800 to $1,499 | 163 (12.4%) | 782 (40.5%) |
| Total | 1,309 (100.0%) | 1,931 (100.0%) |
Health & Disability in Madison Heights
Health Insurance Coverage by Age in Madison Heights
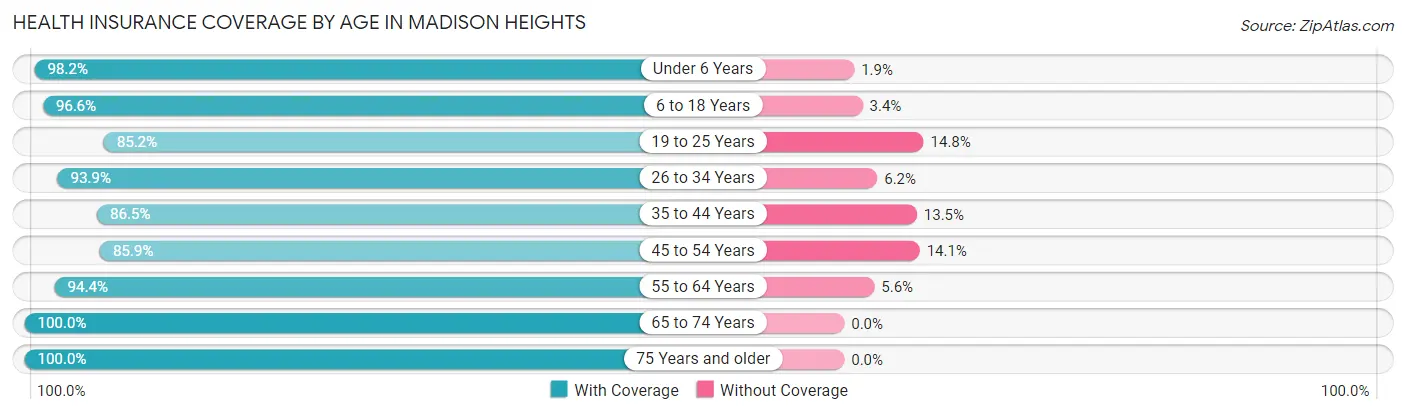
| Age Bracket | With Coverage | Without Coverage |
| Under 6 Years | 689 (98.2%) | 13 (1.8%) |
| 6 to 18 Years | 1,500 (96.6%) | 53 (3.4%) |
| 19 to 25 Years | 749 (85.2%) | 130 (14.8%) |
| 26 to 34 Years | 946 (93.9%) | 62 (6.1%) |
| 35 to 44 Years | 1,163 (86.5%) | 182 (13.5%) |
| 45 to 54 Years | 1,088 (85.9%) | 178 (14.1%) |
| 55 to 64 Years | 1,548 (94.4%) | 92 (5.6%) |
| 65 to 74 Years | 1,161 (100.0%) | 0 (0.0%) |
| 75 Years and older | 1,140 (100.0%) | 0 (0.0%) |
| Total | 9,984 (93.4%) | 710 (6.6%) |
Health Insurance Coverage by Citizenship Status in Madison Heights
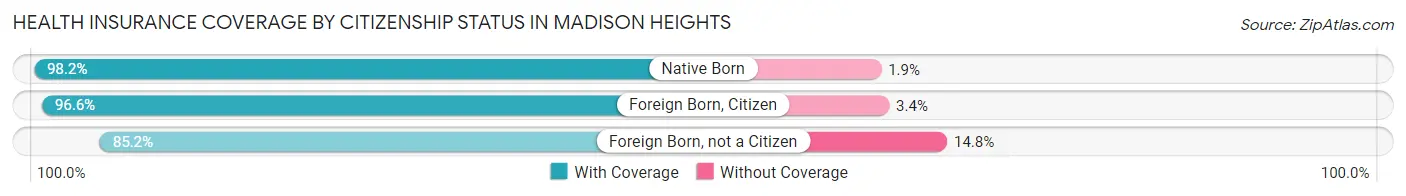
| Citizenship Status | With Coverage | Without Coverage |
| Native Born | 689 (98.2%) | 13 (1.8%) |
| Foreign Born, Citizen | 1,500 (96.6%) | 53 (3.4%) |
| Foreign Born, not a Citizen | 749 (85.2%) | 130 (14.8%) |
Health Insurance Coverage by Household Income in Madison Heights
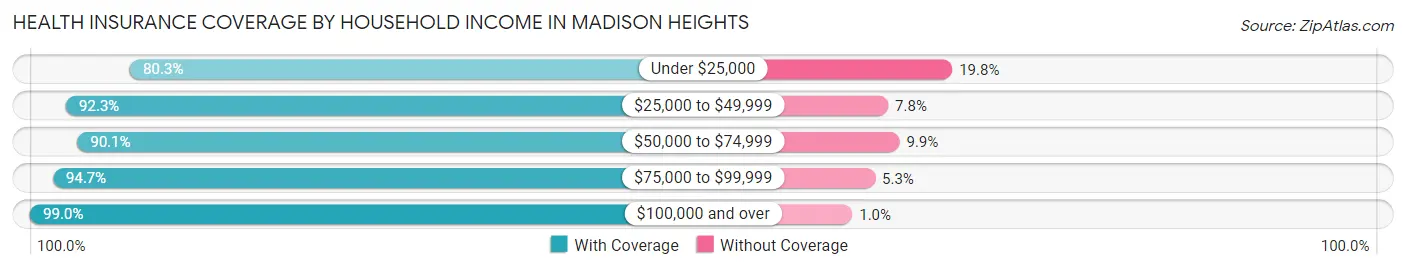
| Household Income | With Coverage | Without Coverage |
| Under $25,000 | 1,093 (80.2%) | 269 (19.8%) |
| $25,000 to $49,999 | 1,702 (92.2%) | 143 (7.7%) |
| $50,000 to $74,999 | 1,395 (90.1%) | 153 (9.9%) |
| $75,000 to $99,999 | 1,842 (94.7%) | 103 (5.3%) |
| $100,000 and over | 3,940 (99.0%) | 41 (1.0%) |
Public vs Private Health Insurance Coverage by Age in Madison Heights
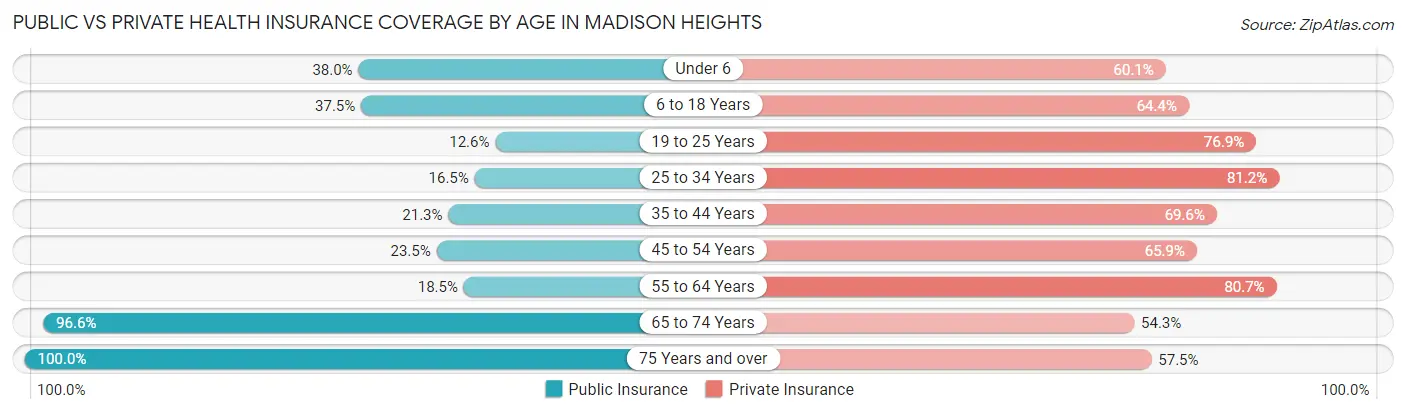
| Age Bracket | Public Insurance | Private Insurance |
| Under 6 | 267 (38.0%) | 422 (60.1%) |
| 6 to 18 Years | 583 (37.5%) | 1,000 (64.4%) |
| 19 to 25 Years | 111 (12.6%) | 676 (76.9%) |
| 25 to 34 Years | 166 (16.5%) | 818 (81.1%) |
| 35 to 44 Years | 287 (21.3%) | 936 (69.6%) |
| 45 to 54 Years | 298 (23.5%) | 834 (65.9%) |
| 55 to 64 Years | 303 (18.5%) | 1,323 (80.7%) |
| 65 to 74 Years | 1,121 (96.6%) | 630 (54.3%) |
| 75 Years and over | 1,140 (100.0%) | 655 (57.5%) |
| Total | 4,276 (40.0%) | 7,294 (68.2%) |
Disability Status by Sex by Age in Madison Heights
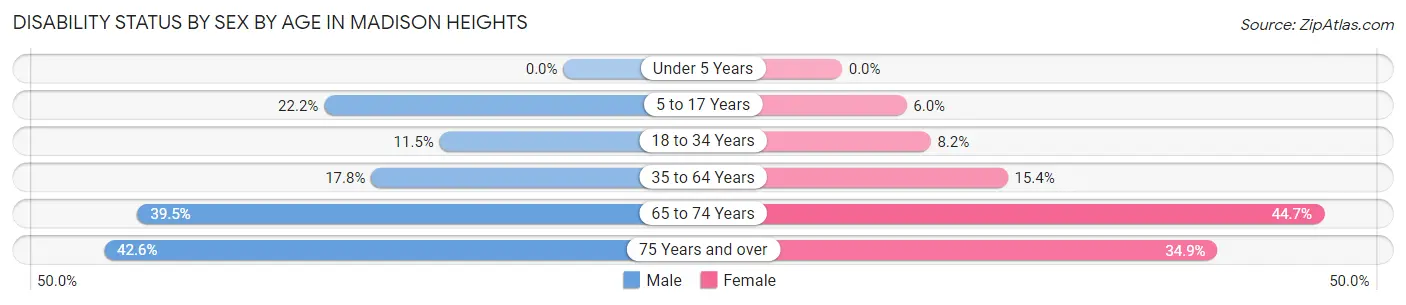
| Age Bracket | Male | Female |
| Under 5 Years | 0 (0.0%) | 0 (0.0%) |
| 5 to 17 Years | 202 (22.2%) | 40 (6.0%) |
| 18 to 34 Years | 122 (11.5%) | 76 (8.2%) |
| 35 to 64 Years | 350 (17.8%) | 352 (15.4%) |
| 65 to 74 Years | 200 (39.5%) | 293 (44.7%) |
| 75 Years and over | 179 (42.6%) | 251 (34.9%) |
Disability Class by Sex by Age in Madison Heights
Disability Class: Hearing Difficulty
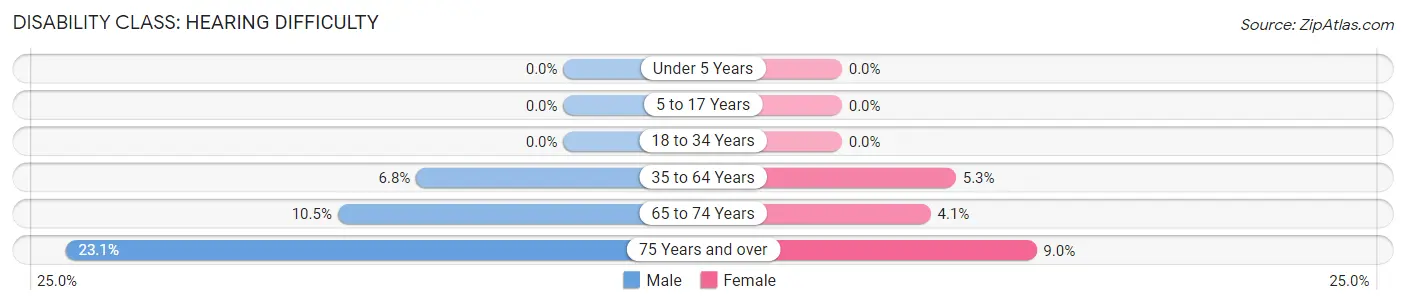
| Age Bracket | Male | Female |
| Under 5 Years | 0 (0.0%) | 0 (0.0%) |
| 5 to 17 Years | 0 (0.0%) | 0 (0.0%) |
| 18 to 34 Years | 0 (0.0%) | 0 (0.0%) |
| 35 to 64 Years | 134 (6.8%) | 121 (5.3%) |
| 65 to 74 Years | 53 (10.5%) | 27 (4.1%) |
| 75 Years and over | 97 (23.1%) | 65 (9.0%) |
Disability Class: Vision Difficulty
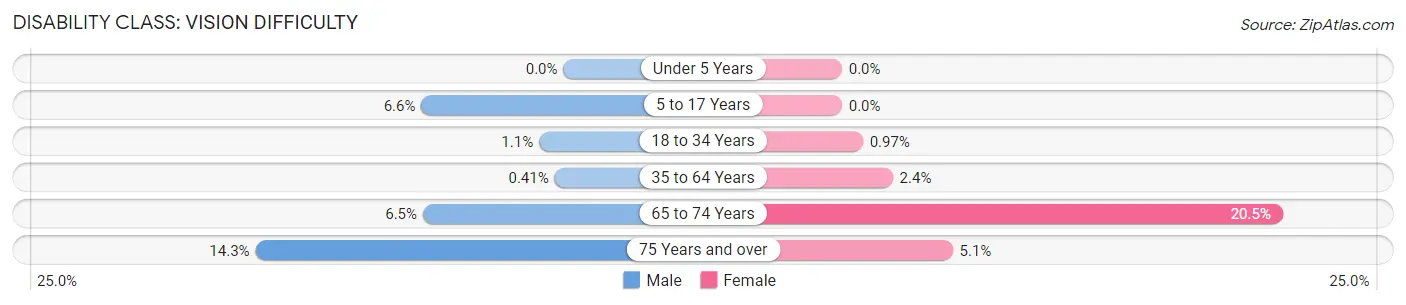
| Age Bracket | Male | Female |
| Under 5 Years | 0 (0.0%) | 0 (0.0%) |
| 5 to 17 Years | 60 (6.6%) | 0 (0.0%) |
| 18 to 34 Years | 12 (1.1%) | 9 (1.0%) |
| 35 to 64 Years | 8 (0.4%) | 54 (2.4%) |
| 65 to 74 Years | 33 (6.5%) | 134 (20.5%) |
| 75 Years and over | 60 (14.3%) | 37 (5.1%) |
Disability Class: Cognitive Difficulty
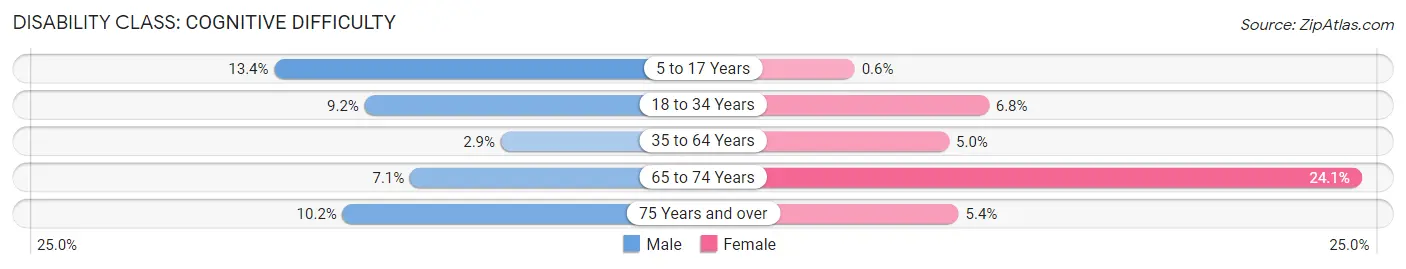
| Age Bracket | Male | Female |
| 5 to 17 Years | 122 (13.4%) | 4 (0.6%) |
| 18 to 34 Years | 98 (9.2%) | 63 (6.8%) |
| 35 to 64 Years | 57 (2.9%) | 114 (5.0%) |
| 65 to 74 Years | 36 (7.1%) | 158 (24.1%) |
| 75 Years and over | 43 (10.2%) | 39 (5.4%) |
Disability Class: Ambulatory Difficulty
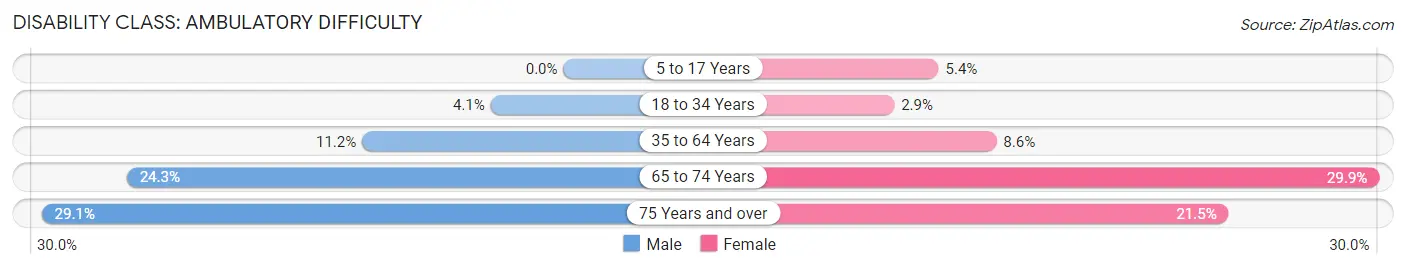
| Age Bracket | Male | Female |
| 5 to 17 Years | 0 (0.0%) | 36 (5.4%) |
| 18 to 34 Years | 43 (4.1%) | 27 (2.9%) |
| 35 to 64 Years | 220 (11.2%) | 197 (8.6%) |
| 65 to 74 Years | 123 (24.3%) | 196 (29.9%) |
| 75 Years and over | 122 (29.0%) | 155 (21.5%) |
Disability Class: Self-Care Difficulty
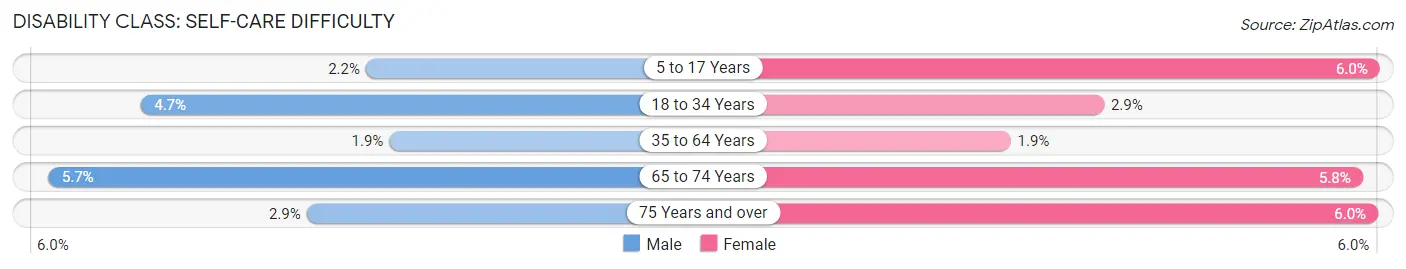
| Age Bracket | Male | Female |
| 5 to 17 Years | 20 (2.2%) | 40 (6.0%) |
| 18 to 34 Years | 50 (4.7%) | 27 (2.9%) |
| 35 to 64 Years | 38 (1.9%) | 43 (1.9%) |
| 65 to 74 Years | 29 (5.7%) | 38 (5.8%) |
| 75 Years and over | 12 (2.9%) | 43 (6.0%) |
Technology Access in Madison Heights
Computing Device Access in Madison Heights
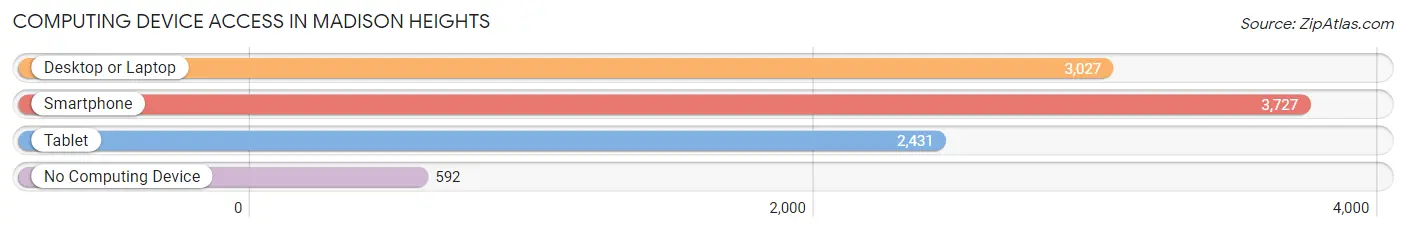
| Device Type | # Households | % Households |
| Desktop or Laptop | 3,027 | 65.0% |
| Smartphone | 3,727 | 80.0% |
| Tablet | 2,431 | 52.2% |
| No Computing Device | 592 | 12.7% |
| Total | 4,656 | 100.0% |
Internet Access in Madison Heights
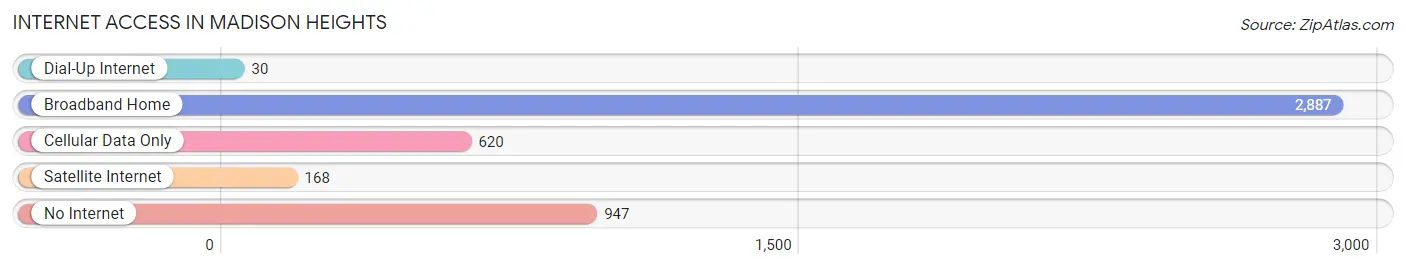
| Internet Type | # Households | % Households |
| Dial-Up Internet | 30 | 0.6% |
| Broadband Home | 2,887 | 62.0% |
| Cellular Data Only | 620 | 13.3% |
| Satellite Internet | 168 | 3.6% |
| No Internet | 947 | 20.3% |
| Total | 4,656 | 100.0% |
Madison Heights Summary
History
The town of Madison Heights, Virginia is located in the heart of the Blue Ridge Mountains in Amherst County. The town was founded in 1820 and was originally known as “Mountain View”. The town was renamed Madison Heights in 1872 in honor of President James Madison. The town was a small farming community until the late 19th century when the railroad came through and the town began to grow. The railroad brought with it new industry and businesses, and the town began to thrive.
In the early 20th century, Madison Heights was a bustling small town with a variety of businesses, including a bank, a hotel, a movie theater, and a variety of stores. The town was also home to a number of churches, including the Madison Heights Baptist Church, which was founded in 1872.
The town continued to grow throughout the 20th century, and by the year 2000, Madison Heights had a population of approximately 2,000 people. The town is still a small, rural community, but it has seen some growth in recent years due to its proximity to Lynchburg and Charlottesville.
Geography
Madison Heights is located in the foothills of the Blue Ridge Mountains in Amherst County, Virginia. The town is situated at the intersection of US Route 29 and US Route 60, and is approximately 30 miles south of Lynchburg and 40 miles north of Charlottesville.
The town is surrounded by rolling hills and lush forests, and is home to a variety of wildlife, including deer, foxes, and wild turkeys. The town is also home to a number of small lakes and streams, including the Madison Heights Reservoir, which is a popular spot for fishing and boating.
Economy
The economy of Madison Heights is largely based on agriculture and tourism. The town is home to a number of farms, which produce a variety of crops, including corn, soybeans, and hay. The town is also home to a number of small businesses, including restaurants, shops, and a variety of services.
The town is also a popular tourist destination, as it is located in the heart of the Blue Ridge Mountains. The town is home to a number of attractions, including the Madison Heights Reservoir, which is a popular spot for fishing and boating. The town is also home to a number of historic sites, including the Madison Heights Baptist Church, which was founded in 1872.
Demographics
As of the 2010 census, the population of Madison Heights was 2,093. The town is predominantly white, with approximately 90% of the population identifying as white. The town is also home to a small African American population, with approximately 5% of the population identifying as African American. The town is also home to a small Hispanic population, with approximately 2% of the population identifying as Hispanic.
The median household income in Madison Heights is $45,000, and the median home value is $150,000. The town has a low unemployment rate, with only 4.2% of the population unemployed. The town also has a low poverty rate, with only 8.3% of the population living below the poverty line.
Common Questions
What is Per Capita Income in Madison Heights?
Per Capita income in Madison Heights is $32,380.
What is the Median Family Income in Madison Heights?
Median Family Income in Madison Heights is $78,150.
What is the Median Household income in Madison Heights?
Median Household Income in Madison Heights is $59,570.
What is Income or Wage Gap in Madison Heights?
Income or Wage Gap in Madison Heights is 14.0%.
Women in Madison Heights earn 86.0 cents for every dollar earned by a man.
What is Inequality or Gini Index in Madison Heights?
Inequality or Gini Index in Madison Heights is 0.45.
What is the Total Population of Madison Heights?
Total Population of Madison Heights is 10,694.
What is the Total Male Population of Madison Heights?
Total Male Population of Madison Heights is 5,191.
What is the Total Female Population of Madison Heights?
Total Female Population of Madison Heights is 5,503.
What is the Ratio of Males per 100 Females in Madison Heights?
There are 94.33 Males per 100 Females in Madison Heights.
What is the Ratio of Females per 100 Males in Madison Heights?
There are 106.01 Females per 100 Males in Madison Heights.
What is the Median Population Age in Madison Heights?
Median Population Age in Madison Heights is 44.1 Years.
What is the Average Family Size in Madison Heights
Average Family Size in Madison Heights is 3.0 People.
What is the Average Household Size in Madison Heights
Average Household Size in Madison Heights is 2.3 People.
How Large is the Labor Force in Madison Heights?
There are 5,472 People in the Labor Forcein in Madison Heights.
What is the Percentage of People in the Labor Force in Madison Heights?
62.6% of People are in the Labor Force in Madison Heights.
What is the Unemployment Rate in Madison Heights?
Unemployment Rate in Madison Heights is 5.1%.