Hollins, VA Map & Demographics
Hollins Map
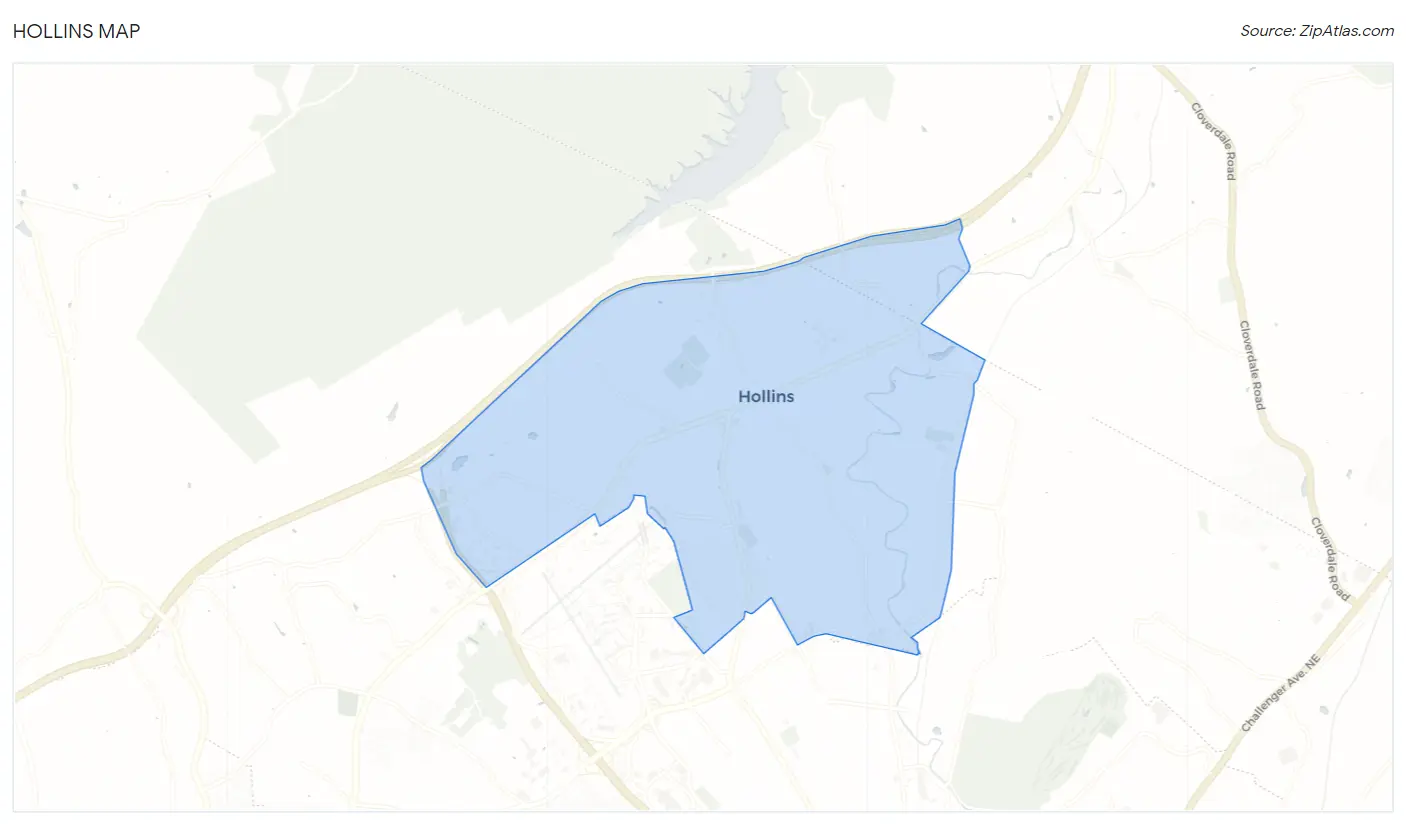
Hollins Overview
$35,038
PER CAPITA INCOME
$81,854
AVG FAMILY INCOME
$71,530
AVG HOUSEHOLD INCOME
5.5%
WAGE / INCOME GAP [ % ]
94.5¢/ $1
WAGE / INCOME GAP [ $ ]
$15,551
FAMILY INCOME DEFICIT
0.39
INEQUALITY / GINI INDEX
16,386
TOTAL POPULATION
7,566
MALE POPULATION
8,820
FEMALE POPULATION
85.78
MALES / 100 FEMALES
116.57
FEMALES / 100 MALES
46.0
MEDIAN AGE
3.0
AVG FAMILY SIZE
2.3
AVG HOUSEHOLD SIZE
7,978
LABOR FORCE [ PEOPLE ]
56.6%
PERCENT IN LABOR FORCE
3.0%
UNEMPLOYMENT RATE
Hollins Area Codes
Income in Hollins
Income Overview in Hollins
Per Capita Income in Hollins is $35,038, while median incomes of families and households are $81,854 and $71,530 respectively.
| Characteristic | Number | Measure |
| Per Capita Income | 16,386 | $35,038 |
| Median Family Income | 3,910 | $81,854 |
| Mean Family Income | 3,910 | $98,773 |
| Median Household Income | 6,622 | $71,530 |
| Mean Household Income | 6,622 | $83,640 |
| Income Deficit | 3,910 | $15,551 |
| Wage / Income Gap (%) | 16,386 | 5.46% |
| Wage / Income Gap ($) | 16,386 | 94.54¢ per $1 |
| Gini / Inequality Index | 16,386 | 0.39 |
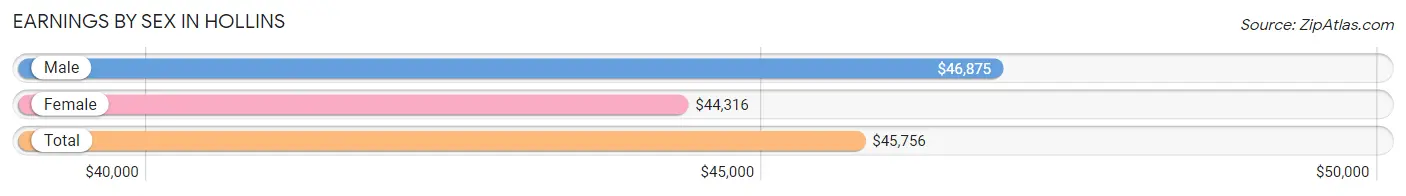
Earnings by Sex in Hollins
Average Earnings in Hollins are $45,756, $46,875 for men and $44,316 for women, a difference of 5.5%.
| Sex | Number | Average Earnings |
| Male | 4,326 (51.8%) | $46,875 |
| Female | 4,023 (48.2%) | $44,316 |
| Total | 8,349 (100.0%) | $45,756 |
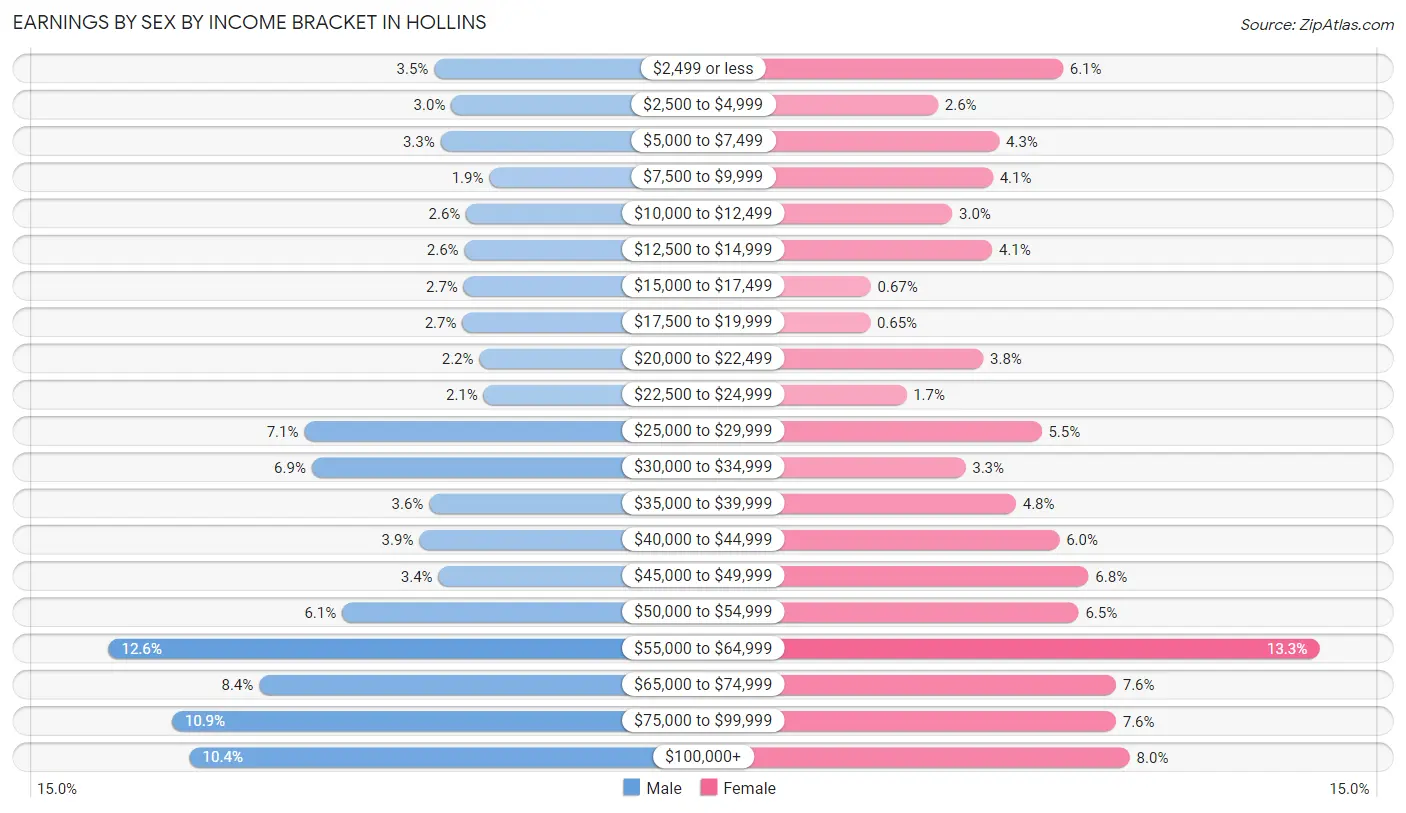
Earnings by Sex by Income Bracket in Hollins
The most common earnings brackets in Hollins are $55,000 to $64,999 for men (547 | 12.6%) and $55,000 to $64,999 for women (534 | 13.3%).
| Income | Male | Female |
| $2,499 or less | 151 (3.5%) | 244 (6.1%) |
| $2,500 to $4,999 | 130 (3.0%) | 103 (2.6%) |
| $5,000 to $7,499 | 143 (3.3%) | 172 (4.3%) |
| $7,500 to $9,999 | 84 (1.9%) | 165 (4.1%) |
| $10,000 to $12,499 | 112 (2.6%) | 119 (3.0%) |
| $12,500 to $14,999 | 114 (2.6%) | 164 (4.1%) |
| $15,000 to $17,499 | 115 (2.7%) | 27 (0.7%) |
| $17,500 to $19,999 | 117 (2.7%) | 26 (0.6%) |
| $20,000 to $22,499 | 96 (2.2%) | 154 (3.8%) |
| $22,500 to $24,999 | 91 (2.1%) | 67 (1.7%) |
| $25,000 to $29,999 | 309 (7.1%) | 220 (5.5%) |
| $30,000 to $34,999 | 300 (6.9%) | 134 (3.3%) |
| $35,000 to $39,999 | 157 (3.6%) | 191 (4.8%) |
| $40,000 to $44,999 | 169 (3.9%) | 240 (6.0%) |
| $45,000 to $49,999 | 146 (3.4%) | 273 (6.8%) |
| $50,000 to $54,999 | 263 (6.1%) | 262 (6.5%) |
| $55,000 to $64,999 | 547 (12.6%) | 534 (13.3%) |
| $65,000 to $74,999 | 364 (8.4%) | 304 (7.6%) |
| $75,000 to $99,999 | 470 (10.9%) | 304 (7.6%) |
| $100,000+ | 448 (10.4%) | 320 (8.0%) |
| Total | 4,326 (100.0%) | 4,023 (100.0%) |
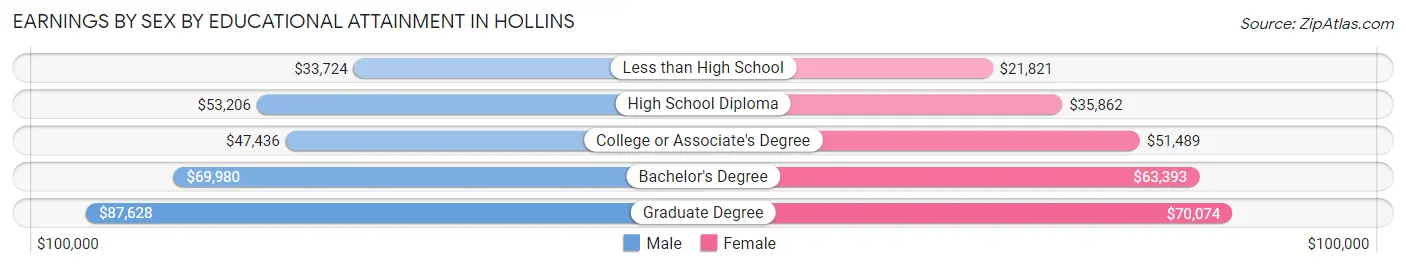
Earnings by Sex by Educational Attainment in Hollins
Average earnings in Hollins are $55,013 for men and $49,971 for women, a difference of 9.2%. Men with an educational attainment of graduate degree enjoy the highest average annual earnings of $87,628, while those with less than high school education earn the least with $33,724. Women with an educational attainment of graduate degree earn the most with the average annual earnings of $70,074, while those with less than high school education have the smallest earnings of $21,821.
| Educational Attainment | Male Income | Female Income |
| Less than High School | $33,724 | $21,821 |
| High School Diploma | $53,206 | $35,862 |
| College or Associate's Degree | $47,436 | $51,489 |
| Bachelor's Degree | $69,980 | $63,393 |
| Graduate Degree | $87,628 | $70,074 |
| Total | $55,013 | $49,971 |
Family Income in Hollins
Family Income Brackets in Hollins
According to the Hollins family income data, there are 989 families falling into the $100,000 to $149,999 income range, which is the most common income bracket and makes up 25.3% of all families. Conversely, the $10,000 to $14,999 income bracket is the least frequent group with only 23 families (0.6%) belonging to this category.
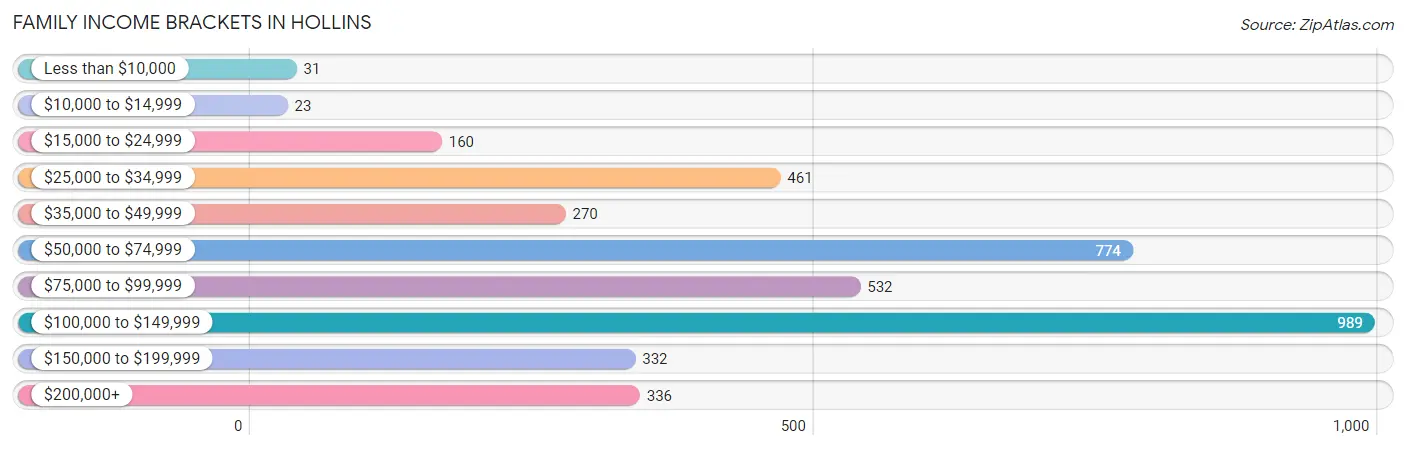
| Income Bracket | # Families | % Families |
| Less than $10,000 | 31 | 0.8% |
| $10,000 to $14,999 | 23 | 0.6% |
| $15,000 to $24,999 | 160 | 4.1% |
| $25,000 to $34,999 | 461 | 11.8% |
| $35,000 to $49,999 | 270 | 6.9% |
| $50,000 to $74,999 | 774 | 19.8% |
| $75,000 to $99,999 | 532 | 13.6% |
| $100,000 to $149,999 | 989 | 25.3% |
| $150,000 to $199,999 | 332 | 8.5% |
| $200,000+ | 336 | 8.6% |
Family Income by Famaliy Size in Hollins
4-person families (452 | 11.6%) account for the highest median family income in Hollins with $122,647 per family, while 2-person families (2,105 | 53.8%) have the highest median income of $34,326 per family member.
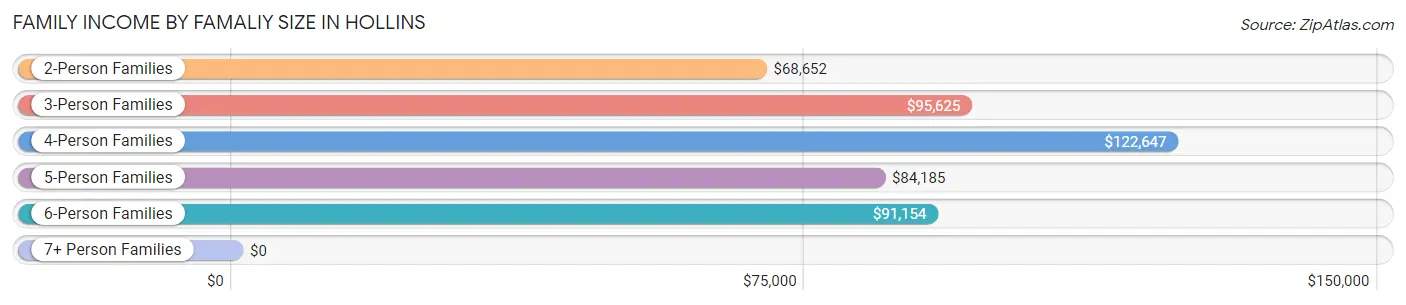
| Income Bracket | # Families | Median Income |
| 2-Person Families | 2,105 (53.8%) | $68,652 |
| 3-Person Families | 871 (22.3%) | $95,625 |
| 4-Person Families | 452 (11.6%) | $122,647 |
| 5-Person Families | 363 (9.3%) | $84,185 |
| 6-Person Families | 94 (2.4%) | $91,154 |
| 7+ Person Families | 25 (0.6%) | $0 |
| Total | 3,910 (100.0%) | $81,854 |
Family Income by Number of Earners in Hollins
The median family income in Hollins is $81,854, with families comprising 3+ earners (621) having the highest median family income of $143,601, while families with no earners (827) have the lowest median family income of $34,189, accounting for 15.9% and 21.1% of families, respectively.
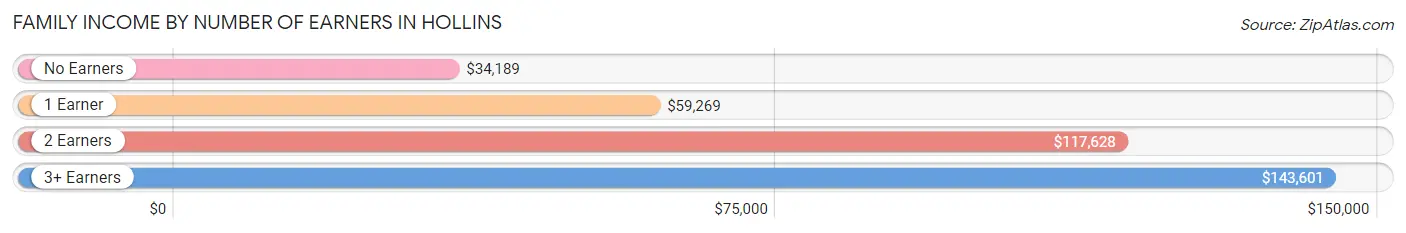
| Number of Earners | # Families | Median Income |
| No Earners | 827 (21.1%) | $34,189 |
| 1 Earner | 1,178 (30.1%) | $59,269 |
| 2 Earners | 1,284 (32.8%) | $117,628 |
| 3+ Earners | 621 (15.9%) | $143,601 |
| Total | 3,910 (100.0%) | $81,854 |
Household Income in Hollins
Household Income Brackets in Hollins
With 1,285 households falling in the category, the $100,000 to $149,999 income range is the most frequent in Hollins, accounting for 19.4% of all households. In contrast, only 139 households (2.1%) fall into the less than $10,000 income bracket, making it the least populous group.
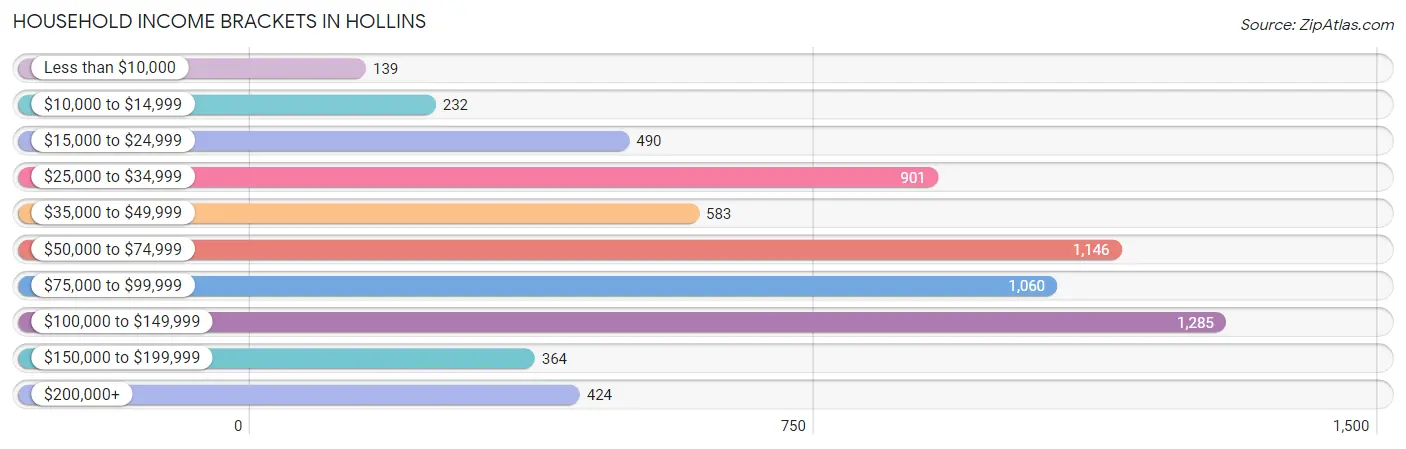
| Income Bracket | # Households | % Households |
| Less than $10,000 | 139 | 2.1% |
| $10,000 to $14,999 | 232 | 3.5% |
| $15,000 to $24,999 | 490 | 7.4% |
| $25,000 to $34,999 | 901 | 13.6% |
| $35,000 to $49,999 | 583 | 8.8% |
| $50,000 to $74,999 | 1,146 | 17.3% |
| $75,000 to $99,999 | 1,060 | 16.0% |
| $100,000 to $149,999 | 1,285 | 19.4% |
| $150,000 to $199,999 | 364 | 5.5% |
| $200,000+ | 424 | 6.4% |
Household Income by Householder Age in Hollins
The median household income in Hollins is $71,530, with the highest median household income of $99,722 found in the 45 to 64 years age bracket for the primary householder. A total of 2,018 households (30.5%) fall into this category. Meanwhile, the 15 to 24 years age bracket for the primary householder has the lowest median household income of $0, with 174 households (2.6%) in this group.
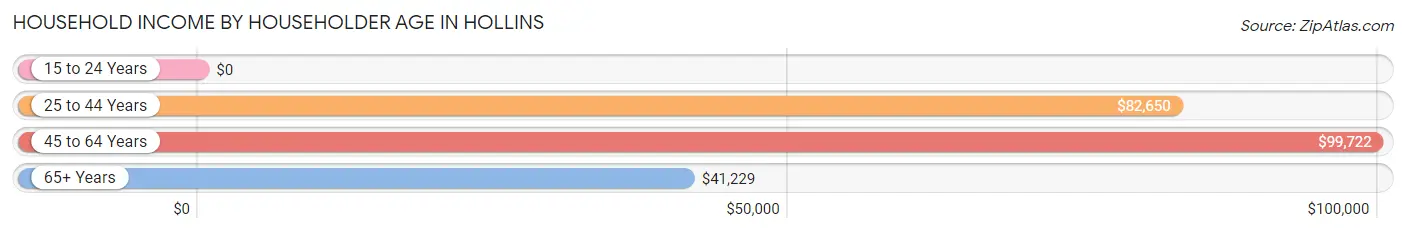
| Income Bracket | # Households | Median Income |
| 15 to 24 Years | 174 (2.6%) | $0 |
| 25 to 44 Years | 1,691 (25.5%) | $82,650 |
| 45 to 64 Years | 2,018 (30.5%) | $99,722 |
| 65+ Years | 2,739 (41.4%) | $41,229 |
| Total | 6,622 (100.0%) | $71,530 |
Poverty in Hollins
Income Below Poverty by Sex and Age in Hollins
With 6.4% poverty level for males and 6.7% for females among the residents of Hollins, 16 and 17 year old males and 16 and 17 year old females are the most vulnerable to poverty, with 40 males (19.5%) and 49 females (21.9%) in their respective age groups living below the poverty level.
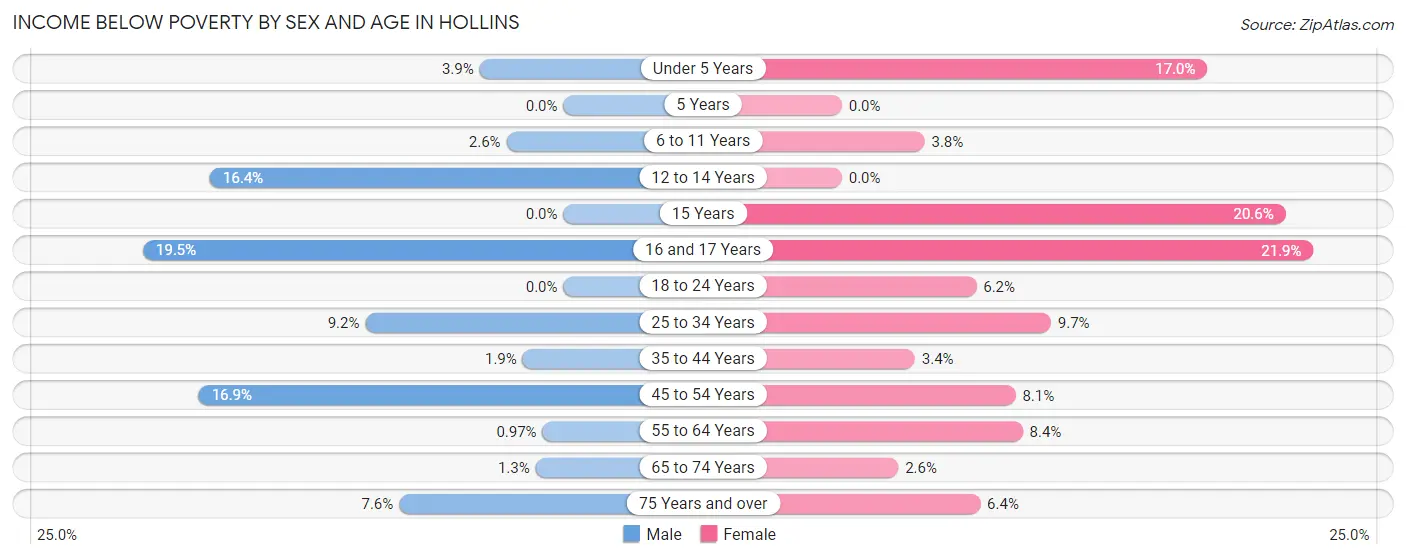
| Age Bracket | Male | Female |
| Under 5 Years | 11 (3.9%) | 29 (17.0%) |
| 5 Years | 0 (0.0%) | 0 (0.0%) |
| 6 to 11 Years | 13 (2.6%) | 17 (3.8%) |
| 12 to 14 Years | 51 (16.4%) | 0 (0.0%) |
| 15 Years | 0 (0.0%) | 14 (20.6%) |
| 16 and 17 Years | 40 (19.5%) | 49 (21.9%) |
| 18 to 24 Years | 0 (0.0%) | 34 (6.2%) |
| 25 to 34 Years | 92 (9.2%) | 85 (9.7%) |
| 35 to 44 Years | 15 (1.9%) | 31 (3.4%) |
| 45 to 54 Years | 187 (16.9%) | 72 (8.1%) |
| 55 to 64 Years | 9 (1.0%) | 100 (8.4%) |
| 65 to 74 Years | 11 (1.3%) | 37 (2.6%) |
| 75 Years and over | 47 (7.6%) | 67 (6.4%) |
| Total | 476 (6.4%) | 535 (6.7%) |
Income Above Poverty by Sex and Age in Hollins
According to the poverty statistics in Hollins, males aged 5 years and females aged 5 years are the age groups that are most secure financially, with 100.0% of males and 100.0% of females in these age groups living above the poverty line.
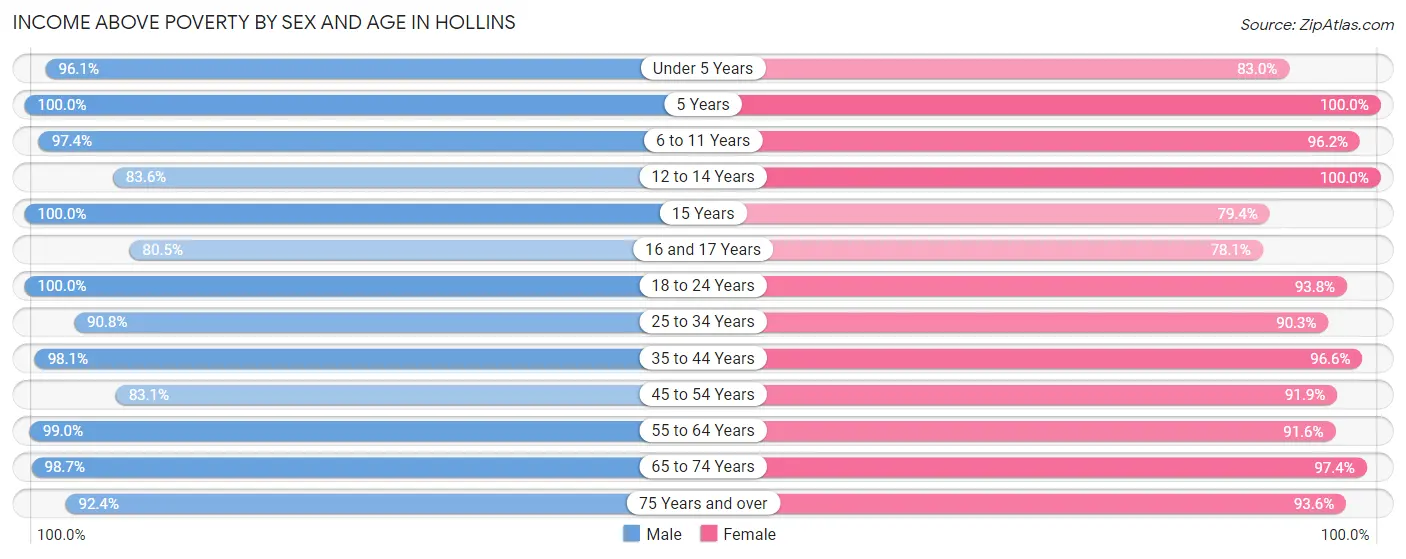
| Age Bracket | Male | Female |
| Under 5 Years | 272 (96.1%) | 142 (83.0%) |
| 5 Years | 113 (100.0%) | 57 (100.0%) |
| 6 to 11 Years | 480 (97.4%) | 426 (96.2%) |
| 12 to 14 Years | 260 (83.6%) | 187 (100.0%) |
| 15 Years | 129 (100.0%) | 54 (79.4%) |
| 16 and 17 Years | 165 (80.5%) | 175 (78.1%) |
| 18 to 24 Years | 571 (100.0%) | 511 (93.8%) |
| 25 to 34 Years | 909 (90.8%) | 791 (90.3%) |
| 35 to 44 Years | 779 (98.1%) | 883 (96.6%) |
| 45 to 54 Years | 918 (83.1%) | 821 (91.9%) |
| 55 to 64 Years | 921 (99.0%) | 1,092 (91.6%) |
| 65 to 74 Years | 840 (98.7%) | 1,376 (97.4%) |
| 75 Years and over | 570 (92.4%) | 977 (93.6%) |
| Total | 6,927 (93.6%) | 7,492 (93.3%) |
Income Below Poverty Among Married-Couple Families in Hollins
The poverty statistics for married-couple families in Hollins show that 1.0% or 28 of the total 2,875 families live below the poverty line. Families with 3 or 4 children have the highest poverty rate of 5.4%, comprising of 17 families. On the other hand, families with no children have the lowest poverty rate of 0.0%, which includes 0 families.
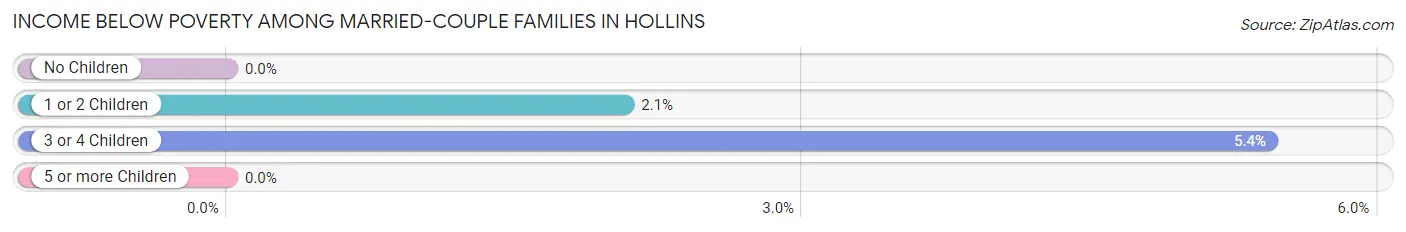
| Children | Above Poverty | Below Poverty |
| No Children | 2,030 (100.0%) | 0 (0.0%) |
| 1 or 2 Children | 521 (97.9%) | 11 (2.1%) |
| 3 or 4 Children | 296 (94.6%) | 17 (5.4%) |
| 5 or more Children | 0 (0.0%) | 0 (0.0%) |
| Total | 2,847 (99.0%) | 28 (1.0%) |
Income Below Poverty Among Single-Parent Households in Hollins
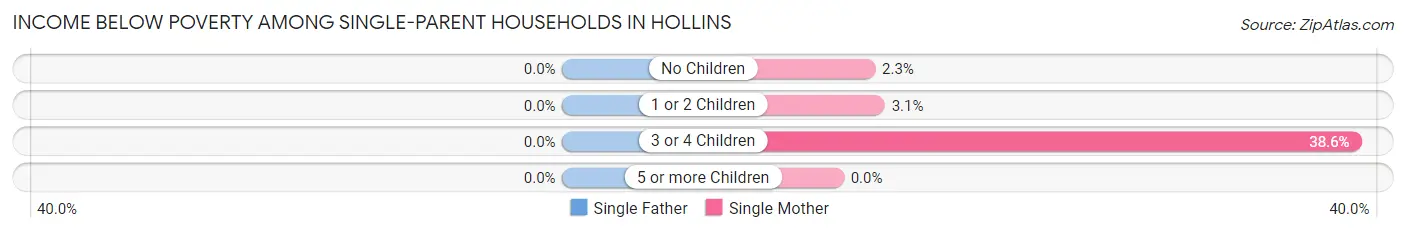
| Children | Single Father | Single Mother |
| No Children | 0 (0.0%) | 7 (2.3%) |
| 1 or 2 Children | 0 (0.0%) | 12 (3.1%) |
| 3 or 4 Children | 0 (0.0%) | 27 (38.6%) |
| 5 or more Children | 0 (0.0%) | 0 (0.0%) |
| Total | 0 (0.0%) | 46 (6.0%) |
Income Below Poverty Among Married-Couple vs Single-Parent Households in Hollins
The poverty data for Hollins shows that 28 of the married-couple family households (1.0%) and 46 of the single-parent households (4.4%) are living below the poverty level. Within the married-couple family households, those with 3 or 4 children have the highest poverty rate, with 17 households (5.4%) falling below the poverty line. Among the single-parent households, those with 3 or 4 children have the highest poverty rate, with 27 household (38.6%) living below poverty.
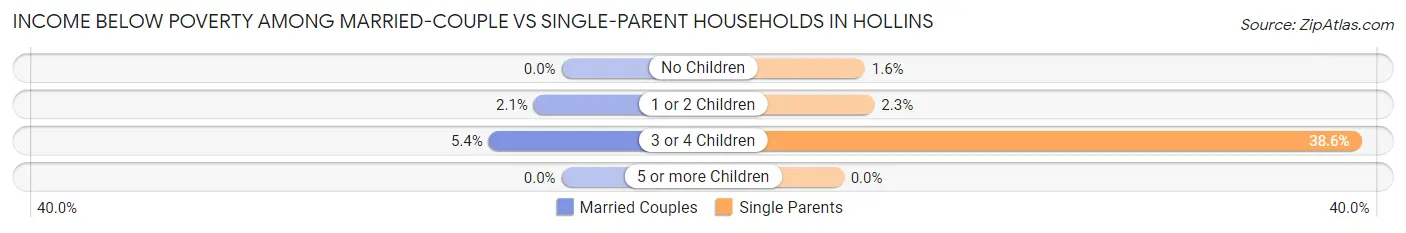
| Children | Married-Couple Families | Single-Parent Households |
| No Children | 0 (0.0%) | 7 (1.6%) |
| 1 or 2 Children | 11 (2.1%) | 12 (2.3%) |
| 3 or 4 Children | 17 (5.4%) | 27 (38.6%) |
| 5 or more Children | 0 (0.0%) | 0 (0.0%) |
| Total | 28 (1.0%) | 46 (4.4%) |
Race in Hollins
The most populous races in Hollins are White / Caucasian (13,213 | 80.6%), Black / African American (1,797 | 11.0%), and Hispanic or Latino (754 | 4.6%).
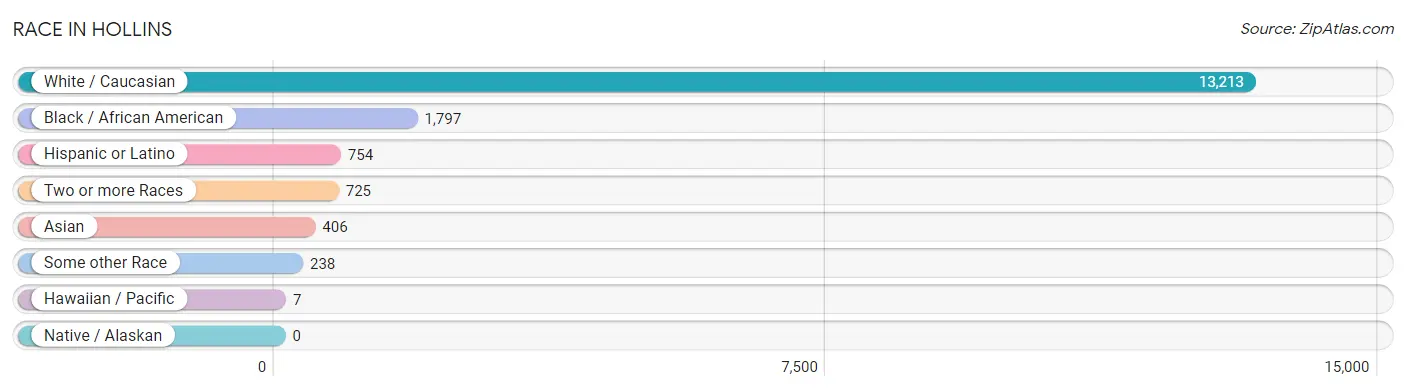
| Race | # Population | % Population |
| Asian | 406 | 2.5% |
| Black / African American | 1,797 | 11.0% |
| Hawaiian / Pacific | 7 | 0.0% |
| Hispanic or Latino | 754 | 4.6% |
| Native / Alaskan | 0 | 0.0% |
| White / Caucasian | 13,213 | 80.6% |
| Two or more Races | 725 | 4.4% |
| Some other Race | 238 | 1.5% |
| Total | 16,386 | 100.0% |
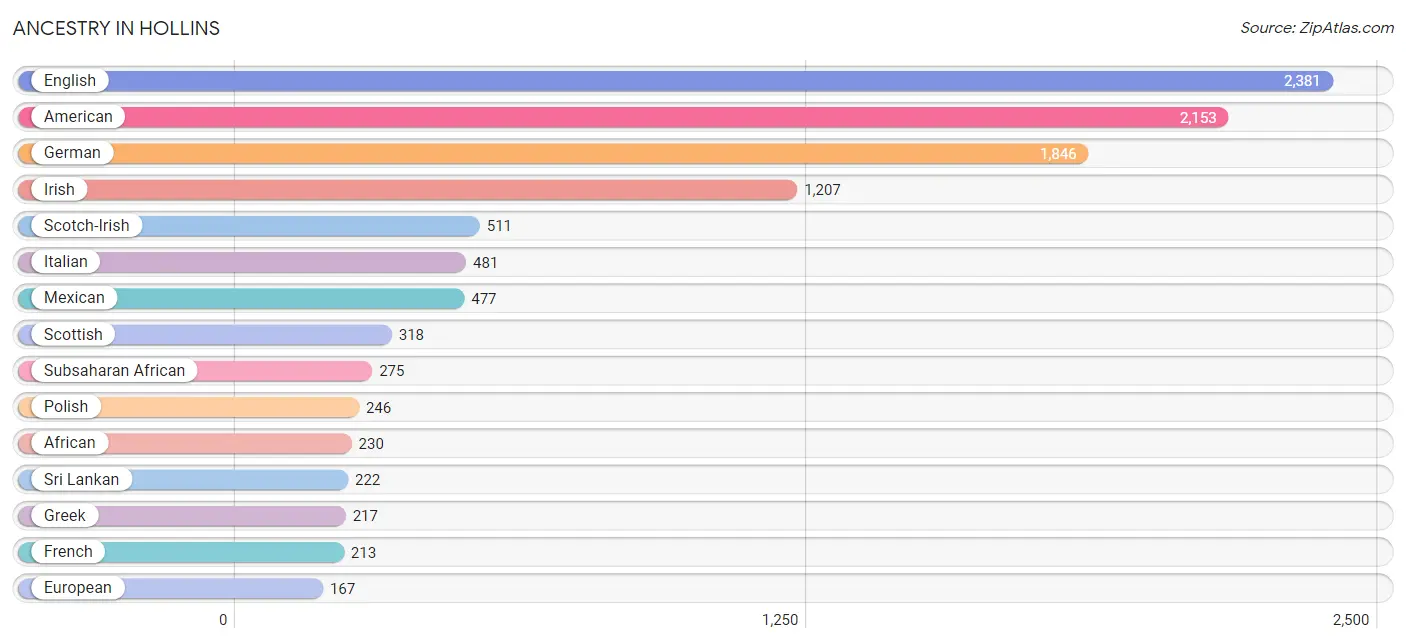
Ancestry in Hollins
The most populous ancestries reported in Hollins are English (2,381 | 14.5%), American (2,153 | 13.1%), German (1,846 | 11.3%), Irish (1,207 | 7.4%), and Scotch-Irish (511 | 3.1%), together accounting for 49.4% of all Hollins residents.
| Ancestry | # Population | % Population |
| African | 230 | 1.4% |
| American | 2,153 | 13.1% |
| Apache | 5 | 0.0% |
| Arab | 145 | 0.9% |
| Austrian | 9 | 0.1% |
| Blackfeet | 5 | 0.0% |
| Bolivian | 55 | 0.3% |
| British | 103 | 0.6% |
| Burmese | 44 | 0.3% |
| Central American | 64 | 0.4% |
| Cherokee | 19 | 0.1% |
| Colombian | 45 | 0.3% |
| Cuban | 53 | 0.3% |
| Czech | 30 | 0.2% |
| Danish | 60 | 0.4% |
| Dutch | 70 | 0.4% |
| English | 2,381 | 14.5% |
| European | 167 | 1.0% |
| Filipino | 27 | 0.2% |
| Finnish | 15 | 0.1% |
| French | 213 | 1.3% |
| French Canadian | 30 | 0.2% |
| German | 1,846 | 11.3% |
| Ghanaian | 22 | 0.1% |
| Greek | 217 | 1.3% |
| Guatemalan | 64 | 0.4% |
| Haitian | 38 | 0.2% |
| Hungarian | 5 | 0.0% |
| Indian (Asian) | 7 | 0.0% |
| Irish | 1,207 | 7.4% |
| Israeli | 16 | 0.1% |
| Italian | 481 | 2.9% |
| Japanese | 167 | 1.0% |
| Jordanian | 20 | 0.1% |
| Kenyan | 23 | 0.1% |
| Korean | 5 | 0.0% |
| Lebanese | 112 | 0.7% |
| Mexican | 477 | 2.9% |
| Native Hawaiian | 7 | 0.0% |
| Nigerian | 7 | 0.0% |
| Northern European | 13 | 0.1% |
| Norwegian | 36 | 0.2% |
| Palestinian | 8 | 0.1% |
| Polish | 246 | 1.5% |
| Puerto Rican | 11 | 0.1% |
| Russian | 45 | 0.3% |
| Scandinavian | 11 | 0.1% |
| Scotch-Irish | 511 | 3.1% |
| Scottish | 318 | 1.9% |
| Serbian | 4 | 0.0% |
| Sioux | 2 | 0.0% |
| Slavic | 1 | 0.0% |
| Slovene | 5 | 0.0% |
| South American | 100 | 0.6% |
| Sri Lankan | 222 | 1.3% |
| Subsaharan African | 275 | 1.7% |
| Swedish | 41 | 0.3% |
| Swiss | 9 | 0.1% |
| Syrian | 5 | 0.0% |
| Thai | 21 | 0.1% |
| Ukrainian | 30 | 0.2% |
| Welsh | 92 | 0.6% | View All 62 Rows |
Immigrants in Hollins
The most numerous immigrant groups reported in Hollins came from Asia (439 | 2.7%), Latin America (420 | 2.6%), Europe (297 | 1.8%), Central America (292 | 1.8%), and South Eastern Asia (254 | 1.5%), together accounting for 10.4% of all Hollins residents.
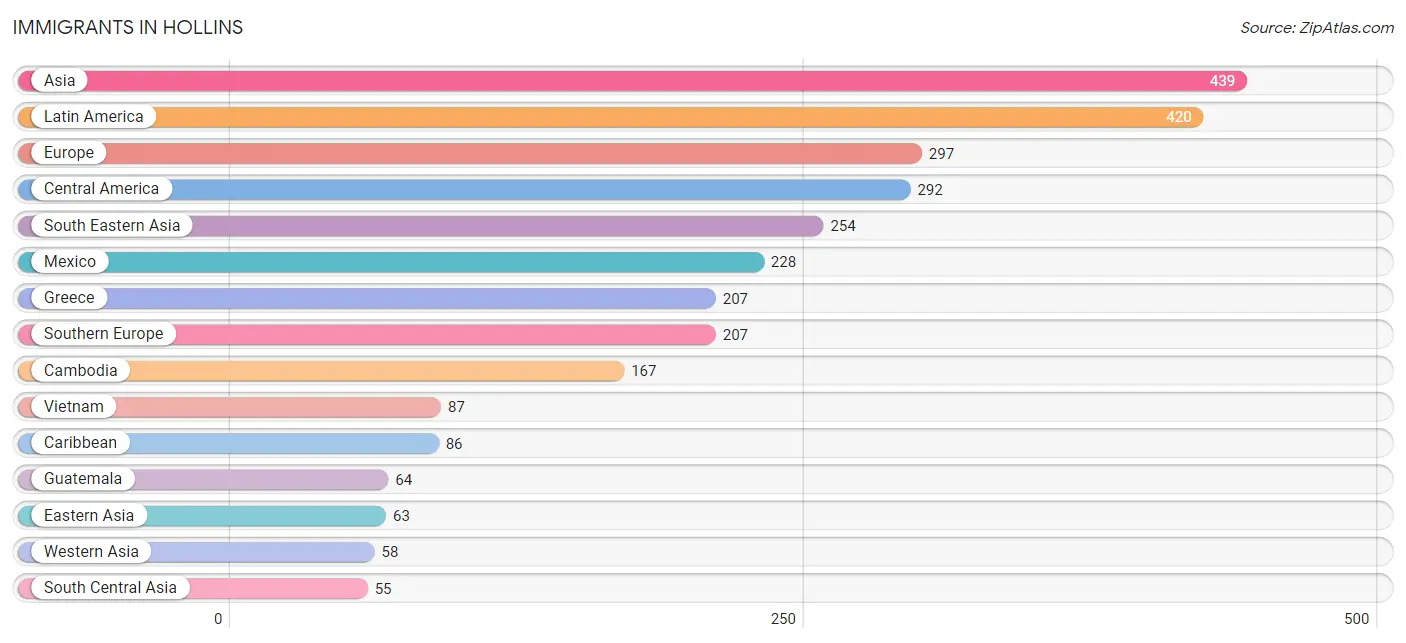
| Immigration Origin | # Population | % Population |
| Africa | 30 | 0.2% |
| Asia | 439 | 2.7% |
| Bolivia | 10 | 0.1% |
| Cambodia | 167 | 1.0% |
| Caribbean | 86 | 0.5% |
| Central America | 292 | 1.8% |
| China | 46 | 0.3% |
| Colombia | 32 | 0.2% |
| Cuba | 53 | 0.3% |
| Eastern Africa | 23 | 0.1% |
| Eastern Asia | 63 | 0.4% |
| Eastern Europe | 54 | 0.3% |
| England | 26 | 0.2% |
| Europe | 297 | 1.8% |
| Germany | 10 | 0.1% |
| Greece | 207 | 1.3% |
| Guatemala | 64 | 0.4% |
| Haiti | 33 | 0.2% |
| Hong Kong | 3 | 0.0% |
| India | 1 | 0.0% |
| Kenya | 23 | 0.1% |
| Korea | 17 | 0.1% |
| Latin America | 420 | 2.6% |
| Lebanon | 49 | 0.3% |
| Mexico | 228 | 1.4% |
| Nepal | 12 | 0.1% |
| Nigeria | 7 | 0.0% |
| Northern Europe | 26 | 0.2% |
| Pakistan | 42 | 0.3% |
| Russia | 22 | 0.1% |
| South America | 42 | 0.3% |
| South Central Asia | 55 | 0.3% |
| South Eastern Asia | 254 | 1.5% |
| Southern Europe | 207 | 1.3% |
| Taiwan | 36 | 0.2% |
| Ukraine | 32 | 0.2% |
| Vietnam | 87 | 0.5% |
| Western Africa | 7 | 0.0% |
| Western Asia | 58 | 0.4% |
| Western Europe | 10 | 0.1% | View All 40 Rows |
Sex and Age in Hollins
Sex and Age in Hollins
The most populous age groups in Hollins are 50 to 54 Years (703 | 9.3%) for men and 70 to 74 Years (882 | 10.0%) for women.
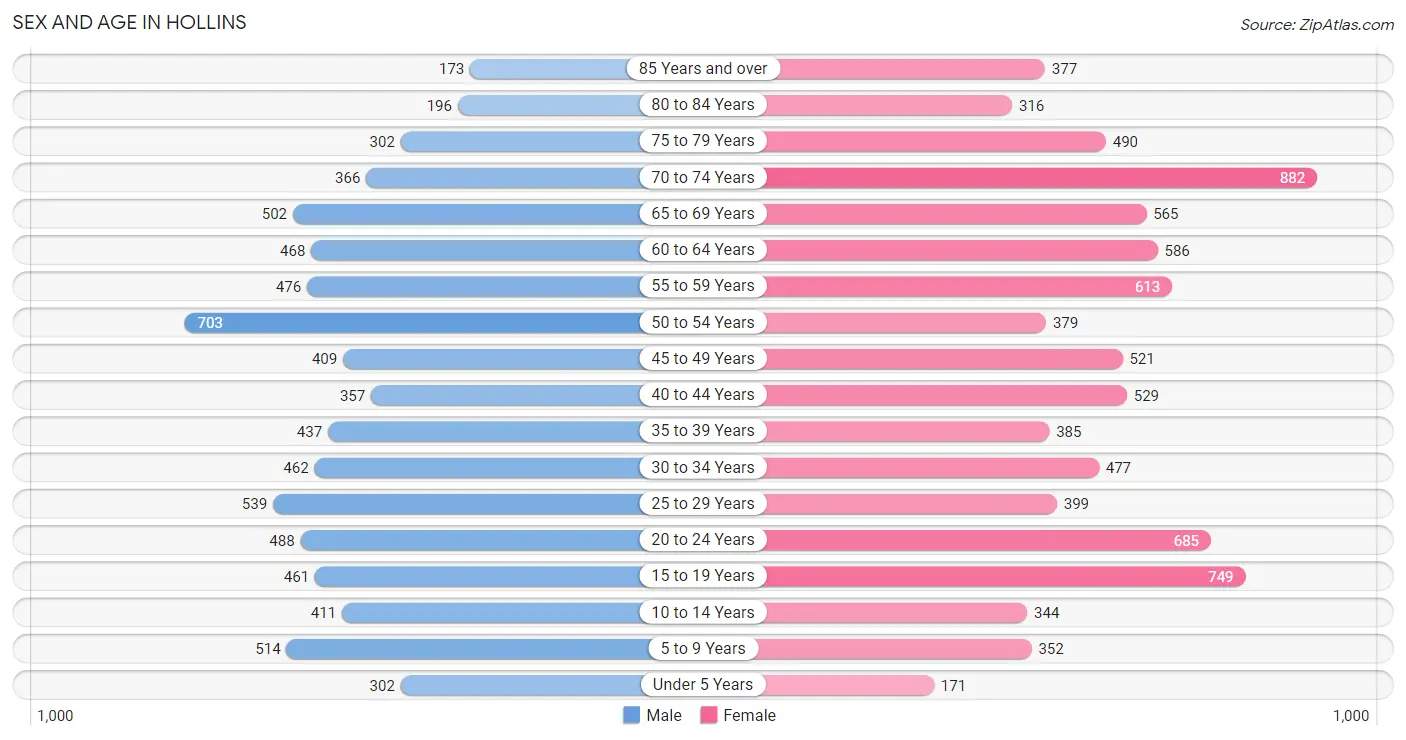
| Age Bracket | Male | Female |
| Under 5 Years | 302 (4.0%) | 171 (1.9%) |
| 5 to 9 Years | 514 (6.8%) | 352 (4.0%) |
| 10 to 14 Years | 411 (5.4%) | 344 (3.9%) |
| 15 to 19 Years | 461 (6.1%) | 749 (8.5%) |
| 20 to 24 Years | 488 (6.5%) | 685 (7.8%) |
| 25 to 29 Years | 539 (7.1%) | 399 (4.5%) |
| 30 to 34 Years | 462 (6.1%) | 477 (5.4%) |
| 35 to 39 Years | 437 (5.8%) | 385 (4.4%) |
| 40 to 44 Years | 357 (4.7%) | 529 (6.0%) |
| 45 to 49 Years | 409 (5.4%) | 521 (5.9%) |
| 50 to 54 Years | 703 (9.3%) | 379 (4.3%) |
| 55 to 59 Years | 476 (6.3%) | 613 (7.0%) |
| 60 to 64 Years | 468 (6.2%) | 586 (6.6%) |
| 65 to 69 Years | 502 (6.6%) | 565 (6.4%) |
| 70 to 74 Years | 366 (4.8%) | 882 (10.0%) |
| 75 to 79 Years | 302 (4.0%) | 490 (5.6%) |
| 80 to 84 Years | 196 (2.6%) | 316 (3.6%) |
| 85 Years and over | 173 (2.3%) | 377 (4.3%) |
| Total | 7,566 (100.0%) | 8,820 (100.0%) |
Families and Households in Hollins
Median Family Size in Hollins
The median family size in Hollins is 2.99 persons per family, with single male/father families (274 | 7.0%) accounting for the largest median family size of 3.58 persons per family. On the other hand, single female/mother families (761 | 19.5%) represent the smallest median family size with 2.74 persons per family.
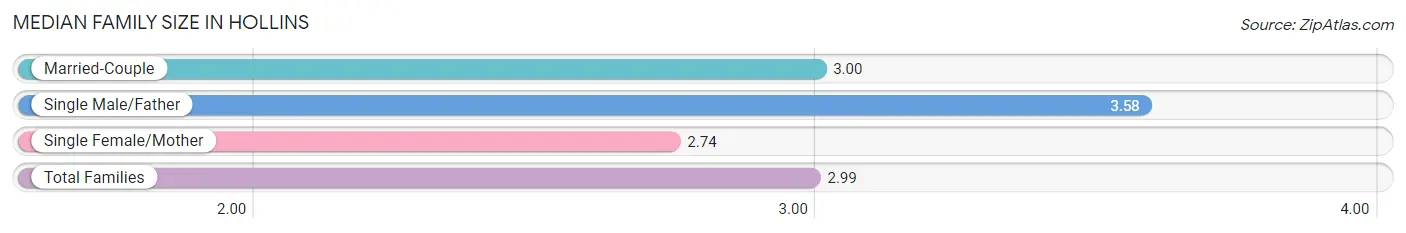
| Family Type | # Families | Family Size |
| Married-Couple | 2,875 (73.5%) | 3.00 |
| Single Male/Father | 274 (7.0%) | 3.58 |
| Single Female/Mother | 761 (19.5%) | 2.74 |
| Total Families | 3,910 (100.0%) | 2.99 |
Median Household Size in Hollins
The median household size in Hollins is 2.33 persons per household, with single male/father households (274 | 4.1%) accounting for the largest median household size of 3.84 persons per household. non-family households (2,712 | 40.9%) represent the smallest median household size with 1.18 persons per household.
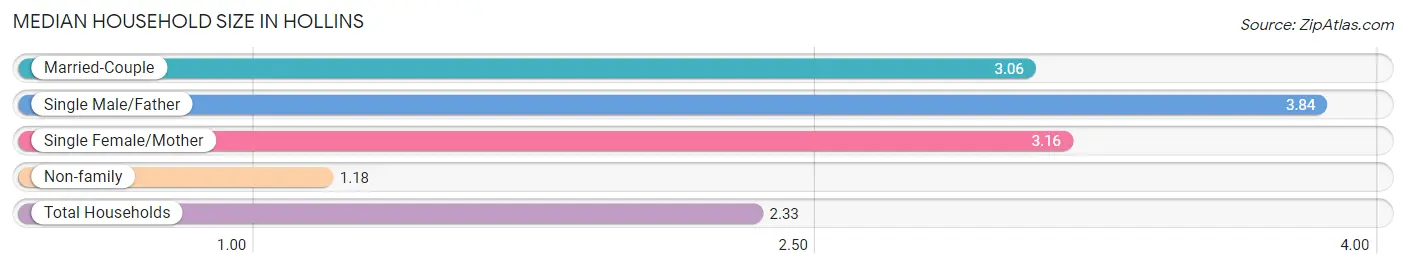
| Household Type | # Households | Household Size |
| Married-Couple | 2,875 (43.4%) | 3.06 |
| Single Male/Father | 274 (4.1%) | 3.84 |
| Single Female/Mother | 761 (11.5%) | 3.16 |
| Non-family | 2,712 (40.9%) | 1.18 |
| Total Households | 6,622 (100.0%) | 2.33 |
Household Size by Marriage Status in Hollins
Out of a total of 6,622 households in Hollins, 3,910 (59.1%) are family households, while 2,712 (40.9%) are nonfamily households. The most numerous type of family households are 2-person households, comprising 1,875, and the most common type of nonfamily households are 1-person households, comprising 2,264.
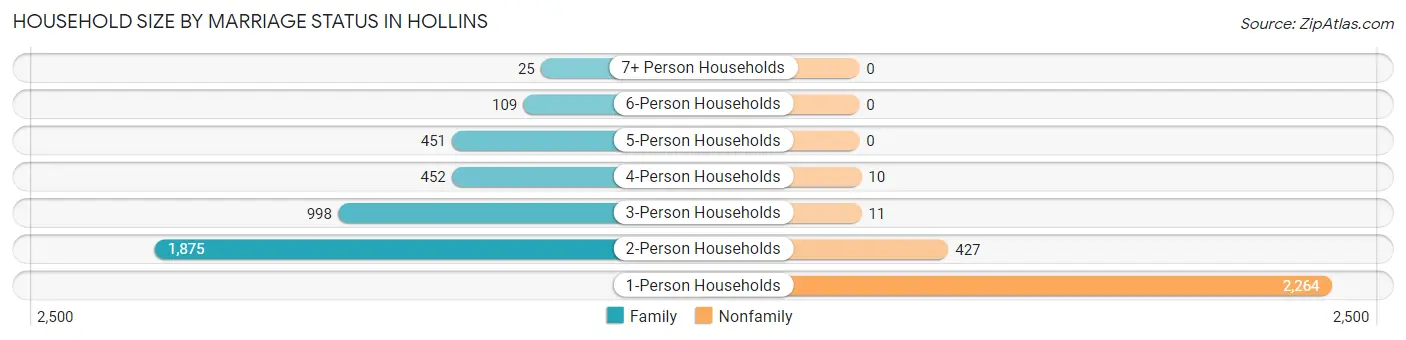
| Household Size | Family Households | Nonfamily Households |
| 1-Person Households | - | 2,264 (34.2%) |
| 2-Person Households | 1,875 (28.3%) | 427 (6.5%) |
| 3-Person Households | 998 (15.1%) | 11 (0.2%) |
| 4-Person Households | 452 (6.8%) | 10 (0.2%) |
| 5-Person Households | 451 (6.8%) | 0 (0.0%) |
| 6-Person Households | 109 (1.7%) | 0 (0.0%) |
| 7+ Person Households | 25 (0.4%) | 0 (0.0%) |
| Total | 3,910 (59.1%) | 2,712 (40.9%) |
Female Fertility in Hollins
Fertility by Age in Hollins
Average fertility rate in Hollins is 22.0 births per 1,000 women. Women in the age bracket of 20 to 34 years have the highest fertility rate with 33.0 births per 1,000 women. Women in the age bracket of 20 to 34 years acount for 62.6% of all women with births.
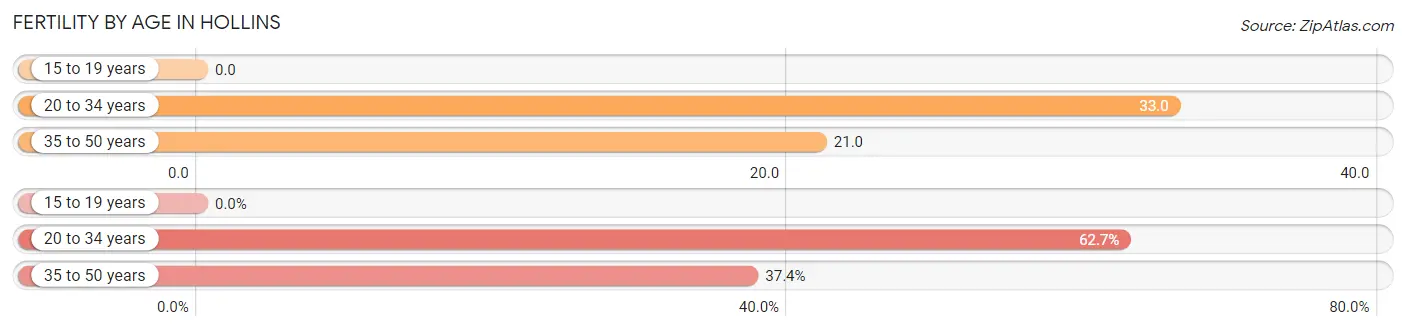
| Age Bracket | Women with Births | Births / 1,000 Women |
| 15 to 19 years | 0 (0.0%) | 0.0 |
| 20 to 34 years | 52 (62.6%) | 33.0 |
| 35 to 50 years | 31 (37.3%) | 21.0 |
| Total | 83 (100.0%) | 22.0 |
Fertility by Age by Marriage Status in Hollins
86.7% of women with births (83) in Hollins are married. The highest percentage of unmarried women with births falls into 20 to 34 years age bracket with 21.1% of them unmarried at the time of birth, while the lowest percentage of unmarried women with births belong to 35 to 50 years age bracket with 0.0% of them unmarried.
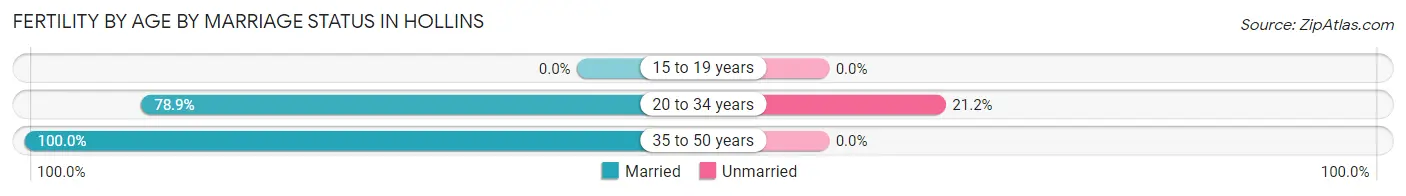
| Age Bracket | Married | Unmarried |
| 15 to 19 years | 0 (0.0%) | 0 (0.0%) |
| 20 to 34 years | 41 (78.8%) | 11 (21.1%) |
| 35 to 50 years | 31 (100.0%) | 0 (0.0%) |
| Total | 72 (86.8%) | 11 (13.3%) |
Fertility by Education in Hollins
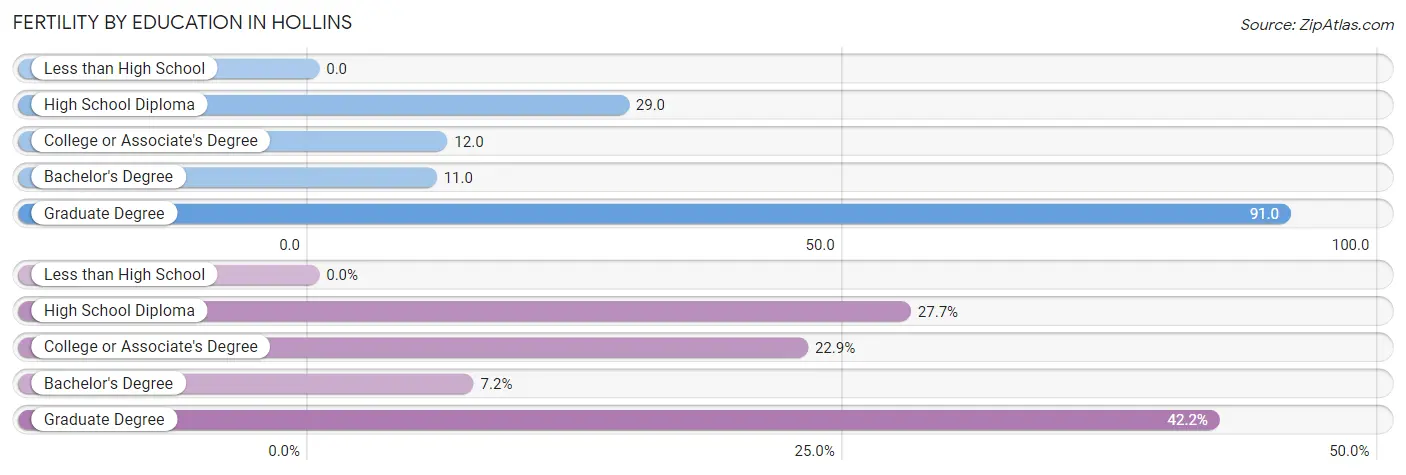
| Educational Attainment | Women with Births | Births / 1,000 Women |
| Less than High School | 0 (0.0%) | 0.0 |
| High School Diploma | 23 (27.7%) | 29.0 |
| College or Associate's Degree | 19 (22.9%) | 12.0 |
| Bachelor's Degree | 6 (7.2%) | 11.0 |
| Graduate Degree | 35 (42.2%) | 91.0 |
| Total | 83 (100.0%) | 22.0 |
Fertility by Education by Marriage Status in Hollins
13.3% of women with births in Hollins are unmarried. Women with the educational attainment of college or associate's degree are most likely to be married with 100.0% of them married at childbirth, while women with the educational attainment of high school diploma are least likely to be married with 47.8% of them unmarried at childbirth.
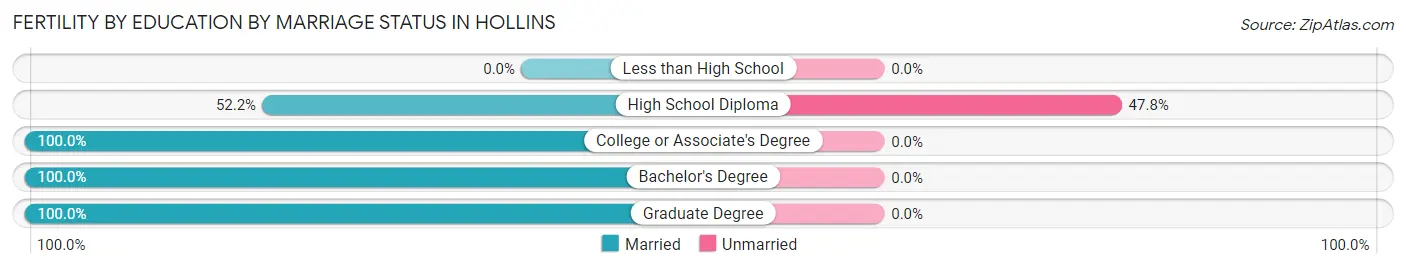
| Educational Attainment | Married | Unmarried |
| Less than High School | 0 (0.0%) | 0 (0.0%) |
| High School Diploma | 12 (52.2%) | 11 (47.8%) |
| College or Associate's Degree | 19 (100.0%) | 0 (0.0%) |
| Bachelor's Degree | 6 (100.0%) | 0 (0.0%) |
| Graduate Degree | 35 (100.0%) | 0 (0.0%) |
| Total | 72 (86.8%) | 11 (13.3%) |
Employment Characteristics in Hollins
Employment by Class of Employer in Hollins
Among the 7,488 employed individuals in Hollins, private company employees (5,188 | 69.3%), not-for-profit organizations (865 | 11.6%), and local government employees (527 | 7.0%) make up the most common classes of employment.
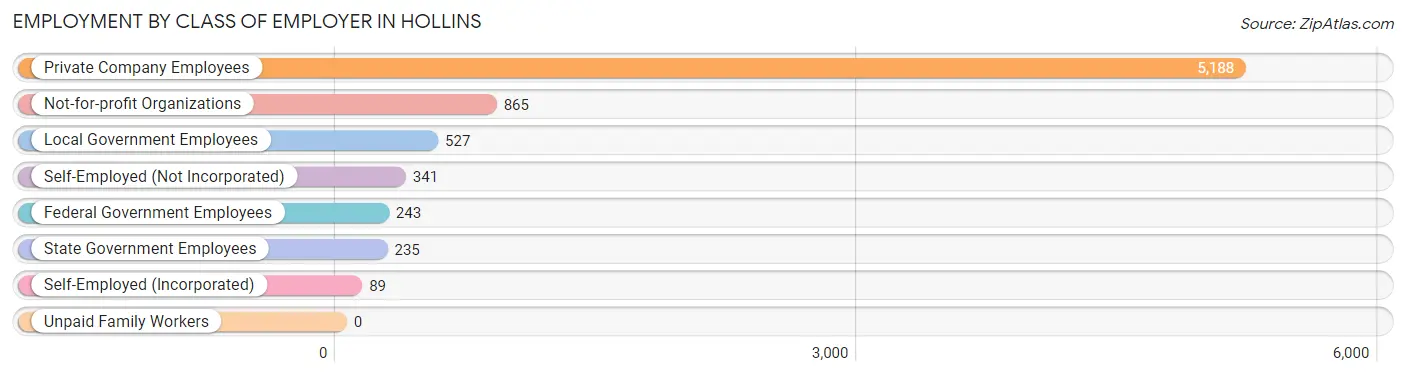
| Employer Class | # Employees | % Employees |
| Private Company Employees | 5,188 | 69.3% |
| Self-Employed (Incorporated) | 89 | 1.2% |
| Self-Employed (Not Incorporated) | 341 | 4.5% |
| Not-for-profit Organizations | 865 | 11.6% |
| Local Government Employees | 527 | 7.0% |
| State Government Employees | 235 | 3.1% |
| Federal Government Employees | 243 | 3.3% |
| Unpaid Family Workers | 0 | 0.0% |
| Total | 7,488 | 100.0% |
Employment Status by Age in Hollins
According to the labor force statistics for Hollins, out of the total population over 16 years of age (14,095), 56.6% or 7,978 individuals are in the labor force, with 3.0% or 239 of them unemployed. The age group with the highest labor force participation rate is 30 to 34 years, with 87.3% or 820 individuals in the labor force. Within the labor force, the 16 to 19 years age range has the highest percentage of unemployed individuals, with 15.9% or 70 of them being unemployed.
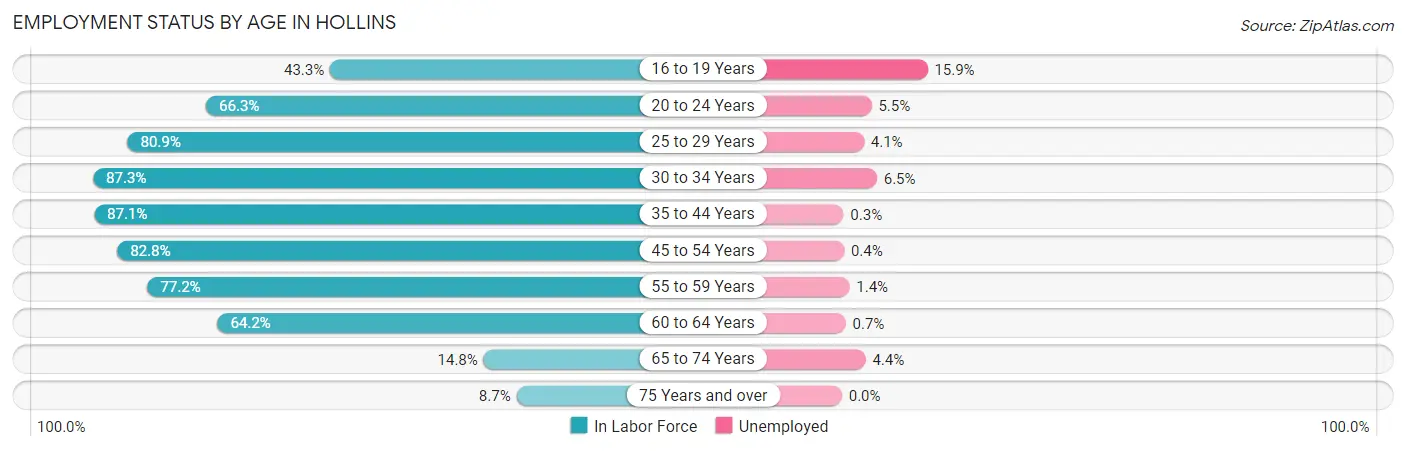
| Age Bracket | In Labor Force | Unemployed |
| 16 to 19 Years | 439 (43.3%) | 70 (15.9%) |
| 20 to 24 Years | 778 (66.3%) | 43 (5.5%) |
| 25 to 29 Years | 759 (80.9%) | 31 (4.1%) |
| 30 to 34 Years | 820 (87.3%) | 53 (6.5%) |
| 35 to 44 Years | 1,488 (87.1%) | 4 (0.3%) |
| 45 to 54 Years | 1,666 (82.8%) | 7 (0.4%) |
| 55 to 59 Years | 841 (77.2%) | 12 (1.4%) |
| 60 to 64 Years | 677 (64.2%) | 5 (0.7%) |
| 65 to 74 Years | 343 (14.8%) | 15 (4.4%) |
| 75 Years and over | 161 (8.7%) | 0 (0.0%) |
| Total | 7,978 (56.6%) | 239 (3.0%) |
Employment Status by Educational Attainment in Hollins
According to labor force statistics for Hollins, 80.7% of individuals (6,246) out of the total population between 25 and 64 years of age (7,740) are in the labor force, with 1.8% or 112 of them being unemployed. The group with the highest labor force participation rate are those with the educational attainment of bachelor's degree or higher, with 83.8% or 1,937 individuals in the labor force. Within the labor force, individuals with college / associate degree education have the highest percentage of unemployment, with 4.1% or 85 of them being unemployed.
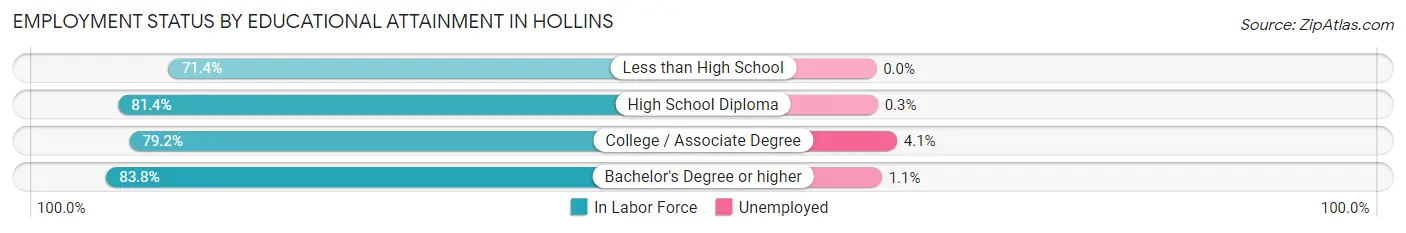
| Educational Attainment | In Labor Force | Unemployed |
| Less than High School | 342 (71.4%) | 0 (0.0%) |
| High School Diploma | 1,893 (81.4%) | 7 (0.3%) |
| College / Associate Degree | 2,078 (79.2%) | 108 (4.1%) |
| Bachelor's Degree or higher | 1,937 (83.8%) | 25 (1.1%) |
| Total | 6,246 (80.7%) | 139 (1.8%) |
Employment Occupations by Sex in Hollins
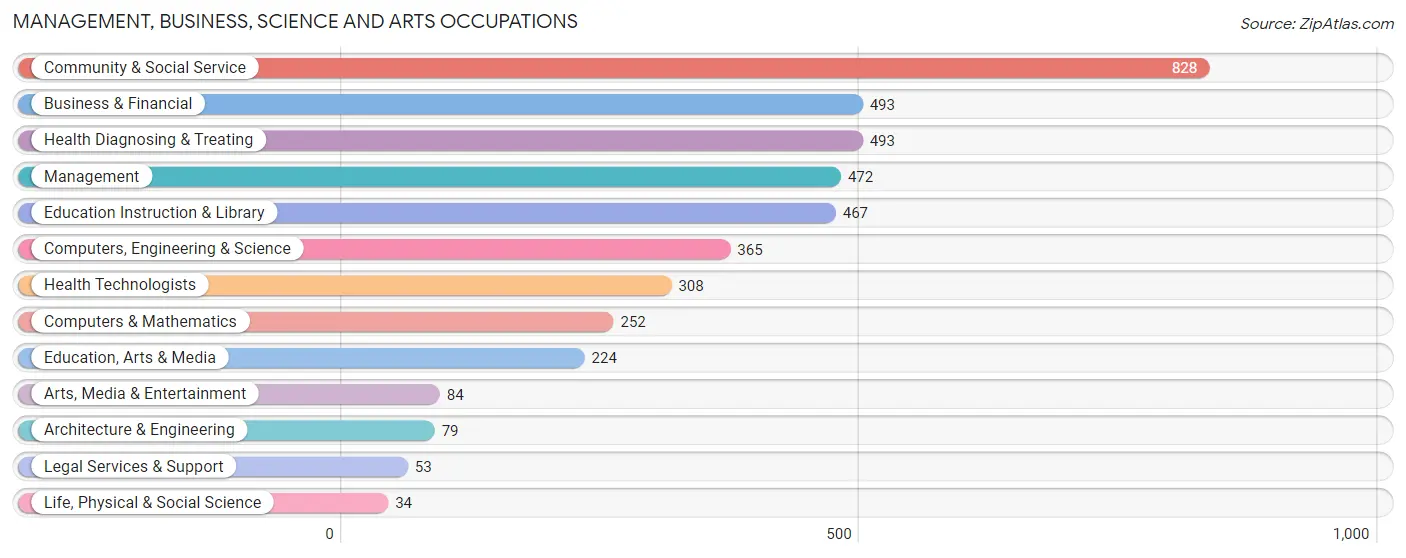
Management, Business, Science and Arts Occupations
The most common Management, Business, Science and Arts occupations in Hollins are Community & Social Service (828 | 10.7%), Business & Financial (493 | 6.4%), Health Diagnosing & Treating (493 | 6.4%), Management (472 | 6.1%), and Education Instruction & Library (467 | 6.0%).
Management, Business, Science and Arts Occupations by Sex
Within the Management, Business, Science and Arts occupations in Hollins, the most male-oriented occupations are Legal Services & Support (81.1%), Arts, Media & Entertainment (80.9%), and Computers & Mathematics (80.6%), while the most female-oriented occupations are Life, Physical & Social Science (100.0%), Health Technologists (89.3%), and Health Diagnosing & Treating (88.8%).
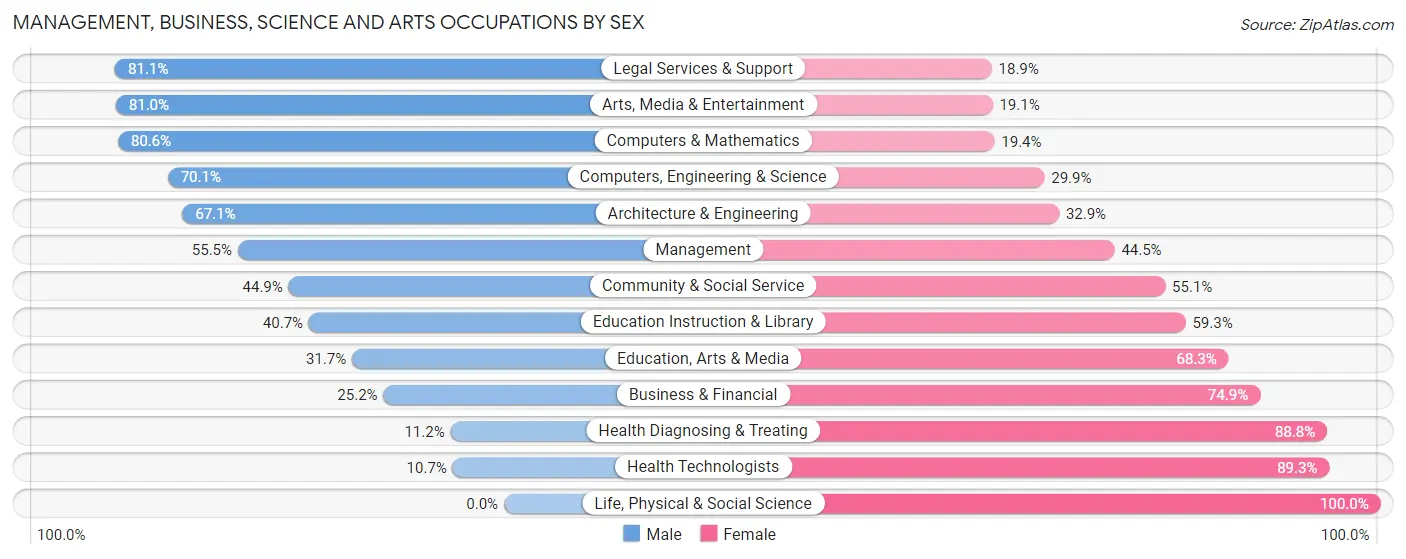
| Occupation | Male | Female |
| Management | 262 (55.5%) | 210 (44.5%) |
| Business & Financial | 124 (25.2%) | 369 (74.9%) |
| Computers, Engineering & Science | 256 (70.1%) | 109 (29.9%) |
| Computers & Mathematics | 203 (80.6%) | 49 (19.4%) |
| Architecture & Engineering | 53 (67.1%) | 26 (32.9%) |
| Life, Physical & Social Science | 0 (0.0%) | 34 (100.0%) |
| Community & Social Service | 372 (44.9%) | 456 (55.1%) |
| Education, Arts & Media | 71 (31.7%) | 153 (68.3%) |
| Legal Services & Support | 43 (81.1%) | 10 (18.9%) |
| Education Instruction & Library | 190 (40.7%) | 277 (59.3%) |
| Arts, Media & Entertainment | 68 (80.9%) | 16 (19.1%) |
| Health Diagnosing & Treating | 55 (11.2%) | 438 (88.8%) |
| Health Technologists | 33 (10.7%) | 275 (89.3%) |
| Total (Category) | 1,069 (40.3%) | 1,582 (59.7%) |
| Total (Overall) | 4,043 (52.3%) | 3,689 (47.7%) |
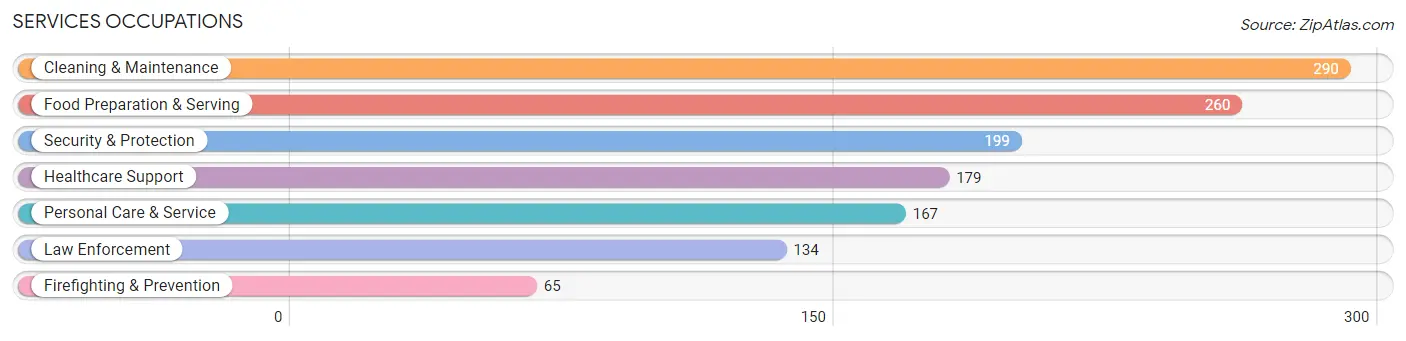
Services Occupations
The most common Services occupations in Hollins are Cleaning & Maintenance (290 | 3.7%), Food Preparation & Serving (260 | 3.4%), Security & Protection (199 | 2.6%), Healthcare Support (179 | 2.3%), and Personal Care & Service (167 | 2.2%).
Services Occupations by Sex
Within the Services occupations in Hollins, the most male-oriented occupations are Cleaning & Maintenance (67.6%), Firefighting & Prevention (55.4%), and Security & Protection (47.7%), while the most female-oriented occupations are Personal Care & Service (85.0%), Healthcare Support (72.6%), and Food Preparation & Serving (59.6%).
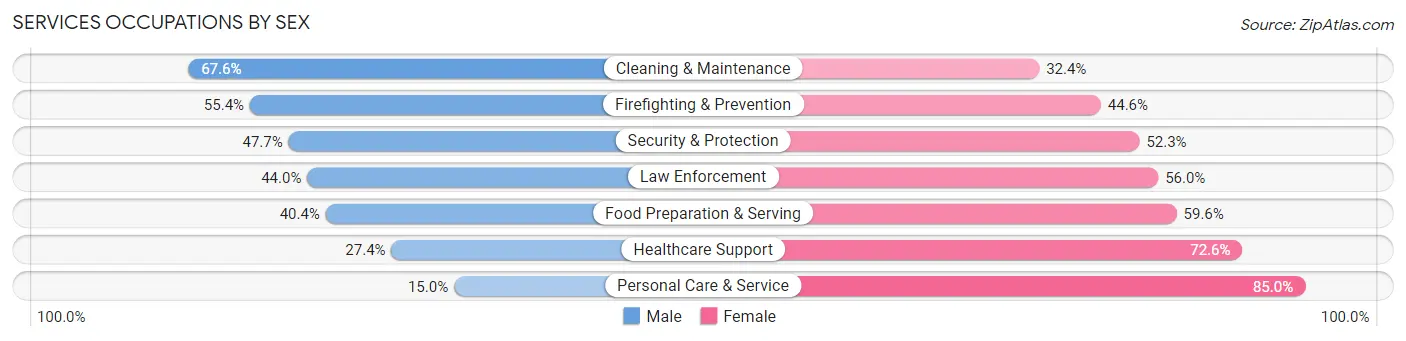
| Occupation | Male | Female |
| Healthcare Support | 49 (27.4%) | 130 (72.6%) |
| Security & Protection | 95 (47.7%) | 104 (52.3%) |
| Firefighting & Prevention | 36 (55.4%) | 29 (44.6%) |
| Law Enforcement | 59 (44.0%) | 75 (56.0%) |
| Food Preparation & Serving | 105 (40.4%) | 155 (59.6%) |
| Cleaning & Maintenance | 196 (67.6%) | 94 (32.4%) |
| Personal Care & Service | 25 (15.0%) | 142 (85.0%) |
| Total (Category) | 470 (42.9%) | 625 (57.1%) |
| Total (Overall) | 4,043 (52.3%) | 3,689 (47.7%) |
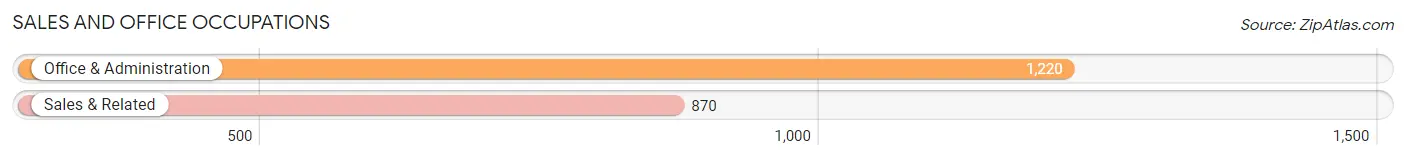
Sales and Office Occupations
The most common Sales and Office occupations in Hollins are Office & Administration (1,220 | 15.8%), and Sales & Related (870 | 11.3%).
Sales and Office Occupations by Sex
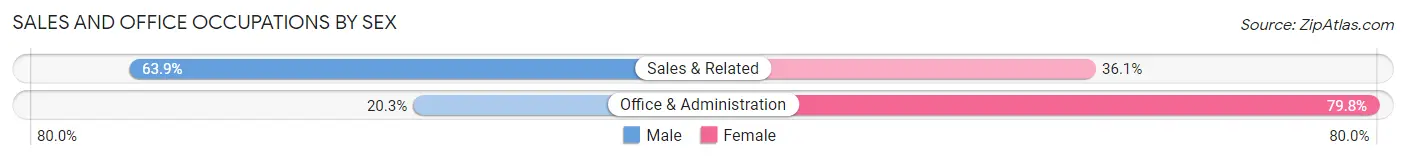
| Occupation | Male | Female |
| Sales & Related | 556 (63.9%) | 314 (36.1%) |
| Office & Administration | 247 (20.3%) | 973 (79.7%) |
| Total (Category) | 803 (38.4%) | 1,287 (61.6%) |
| Total (Overall) | 4,043 (52.3%) | 3,689 (47.7%) |
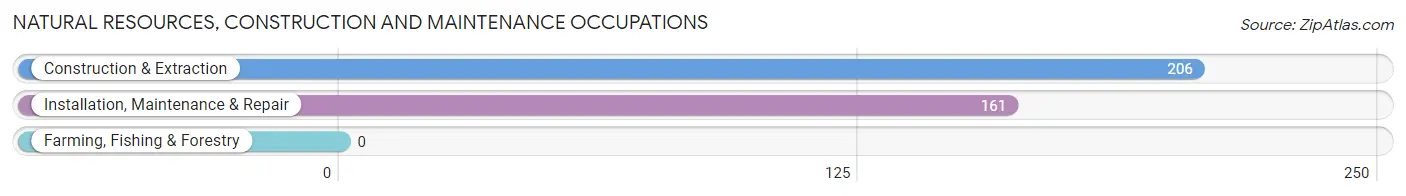
Natural Resources, Construction and Maintenance Occupations
The most common Natural Resources, Construction and Maintenance occupations in Hollins are Construction & Extraction (206 | 2.7%), and Installation, Maintenance & Repair (161 | 2.1%).
Natural Resources, Construction and Maintenance Occupations by Sex
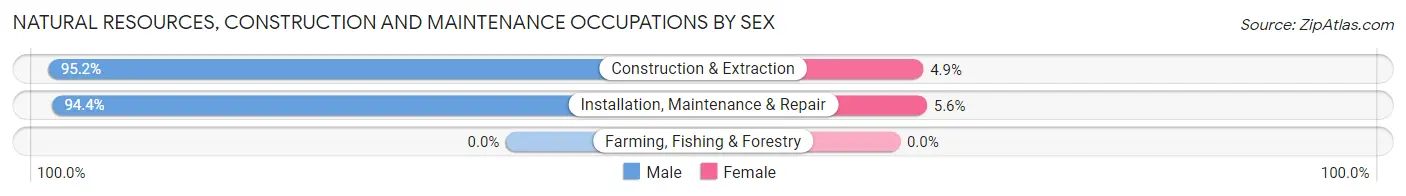
| Occupation | Male | Female |
| Farming, Fishing & Forestry | 0 (0.0%) | 0 (0.0%) |
| Construction & Extraction | 196 (95.2%) | 10 (4.9%) |
| Installation, Maintenance & Repair | 152 (94.4%) | 9 (5.6%) |
| Total (Category) | 348 (94.8%) | 19 (5.2%) |
| Total (Overall) | 4,043 (52.3%) | 3,689 (47.7%) |
Production, Transportation and Moving Occupations
The most common Production, Transportation and Moving occupations in Hollins are Material Moving (541 | 7.0%), Transportation (531 | 6.9%), and Production (457 | 5.9%).
Production, Transportation and Moving Occupations by Sex
| Occupation | Male | Female |
| Production | 377 (82.5%) | 80 (17.5%) |
| Transportation | 497 (93.6%) | 34 (6.4%) |
| Material Moving | 479 (88.5%) | 62 (11.5%) |
| Total (Category) | 1,353 (88.5%) | 176 (11.5%) |
| Total (Overall) | 4,043 (52.3%) | 3,689 (47.7%) |
Employment Industries by Sex in Hollins
Employment Industries in Hollins
The major employment industries in Hollins include Health Care & Social Assistance (1,215 | 15.7%), Retail Trade (964 | 12.5%), Manufacturing (855 | 11.1%), Educational Services (654 | 8.5%), and Transportation & Warehousing (509 | 6.6%).
Employment Industries by Sex in Hollins
The Hollins industries that see more men than women are Construction (95.3%), Wholesale Trade (83.4%), and Transportation & Warehousing (83.3%), whereas the industries that tend to have a higher number of women are Health Care & Social Assistance (84.0%), Arts, Entertainment & Recreation (81.2%), and Real Estate, Rental & Leasing (74.4%).
| Industry | Male | Female |
| Agriculture, Fishing & Hunting | 0 (0.0%) | 0 (0.0%) |
| Mining, Quarrying, & Extraction | 0 (0.0%) | 0 (0.0%) |
| Construction | 202 (95.3%) | 10 (4.7%) |
| Manufacturing | 684 (80.0%) | 171 (20.0%) |
| Wholesale Trade | 301 (83.4%) | 60 (16.6%) |
| Retail Trade | 661 (68.6%) | 303 (31.4%) |
| Transportation & Warehousing | 424 (83.3%) | 85 (16.7%) |
| Utilities | 94 (37.8%) | 155 (62.3%) |
| Information | 73 (57.9%) | 53 (42.1%) |
| Finance & Insurance | 243 (50.1%) | 242 (49.9%) |
| Real Estate, Rental & Leasing | 20 (25.6%) | 58 (74.4%) |
| Professional & Scientific | 195 (41.0%) | 280 (59.0%) |
| Enterprise Management | 0 (0.0%) | 0 (0.0%) |
| Administrative & Support | 216 (56.0%) | 170 (44.0%) |
| Educational Services | 271 (41.4%) | 383 (58.6%) |
| Health Care & Social Assistance | 194 (16.0%) | 1,021 (84.0%) |
| Arts, Entertainment & Recreation | 9 (18.8%) | 39 (81.2%) |
| Accommodation & Food Services | 152 (38.1%) | 247 (61.9%) |
| Public Administration | 181 (40.2%) | 269 (59.8%) |
| Total | 4,043 (52.3%) | 3,689 (47.7%) |
Education in Hollins
School Enrollment in Hollins
The most common levels of schooling among the 3,509 students in Hollins are college / undergraduate (1,234 | 35.2%), high school (743 | 21.2%), and middle school (651 | 18.5%).
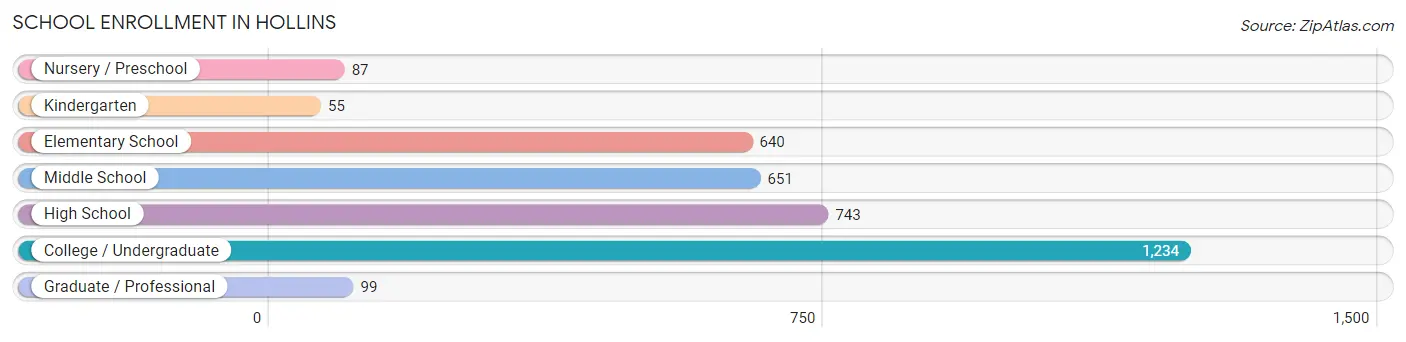
| School Level | # Students | % Students |
| Nursery / Preschool | 87 | 2.5% |
| Kindergarten | 55 | 1.6% |
| Elementary School | 640 | 18.2% |
| Middle School | 651 | 18.5% |
| High School | 743 | 21.2% |
| College / Undergraduate | 1,234 | 35.2% |
| Graduate / Professional | 99 | 2.8% |
| Total | 3,509 | 100.0% |
School Enrollment by Age by Funding Source in Hollins
Out of a total of 3,509 students who are enrolled in schools in Hollins, 1,190 (33.9%) attend a private institution, while the remaining 2,319 (66.1%) are enrolled in public schools. The age group of 20 to 24 year olds has the highest likelihood of being enrolled in private schools, with 463 (72.2% in the age bracket) enrolled. Conversely, the age group of 10 to 14 year olds has the lowest likelihood of being enrolled in a private school, with 644 (87.6% in the age bracket) attending a public institution.
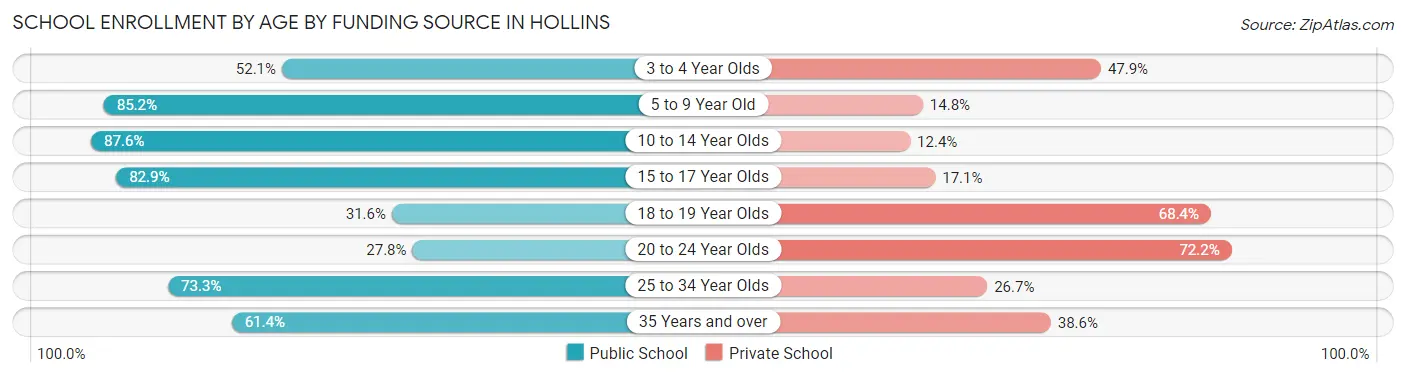
| Age Bracket | Public School | Private School |
| 3 to 4 Year Olds | 25 (52.1%) | 23 (47.9%) |
| 5 to 9 Year Old | 618 (85.2%) | 107 (14.8%) |
| 10 to 14 Year Olds | 644 (87.6%) | 91 (12.4%) |
| 15 to 17 Year Olds | 510 (82.9%) | 105 (17.1%) |
| 18 to 19 Year Olds | 141 (31.6%) | 305 (68.4%) |
| 20 to 24 Year Olds | 178 (27.8%) | 463 (72.2%) |
| 25 to 34 Year Olds | 126 (73.3%) | 46 (26.7%) |
| 35 Years and over | 78 (61.4%) | 49 (38.6%) |
| Total | 2,319 (66.1%) | 1,190 (33.9%) |
Educational Attainment by Field of Study in Hollins
Business (573 | 18.4%), science & technology (384 | 12.4%), education (378 | 12.2%), arts & humanities (365 | 11.7%), and liberal arts & history (259 | 8.3%) are the most common fields of study among 3,108 individuals in Hollins who have obtained a bachelor's degree or higher.
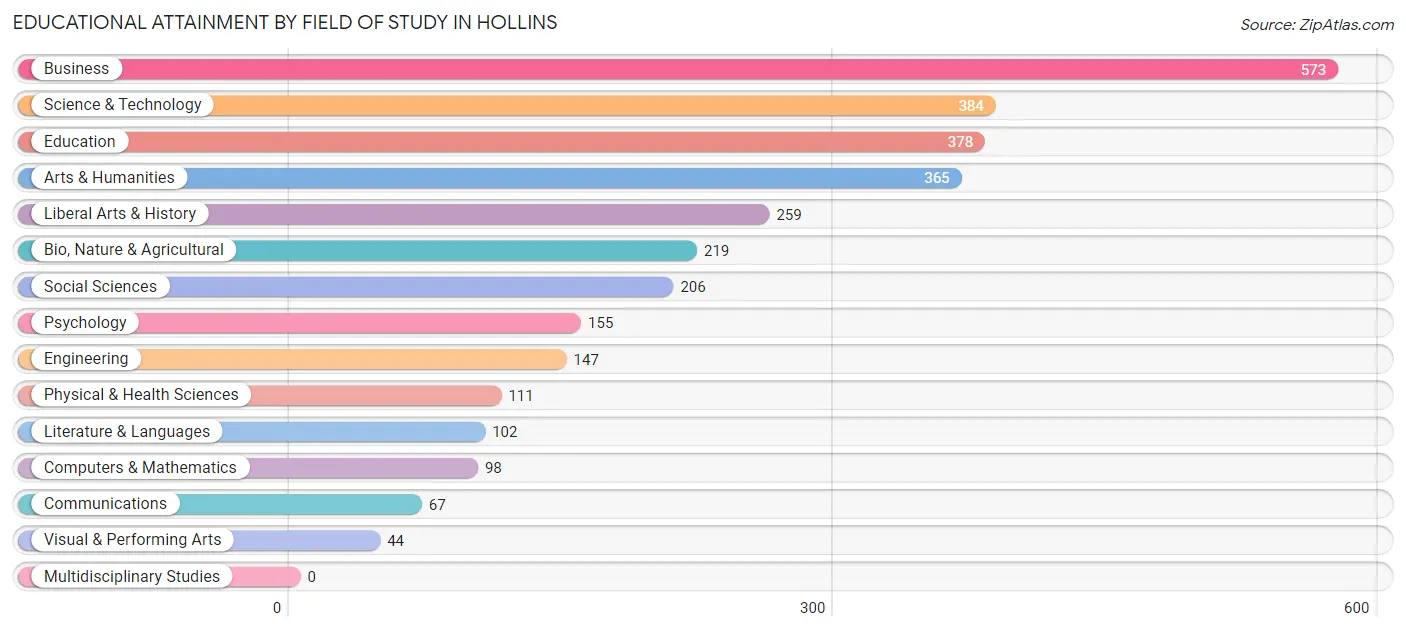
| Field of Study | # Graduates | % Graduates |
| Computers & Mathematics | 98 | 3.2% |
| Bio, Nature & Agricultural | 219 | 7.0% |
| Physical & Health Sciences | 111 | 3.6% |
| Psychology | 155 | 5.0% |
| Social Sciences | 206 | 6.6% |
| Engineering | 147 | 4.7% |
| Multidisciplinary Studies | 0 | 0.0% |
| Science & Technology | 384 | 12.4% |
| Business | 573 | 18.4% |
| Education | 378 | 12.2% |
| Literature & Languages | 102 | 3.3% |
| Liberal Arts & History | 259 | 8.3% |
| Visual & Performing Arts | 44 | 1.4% |
| Communications | 67 | 2.2% |
| Arts & Humanities | 365 | 11.7% |
| Total | 3,108 | 100.0% |
Transportation & Commute in Hollins
Vehicle Availability by Sex in Hollins
The most prevalent vehicle ownership categories in Hollins are males with 2 vehicles (1,525, accounting for 38.6%) and females with 2 vehicles (1,208, making up 43.9%).
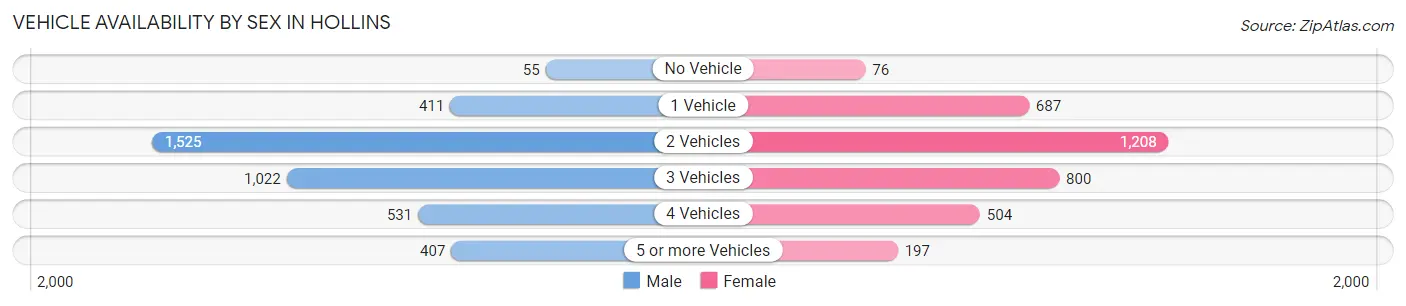
| Vehicles Available | Male | Female |
| No Vehicle | 55 (1.4%) | 76 (2.2%) |
| 1 Vehicle | 411 (10.4%) | 687 (19.8%) |
| 2 Vehicles | 1,525 (38.6%) | 1,208 (34.8%) |
| 3 Vehicles | 1,022 (25.9%) | 800 (23.0%) |
| 4 Vehicles | 531 (13.4%) | 504 (14.5%) |
| 5 or more Vehicles | 407 (10.3%) | 197 (5.7%) |
| Total | 3,951 (100.0%) | 3,472 (100.0%) |
Commute Time in Hollins
The most frequently occuring commute durations in Hollins are 20 to 24 minutes (1,461 commuters, 23.1%), 15 to 19 minutes (1,079 commuters, 17.0%), and 10 to 14 minutes (1,021 commuters, 16.1%).
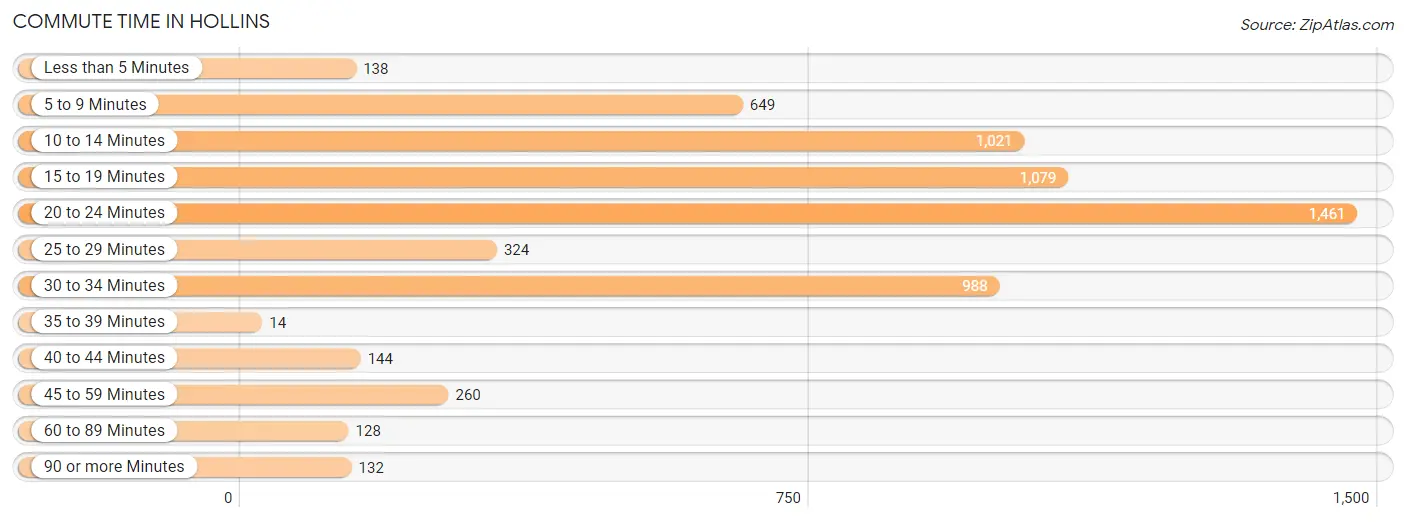
| Commute Time | # Commuters | % Commuters |
| Less than 5 Minutes | 138 | 2.2% |
| 5 to 9 Minutes | 649 | 10.2% |
| 10 to 14 Minutes | 1,021 | 16.1% |
| 15 to 19 Minutes | 1,079 | 17.0% |
| 20 to 24 Minutes | 1,461 | 23.1% |
| 25 to 29 Minutes | 324 | 5.1% |
| 30 to 34 Minutes | 988 | 15.6% |
| 35 to 39 Minutes | 14 | 0.2% |
| 40 to 44 Minutes | 144 | 2.3% |
| 45 to 59 Minutes | 260 | 4.1% |
| 60 to 89 Minutes | 128 | 2.0% |
| 90 or more Minutes | 132 | 2.1% |
Commute Time by Sex in Hollins
The most common commute times in Hollins are 20 to 24 minutes (690 commuters, 19.7%) for males and 20 to 24 minutes (771 commuters, 27.3%) for females.
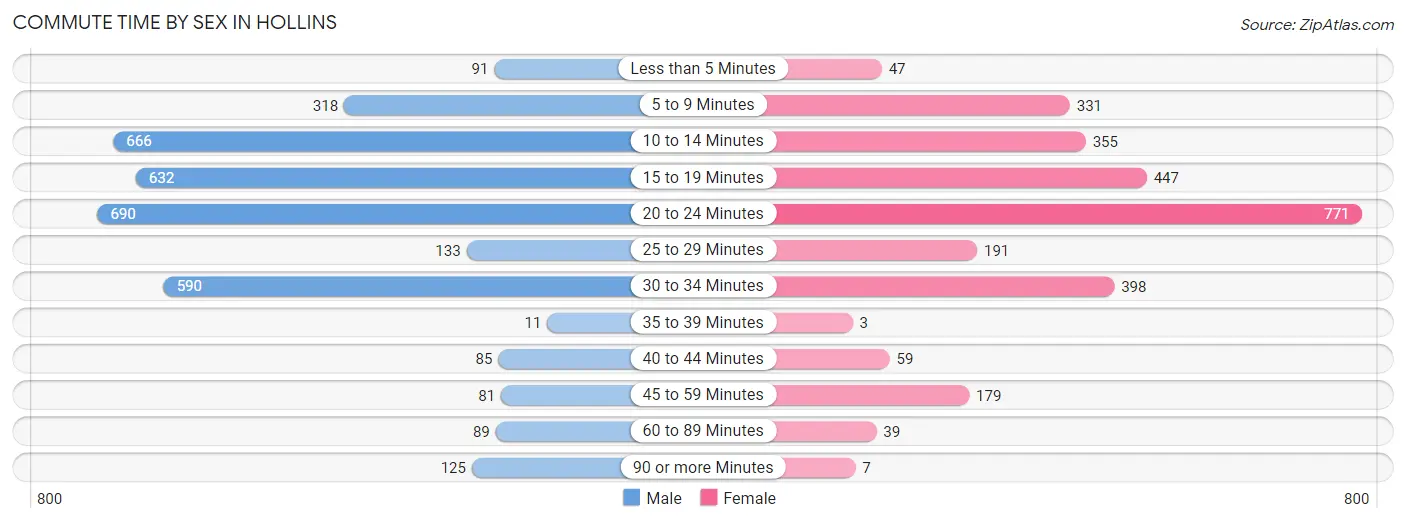
| Commute Time | Male | Female |
| Less than 5 Minutes | 91 (2.6%) | 47 (1.7%) |
| 5 to 9 Minutes | 318 (9.1%) | 331 (11.7%) |
| 10 to 14 Minutes | 666 (19.0%) | 355 (12.6%) |
| 15 to 19 Minutes | 632 (18.0%) | 447 (15.8%) |
| 20 to 24 Minutes | 690 (19.7%) | 771 (27.3%) |
| 25 to 29 Minutes | 133 (3.8%) | 191 (6.8%) |
| 30 to 34 Minutes | 590 (16.8%) | 398 (14.1%) |
| 35 to 39 Minutes | 11 (0.3%) | 3 (0.1%) |
| 40 to 44 Minutes | 85 (2.4%) | 59 (2.1%) |
| 45 to 59 Minutes | 81 (2.3%) | 179 (6.3%) |
| 60 to 89 Minutes | 89 (2.5%) | 39 (1.4%) |
| 90 or more Minutes | 125 (3.6%) | 7 (0.3%) |
Time of Departure to Work by Sex in Hollins
The most frequent times of departure to work in Hollins are 8:00 AM to 8:29 AM (458, 13.0%) for males and 7:30 AM to 7:59 AM (634, 22.4%) for females.
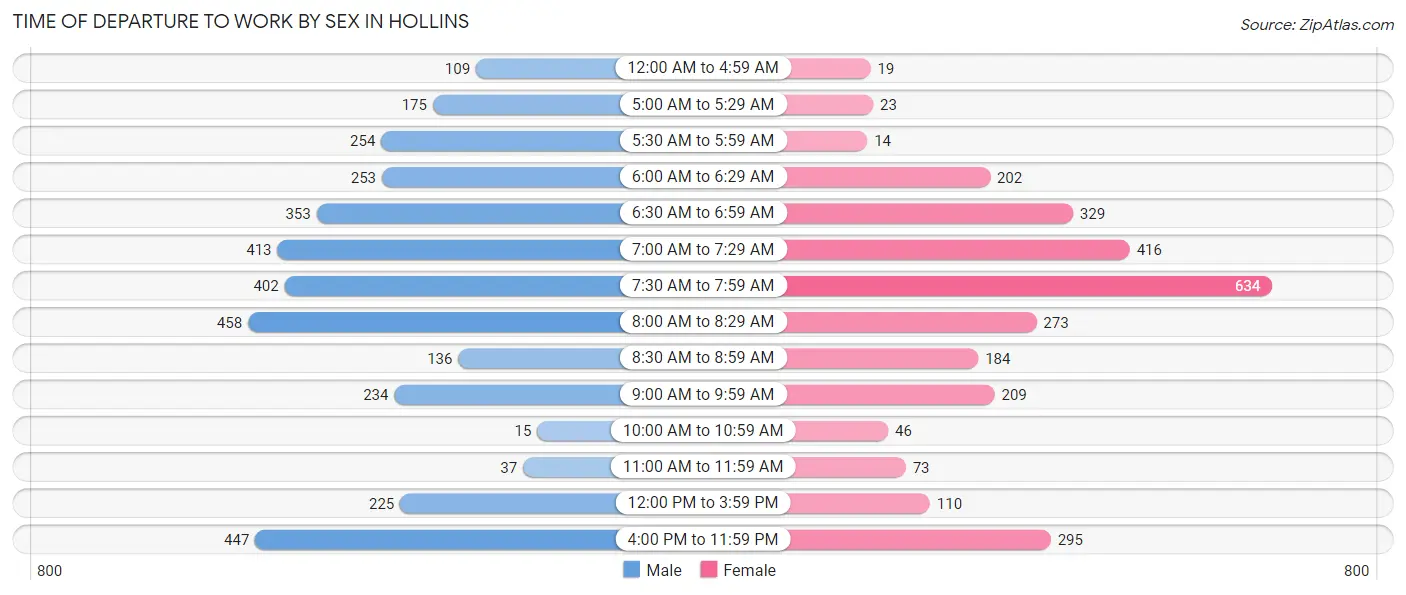
| Time of Departure | Male | Female |
| 12:00 AM to 4:59 AM | 109 (3.1%) | 19 (0.7%) |
| 5:00 AM to 5:29 AM | 175 (5.0%) | 23 (0.8%) |
| 5:30 AM to 5:59 AM | 254 (7.2%) | 14 (0.5%) |
| 6:00 AM to 6:29 AM | 253 (7.2%) | 202 (7.1%) |
| 6:30 AM to 6:59 AM | 353 (10.1%) | 329 (11.6%) |
| 7:00 AM to 7:29 AM | 413 (11.8%) | 416 (14.7%) |
| 7:30 AM to 7:59 AM | 402 (11.5%) | 634 (22.4%) |
| 8:00 AM to 8:29 AM | 458 (13.0%) | 273 (9.7%) |
| 8:30 AM to 8:59 AM | 136 (3.9%) | 184 (6.5%) |
| 9:00 AM to 9:59 AM | 234 (6.7%) | 209 (7.4%) |
| 10:00 AM to 10:59 AM | 15 (0.4%) | 46 (1.6%) |
| 11:00 AM to 11:59 AM | 37 (1.1%) | 73 (2.6%) |
| 12:00 PM to 3:59 PM | 225 (6.4%) | 110 (3.9%) |
| 4:00 PM to 11:59 PM | 447 (12.7%) | 295 (10.4%) |
| Total | 3,511 (100.0%) | 2,827 (100.0%) |
Housing Occupancy in Hollins
Occupancy by Ownership in Hollins
Of the total 6,622 dwellings in Hollins, owner-occupied units account for 4,688 (70.8%), while renter-occupied units make up 1,934 (29.2%).
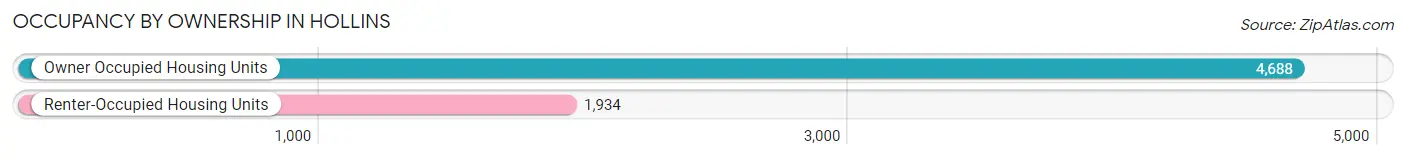
| Occupancy | # Housing Units | % Housing Units |
| Owner Occupied Housing Units | 4,688 | 70.8% |
| Renter-Occupied Housing Units | 1,934 | 29.2% |
| Total Occupied Housing Units | 6,622 | 100.0% |
Occupancy by Household Size in Hollins
| Household Size | # Housing Units | % Housing Units |
| 1-Person Household | 2,264 | 34.2% |
| 2-Person Household | 2,302 | 34.8% |
| 3-Person Household | 1,009 | 15.2% |
| 4+ Person Household | 1,047 | 15.8% |
| Total Housing Units | 6,622 | 100.0% |
Occupancy by Ownership by Household Size in Hollins
| Household Size | Owner-occupied | Renter-occupied |
| 1-Person Household | 1,375 (60.7%) | 889 (39.3%) |
| 2-Person Household | 1,847 (80.2%) | 455 (19.8%) |
| 3-Person Household | 729 (72.3%) | 280 (27.8%) |
| 4+ Person Household | 737 (70.4%) | 310 (29.6%) |
| Total Housing Units | 4,688 (70.8%) | 1,934 (29.2%) |
Occupancy by Educational Attainment in Hollins
| Household Size | Owner-occupied | Renter-occupied |
| Less than High School | 187 (59.7%) | 126 (40.3%) |
| High School Diploma | 1,217 (67.3%) | 590 (32.7%) |
| College/Associate Degree | 1,587 (65.2%) | 845 (34.7%) |
| Bachelor's Degree or higher | 1,697 (82.0%) | 373 (18.0%) |
Occupancy by Age of Householder in Hollins
| Age Bracket | # Households | % Households |
| Under 35 Years | 909 | 13.7% |
| 35 to 44 Years | 956 | 14.4% |
| 45 to 54 Years | 950 | 14.3% |
| 55 to 64 Years | 1,068 | 16.1% |
| 65 to 74 Years | 1,624 | 24.5% |
| 75 to 84 Years | 798 | 12.0% |
| 85 Years and Over | 317 | 4.8% |
| Total | 6,622 | 100.0% |
Housing Finances in Hollins
Median Income by Occupancy in Hollins
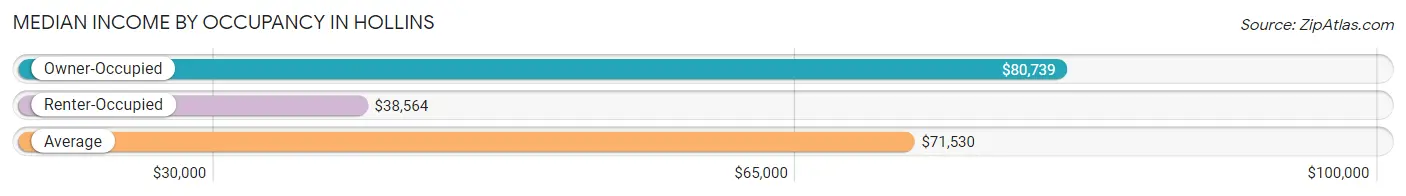
| Occupancy Type | # Households | Median Income |
| Owner-Occupied | 4,688 (70.8%) | $80,739 |
| Renter-Occupied | 1,934 (29.2%) | $38,564 |
| Average | 6,622 (100.0%) | $71,530 |
Occupancy by Householder Income Bracket in Hollins
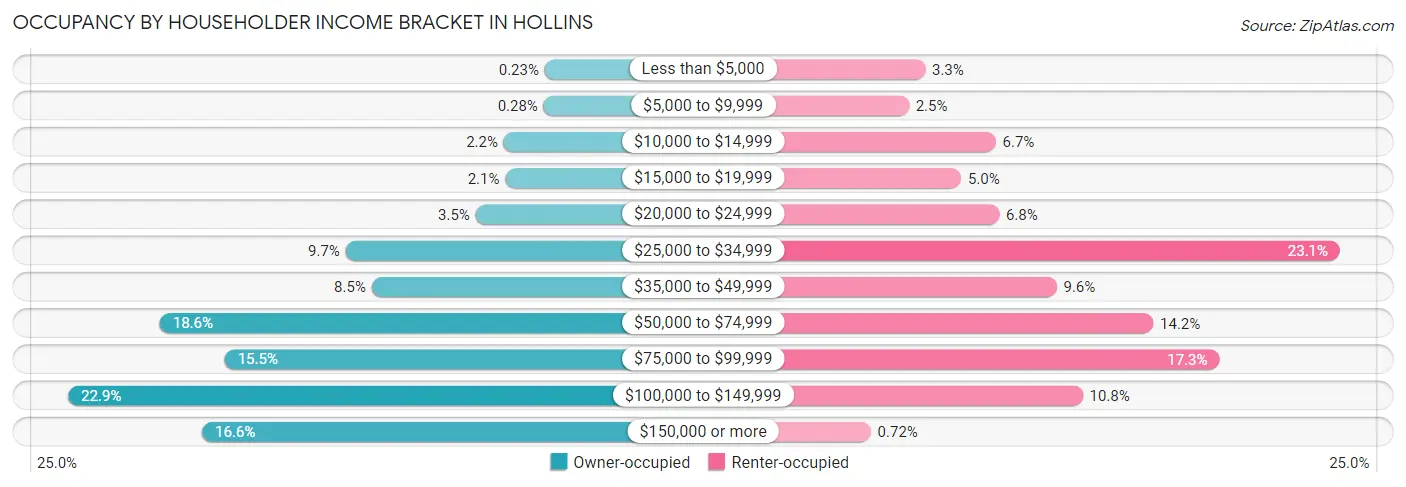
| Income Bracket | Owner-occupied | Renter-occupied |
| Less than $5,000 | 11 (0.2%) | 64 (3.3%) |
| $5,000 to $9,999 | 13 (0.3%) | 49 (2.5%) |
| $10,000 to $14,999 | 102 (2.2%) | 129 (6.7%) |
| $15,000 to $19,999 | 99 (2.1%) | 97 (5.0%) |
| $20,000 to $24,999 | 165 (3.5%) | 132 (6.8%) |
| $25,000 to $34,999 | 455 (9.7%) | 446 (23.1%) |
| $35,000 to $49,999 | 397 (8.5%) | 185 (9.6%) |
| $50,000 to $74,999 | 870 (18.6%) | 274 (14.2%) |
| $75,000 to $99,999 | 725 (15.5%) | 335 (17.3%) |
| $100,000 to $149,999 | 1,075 (22.9%) | 209 (10.8%) |
| $150,000 or more | 776 (16.6%) | 14 (0.7%) |
| Total | 4,688 (100.0%) | 1,934 (100.0%) |
Monthly Housing Cost Tiers in Hollins
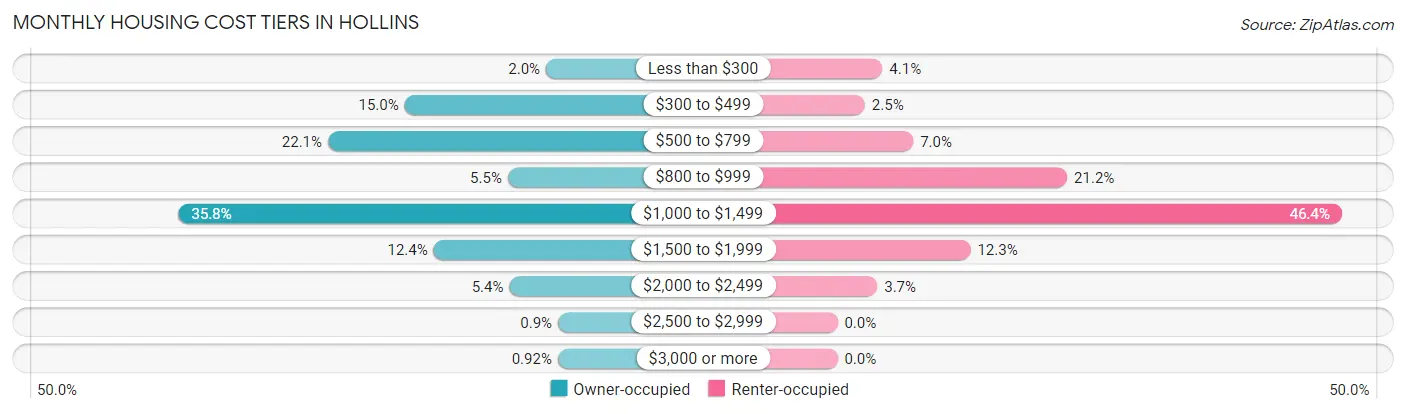
| Monthly Cost | Owner-occupied | Renter-occupied |
| Less than $300 | 94 (2.0%) | 80 (4.1%) |
| $300 to $499 | 704 (15.0%) | 49 (2.5%) |
| $500 to $799 | 1,035 (22.1%) | 135 (7.0%) |
| $800 to $999 | 259 (5.5%) | 409 (21.1%) |
| $1,000 to $1,499 | 1,680 (35.8%) | 898 (46.4%) |
| $1,500 to $1,999 | 579 (12.3%) | 237 (12.2%) |
| $2,000 to $2,499 | 252 (5.4%) | 71 (3.7%) |
| $2,500 to $2,999 | 42 (0.9%) | 0 (0.0%) |
| $3,000 or more | 43 (0.9%) | 0 (0.0%) |
| Total | 4,688 (100.0%) | 1,934 (100.0%) |
Physical Housing Characteristics in Hollins
Housing Structures in Hollins
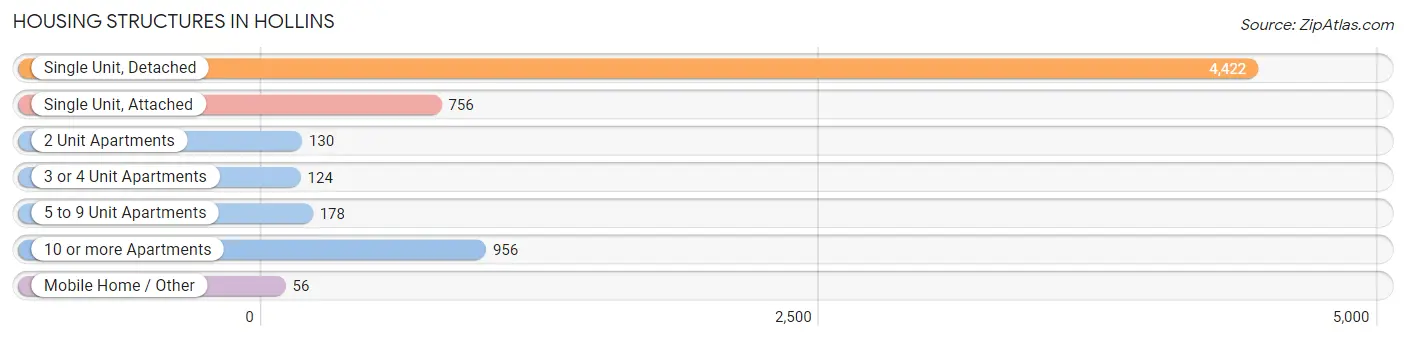
| Structure Type | # Housing Units | % Housing Units |
| Single Unit, Detached | 4,422 | 66.8% |
| Single Unit, Attached | 756 | 11.4% |
| 2 Unit Apartments | 130 | 2.0% |
| 3 or 4 Unit Apartments | 124 | 1.9% |
| 5 to 9 Unit Apartments | 178 | 2.7% |
| 10 or more Apartments | 956 | 14.4% |
| Mobile Home / Other | 56 | 0.9% |
| Total | 6,622 | 100.0% |
Housing Structures by Occupancy in Hollins
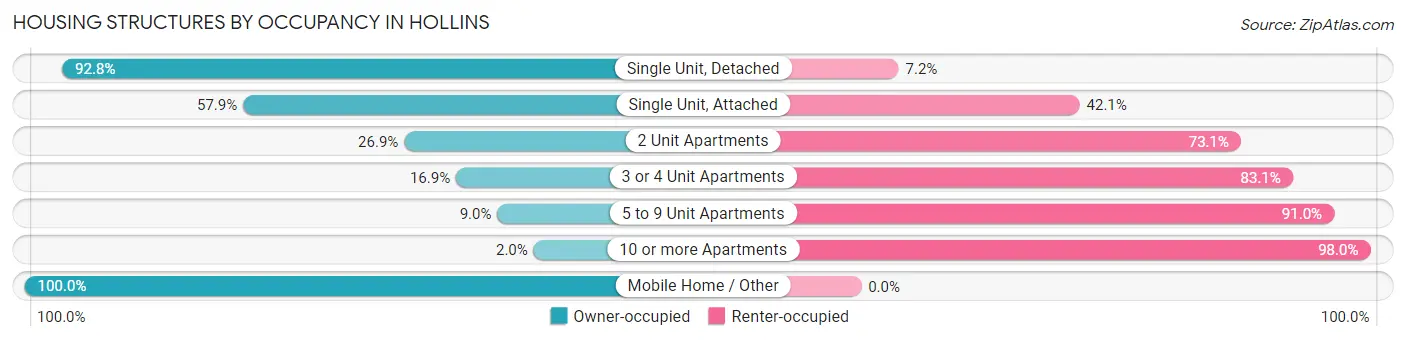
| Structure Type | Owner-occupied | Renter-occupied |
| Single Unit, Detached | 4,103 (92.8%) | 319 (7.2%) |
| Single Unit, Attached | 438 (57.9%) | 318 (42.1%) |
| 2 Unit Apartments | 35 (26.9%) | 95 (73.1%) |
| 3 or 4 Unit Apartments | 21 (16.9%) | 103 (83.1%) |
| 5 to 9 Unit Apartments | 16 (9.0%) | 162 (91.0%) |
| 10 or more Apartments | 19 (2.0%) | 937 (98.0%) |
| Mobile Home / Other | 56 (100.0%) | 0 (0.0%) |
| Total | 4,688 (70.8%) | 1,934 (29.2%) |
Housing Structures by Number of Rooms in Hollins
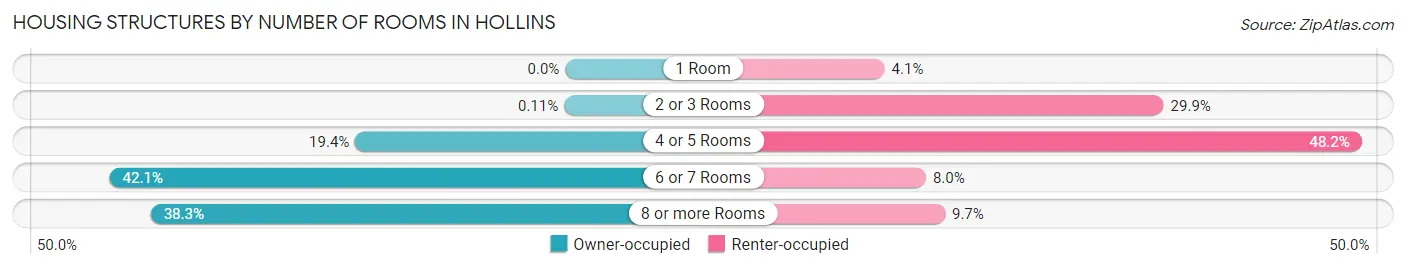
| Number of Rooms | Owner-occupied | Renter-occupied |
| 1 Room | 0 (0.0%) | 80 (4.1%) |
| 2 or 3 Rooms | 5 (0.1%) | 579 (29.9%) |
| 4 or 5 Rooms | 911 (19.4%) | 933 (48.2%) |
| 6 or 7 Rooms | 1,975 (42.1%) | 154 (8.0%) |
| 8 or more Rooms | 1,797 (38.3%) | 188 (9.7%) |
| Total | 4,688 (100.0%) | 1,934 (100.0%) |
Housing Structure by Heating Type in Hollins
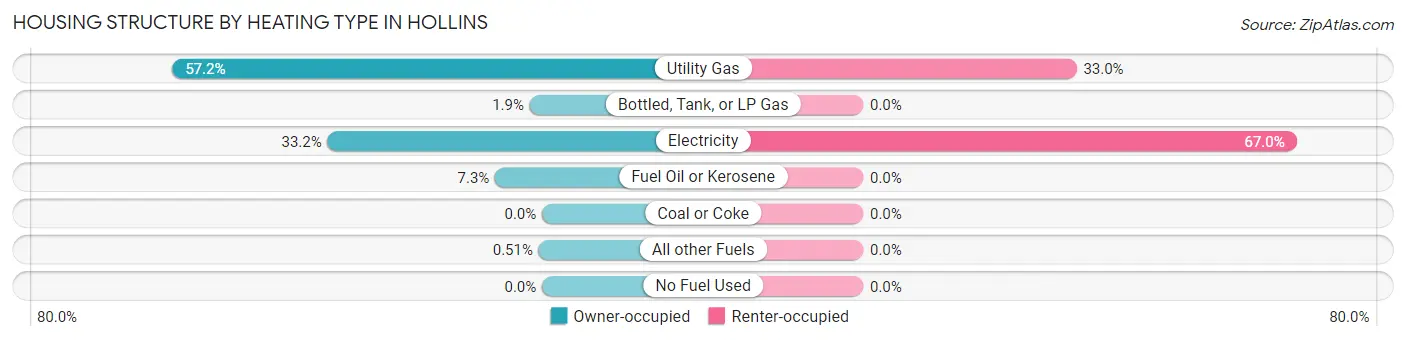
| Heating Type | Owner-occupied | Renter-occupied |
| Utility Gas | 2,680 (57.2%) | 638 (33.0%) |
| Bottled, Tank, or LP Gas | 89 (1.9%) | 0 (0.0%) |
| Electricity | 1,555 (33.2%) | 1,296 (67.0%) |
| Fuel Oil or Kerosene | 340 (7.2%) | 0 (0.0%) |
| Coal or Coke | 0 (0.0%) | 0 (0.0%) |
| All other Fuels | 24 (0.5%) | 0 (0.0%) |
| No Fuel Used | 0 (0.0%) | 0 (0.0%) |
| Total | 4,688 (100.0%) | 1,934 (100.0%) |
Household Vehicle Usage in Hollins
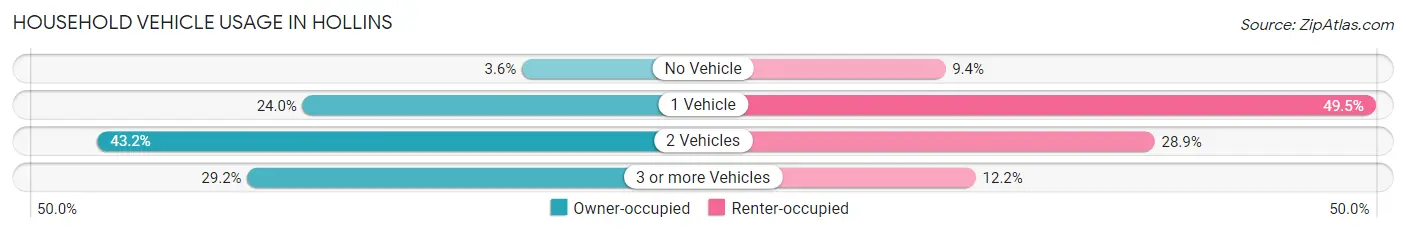
| Vehicles per Household | Owner-occupied | Renter-occupied |
| No Vehicle | 167 (3.6%) | 181 (9.4%) |
| 1 Vehicle | 1,127 (24.0%) | 958 (49.5%) |
| 2 Vehicles | 2,025 (43.2%) | 559 (28.9%) |
| 3 or more Vehicles | 1,369 (29.2%) | 236 (12.2%) |
| Total | 4,688 (100.0%) | 1,934 (100.0%) |
Real Estate & Mortgages in Hollins
Real Estate and Mortgage Overview in Hollins
| Characteristic | Without Mortgage | With Mortgage |
| Housing Units | 1,708 | 2,980 |
| Median Property Value | $224,800 | $210,100 |
| Median Household Income | $74,769 | $559 |
| Monthly Housing Costs | $518 | $43 |
| Real Estate Taxes | $2,060 | $36 |
Property Value by Mortgage Status in Hollins
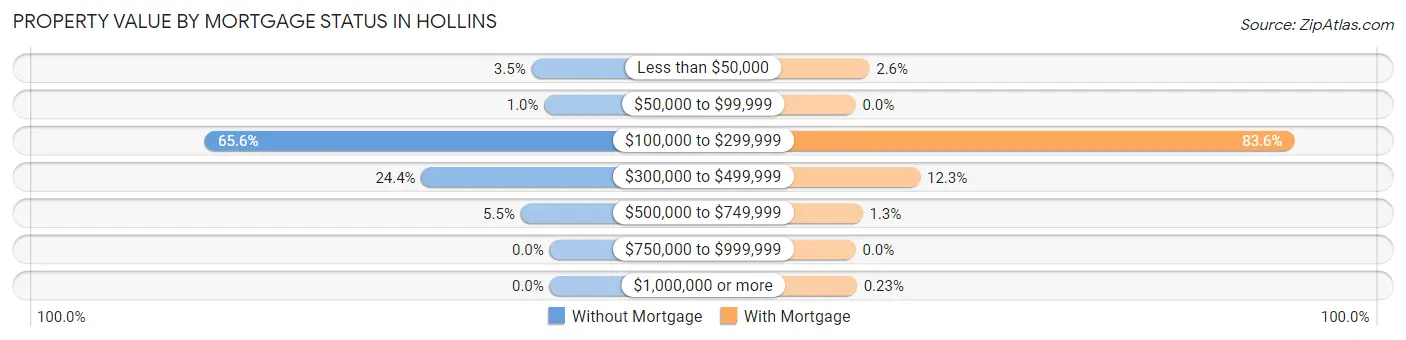
| Property Value | Without Mortgage | With Mortgage |
| Less than $50,000 | 59 (3.5%) | 78 (2.6%) |
| $50,000 to $99,999 | 17 (1.0%) | 0 (0.0%) |
| $100,000 to $299,999 | 1,121 (65.6%) | 2,490 (83.6%) |
| $300,000 to $499,999 | 417 (24.4%) | 366 (12.3%) |
| $500,000 to $749,999 | 94 (5.5%) | 39 (1.3%) |
| $750,000 to $999,999 | 0 (0.0%) | 0 (0.0%) |
| $1,000,000 or more | 0 (0.0%) | 7 (0.2%) |
| Total | 1,708 (100.0%) | 2,980 (100.0%) |
Household Income by Mortgage Status in Hollins
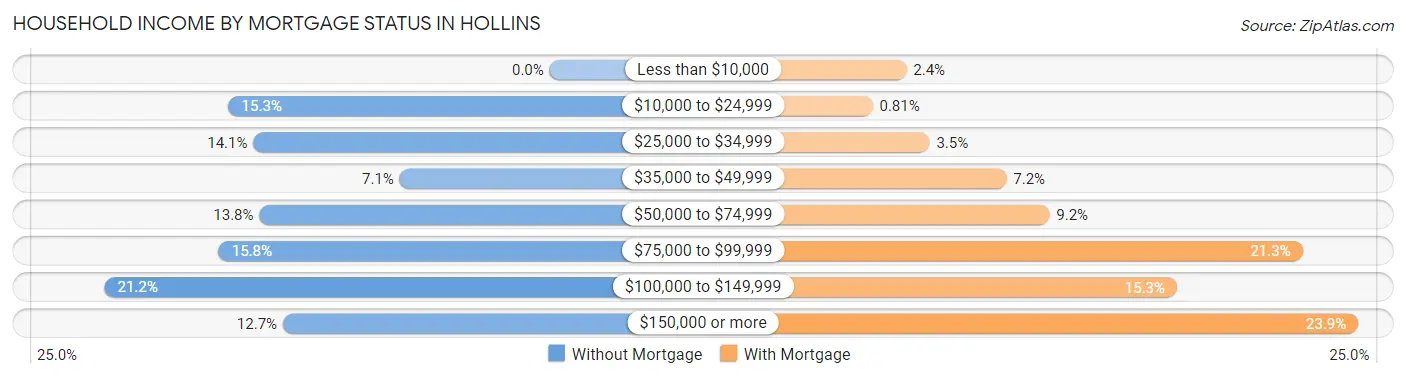
| Household Income | Without Mortgage | With Mortgage |
| Less than $10,000 | 0 (0.0%) | 72 (2.4%) |
| $10,000 to $24,999 | 261 (15.3%) | 24 (0.8%) |
| $25,000 to $34,999 | 241 (14.1%) | 105 (3.5%) |
| $35,000 to $49,999 | 122 (7.1%) | 214 (7.2%) |
| $50,000 to $74,999 | 236 (13.8%) | 275 (9.2%) |
| $75,000 to $99,999 | 269 (15.8%) | 634 (21.3%) |
| $100,000 to $149,999 | 362 (21.2%) | 456 (15.3%) |
| $150,000 or more | 217 (12.7%) | 713 (23.9%) |
| Total | 1,708 (100.0%) | 2,980 (100.0%) |
Property Value to Household Income Ratio in Hollins
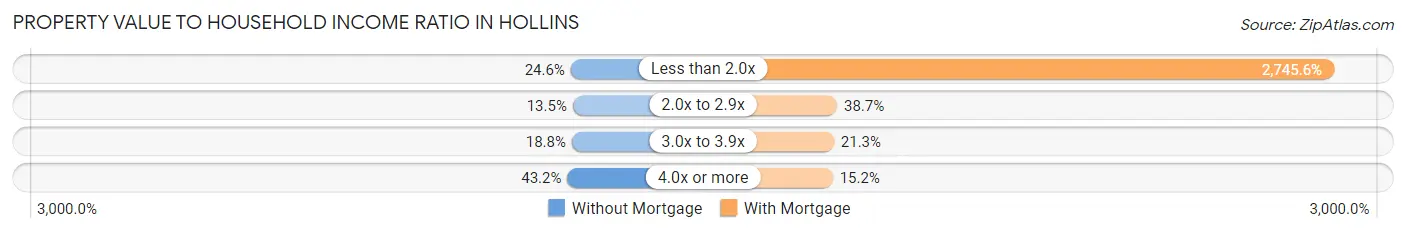
| Value-to-Income Ratio | Without Mortgage | With Mortgage |
| Less than 2.0x | 420 (24.6%) | 81,818 (2,745.6%) |
| 2.0x to 2.9x | 230 (13.5%) | 1,152 (38.7%) |
| 3.0x to 3.9x | 321 (18.8%) | 636 (21.3%) |
| 4.0x or more | 737 (43.1%) | 453 (15.2%) |
| Total | 1,708 (100.0%) | 2,980 (100.0%) |
Real Estate Taxes by Mortgage Status in Hollins
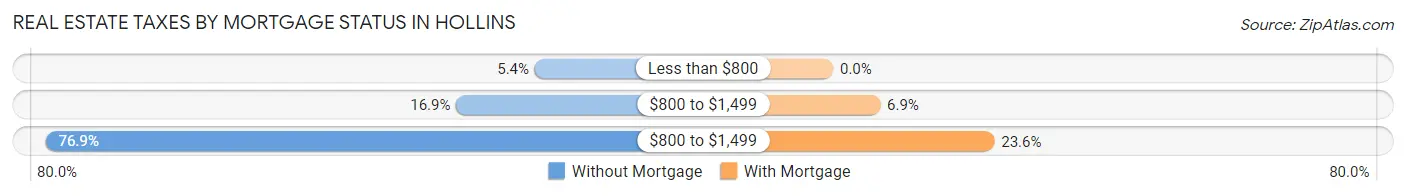
| Property Taxes | Without Mortgage | With Mortgage |
| Less than $800 | 93 (5.4%) | 0 (0.0%) |
| $800 to $1,499 | 289 (16.9%) | 205 (6.9%) |
| $800 to $1,499 | 1,314 (76.9%) | 702 (23.6%) |
| Total | 1,708 (100.0%) | 2,980 (100.0%) |
Health & Disability in Hollins
Health Insurance Coverage by Age in Hollins
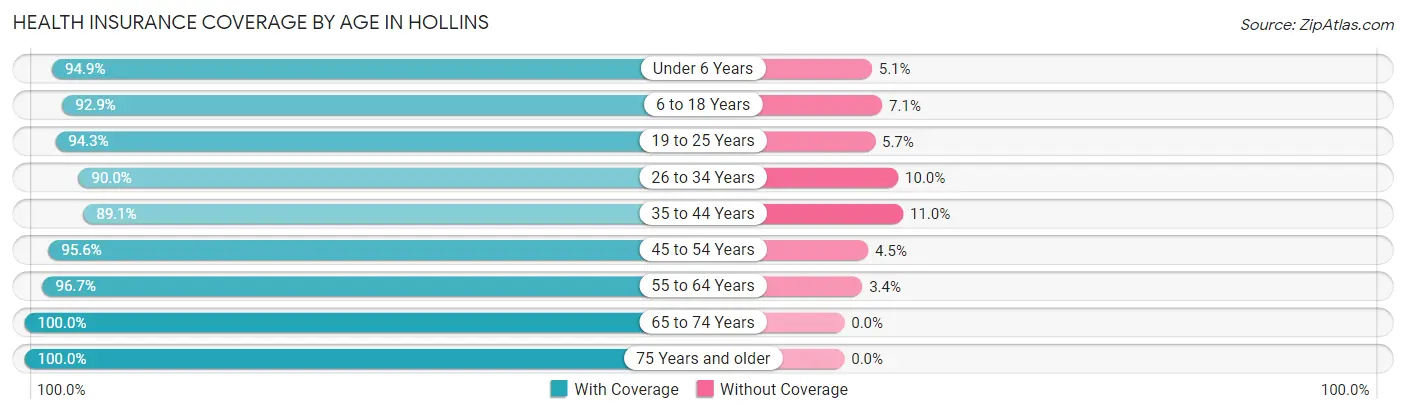
| Age Bracket | With Coverage | Without Coverage |
| Under 6 Years | 610 (94.9%) | 33 (5.1%) |
| 6 to 18 Years | 2,264 (92.9%) | 172 (7.1%) |
| 19 to 25 Years | 1,613 (94.3%) | 98 (5.7%) |
| 26 to 34 Years | 1,407 (90.0%) | 157 (10.0%) |
| 35 to 44 Years | 1,521 (89.0%) | 187 (11.0%) |
| 45 to 54 Years | 1,909 (95.6%) | 89 (4.4%) |
| 55 to 64 Years | 2,051 (96.7%) | 71 (3.4%) |
| 65 to 74 Years | 2,264 (100.0%) | 0 (0.0%) |
| 75 Years and older | 1,661 (100.0%) | 0 (0.0%) |
| Total | 15,300 (95.0%) | 807 (5.0%) |
Health Insurance Coverage by Citizenship Status in Hollins
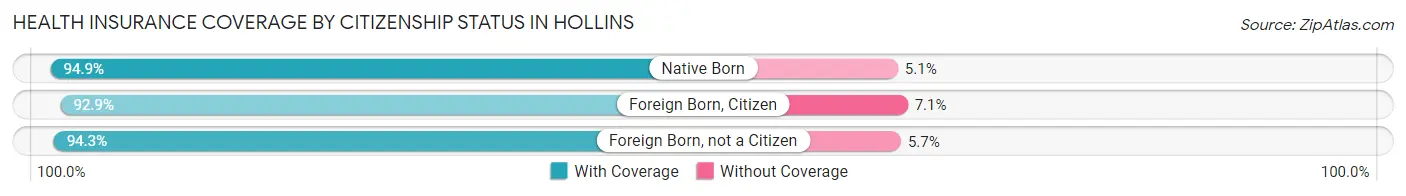
| Citizenship Status | With Coverage | Without Coverage |
| Native Born | 610 (94.9%) | 33 (5.1%) |
| Foreign Born, Citizen | 2,264 (92.9%) | 172 (7.1%) |
| Foreign Born, not a Citizen | 1,613 (94.3%) | 98 (5.7%) |
Health Insurance Coverage by Household Income in Hollins
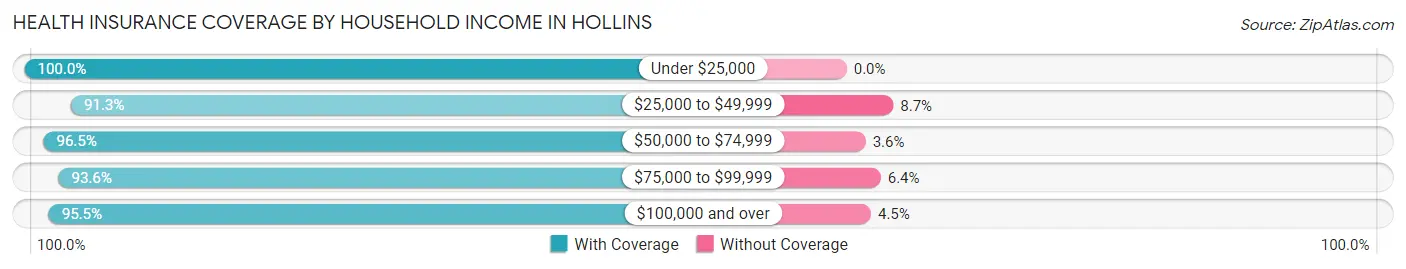
| Household Income | With Coverage | Without Coverage |
| Under $25,000 | 1,129 (100.0%) | 0 (0.0%) |
| $25,000 to $49,999 | 2,377 (91.3%) | 227 (8.7%) |
| $50,000 to $74,999 | 2,579 (96.5%) | 95 (3.5%) |
| $75,000 to $99,999 | 2,543 (93.6%) | 173 (6.4%) |
| $100,000 and over | 6,039 (95.5%) | 287 (4.5%) |
Public vs Private Health Insurance Coverage by Age in Hollins
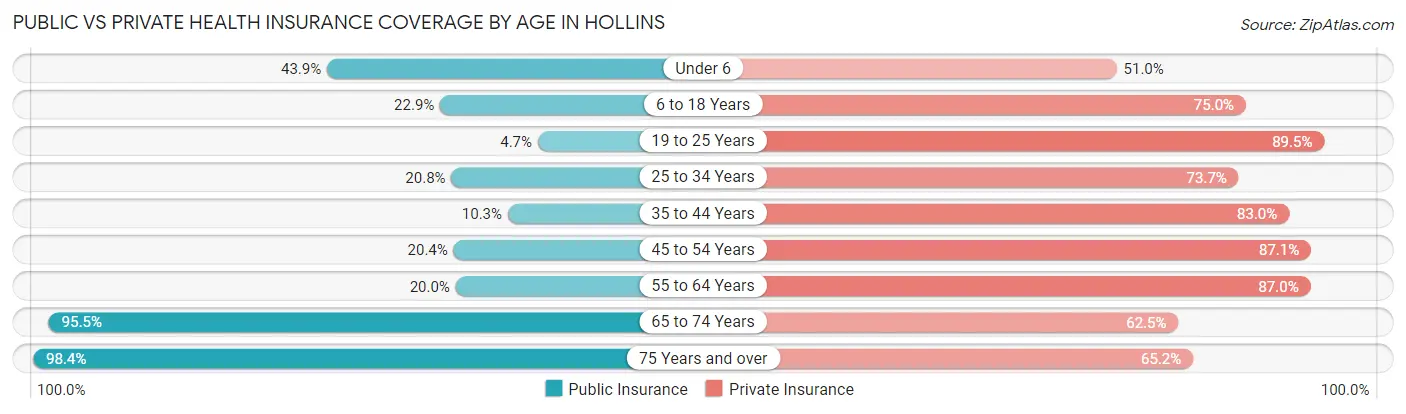
| Age Bracket | Public Insurance | Private Insurance |
| Under 6 | 282 (43.9%) | 328 (51.0%) |
| 6 to 18 Years | 557 (22.9%) | 1,827 (75.0%) |
| 19 to 25 Years | 81 (4.7%) | 1,532 (89.5%) |
| 25 to 34 Years | 325 (20.8%) | 1,152 (73.7%) |
| 35 to 44 Years | 176 (10.3%) | 1,418 (83.0%) |
| 45 to 54 Years | 407 (20.4%) | 1,740 (87.1%) |
| 55 to 64 Years | 424 (20.0%) | 1,846 (87.0%) |
| 65 to 74 Years | 2,163 (95.5%) | 1,414 (62.5%) |
| 75 Years and over | 1,635 (98.4%) | 1,083 (65.2%) |
| Total | 6,050 (37.6%) | 12,340 (76.6%) |
Disability Status by Sex by Age in Hollins
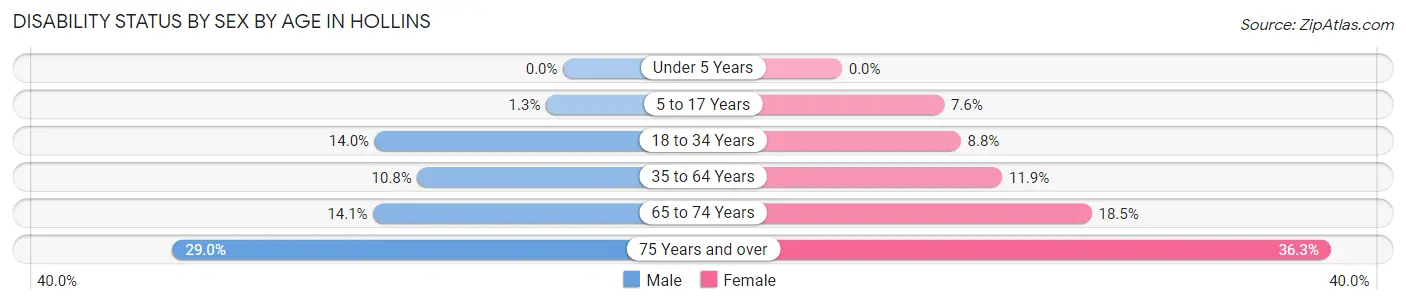
| Age Bracket | Male | Female |
| Under 5 Years | 0 (0.0%) | 0 (0.0%) |
| 5 to 17 Years | 16 (1.3%) | 75 (7.6%) |
| 18 to 34 Years | 226 (14.0%) | 178 (8.8%) |
| 35 to 64 Years | 306 (10.8%) | 357 (11.9%) |
| 65 to 74 Years | 120 (14.1%) | 262 (18.5%) |
| 75 Years and over | 179 (29.0%) | 379 (36.3%) |
Disability Class by Sex by Age in Hollins
Disability Class: Hearing Difficulty
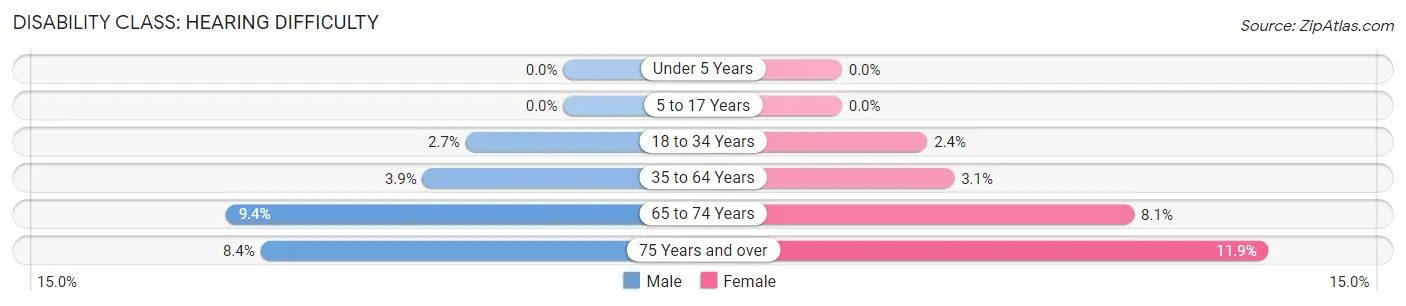
| Age Bracket | Male | Female |
| Under 5 Years | 0 (0.0%) | 0 (0.0%) |
| 5 to 17 Years | 0 (0.0%) | 0 (0.0%) |
| 18 to 34 Years | 44 (2.7%) | 48 (2.4%) |
| 35 to 64 Years | 111 (3.9%) | 94 (3.1%) |
| 65 to 74 Years | 80 (9.4%) | 115 (8.1%) |
| 75 Years and over | 52 (8.4%) | 124 (11.9%) |
Disability Class: Vision Difficulty
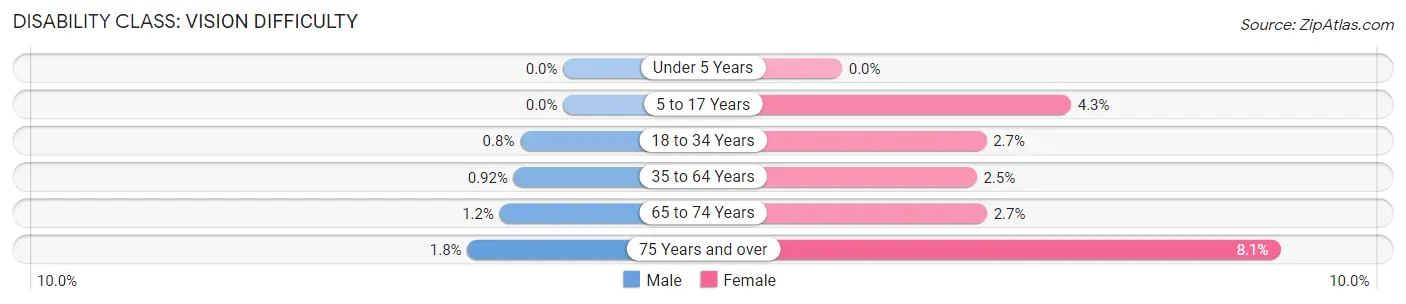
| Age Bracket | Male | Female |
| Under 5 Years | 0 (0.0%) | 0 (0.0%) |
| 5 to 17 Years | 0 (0.0%) | 42 (4.3%) |
| 18 to 34 Years | 13 (0.8%) | 54 (2.7%) |
| 35 to 64 Years | 26 (0.9%) | 75 (2.5%) |
| 65 to 74 Years | 10 (1.2%) | 38 (2.7%) |
| 75 Years and over | 11 (1.8%) | 85 (8.1%) |
Disability Class: Cognitive Difficulty
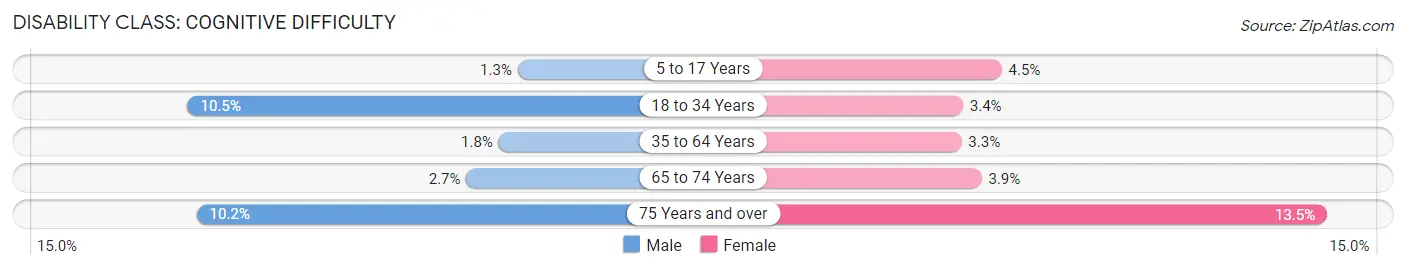
| Age Bracket | Male | Female |
| 5 to 17 Years | 16 (1.3%) | 44 (4.4%) |
| 18 to 34 Years | 169 (10.5%) | 68 (3.4%) |
| 35 to 64 Years | 51 (1.8%) | 100 (3.3%) |
| 65 to 74 Years | 23 (2.7%) | 55 (3.9%) |
| 75 Years and over | 63 (10.2%) | 141 (13.5%) |
Disability Class: Ambulatory Difficulty
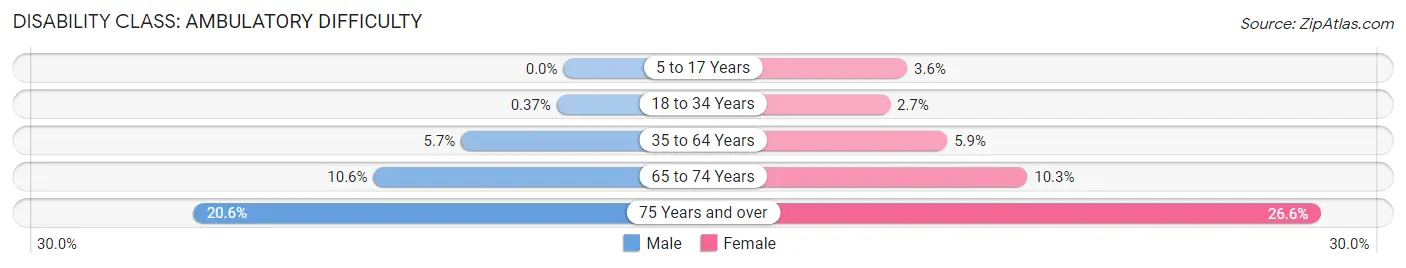
| Age Bracket | Male | Female |
| 5 to 17 Years | 0 (0.0%) | 36 (3.6%) |
| 18 to 34 Years | 6 (0.4%) | 54 (2.7%) |
| 35 to 64 Years | 161 (5.7%) | 176 (5.9%) |
| 65 to 74 Years | 90 (10.6%) | 146 (10.3%) |
| 75 Years and over | 127 (20.6%) | 278 (26.6%) |
Disability Class: Self-Care Difficulty
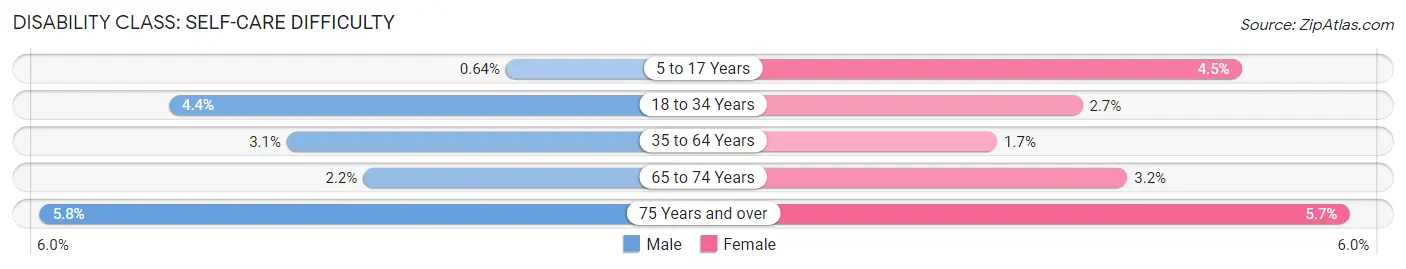
| Age Bracket | Male | Female |
| 5 to 17 Years | 8 (0.6%) | 44 (4.4%) |
| 18 to 34 Years | 71 (4.4%) | 54 (2.7%) |
| 35 to 64 Years | 87 (3.1%) | 52 (1.7%) |
| 65 to 74 Years | 19 (2.2%) | 45 (3.2%) |
| 75 Years and over | 36 (5.8%) | 59 (5.7%) |
Technology Access in Hollins
Computing Device Access in Hollins
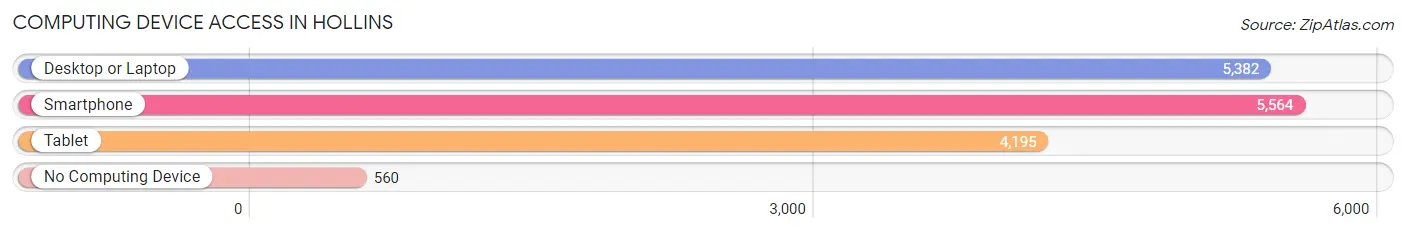
| Device Type | # Households | % Households |
| Desktop or Laptop | 5,382 | 81.3% |
| Smartphone | 5,564 | 84.0% |
| Tablet | 4,195 | 63.3% |
| No Computing Device | 560 | 8.5% |
| Total | 6,622 | 100.0% |
Internet Access in Hollins
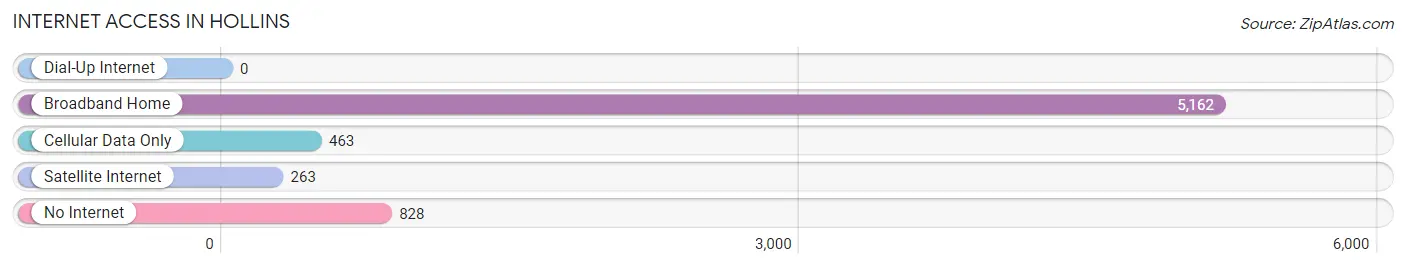
| Internet Type | # Households | % Households |
| Dial-Up Internet | 0 | 0.0% |
| Broadband Home | 5,162 | 77.9% |
| Cellular Data Only | 463 | 7.0% |
| Satellite Internet | 263 | 4.0% |
| No Internet | 828 | 12.5% |
| Total | 6,622 | 100.0% |
Hollins Summary
Hollins is a small unincorporated community located in Roanoke County, Virginia. It is situated in the Roanoke Valley, approximately 10 miles southwest of the city of Roanoke. The community is named after the Hollins family, who were among the first settlers in the area.
History
The area that is now Hollins was first settled in the late 1700s by the Hollins family. The family had migrated from England and settled in the area, which was then part of Botetourt County. The family established a farm and built a log cabin, which is now the oldest standing structure in the area.
In 1832, the area was officially established as the town of Hollins. The town was named after the Hollins family, who had been among the first settlers in the area. The town was initially a small farming community, but it soon began to grow and develop.
In 1854, the Virginia and Tennessee Railroad was built through the town, connecting it to the larger cities of Roanoke and Lynchburg. This allowed the town to become a major stop on the railroad line, and it soon became a popular destination for travelers.
In the late 1800s, the town began to experience a period of growth and development. Several businesses were established, including a hotel, a general store, and a post office. The town also became home to several churches, including the Hollins Methodist Church, which was established in 1871.
In the early 1900s, the town experienced a period of decline. The railroad line was rerouted, and the town began to lose its importance as a major stop on the line. The population began to decline, and many of the businesses in the town closed.
In the late 1900s, the town began to experience a period of revitalization. Several businesses were established, and the population began to increase. The town also became home to several new churches, including the Hollins Baptist Church, which was established in 1998.
Geography
Hollins is located in the Roanoke Valley, approximately 10 miles southwest of the city of Roanoke. The town is situated in the foothills of the Blue Ridge Mountains, and it is surrounded by rolling hills and forests. The town is located along the Roanoke River, and it is close to several major highways, including Interstate 81 and US Route 460.
The climate in Hollins is humid subtropical, with hot, humid summers and mild winters. The average annual temperature is around 57 degrees Fahrenheit, and the average annual precipitation is around 43 inches.
Economy
The economy of Hollins is largely based on agriculture and tourism. The town is home to several farms, and it is a popular destination for tourists who are looking to explore the area’s natural beauty. The town is also home to several small businesses, including restaurants, shops, and other services.
Demographics
As of the 2010 census, the population of Hollins was 1,845. The racial makeup of the town was 94.3% White, 2.3% African American, 0.7% Native American, 0.4% Asian, 0.1% Pacific Islander, and 1.2% from other races. The median household income was $45,938, and the median family income was $51,938.
Common Questions
What is Per Capita Income in Hollins?
Per Capita income in Hollins is $35,038.
What is the Median Family Income in Hollins?
Median Family Income in Hollins is $81,854.
What is the Median Household income in Hollins?
Median Household Income in Hollins is $71,530.
What is Income or Wage Gap in Hollins?
Income or Wage Gap in Hollins is 5.5%.
Women in Hollins earn 94.5 cents for every dollar earned by a man.
What is Family Income Deficit in Hollins?
Family Income Deficit in Hollins is $15,551.
Families that are below poverty line in Hollins earn $15,551 less on average than the poverty threshold level.
What is Inequality or Gini Index in Hollins?
Inequality or Gini Index in Hollins is 0.39.
What is the Total Population of Hollins?
Total Population of Hollins is 16,386.
What is the Total Male Population of Hollins?
Total Male Population of Hollins is 7,566.
What is the Total Female Population of Hollins?
Total Female Population of Hollins is 8,820.
What is the Ratio of Males per 100 Females in Hollins?
There are 85.78 Males per 100 Females in Hollins.
What is the Ratio of Females per 100 Males in Hollins?
There are 116.57 Females per 100 Males in Hollins.
What is the Median Population Age in Hollins?
Median Population Age in Hollins is 46.0 Years.
What is the Average Family Size in Hollins
Average Family Size in Hollins is 3.0 People.
What is the Average Household Size in Hollins
Average Household Size in Hollins is 2.3 People.
How Large is the Labor Force in Hollins?
There are 7,978 People in the Labor Forcein in Hollins.
What is the Percentage of People in the Labor Force in Hollins?
56.6% of People are in the Labor Force in Hollins.
What is the Unemployment Rate in Hollins?
Unemployment Rate in Hollins is 3.0%.