Floris, VA Map & Demographics
Floris Map
Floris Overview
$83,792
PER CAPITA INCOME
$247,603
AVG FAMILY INCOME
$231,161
AVG HOUSEHOLD INCOME
48.4%
WAGE / INCOME GAP [ % ]
51.6¢/ $1
WAGE / INCOME GAP [ $ ]
0.36
INEQUALITY / GINI INDEX
7,417
TOTAL POPULATION
3,754
MALE POPULATION
3,663
FEMALE POPULATION
102.48
MALES / 100 FEMALES
97.58
FEMALES / 100 MALES
43.6
MEDIAN AGE
3.3
AVG FAMILY SIZE
3.0
AVG HOUSEHOLD SIZE
4,307
LABOR FORCE [ PEOPLE ]
74.0%
PERCENT IN LABOR FORCE
5.4%
UNEMPLOYMENT RATE
Income in Floris
Income Overview in Floris
Per Capita Income in Floris is $83,792, while median incomes of families and households are $247,603 and $231,161 respectively.
| Characteristic | Number | Measure |
| Per Capita Income | 7,417 | $83,792 |
| Median Family Income | 2,052 | $247,603 |
| Mean Family Income | 2,052 | $268,544 |
| Median Household Income | 2,434 | $231,161 |
| Mean Household Income | 2,434 | $250,294 |
| Income Deficit | 2,052 | $0 |
| Wage / Income Gap (%) | 7,417 | 48.40% |
| Wage / Income Gap ($) | 7,417 | 51.60¢ per $1 |
| Gini / Inequality Index | 7,417 | 0.36 |
Earnings by Sex in Floris
Average Earnings in Floris are $107,935, $135,669 for men and $70,000 for women, a difference of 48.4%.
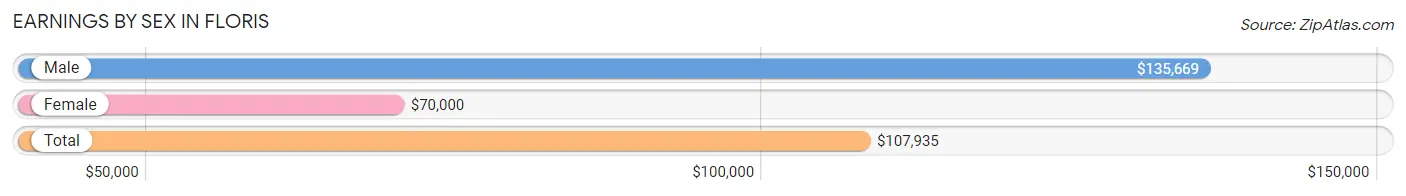
| Sex | Number | Average Earnings |
| Male | 2,444 (54.4%) | $135,669 |
| Female | 2,050 (45.6%) | $70,000 |
| Total | 4,494 (100.0%) | $107,935 |
Earnings by Sex by Income Bracket in Floris
The most common earnings brackets in Floris are $100,000+ for men (1,576 | 64.5%) and $100,000+ for women (788 | 38.4%).
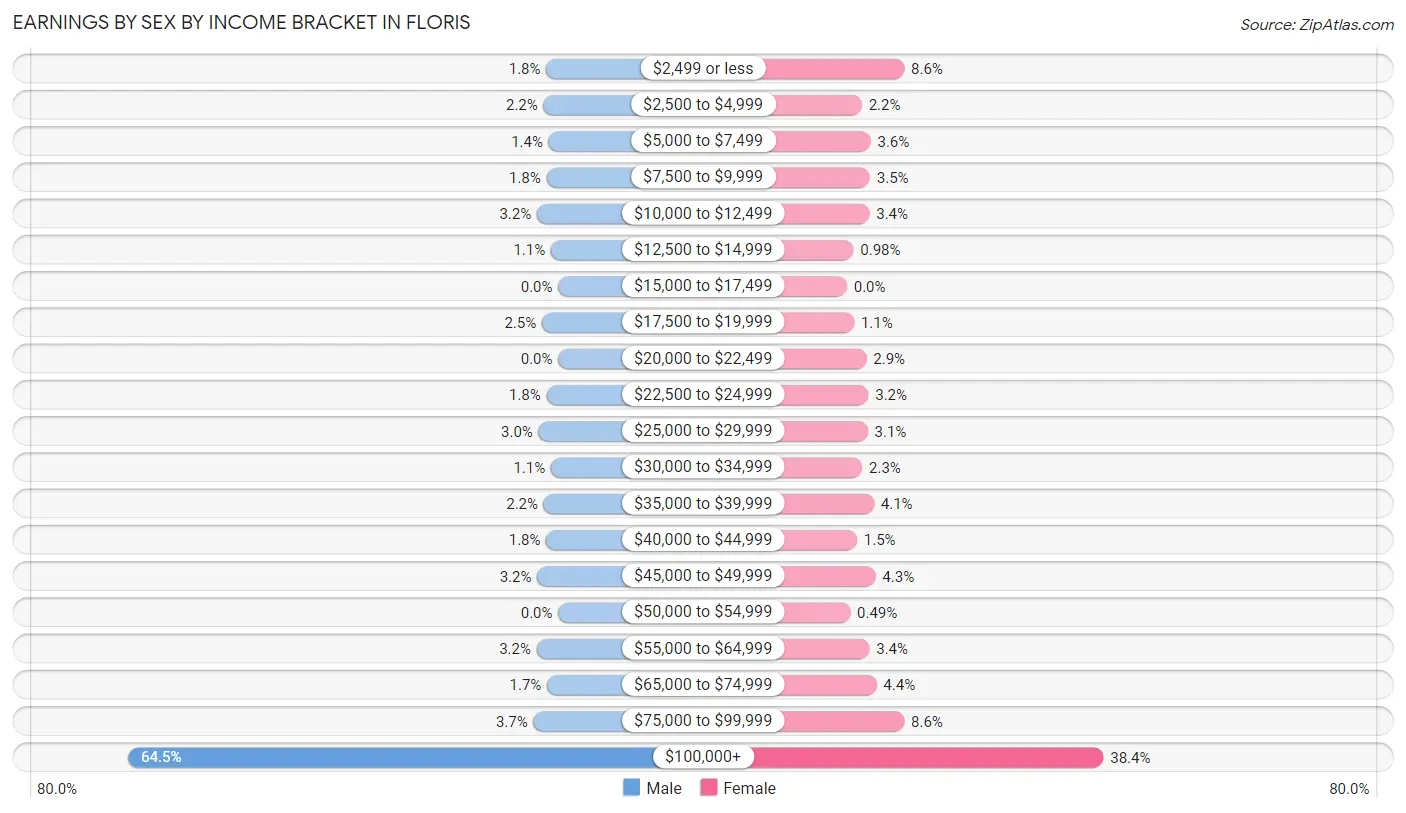
| Income | Male | Female |
| $2,499 or less | 44 (1.8%) | 176 (8.6%) |
| $2,500 to $4,999 | 54 (2.2%) | 46 (2.2%) |
| $5,000 to $7,499 | 35 (1.4%) | 73 (3.6%) |
| $7,500 to $9,999 | 43 (1.8%) | 71 (3.5%) |
| $10,000 to $12,499 | 78 (3.2%) | 69 (3.4%) |
| $12,500 to $14,999 | 27 (1.1%) | 20 (1.0%) |
| $15,000 to $17,499 | 0 (0.0%) | 0 (0.0%) |
| $17,500 to $19,999 | 60 (2.5%) | 22 (1.1%) |
| $20,000 to $22,499 | 0 (0.0%) | 60 (2.9%) |
| $22,500 to $24,999 | 43 (1.8%) | 66 (3.2%) |
| $25,000 to $29,999 | 72 (2.9%) | 64 (3.1%) |
| $30,000 to $34,999 | 27 (1.1%) | 47 (2.3%) |
| $35,000 to $39,999 | 53 (2.2%) | 83 (4.1%) |
| $40,000 to $44,999 | 44 (1.8%) | 31 (1.5%) |
| $45,000 to $49,999 | 77 (3.2%) | 88 (4.3%) |
| $50,000 to $54,999 | 0 (0.0%) | 10 (0.5%) |
| $55,000 to $64,999 | 79 (3.2%) | 69 (3.4%) |
| $65,000 to $74,999 | 41 (1.7%) | 91 (4.4%) |
| $75,000 to $99,999 | 91 (3.7%) | 176 (8.6%) |
| $100,000+ | 1,576 (64.5%) | 788 (38.4%) |
| Total | 2,444 (100.0%) | 2,050 (100.0%) |
Earnings by Sex by Educational Attainment in Floris
Average earnings in Floris are $144,602 for men and $82,781 for women, a difference of 42.7%. Men with an educational attainment of graduate degree enjoy the highest average annual earnings of $173,605, while those with college or associate's degree education earn the least with $44,653. Women with an educational attainment of graduate degree earn the most with the average annual earnings of $108,449, while those with college or associate's degree education have the smallest earnings of $24,444.
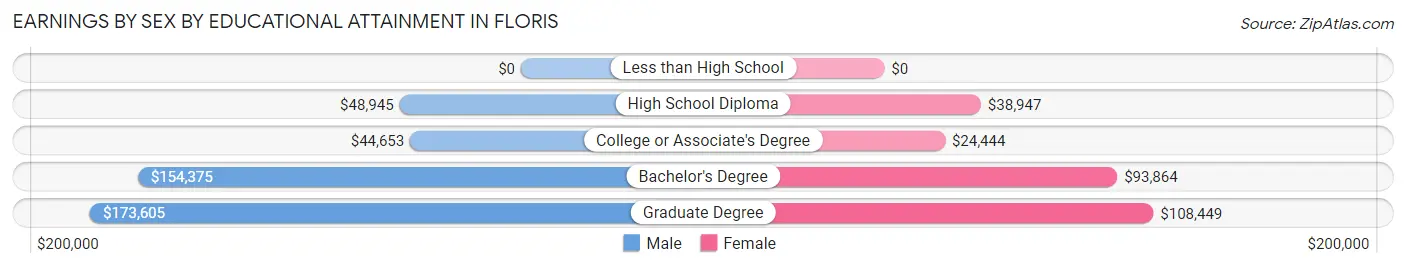
| Educational Attainment | Male Income | Female Income |
| Less than High School | - | - |
| High School Diploma | $48,945 | $38,947 |
| College or Associate's Degree | $44,653 | $24,444 |
| Bachelor's Degree | $154,375 | $93,864 |
| Graduate Degree | $173,605 | $108,449 |
| Total | $144,602 | $82,781 |
Family Income in Floris
Family Income Brackets in Floris
According to the Floris family income data, there are 1,358 families falling into the $200,000+ income range, which is the most common income bracket and makes up 66.2% of all families.
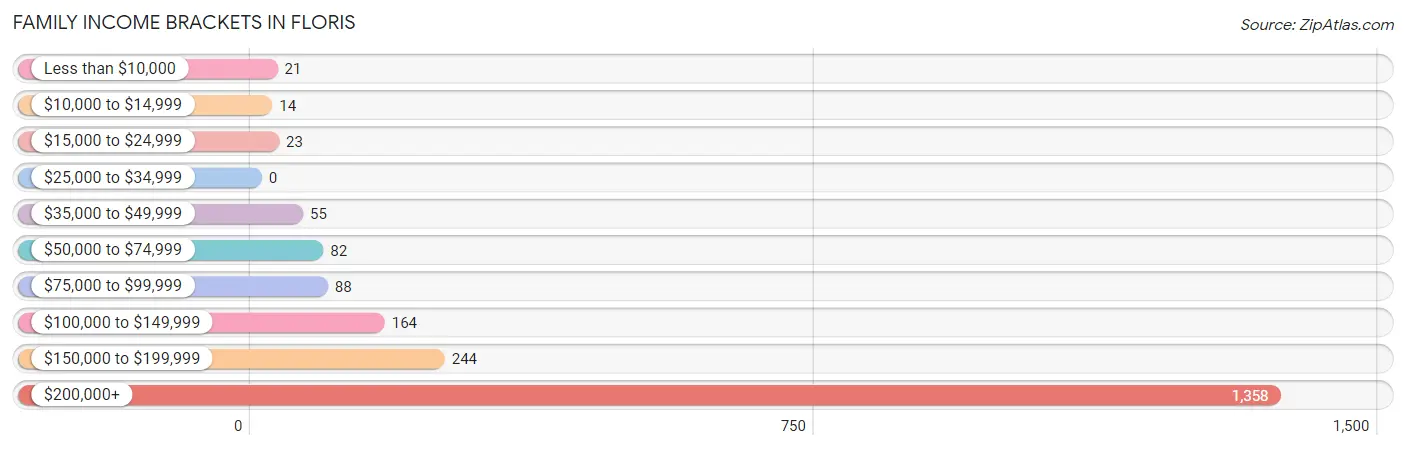
| Income Bracket | # Families | % Families |
| Less than $10,000 | 21 | 1.0% |
| $10,000 to $14,999 | 14 | 0.7% |
| $15,000 to $24,999 | 23 | 1.1% |
| $25,000 to $34,999 | 0 | 0.0% |
| $35,000 to $49,999 | 55 | 2.7% |
| $50,000 to $74,999 | 82 | 4.0% |
| $75,000 to $99,999 | 88 | 4.3% |
| $100,000 to $149,999 | 164 | 8.0% |
| $150,000 to $199,999 | 244 | 11.9% |
| $200,000+ | 1,358 | 66.2% |
Family Income by Famaliy Size in Floris
3-person families (480 | 23.4%) account for the highest median family income in Floris with $250,001 per family, while 2-person families (674 | 32.9%) have the highest median income of $100,416 per family member.
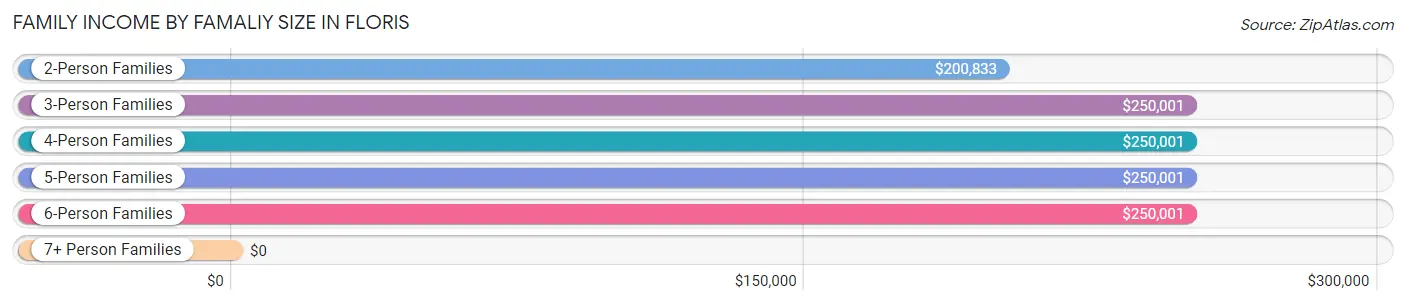
| Income Bracket | # Families | Median Income |
| 2-Person Families | 674 (32.9%) | $200,833 |
| 3-Person Families | 480 (23.4%) | $250,001 |
| 4-Person Families | 692 (33.7%) | $250,001 |
| 5-Person Families | 155 (7.5%) | $250,001 |
| 6-Person Families | 18 (0.9%) | $250,001 |
| 7+ Person Families | 33 (1.6%) | $0 |
| Total | 2,052 (100.0%) | $247,603 |
Family Income by Number of Earners in Floris
The median family income in Floris is $247,603, with families comprising 2 earners (1,194) having the highest median family income of $250,001, while families with no earners (88) have the lowest median family income of $96,538, accounting for 58.2% and 4.3% of families, respectively.
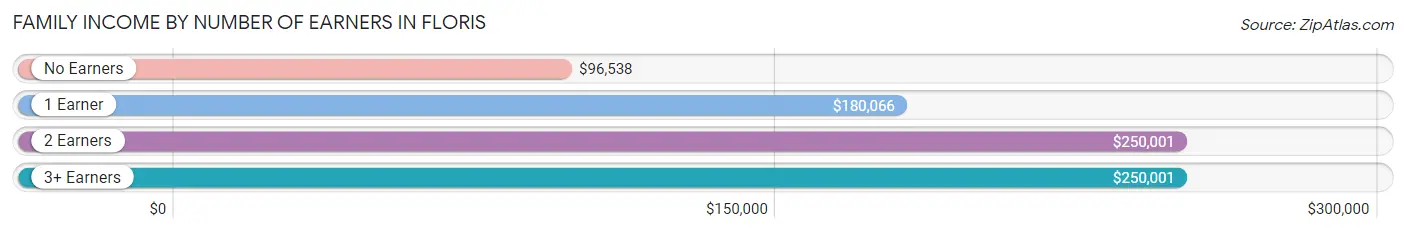
| Number of Earners | # Families | Median Income |
| No Earners | 88 (4.3%) | $96,538 |
| 1 Earner | 445 (21.7%) | $180,066 |
| 2 Earners | 1,194 (58.2%) | $250,001 |
| 3+ Earners | 325 (15.8%) | $250,001 |
| Total | 2,052 (100.0%) | $247,603 |
Household Income in Floris
Household Income Brackets in Floris
With 1,451 households falling in the category, the $200,000+ income range is the most frequent in Floris, accounting for 59.6% of all households. In contrast, only 19 households (0.8%) fall into the less than $10,000 income bracket, making it the least populous group.
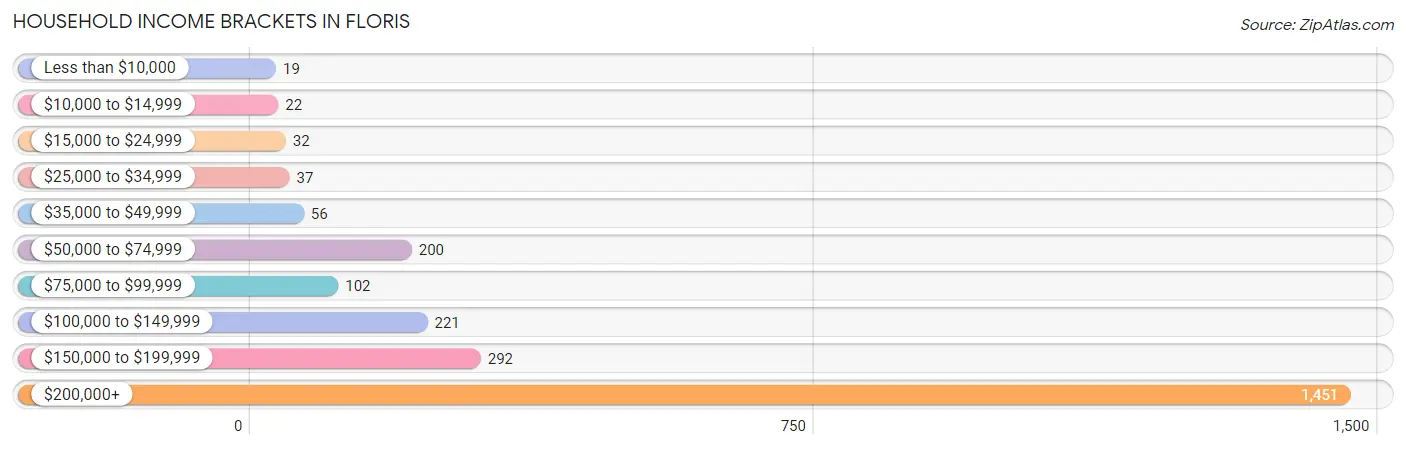
| Income Bracket | # Households | % Households |
| Less than $10,000 | 19 | 0.8% |
| $10,000 to $14,999 | 22 | 0.9% |
| $15,000 to $24,999 | 32 | 1.3% |
| $25,000 to $34,999 | 37 | 1.5% |
| $35,000 to $49,999 | 56 | 2.3% |
| $50,000 to $74,999 | 200 | 8.2% |
| $75,000 to $99,999 | 102 | 4.2% |
| $100,000 to $149,999 | 221 | 9.1% |
| $150,000 to $199,999 | 292 | 12.0% |
| $200,000+ | 1,451 | 59.6% |
Household Income by Householder Age in Floris
The median household income in Floris is $231,161, with the highest median household income of $250,001 found in the 45 to 64 years age bracket for the primary householder. A total of 1,251 households (51.4%) fall into this category. Meanwhile, the 15 to 24 years age bracket for the primary householder has the lowest median household income of $0, with 20 households (0.8%) in this group.
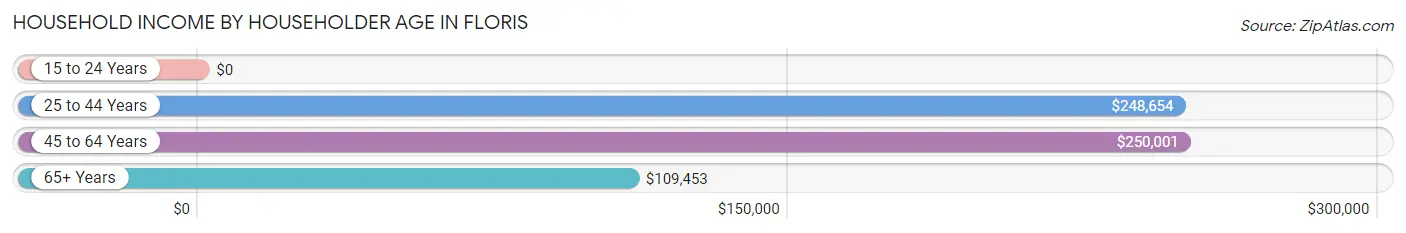
| Income Bracket | # Households | Median Income |
| 15 to 24 Years | 20 (0.8%) | $0 |
| 25 to 44 Years | 564 (23.2%) | $248,654 |
| 45 to 64 Years | 1,251 (51.4%) | $250,001 |
| 65+ Years | 599 (24.6%) | $109,453 |
| Total | 2,434 (100.0%) | $231,161 |
Poverty in Floris
Income Below Poverty by Sex and Age in Floris
With 1.5% poverty level for males and 2.9% for females among the residents of Floris, 6 to 11 year old males and 25 to 34 year old females are the most vulnerable to poverty, with 18 males (5.1%) and 26 females (14.4%) in their respective age groups living below the poverty level.
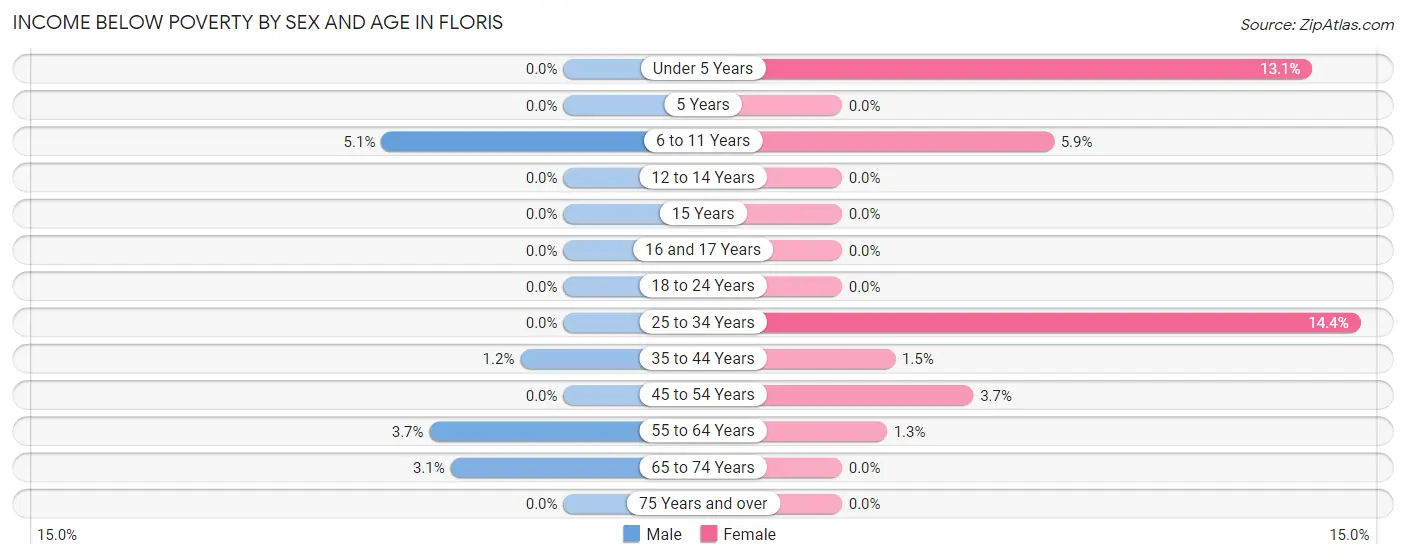
| Age Bracket | Male | Female |
| Under 5 Years | 0 (0.0%) | 22 (13.1%) |
| 5 Years | 0 (0.0%) | 0 (0.0%) |
| 6 to 11 Years | 18 (5.1%) | 18 (5.9%) |
| 12 to 14 Years | 0 (0.0%) | 0 (0.0%) |
| 15 Years | 0 (0.0%) | 0 (0.0%) |
| 16 and 17 Years | 0 (0.0%) | 0 (0.0%) |
| 18 to 24 Years | 0 (0.0%) | 0 (0.0%) |
| 25 to 34 Years | 0 (0.0%) | 26 (14.4%) |
| 35 to 44 Years | 6 (1.2%) | 8 (1.5%) |
| 45 to 54 Years | 0 (0.0%) | 23 (3.7%) |
| 55 to 64 Years | 25 (3.7%) | 8 (1.3%) |
| 65 to 74 Years | 9 (3.1%) | 0 (0.0%) |
| 75 Years and over | 0 (0.0%) | 0 (0.0%) |
| Total | 58 (1.5%) | 105 (2.9%) |
Income Above Poverty by Sex and Age in Floris
According to the poverty statistics in Floris, males aged under 5 years and females aged 5 years are the age groups that are most secure financially, with 100.0% of males and 100.0% of females in these age groups living above the poverty line.
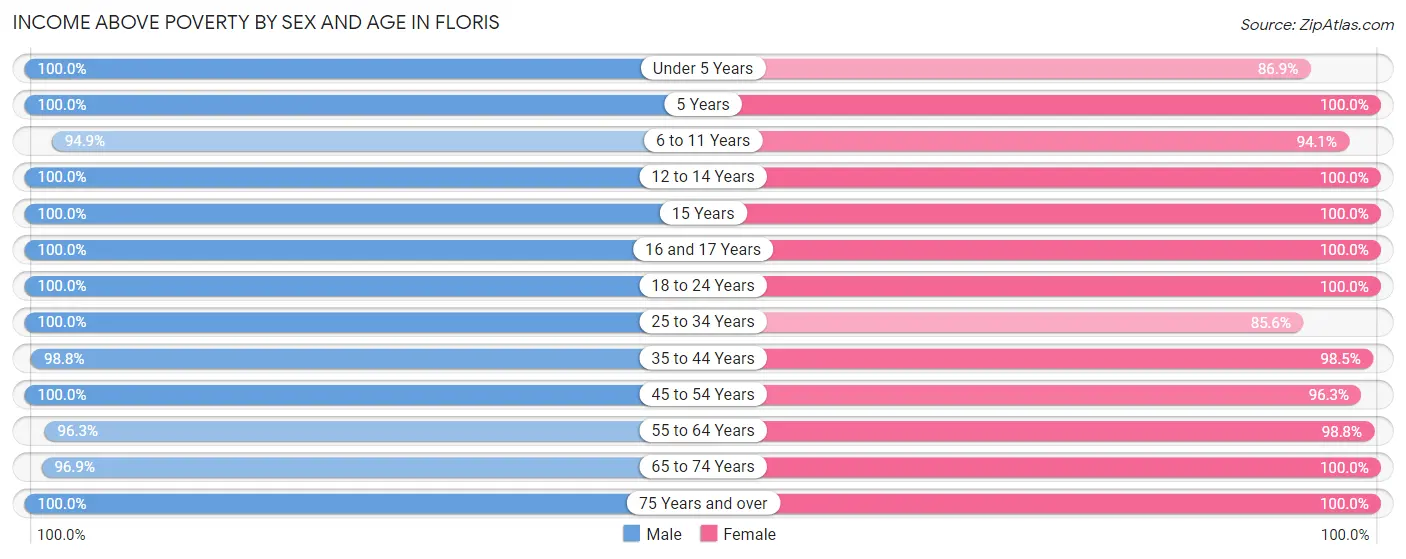
| Age Bracket | Male | Female |
| Under 5 Years | 176 (100.0%) | 146 (86.9%) |
| 5 Years | 6 (100.0%) | 37 (100.0%) |
| 6 to 11 Years | 337 (94.9%) | 287 (94.1%) |
| 12 to 14 Years | 235 (100.0%) | 174 (100.0%) |
| 15 Years | 61 (100.0%) | 80 (100.0%) |
| 16 and 17 Years | 126 (100.0%) | 127 (100.0%) |
| 18 to 24 Years | 283 (100.0%) | 267 (100.0%) |
| 25 to 34 Years | 235 (100.0%) | 154 (85.6%) |
| 35 to 44 Years | 492 (98.8%) | 534 (98.5%) |
| 45 to 54 Years | 620 (100.0%) | 606 (96.3%) |
| 55 to 64 Years | 646 (96.3%) | 633 (98.8%) |
| 65 to 74 Years | 278 (96.9%) | 259 (100.0%) |
| 75 Years and over | 190 (100.0%) | 233 (100.0%) |
| Total | 3,685 (98.5%) | 3,537 (97.1%) |
Income Below Poverty Among Married-Couple Families in Floris
The poverty statistics for married-couple families in Floris show that 2.1% or 38 of the total 1,835 families live below the poverty line. Families with no children have the highest poverty rate of 3.7%, comprising of 32 families. On the other hand, families with 3 or 4 children have the lowest poverty rate of 0.0%, which includes 0 families.
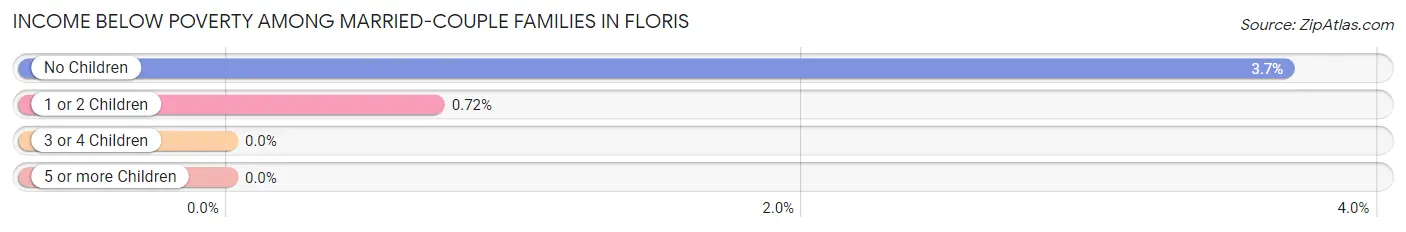
| Children | Above Poverty | Below Poverty |
| No Children | 837 (96.3%) | 32 (3.7%) |
| 1 or 2 Children | 833 (99.3%) | 6 (0.7%) |
| 3 or 4 Children | 102 (100.0%) | 0 (0.0%) |
| 5 or more Children | 25 (100.0%) | 0 (0.0%) |
| Total | 1,797 (97.9%) | 38 (2.1%) |
Income Below Poverty Among Single-Parent Households in Floris
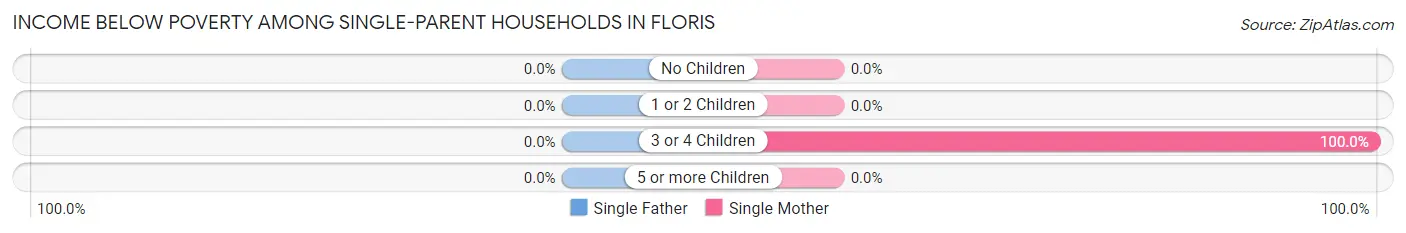
| Children | Single Father | Single Mother |
| No Children | 0 (0.0%) | 0 (0.0%) |
| 1 or 2 Children | 0 (0.0%) | 0 (0.0%) |
| 3 or 4 Children | 0 (0.0%) | 20 (100.0%) |
| 5 or more Children | 0 (0.0%) | 0 (0.0%) |
| Total | 0 (0.0%) | 20 (13.6%) |
Income Below Poverty Among Married-Couple vs Single-Parent Households in Floris
The poverty data for Floris shows that 38 of the married-couple family households (2.1%) and 20 of the single-parent households (9.2%) are living below the poverty level. Within the married-couple family households, those with no children have the highest poverty rate, with 32 households (3.7%) falling below the poverty line. Among the single-parent households, those with 3 or 4 children have the highest poverty rate, with 20 household (100.0%) living below poverty.
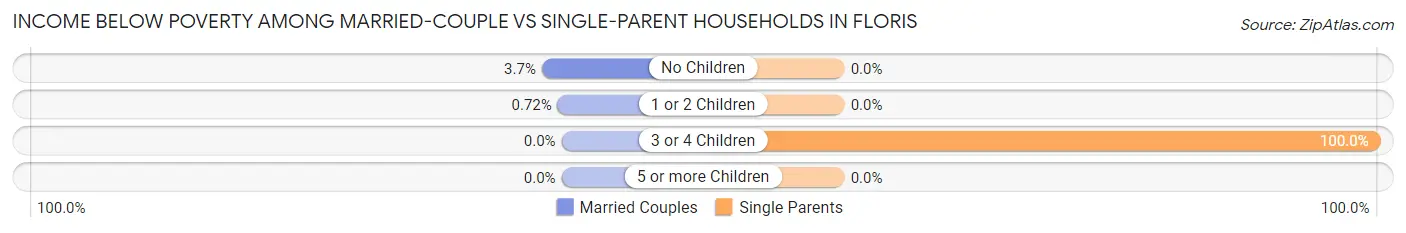
| Children | Married-Couple Families | Single-Parent Households |
| No Children | 32 (3.7%) | 0 (0.0%) |
| 1 or 2 Children | 6 (0.7%) | 0 (0.0%) |
| 3 or 4 Children | 0 (0.0%) | 20 (100.0%) |
| 5 or more Children | 0 (0.0%) | 0 (0.0%) |
| Total | 38 (2.1%) | 20 (9.2%) |
Race in Floris
The most populous races in Floris are White / Caucasian (3,770 | 50.8%), Asian (2,843 | 38.3%), and Two or more Races (469 | 6.3%).
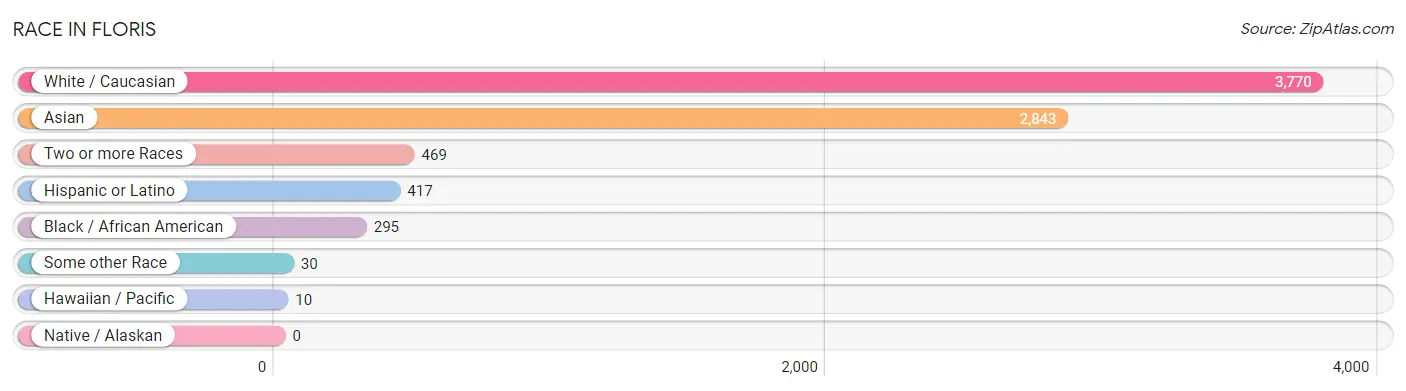
| Race | # Population | % Population |
| Asian | 2,843 | 38.3% |
| Black / African American | 295 | 4.0% |
| Hawaiian / Pacific | 10 | 0.1% |
| Hispanic or Latino | 417 | 5.6% |
| Native / Alaskan | 0 | 0.0% |
| White / Caucasian | 3,770 | 50.8% |
| Two or more Races | 469 | 6.3% |
| Some other Race | 30 | 0.4% |
| Total | 7,417 | 100.0% |
Ancestry in Floris
The most populous ancestries reported in Floris are Thai (1,500 | 20.2%), Irish (872 | 11.8%), German (684 | 9.2%), English (529 | 7.1%), and Indian (Asian) (529 | 7.1%), together accounting for 55.5% of all Floris residents.
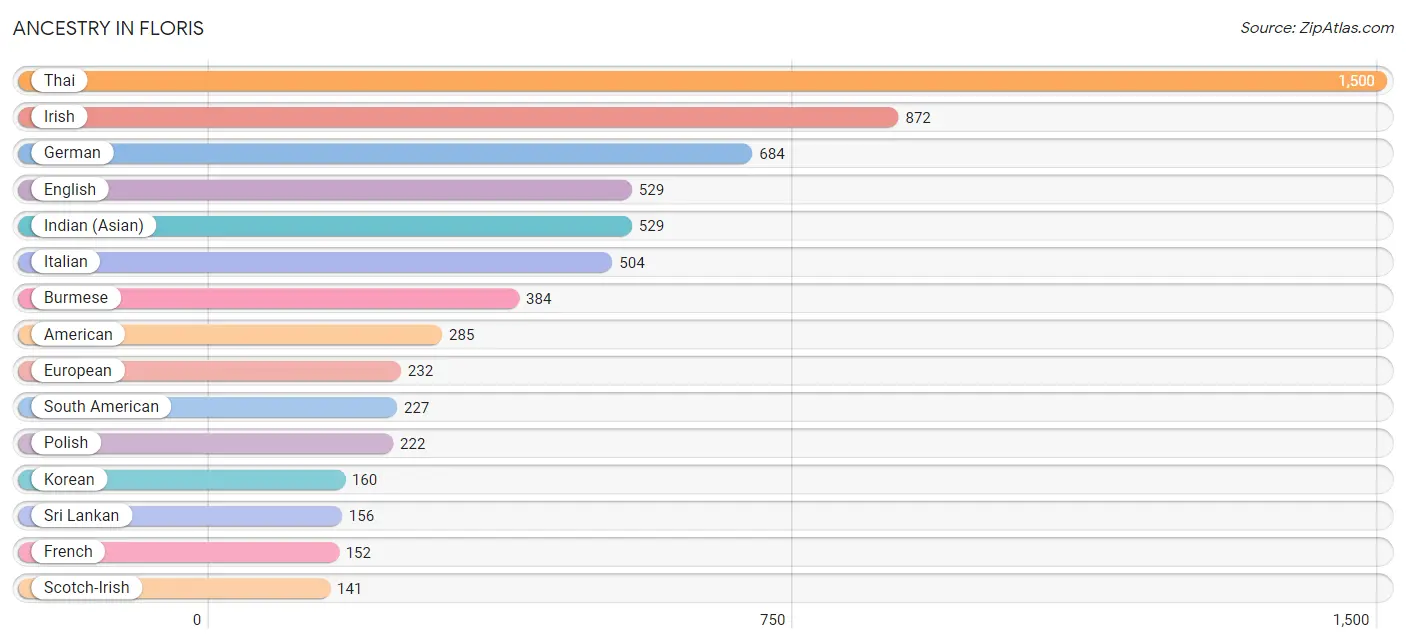
| Ancestry | # Population | % Population |
| Afghan | 59 | 0.8% |
| Albanian | 60 | 0.8% |
| American | 285 | 3.8% |
| Arab | 25 | 0.3% |
| Argentinean | 11 | 0.2% |
| Armenian | 6 | 0.1% |
| Austrian | 10 | 0.1% |
| Bhutanese | 120 | 1.6% |
| Bolivian | 78 | 1.1% |
| Brazilian | 13 | 0.2% |
| British | 85 | 1.1% |
| Burmese | 384 | 5.2% |
| Canadian | 14 | 0.2% |
| Central American | 101 | 1.4% |
| Central American Indian | 8 | 0.1% |
| Colombian | 13 | 0.2% |
| Cuban | 19 | 0.3% |
| Czech | 35 | 0.5% |
| Czechoslovakian | 8 | 0.1% |
| Danish | 18 | 0.2% |
| Delaware | 10 | 0.1% |
| Dutch | 43 | 0.6% |
| Eastern European | 98 | 1.3% |
| Egyptian | 8 | 0.1% |
| English | 529 | 7.1% |
| European | 232 | 3.1% |
| Filipino | 122 | 1.6% |
| Finnish | 9 | 0.1% |
| French | 152 | 2.1% |
| French Canadian | 32 | 0.4% |
| German | 684 | 9.2% |
| Greek | 61 | 0.8% |
| Guamanian / Chamorro | 21 | 0.3% |
| Guatemalan | 21 | 0.3% |
| Haitian | 7 | 0.1% |
| Hungarian | 21 | 0.3% |
| Indian (Asian) | 529 | 7.1% |
| Iranian | 24 | 0.3% |
| Iraqi | 8 | 0.1% |
| Irish | 872 | 11.8% |
| Italian | 504 | 6.8% |
| Korean | 160 | 2.2% |
| Lebanese | 11 | 0.2% |
| Mexican | 17 | 0.2% |
| Mongolian | 8 | 0.1% |
| New Zealander | 10 | 0.1% |
| Northern European | 37 | 0.5% |
| Norwegian | 49 | 0.7% |
| Pakistani | 8 | 0.1% |
| Pennsylvania German | 30 | 0.4% |
| Peruvian | 125 | 1.7% |
| Polish | 222 | 3.0% |
| Portuguese | 89 | 1.2% |
| Puerto Rican | 53 | 0.7% |
| Romanian | 20 | 0.3% |
| Russian | 100 | 1.3% |
| Salvadoran | 80 | 1.1% |
| Scandinavian | 6 | 0.1% |
| Scotch-Irish | 141 | 1.9% |
| Scottish | 95 | 1.3% |
| Serbian | 24 | 0.3% |
| South American | 227 | 3.1% |
| Sri Lankan | 156 | 2.1% |
| Swedish | 38 | 0.5% |
| Swiss | 20 | 0.3% |
| Thai | 1,500 | 20.2% |
| Turkish | 6 | 0.1% |
| Ukrainian | 14 | 0.2% |
| Welsh | 80 | 1.1% |
| West Indian | 8 | 0.1% | View All 70 Rows |
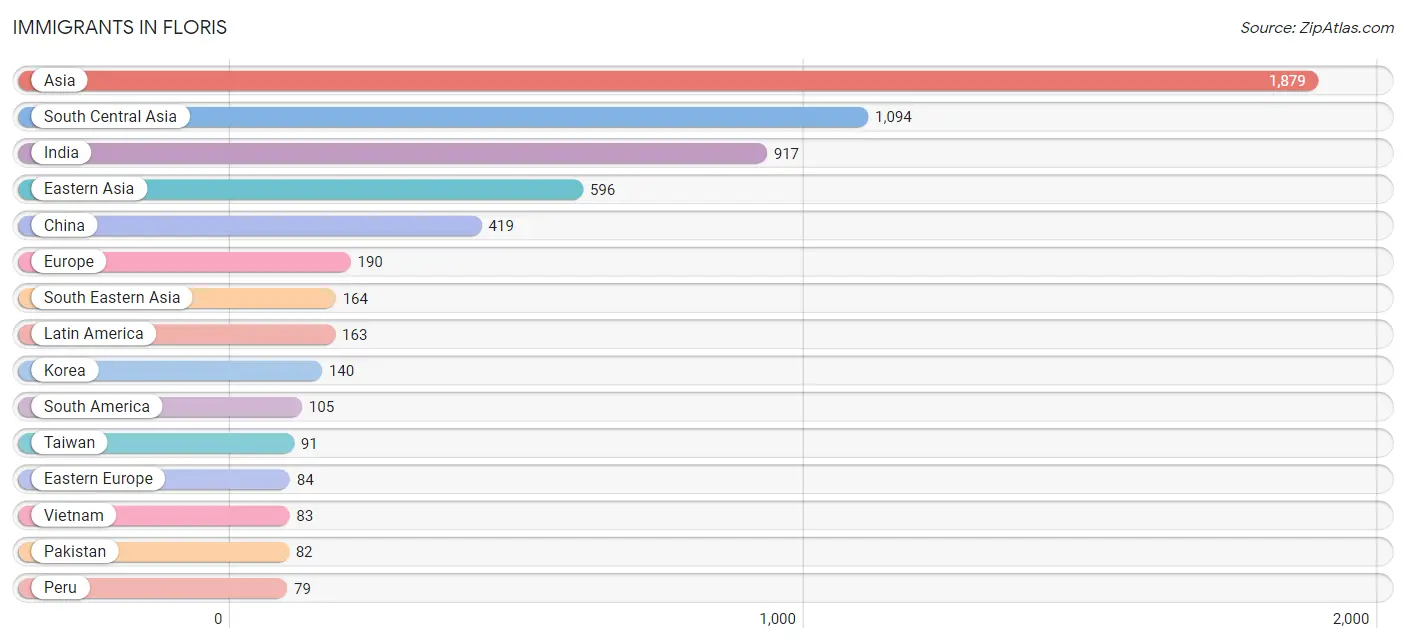
Immigrants in Floris
The most numerous immigrant groups reported in Floris came from Asia (1,879 | 25.3%), South Central Asia (1,094 | 14.7%), India (917 | 12.4%), Eastern Asia (596 | 8.0%), and China (419 | 5.7%), together accounting for 66.1% of all Floris residents.
| Immigration Origin | # Population | % Population |
| Afghanistan | 39 | 0.5% |
| Africa | 31 | 0.4% |
| Albania | 21 | 0.3% |
| Asia | 1,879 | 25.3% |
| Bolivia | 20 | 0.3% |
| Brazil | 6 | 0.1% |
| Cambodia | 7 | 0.1% |
| Canada | 18 | 0.2% |
| Caribbean | 7 | 0.1% |
| Central America | 51 | 0.7% |
| China | 419 | 5.7% |
| Czechoslovakia | 21 | 0.3% |
| Eastern Asia | 596 | 8.0% |
| Eastern Europe | 84 | 1.1% |
| Egypt | 6 | 0.1% |
| El Salvador | 51 | 0.7% |
| Europe | 190 | 2.6% |
| France | 23 | 0.3% |
| Germany | 12 | 0.2% |
| Hong Kong | 13 | 0.2% |
| India | 917 | 12.4% |
| Iran | 24 | 0.3% |
| Ireland | 4 | 0.1% |
| Jamaica | 7 | 0.1% |
| Japan | 37 | 0.5% |
| Korea | 140 | 1.9% |
| Kuwait | 6 | 0.1% |
| Latin America | 163 | 2.2% |
| Malaysia | 8 | 0.1% |
| Middle Africa | 25 | 0.3% |
| Nepal | 20 | 0.3% |
| Northern Africa | 6 | 0.1% |
| Northern Europe | 33 | 0.4% |
| Norway | 6 | 0.1% |
| Oceania | 13 | 0.2% |
| Pakistan | 82 | 1.1% |
| Peru | 79 | 1.1% |
| Philippines | 58 | 0.8% |
| Poland | 8 | 0.1% |
| Portugal | 38 | 0.5% |
| Romania | 14 | 0.2% |
| Russia | 7 | 0.1% |
| South America | 105 | 1.4% |
| South Central Asia | 1,094 | 14.7% |
| South Eastern Asia | 164 | 2.2% |
| Southern Europe | 38 | 0.5% |
| Taiwan | 91 | 1.2% |
| Thailand | 8 | 0.1% |
| Uzbekistan | 12 | 0.2% |
| Vietnam | 83 | 1.1% |
| Western Asia | 6 | 0.1% |
| Western Europe | 35 | 0.5% |
| Zaire | 25 | 0.3% | View All 53 Rows |
Sex and Age in Floris
Sex and Age in Floris
The most populous age groups in Floris are 55 to 59 Years (429 | 11.4%) for men and 45 to 49 Years (364 | 9.9%) for women.
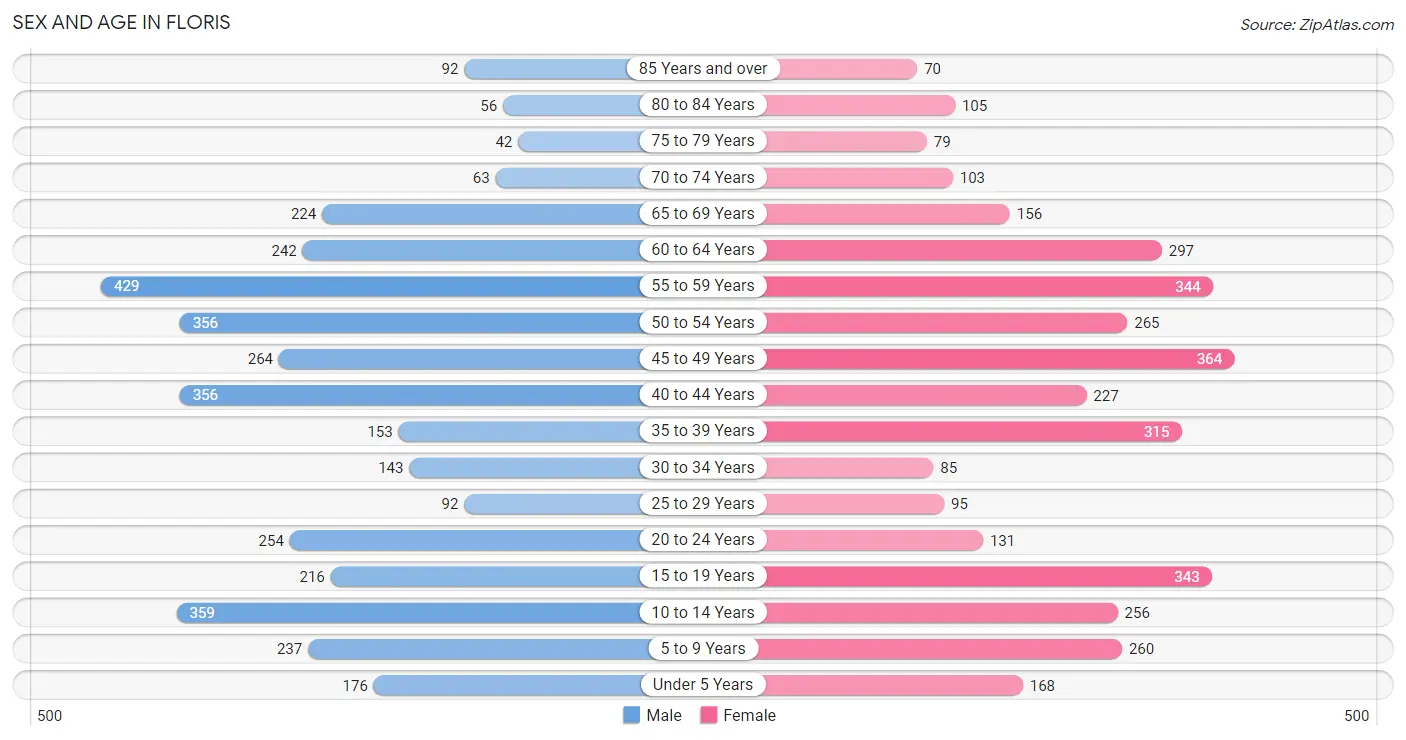
| Age Bracket | Male | Female |
| Under 5 Years | 176 (4.7%) | 168 (4.6%) |
| 5 to 9 Years | 237 (6.3%) | 260 (7.1%) |
| 10 to 14 Years | 359 (9.6%) | 256 (7.0%) |
| 15 to 19 Years | 216 (5.8%) | 343 (9.4%) |
| 20 to 24 Years | 254 (6.8%) | 131 (3.6%) |
| 25 to 29 Years | 92 (2.5%) | 95 (2.6%) |
| 30 to 34 Years | 143 (3.8%) | 85 (2.3%) |
| 35 to 39 Years | 153 (4.1%) | 315 (8.6%) |
| 40 to 44 Years | 356 (9.5%) | 227 (6.2%) |
| 45 to 49 Years | 264 (7.0%) | 364 (9.9%) |
| 50 to 54 Years | 356 (9.5%) | 265 (7.2%) |
| 55 to 59 Years | 429 (11.4%) | 344 (9.4%) |
| 60 to 64 Years | 242 (6.5%) | 297 (8.1%) |
| 65 to 69 Years | 224 (6.0%) | 156 (4.3%) |
| 70 to 74 Years | 63 (1.7%) | 103 (2.8%) |
| 75 to 79 Years | 42 (1.1%) | 79 (2.2%) |
| 80 to 84 Years | 56 (1.5%) | 105 (2.9%) |
| 85 Years and over | 92 (2.5%) | 70 (1.9%) |
| Total | 3,754 (100.0%) | 3,663 (100.0%) |
Families and Households in Floris
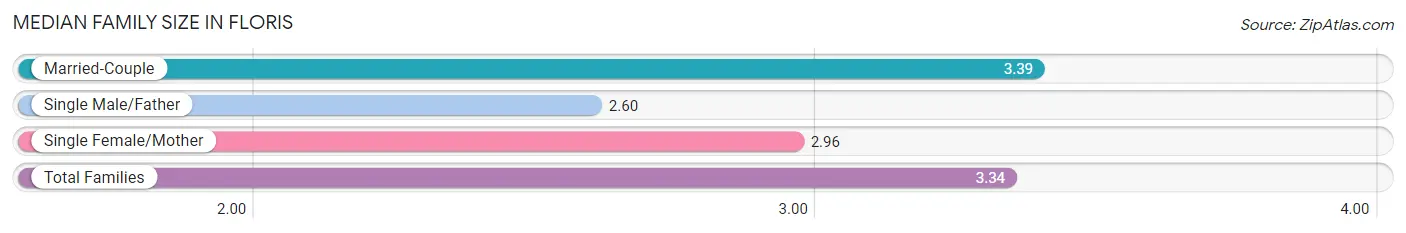
Median Family Size in Floris
The median family size in Floris is 3.34 persons per family, with married-couple families (1,835 | 89.4%) accounting for the largest median family size of 3.39 persons per family. On the other hand, single male/father families (70 | 3.4%) represent the smallest median family size with 2.60 persons per family.
| Family Type | # Families | Family Size |
| Married-Couple | 1,835 (89.4%) | 3.39 |
| Single Male/Father | 70 (3.4%) | 2.60 |
| Single Female/Mother | 147 (7.2%) | 2.96 |
| Total Families | 2,052 (100.0%) | 3.34 |
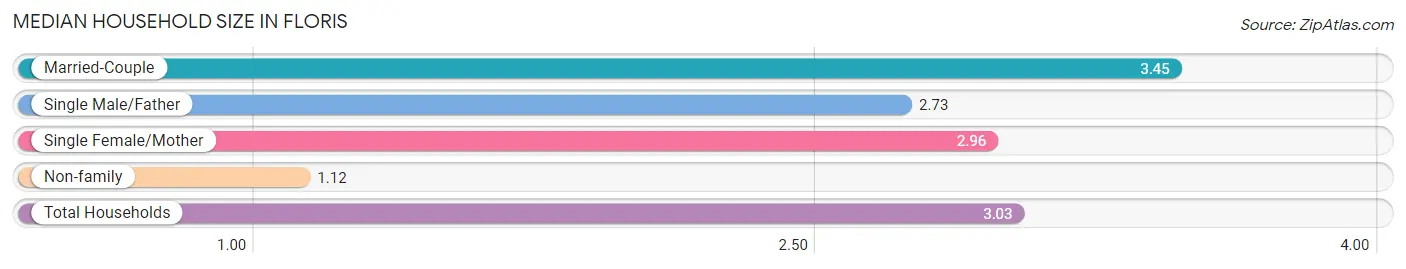
Median Household Size in Floris
The median household size in Floris is 3.03 persons per household, with married-couple households (1,835 | 75.4%) accounting for the largest median household size of 3.45 persons per household. non-family households (382 | 15.7%) represent the smallest median household size with 1.12 persons per household.
| Household Type | # Households | Household Size |
| Married-Couple | 1,835 (75.4%) | 3.45 |
| Single Male/Father | 70 (2.9%) | 2.73 |
| Single Female/Mother | 147 (6.0%) | 2.96 |
| Non-family | 382 (15.7%) | 1.12 |
| Total Households | 2,434 (100.0%) | 3.03 |
Household Size by Marriage Status in Floris
Out of a total of 2,434 households in Floris, 2,052 (84.3%) are family households, while 382 (15.7%) are nonfamily households. The most numerous type of family households are 4-person households, comprising 703, and the most common type of nonfamily households are 1-person households, comprising 335.
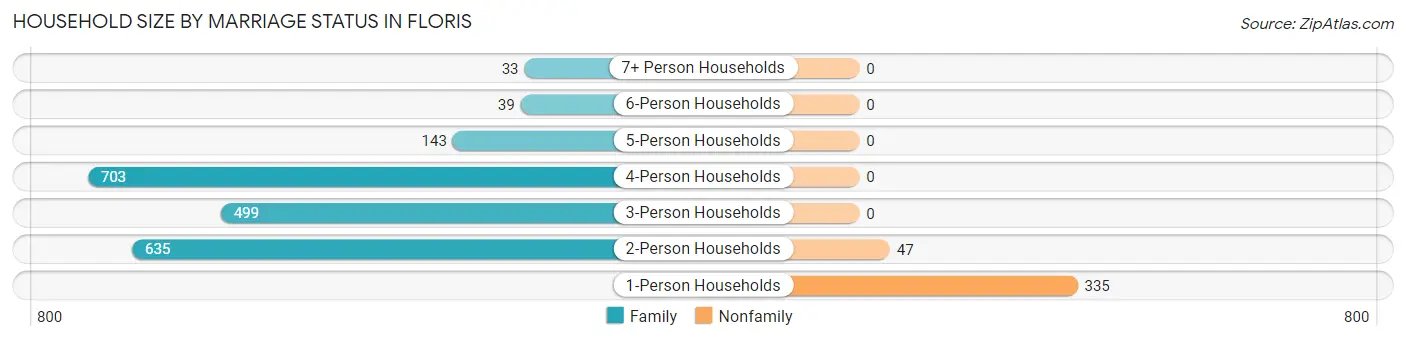
| Household Size | Family Households | Nonfamily Households |
| 1-Person Households | - | 335 (13.8%) |
| 2-Person Households | 635 (26.1%) | 47 (1.9%) |
| 3-Person Households | 499 (20.5%) | 0 (0.0%) |
| 4-Person Households | 703 (28.9%) | 0 (0.0%) |
| 5-Person Households | 143 (5.9%) | 0 (0.0%) |
| 6-Person Households | 39 (1.6%) | 0 (0.0%) |
| 7+ Person Households | 33 (1.4%) | 0 (0.0%) |
| Total | 2,052 (84.3%) | 382 (15.7%) |
Female Fertility in Floris
Fertility by Age in Floris
Average fertility rate in Floris is 16.0 births per 1,000 women. Women in the age bracket of 20 to 34 years have the highest fertility rate with 29.0 births per 1,000 women. Women in the age bracket of 35 to 50 years acount for 65.4% of all women with births.
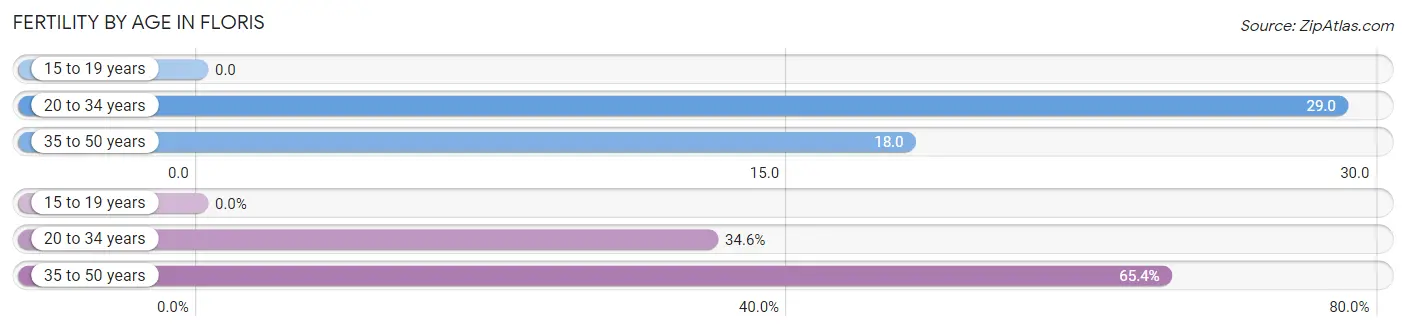
| Age Bracket | Women with Births | Births / 1,000 Women |
| 15 to 19 years | 0 (0.0%) | 0.0 |
| 20 to 34 years | 9 (34.6%) | 29.0 |
| 35 to 50 years | 17 (65.4%) | 18.0 |
| Total | 26 (100.0%) | 16.0 |
Fertility by Age by Marriage Status in Floris
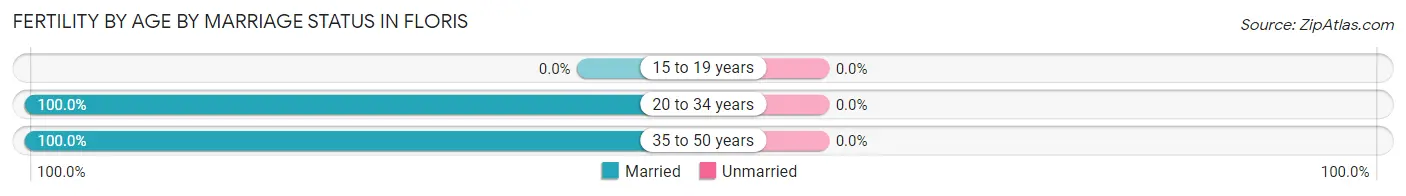
| Age Bracket | Married | Unmarried |
| 15 to 19 years | 0 (0.0%) | 0 (0.0%) |
| 20 to 34 years | 9 (100.0%) | 0 (0.0%) |
| 35 to 50 years | 17 (100.0%) | 0 (0.0%) |
| Total | 26 (100.0%) | 0 (0.0%) |
Fertility by Education in Floris
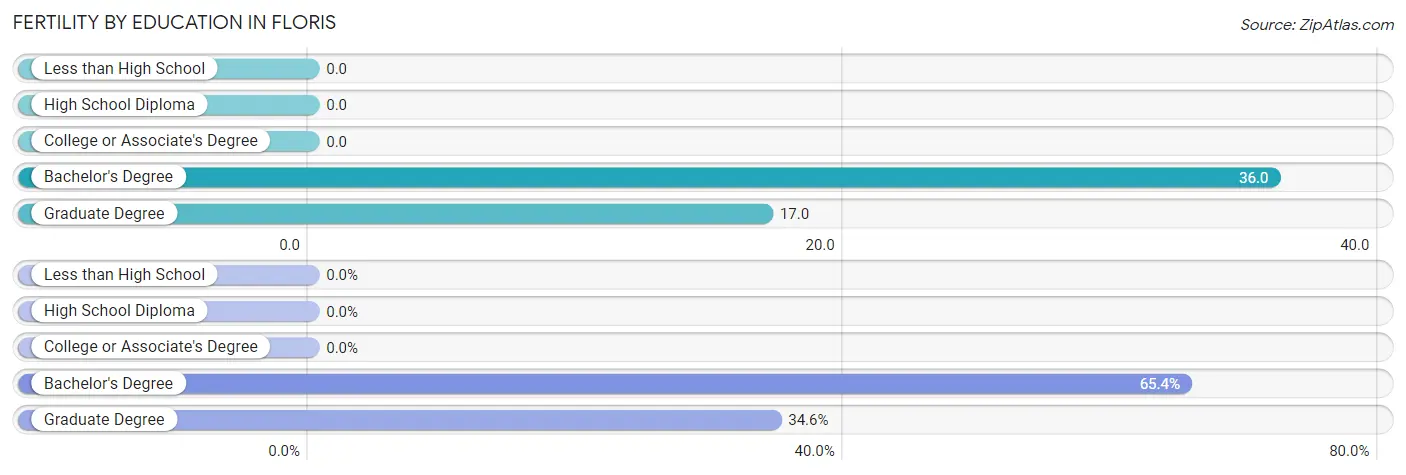
| Educational Attainment | Women with Births | Births / 1,000 Women |
| Less than High School | 0 (0.0%) | 0.0 |
| High School Diploma | 0 (0.0%) | 0.0 |
| College or Associate's Degree | 0 (0.0%) | 0.0 |
| Bachelor's Degree | 17 (65.4%) | 36.0 |
| Graduate Degree | 9 (34.6%) | 17.0 |
| Total | 26 (100.0%) | 16.0 |
Fertility by Education by Marriage Status in Floris
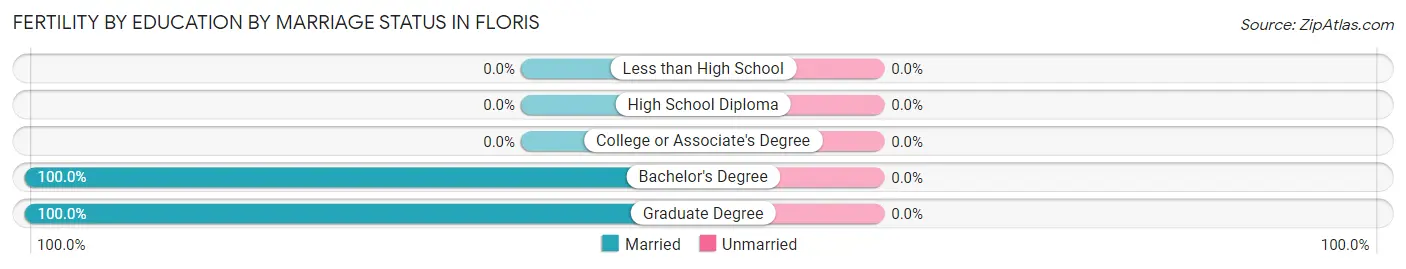
| Educational Attainment | Married | Unmarried |
| Less than High School | 0 (0.0%) | 0 (0.0%) |
| High School Diploma | 0 (0.0%) | 0 (0.0%) |
| College or Associate's Degree | 0 (0.0%) | 0 (0.0%) |
| Bachelor's Degree | 17 (100.0%) | 0 (0.0%) |
| Graduate Degree | 9 (100.0%) | 0 (0.0%) |
| Total | 26 (100.0%) | 0 (0.0%) |
Employment Characteristics in Floris
Employment by Class of Employer in Floris
Among the 4,036 employed individuals in Floris, private company employees (2,415 | 59.8%), federal government employees (594 | 14.7%), and not-for-profit organizations (362 | 9.0%) make up the most common classes of employment.
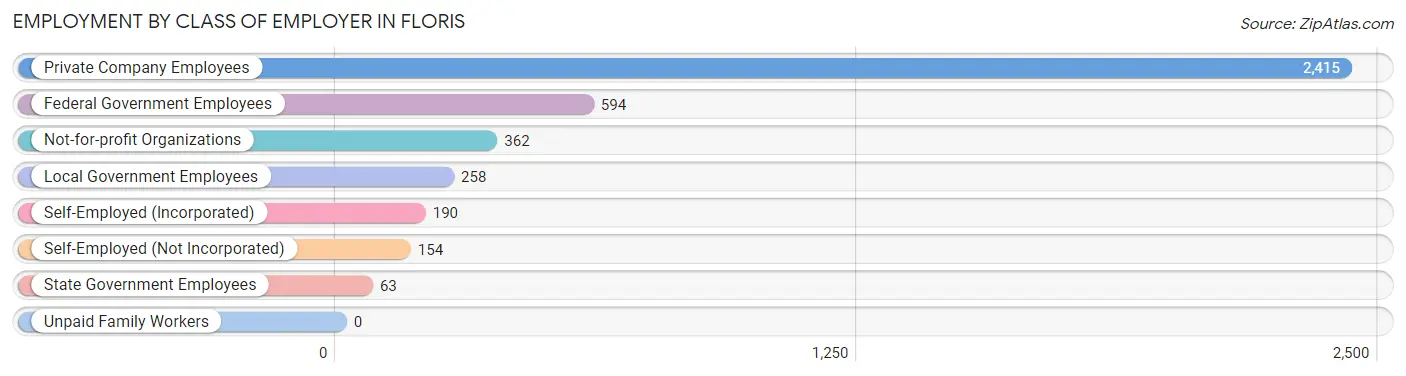
| Employer Class | # Employees | % Employees |
| Private Company Employees | 2,415 | 59.8% |
| Self-Employed (Incorporated) | 190 | 4.7% |
| Self-Employed (Not Incorporated) | 154 | 3.8% |
| Not-for-profit Organizations | 362 | 9.0% |
| Local Government Employees | 258 | 6.4% |
| State Government Employees | 63 | 1.6% |
| Federal Government Employees | 594 | 14.7% |
| Unpaid Family Workers | 0 | 0.0% |
| Total | 4,036 | 100.0% |
Employment Status by Age in Floris
According to the labor force statistics for Floris, out of the total population over 16 years of age (5,820), 74.0% or 4,307 individuals are in the labor force, with 5.4% or 233 of them unemployed. The age group with the highest labor force participation rate is 25 to 29 years, with 100.0% or 187 individuals in the labor force. Within the labor force, the 20 to 24 years age range has the highest percentage of unemployed individuals, with 22.6% or 70 of them being unemployed.
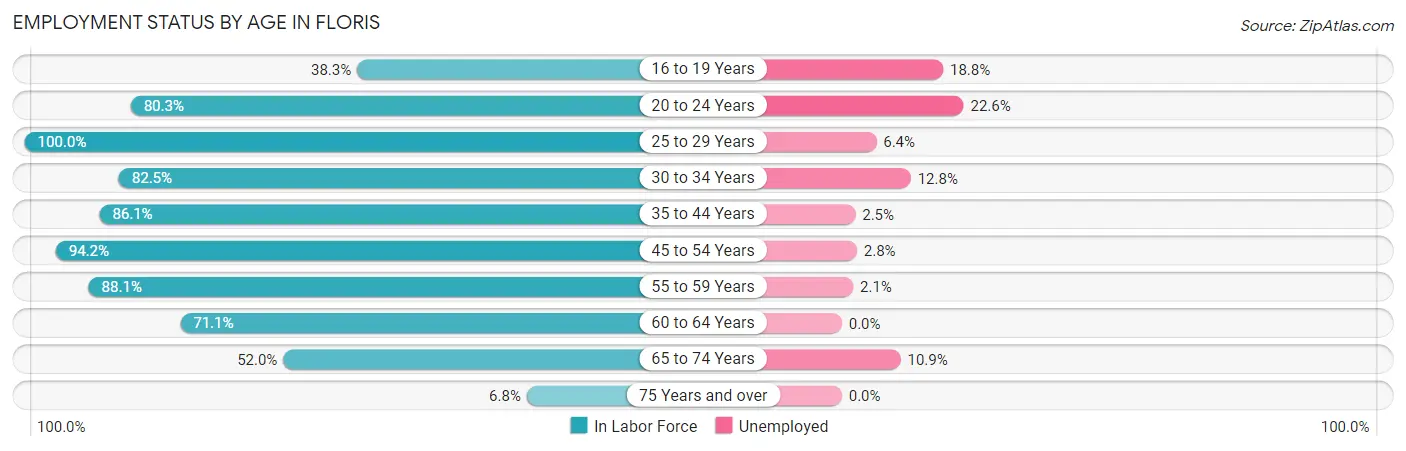
| Age Bracket | In Labor Force | Unemployed |
| 16 to 19 Years | 160 (38.3%) | 30 (18.8%) |
| 20 to 24 Years | 309 (80.3%) | 70 (22.6%) |
| 25 to 29 Years | 187 (100.0%) | 12 (6.4%) |
| 30 to 34 Years | 188 (82.5%) | 24 (12.8%) |
| 35 to 44 Years | 905 (86.1%) | 23 (2.5%) |
| 45 to 54 Years | 1,177 (94.2%) | 33 (2.8%) |
| 55 to 59 Years | 681 (88.1%) | 14 (2.1%) |
| 60 to 64 Years | 383 (71.1%) | 0 (0.0%) |
| 65 to 74 Years | 284 (52.0%) | 31 (10.9%) |
| 75 Years and over | 30 (6.8%) | 0 (0.0%) |
| Total | 4,307 (74.0%) | 233 (5.4%) |
Employment Status by Educational Attainment in Floris
According to labor force statistics for Floris, 87.4% of individuals (3,520) out of the total population between 25 and 64 years of age (4,027) are in the labor force, with 3.0% or 106 of them being unemployed. The group with the highest labor force participation rate are those with the educational attainment of less than high school, with 100.0% or 7 individuals in the labor force. Within the labor force, individuals with college / associate degree education have the highest percentage of unemployment, with 9.9% or 33 of them being unemployed.
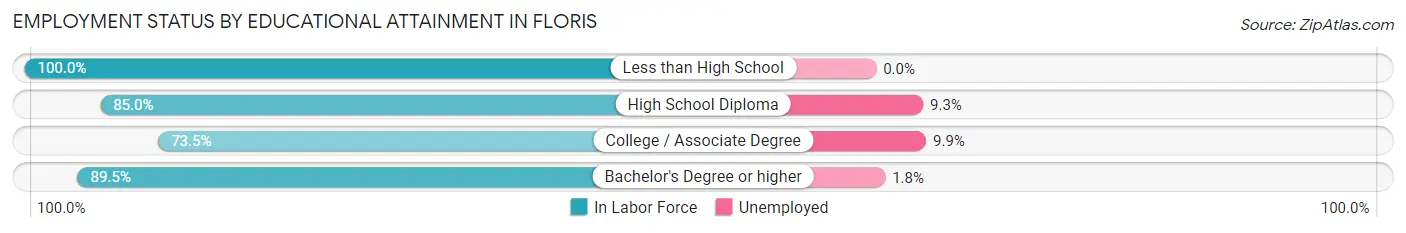
| Educational Attainment | In Labor Force | Unemployed |
| Less than High School | 7 (100.0%) | 0 (0.0%) |
| High School Diploma | 221 (85.0%) | 24 (9.3%) |
| College / Associate Degree | 338 (73.5%) | 46 (9.9%) |
| Bachelor's Degree or higher | 2,954 (89.5%) | 59 (1.8%) |
| Total | 3,520 (87.4%) | 121 (3.0%) |
Employment Occupations by Sex in Floris
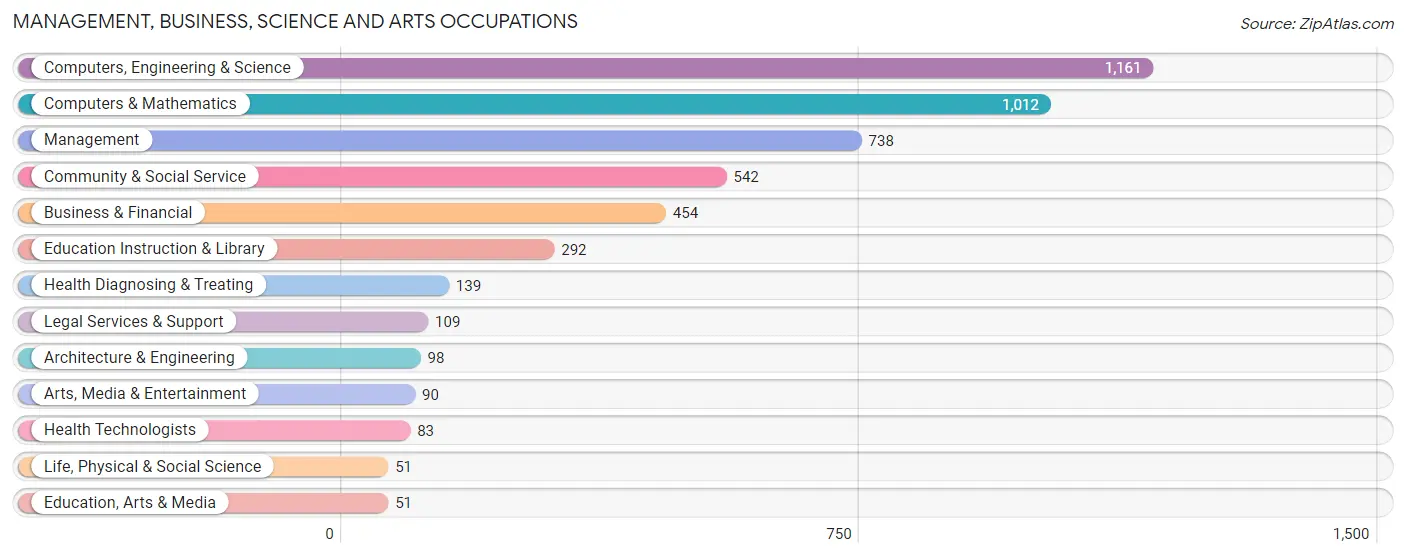
Management, Business, Science and Arts Occupations
The most common Management, Business, Science and Arts occupations in Floris are Computers, Engineering & Science (1,161 | 29.3%), Computers & Mathematics (1,012 | 25.6%), Management (738 | 18.6%), Community & Social Service (542 | 13.7%), and Business & Financial (454 | 11.5%).
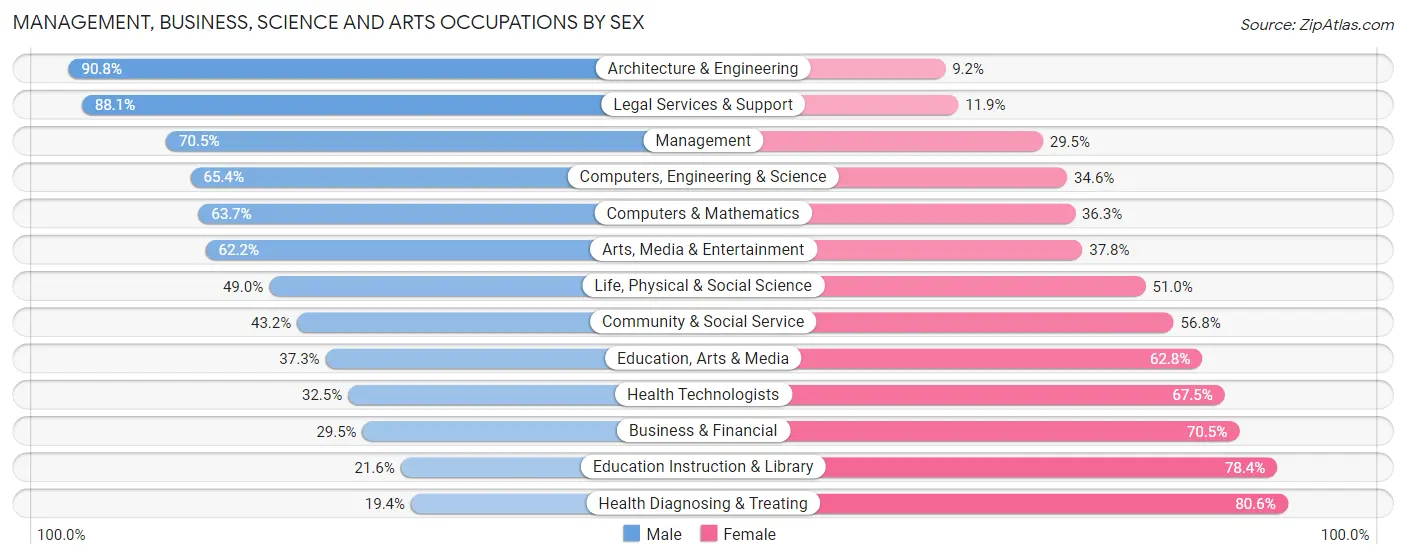
Management, Business, Science and Arts Occupations by Sex
Within the Management, Business, Science and Arts occupations in Floris, the most male-oriented occupations are Architecture & Engineering (90.8%), Legal Services & Support (88.1%), and Management (70.5%), while the most female-oriented occupations are Health Diagnosing & Treating (80.6%), Education Instruction & Library (78.4%), and Business & Financial (70.5%).
| Occupation | Male | Female |
| Management | 520 (70.5%) | 218 (29.5%) |
| Business & Financial | 134 (29.5%) | 320 (70.5%) |
| Computers, Engineering & Science | 759 (65.4%) | 402 (34.6%) |
| Computers & Mathematics | 645 (63.7%) | 367 (36.3%) |
| Architecture & Engineering | 89 (90.8%) | 9 (9.2%) |
| Life, Physical & Social Science | 25 (49.0%) | 26 (51.0%) |
| Community & Social Service | 234 (43.2%) | 308 (56.8%) |
| Education, Arts & Media | 19 (37.2%) | 32 (62.7%) |
| Legal Services & Support | 96 (88.1%) | 13 (11.9%) |
| Education Instruction & Library | 63 (21.6%) | 229 (78.4%) |
| Arts, Media & Entertainment | 56 (62.2%) | 34 (37.8%) |
| Health Diagnosing & Treating | 27 (19.4%) | 112 (80.6%) |
| Health Technologists | 27 (32.5%) | 56 (67.5%) |
| Total (Category) | 1,674 (55.2%) | 1,360 (44.8%) |
| Total (Overall) | 2,107 (53.2%) | 1,854 (46.8%) |
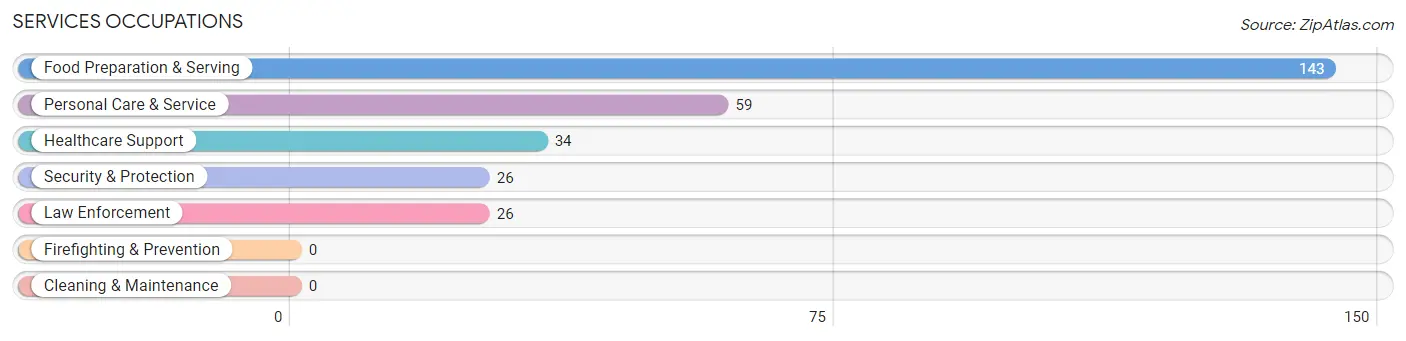
Services Occupations
The most common Services occupations in Floris are Food Preparation & Serving (143 | 3.6%), Personal Care & Service (59 | 1.5%), Healthcare Support (34 | 0.9%), Security & Protection (26 | 0.7%), and Law Enforcement (26 | 0.7%).
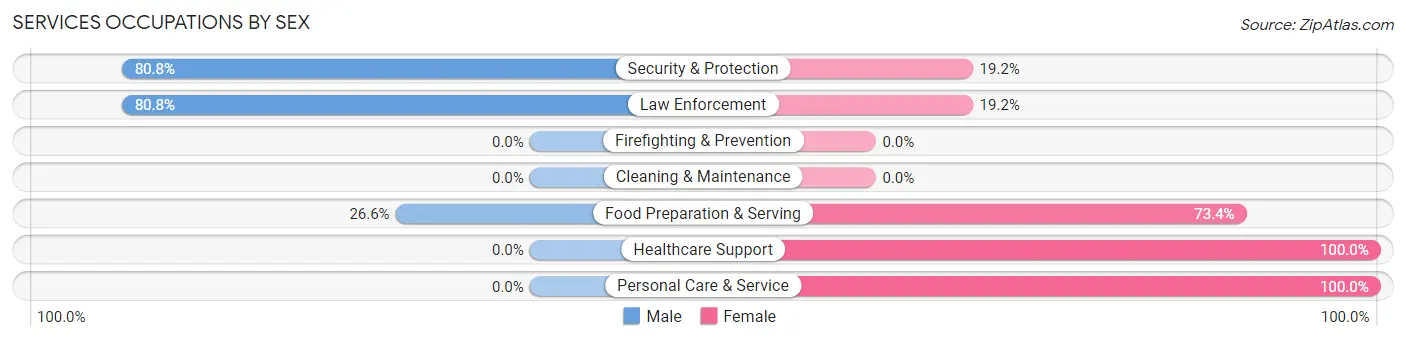
Services Occupations by Sex
Within the Services occupations in Floris, the most male-oriented occupations are Security & Protection (80.8%), Law Enforcement (80.8%), and Food Preparation & Serving (26.6%), while the most female-oriented occupations are Healthcare Support (100.0%), Personal Care & Service (100.0%), and Food Preparation & Serving (73.4%).
| Occupation | Male | Female |
| Healthcare Support | 0 (0.0%) | 34 (100.0%) |
| Security & Protection | 21 (80.8%) | 5 (19.2%) |
| Firefighting & Prevention | 0 (0.0%) | 0 (0.0%) |
| Law Enforcement | 21 (80.8%) | 5 (19.2%) |
| Food Preparation & Serving | 38 (26.6%) | 105 (73.4%) |
| Cleaning & Maintenance | 0 (0.0%) | 0 (0.0%) |
| Personal Care & Service | 0 (0.0%) | 59 (100.0%) |
| Total (Category) | 59 (22.5%) | 203 (77.5%) |
| Total (Overall) | 2,107 (53.2%) | 1,854 (46.8%) |
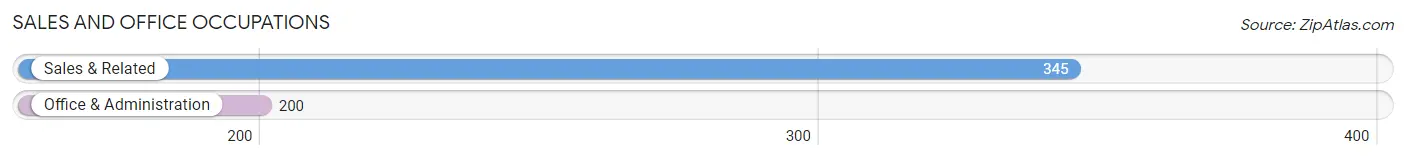
Sales and Office Occupations
The most common Sales and Office occupations in Floris are Sales & Related (345 | 8.7%), and Office & Administration (200 | 5.1%).
Sales and Office Occupations by Sex
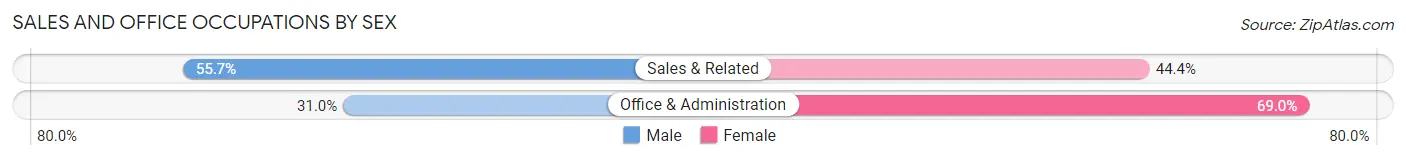
| Occupation | Male | Female |
| Sales & Related | 192 (55.6%) | 153 (44.4%) |
| Office & Administration | 62 (31.0%) | 138 (69.0%) |
| Total (Category) | 254 (46.6%) | 291 (53.4%) |
| Total (Overall) | 2,107 (53.2%) | 1,854 (46.8%) |
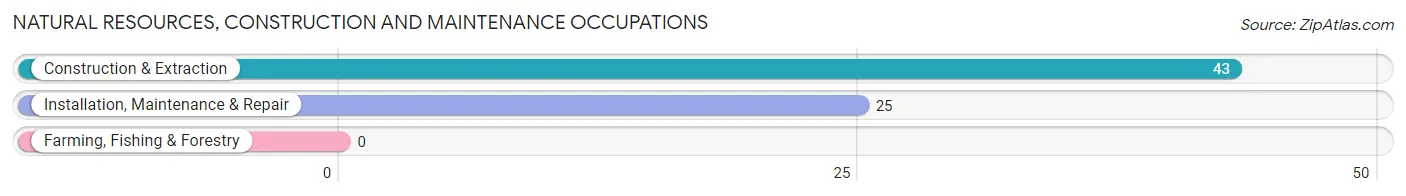
Natural Resources, Construction and Maintenance Occupations
The most common Natural Resources, Construction and Maintenance occupations in Floris are Construction & Extraction (43 | 1.1%), and Installation, Maintenance & Repair (25 | 0.6%).
Natural Resources, Construction and Maintenance Occupations by Sex
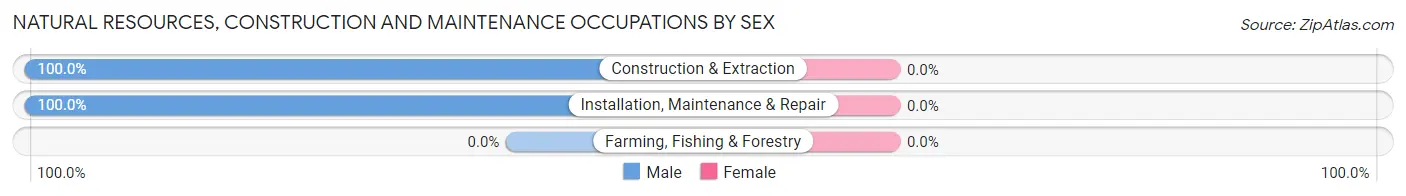
| Occupation | Male | Female |
| Farming, Fishing & Forestry | 0 (0.0%) | 0 (0.0%) |
| Construction & Extraction | 43 (100.0%) | 0 (0.0%) |
| Installation, Maintenance & Repair | 25 (100.0%) | 0 (0.0%) |
| Total (Category) | 68 (100.0%) | 0 (0.0%) |
| Total (Overall) | 2,107 (53.2%) | 1,854 (46.8%) |
Production, Transportation and Moving Occupations
The most common Production, Transportation and Moving occupations in Floris are Transportation (28 | 0.7%), and Production (24 | 0.6%).
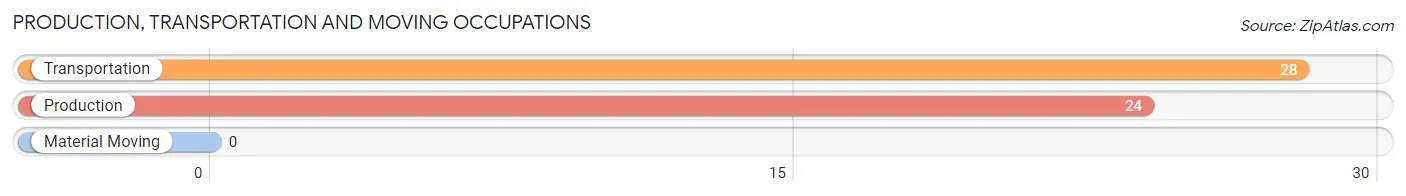
Production, Transportation and Moving Occupations by Sex
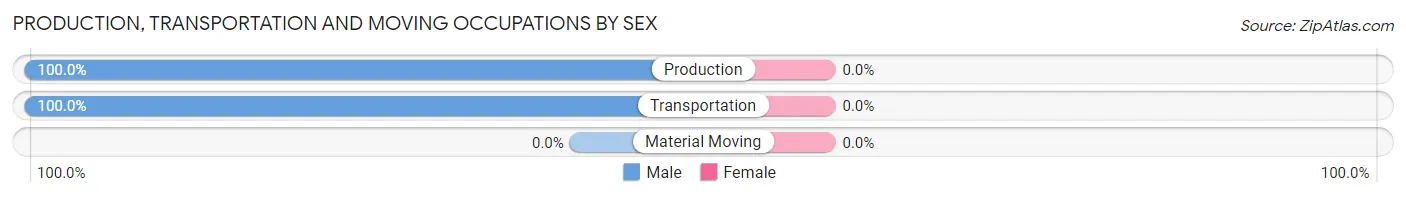
| Occupation | Male | Female |
| Production | 24 (100.0%) | 0 (0.0%) |
| Transportation | 28 (100.0%) | 0 (0.0%) |
| Material Moving | 0 (0.0%) | 0 (0.0%) |
| Total (Category) | 52 (100.0%) | 0 (0.0%) |
| Total (Overall) | 2,107 (53.2%) | 1,854 (46.8%) |
Employment Industries by Sex in Floris
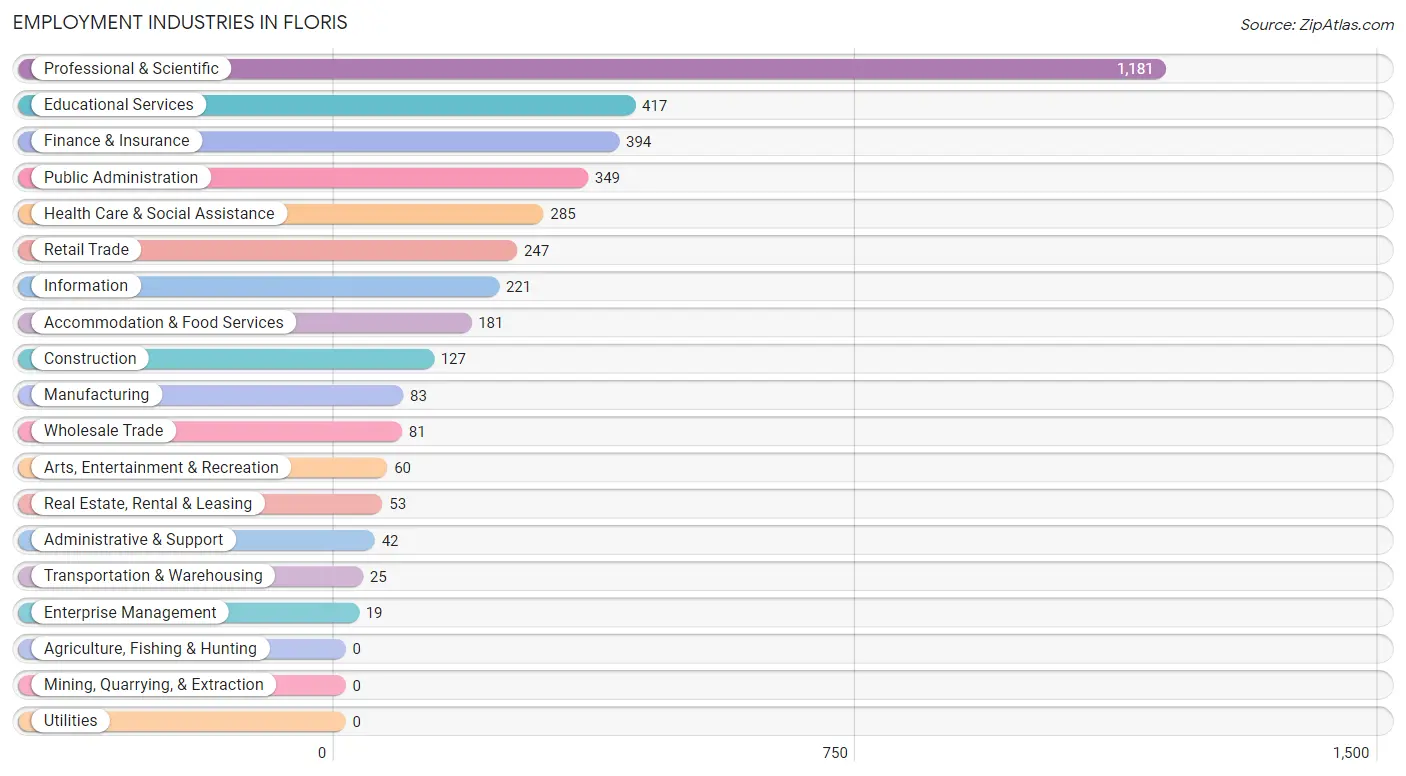
Employment Industries in Floris
The major employment industries in Floris include Professional & Scientific (1,181 | 29.8%), Educational Services (417 | 10.5%), Finance & Insurance (394 | 10.0%), Public Administration (349 | 8.8%), and Health Care & Social Assistance (285 | 7.2%).
Employment Industries by Sex in Floris
The Floris industries that see more men than women are Transportation & Warehousing (100.0%), Wholesale Trade (91.4%), and Construction (83.5%), whereas the industries that tend to have a higher number of women are Arts, Entertainment & Recreation (100.0%), Health Care & Social Assistance (90.5%), and Administrative & Support (80.9%).
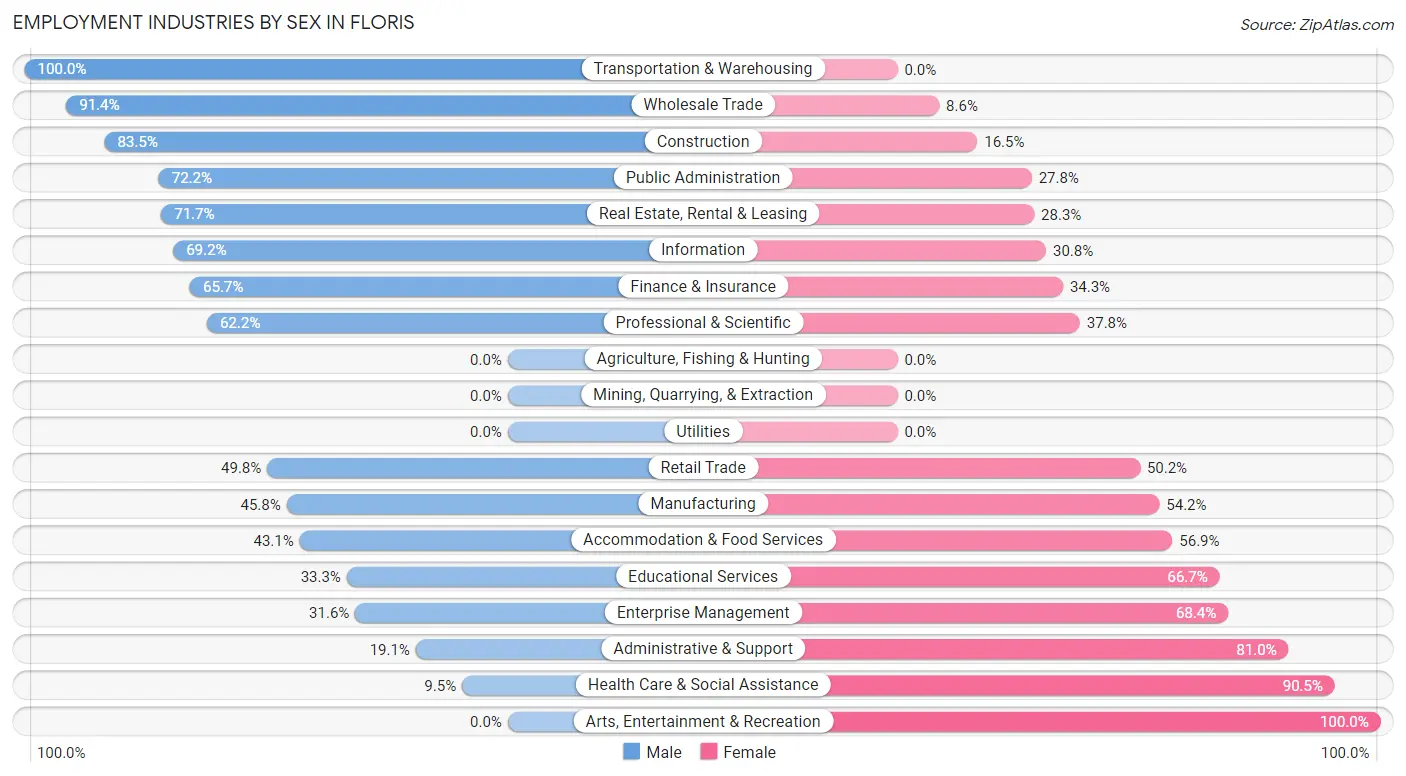
| Industry | Male | Female |
| Agriculture, Fishing & Hunting | 0 (0.0%) | 0 (0.0%) |
| Mining, Quarrying, & Extraction | 0 (0.0%) | 0 (0.0%) |
| Construction | 106 (83.5%) | 21 (16.5%) |
| Manufacturing | 38 (45.8%) | 45 (54.2%) |
| Wholesale Trade | 74 (91.4%) | 7 (8.6%) |
| Retail Trade | 123 (49.8%) | 124 (50.2%) |
| Transportation & Warehousing | 25 (100.0%) | 0 (0.0%) |
| Utilities | 0 (0.0%) | 0 (0.0%) |
| Information | 153 (69.2%) | 68 (30.8%) |
| Finance & Insurance | 259 (65.7%) | 135 (34.3%) |
| Real Estate, Rental & Leasing | 38 (71.7%) | 15 (28.3%) |
| Professional & Scientific | 735 (62.2%) | 446 (37.8%) |
| Enterprise Management | 6 (31.6%) | 13 (68.4%) |
| Administrative & Support | 8 (19.1%) | 34 (80.9%) |
| Educational Services | 139 (33.3%) | 278 (66.7%) |
| Health Care & Social Assistance | 27 (9.5%) | 258 (90.5%) |
| Arts, Entertainment & Recreation | 0 (0.0%) | 60 (100.0%) |
| Accommodation & Food Services | 78 (43.1%) | 103 (56.9%) |
| Public Administration | 252 (72.2%) | 97 (27.8%) |
| Total | 2,107 (53.2%) | 1,854 (46.8%) |
Education in Floris
School Enrollment in Floris
The most common levels of schooling among the 2,173 students in Floris are high school (541 | 24.9%), middle school (536 | 24.7%), and elementary school (410 | 18.9%).
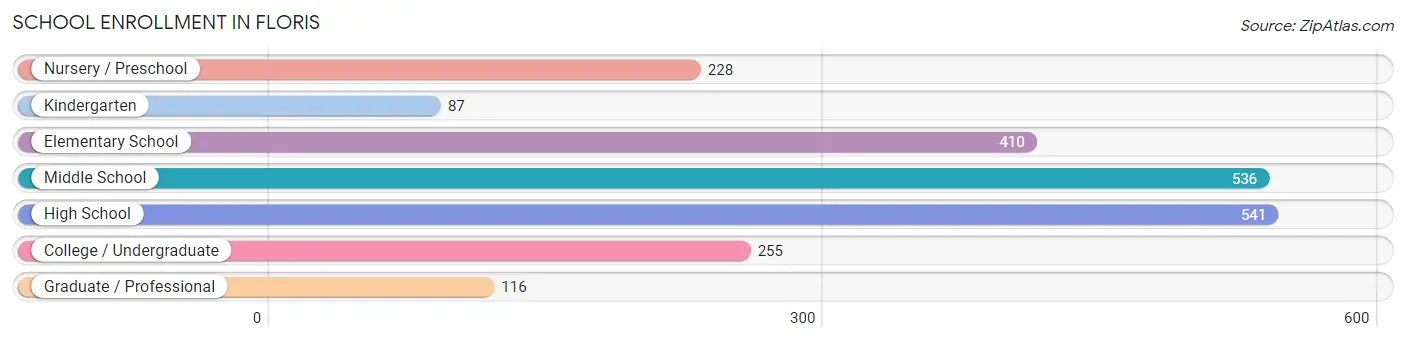
| School Level | # Students | % Students |
| Nursery / Preschool | 228 | 10.5% |
| Kindergarten | 87 | 4.0% |
| Elementary School | 410 | 18.9% |
| Middle School | 536 | 24.7% |
| High School | 541 | 24.9% |
| College / Undergraduate | 255 | 11.7% |
| Graduate / Professional | 116 | 5.3% |
| Total | 2,173 | 100.0% |
School Enrollment by Age by Funding Source in Floris
Out of a total of 2,173 students who are enrolled in schools in Floris, 448 (20.6%) attend a private institution, while the remaining 1,725 (79.4%) are enrolled in public schools. The age group of 3 to 4 year olds has the highest likelihood of being enrolled in private schools, with 222 (92.1% in the age bracket) enrolled. Conversely, the age group of 20 to 24 year olds has the lowest likelihood of being enrolled in a private school, with 138 (100.0% in the age bracket) attending a public institution.
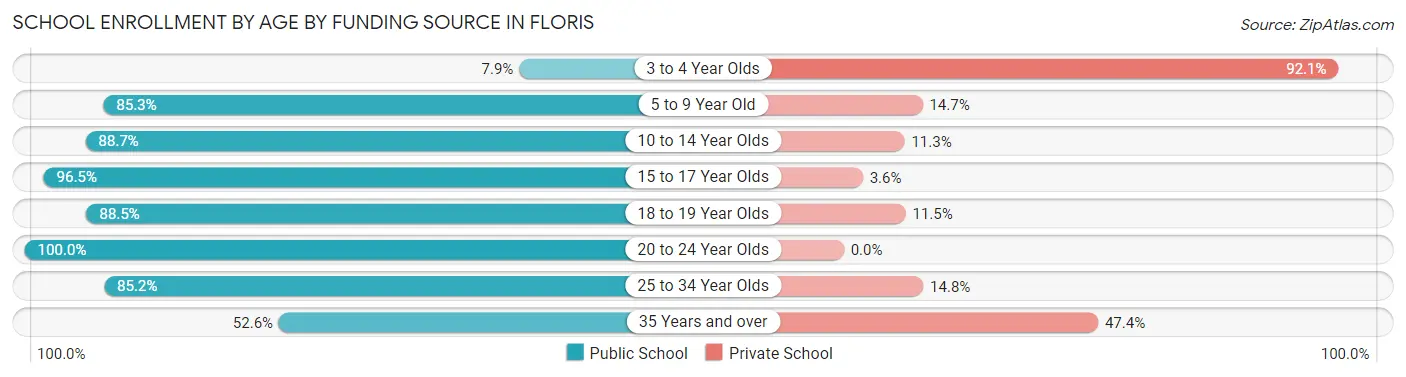
| Age Bracket | Public School | Private School |
| 3 to 4 Year Olds | 19 (7.9%) | 222 (92.1%) |
| 5 to 9 Year Old | 407 (85.3%) | 70 (14.7%) |
| 10 to 14 Year Olds | 540 (88.7%) | 69 (11.3%) |
| 15 to 17 Year Olds | 380 (96.5%) | 14 (3.5%) |
| 18 to 19 Year Olds | 146 (88.5%) | 19 (11.5%) |
| 20 to 24 Year Olds | 138 (100.0%) | 0 (0.0%) |
| 25 to 34 Year Olds | 46 (85.2%) | 8 (14.8%) |
| 35 Years and over | 50 (52.6%) | 45 (47.4%) |
| Total | 1,725 (79.4%) | 448 (20.6%) |
Educational Attainment by Field of Study in Floris
Engineering (981 | 23.4%), business (668 | 15.9%), computers & mathematics (583 | 13.9%), social sciences (403 | 9.6%), and education (229 | 5.4%) are the most common fields of study among 4,198 individuals in Floris who have obtained a bachelor's degree or higher.
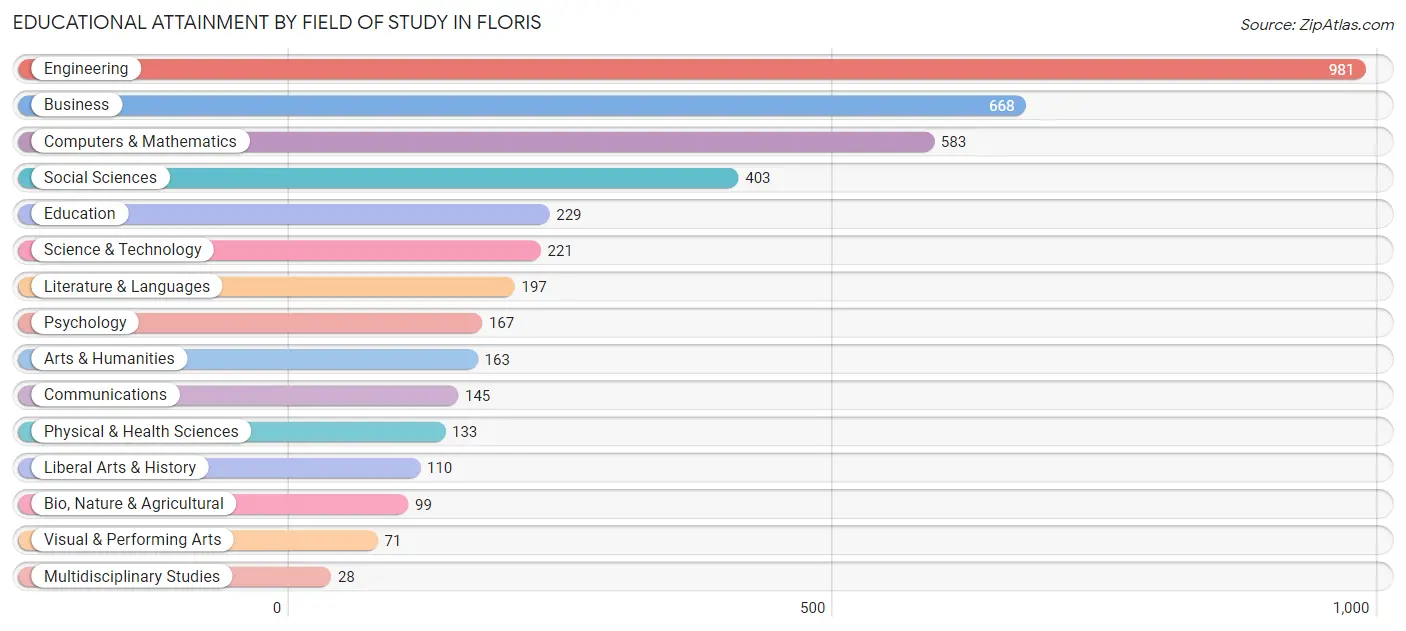
| Field of Study | # Graduates | % Graduates |
| Computers & Mathematics | 583 | 13.9% |
| Bio, Nature & Agricultural | 99 | 2.4% |
| Physical & Health Sciences | 133 | 3.2% |
| Psychology | 167 | 4.0% |
| Social Sciences | 403 | 9.6% |
| Engineering | 981 | 23.4% |
| Multidisciplinary Studies | 28 | 0.7% |
| Science & Technology | 221 | 5.3% |
| Business | 668 | 15.9% |
| Education | 229 | 5.4% |
| Literature & Languages | 197 | 4.7% |
| Liberal Arts & History | 110 | 2.6% |
| Visual & Performing Arts | 71 | 1.7% |
| Communications | 145 | 3.5% |
| Arts & Humanities | 163 | 3.9% |
| Total | 4,198 | 100.0% |
Transportation & Commute in Floris
Vehicle Availability by Sex in Floris
The most prevalent vehicle ownership categories in Floris are males with 2 vehicles (1,126, accounting for 50.8%) and females with 2 vehicles (1,031, making up 61.9%).
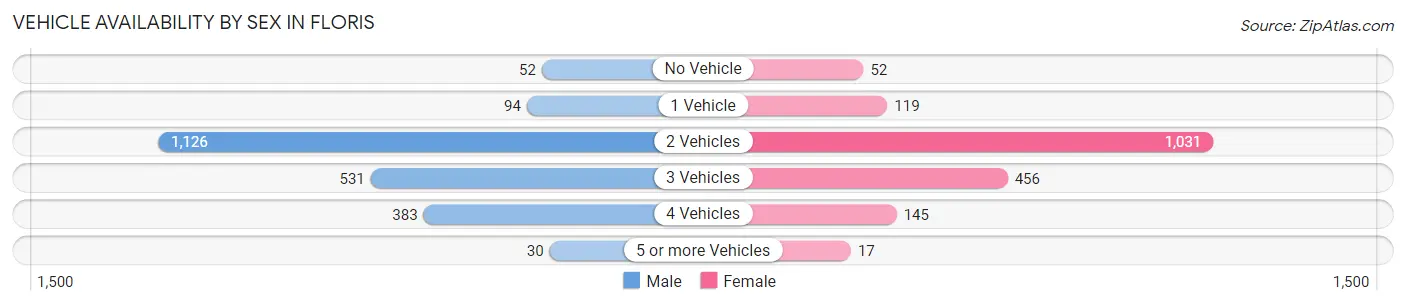
| Vehicles Available | Male | Female |
| No Vehicle | 52 (2.4%) | 52 (2.9%) |
| 1 Vehicle | 94 (4.2%) | 119 (6.5%) |
| 2 Vehicles | 1,126 (50.8%) | 1,031 (56.7%) |
| 3 Vehicles | 531 (24.0%) | 456 (25.1%) |
| 4 Vehicles | 383 (17.3%) | 145 (8.0%) |
| 5 or more Vehicles | 30 (1.3%) | 17 (0.9%) |
| Total | 2,216 (100.0%) | 1,820 (100.0%) |
Commute Time in Floris
The most frequently occuring commute durations in Floris are 20 to 24 minutes (428 commuters, 15.2%), 45 to 59 minutes (382 commuters, 13.6%), and 15 to 19 minutes (343 commuters, 12.2%).
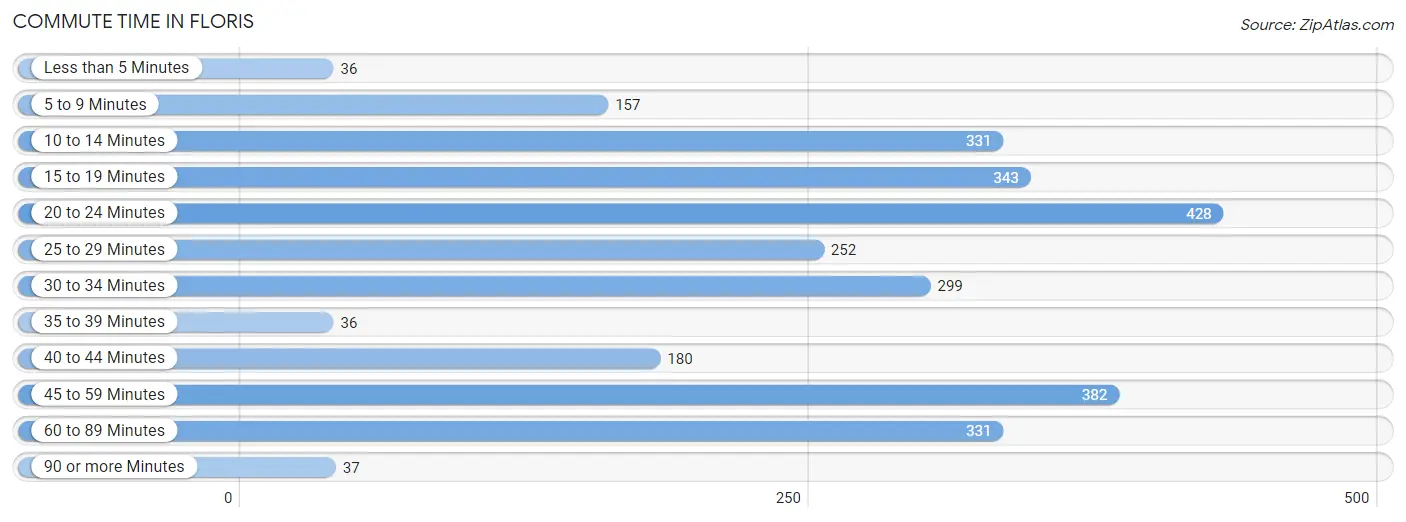
| Commute Time | # Commuters | % Commuters |
| Less than 5 Minutes | 36 | 1.3% |
| 5 to 9 Minutes | 157 | 5.6% |
| 10 to 14 Minutes | 331 | 11.8% |
| 15 to 19 Minutes | 343 | 12.2% |
| 20 to 24 Minutes | 428 | 15.2% |
| 25 to 29 Minutes | 252 | 9.0% |
| 30 to 34 Minutes | 299 | 10.6% |
| 35 to 39 Minutes | 36 | 1.3% |
| 40 to 44 Minutes | 180 | 6.4% |
| 45 to 59 Minutes | 382 | 13.6% |
| 60 to 89 Minutes | 331 | 11.8% |
| 90 or more Minutes | 37 | 1.3% |
Commute Time by Sex in Floris
The most common commute times in Floris are 20 to 24 minutes (288 commuters, 18.4%) for males and 10 to 14 minutes (244 commuters, 19.6%) for females.
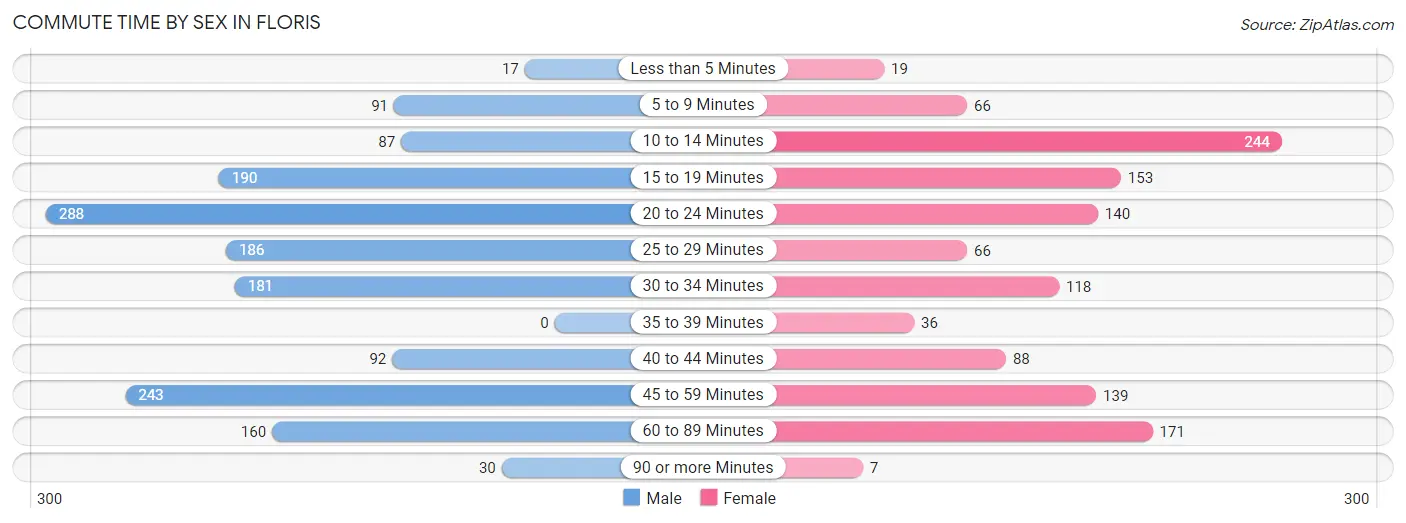
| Commute Time | Male | Female |
| Less than 5 Minutes | 17 (1.1%) | 19 (1.5%) |
| 5 to 9 Minutes | 91 (5.8%) | 66 (5.3%) |
| 10 to 14 Minutes | 87 (5.6%) | 244 (19.6%) |
| 15 to 19 Minutes | 190 (12.1%) | 153 (12.3%) |
| 20 to 24 Minutes | 288 (18.4%) | 140 (11.2%) |
| 25 to 29 Minutes | 186 (11.9%) | 66 (5.3%) |
| 30 to 34 Minutes | 181 (11.6%) | 118 (9.5%) |
| 35 to 39 Minutes | 0 (0.0%) | 36 (2.9%) |
| 40 to 44 Minutes | 92 (5.9%) | 88 (7.1%) |
| 45 to 59 Minutes | 243 (15.5%) | 139 (11.2%) |
| 60 to 89 Minutes | 160 (10.2%) | 171 (13.7%) |
| 90 or more Minutes | 30 (1.9%) | 7 (0.6%) |
Time of Departure to Work by Sex in Floris
The most frequent times of departure to work in Floris are 7:00 AM to 7:29 AM (223, 14.2%) for males and 9:00 AM to 9:59 AM (246, 19.7%) for females.
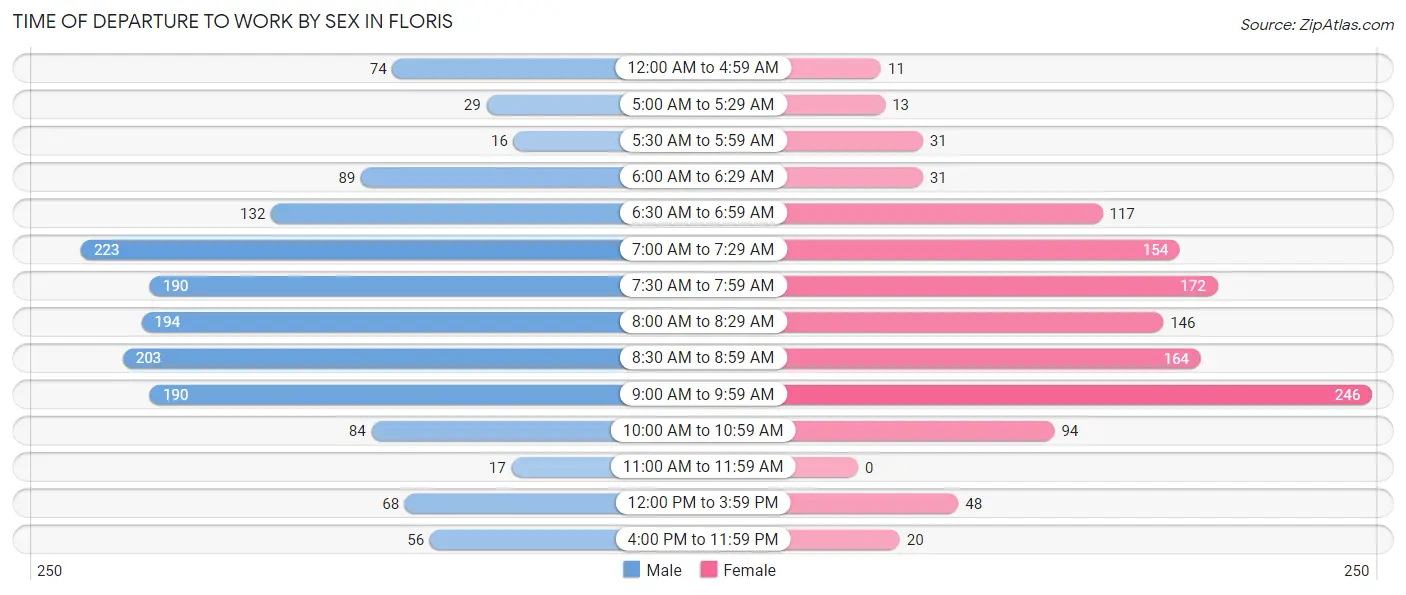
| Time of Departure | Male | Female |
| 12:00 AM to 4:59 AM | 74 (4.7%) | 11 (0.9%) |
| 5:00 AM to 5:29 AM | 29 (1.8%) | 13 (1.0%) |
| 5:30 AM to 5:59 AM | 16 (1.0%) | 31 (2.5%) |
| 6:00 AM to 6:29 AM | 89 (5.7%) | 31 (2.5%) |
| 6:30 AM to 6:59 AM | 132 (8.4%) | 117 (9.4%) |
| 7:00 AM to 7:29 AM | 223 (14.2%) | 154 (12.3%) |
| 7:30 AM to 7:59 AM | 190 (12.1%) | 172 (13.8%) |
| 8:00 AM to 8:29 AM | 194 (12.4%) | 146 (11.7%) |
| 8:30 AM to 8:59 AM | 203 (13.0%) | 164 (13.2%) |
| 9:00 AM to 9:59 AM | 190 (12.1%) | 246 (19.7%) |
| 10:00 AM to 10:59 AM | 84 (5.4%) | 94 (7.5%) |
| 11:00 AM to 11:59 AM | 17 (1.1%) | 0 (0.0%) |
| 12:00 PM to 3:59 PM | 68 (4.3%) | 48 (3.8%) |
| 4:00 PM to 11:59 PM | 56 (3.6%) | 20 (1.6%) |
| Total | 1,565 (100.0%) | 1,247 (100.0%) |
Housing Occupancy in Floris
Occupancy by Ownership in Floris
Of the total 2,434 dwellings in Floris, owner-occupied units account for 2,154 (88.5%), while renter-occupied units make up 280 (11.5%).
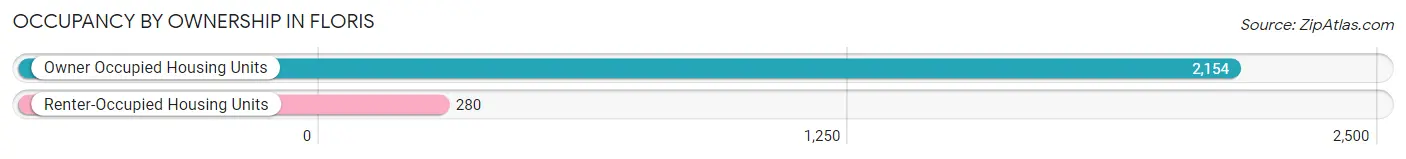
| Occupancy | # Housing Units | % Housing Units |
| Owner Occupied Housing Units | 2,154 | 88.5% |
| Renter-Occupied Housing Units | 280 | 11.5% |
| Total Occupied Housing Units | 2,434 | 100.0% |
Occupancy by Household Size in Floris
| Household Size | # Housing Units | % Housing Units |
| 1-Person Household | 335 | 13.8% |
| 2-Person Household | 682 | 28.0% |
| 3-Person Household | 499 | 20.5% |
| 4+ Person Household | 918 | 37.7% |
| Total Housing Units | 2,434 | 100.0% |
Occupancy by Ownership by Household Size in Floris
| Household Size | Owner-occupied | Renter-occupied |
| 1-Person Household | 211 (63.0%) | 124 (37.0%) |
| 2-Person Household | 664 (97.4%) | 18 (2.6%) |
| 3-Person Household | 438 (87.8%) | 61 (12.2%) |
| 4+ Person Household | 841 (91.6%) | 77 (8.4%) |
| Total Housing Units | 2,154 (88.5%) | 280 (11.5%) |
Occupancy by Educational Attainment in Floris
| Household Size | Owner-occupied | Renter-occupied |
| Less than High School | 43 (100.0%) | 0 (0.0%) |
| High School Diploma | 75 (100.0%) | 0 (0.0%) |
| College/Associate Degree | 170 (59.4%) | 116 (40.6%) |
| Bachelor's Degree or higher | 1,866 (91.9%) | 164 (8.1%) |
Occupancy by Age of Householder in Floris
| Age Bracket | # Households | % Households |
| Under 35 Years | 136 | 5.6% |
| 35 to 44 Years | 448 | 18.4% |
| 45 to 54 Years | 602 | 24.7% |
| 55 to 64 Years | 649 | 26.7% |
| 65 to 74 Years | 369 | 15.2% |
| 75 to 84 Years | 106 | 4.3% |
| 85 Years and Over | 124 | 5.1% |
| Total | 2,434 | 100.0% |
Housing Finances in Floris
Median Income by Occupancy in Floris
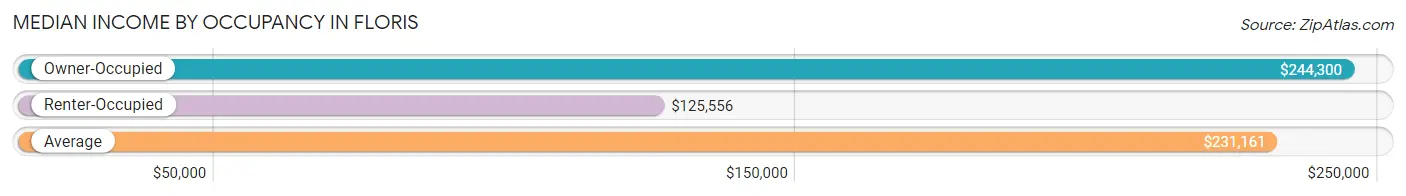
| Occupancy Type | # Households | Median Income |
| Owner-Occupied | 2,154 (88.5%) | $244,300 |
| Renter-Occupied | 280 (11.5%) | $125,556 |
| Average | 2,434 (100.0%) | $231,161 |
Occupancy by Householder Income Bracket in Floris
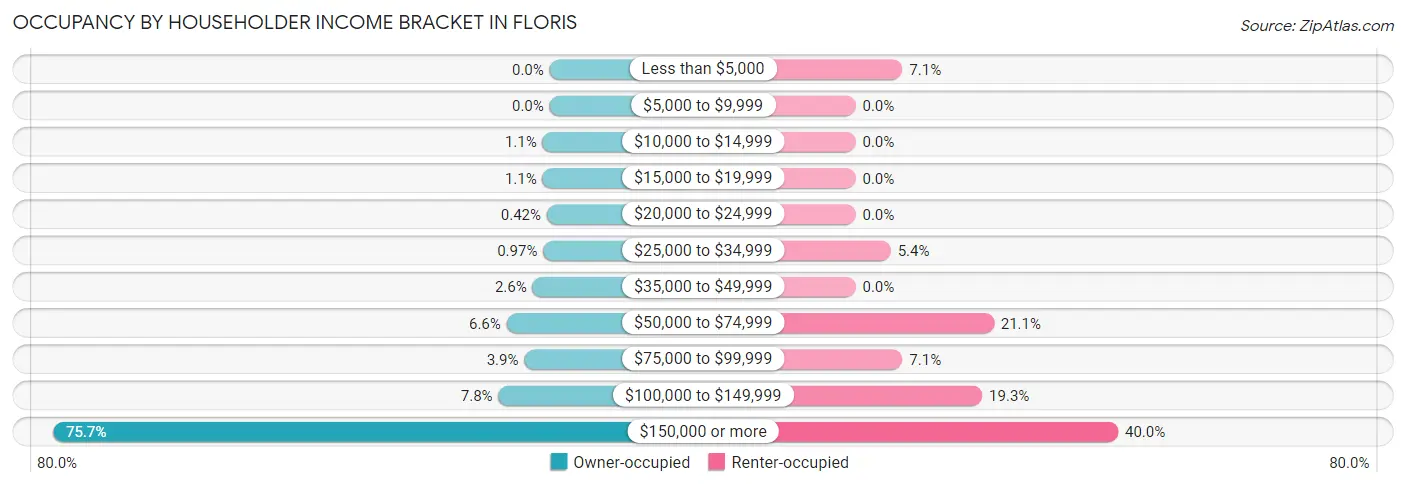
| Income Bracket | Owner-occupied | Renter-occupied |
| Less than $5,000 | 0 (0.0%) | 20 (7.1%) |
| $5,000 to $9,999 | 0 (0.0%) | 0 (0.0%) |
| $10,000 to $14,999 | 23 (1.1%) | 0 (0.0%) |
| $15,000 to $19,999 | 23 (1.1%) | 0 (0.0%) |
| $20,000 to $24,999 | 9 (0.4%) | 0 (0.0%) |
| $25,000 to $34,999 | 21 (1.0%) | 15 (5.4%) |
| $35,000 to $49,999 | 56 (2.6%) | 0 (0.0%) |
| $50,000 to $74,999 | 141 (6.6%) | 59 (21.1%) |
| $75,000 to $99,999 | 83 (3.8%) | 20 (7.1%) |
| $100,000 to $149,999 | 168 (7.8%) | 54 (19.3%) |
| $150,000 or more | 1,630 (75.7%) | 112 (40.0%) |
| Total | 2,154 (100.0%) | 280 (100.0%) |
Monthly Housing Cost Tiers in Floris
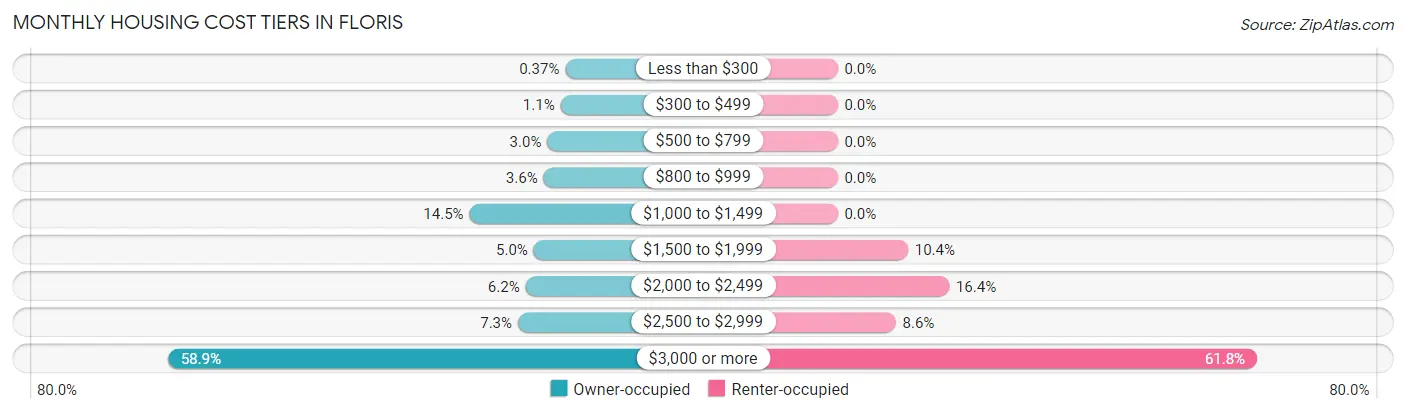
| Monthly Cost | Owner-occupied | Renter-occupied |
| Less than $300 | 8 (0.4%) | 0 (0.0%) |
| $300 to $499 | 23 (1.1%) | 0 (0.0%) |
| $500 to $799 | 65 (3.0%) | 0 (0.0%) |
| $800 to $999 | 77 (3.6%) | 0 (0.0%) |
| $1,000 to $1,499 | 312 (14.5%) | 0 (0.0%) |
| $1,500 to $1,999 | 108 (5.0%) | 29 (10.4%) |
| $2,000 to $2,499 | 134 (6.2%) | 46 (16.4%) |
| $2,500 to $2,999 | 158 (7.3%) | 24 (8.6%) |
| $3,000 or more | 1,269 (58.9%) | 173 (61.8%) |
| Total | 2,154 (100.0%) | 280 (100.0%) |
Physical Housing Characteristics in Floris
Housing Structures in Floris
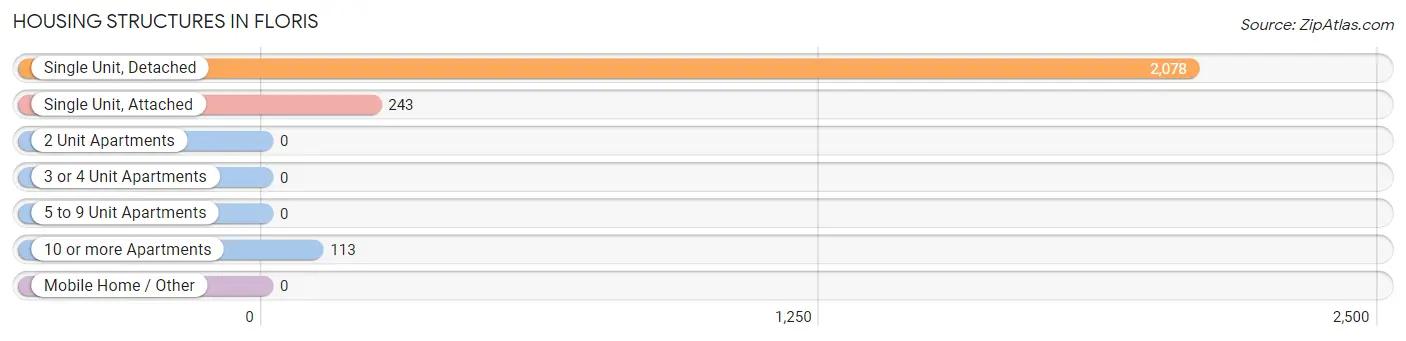
| Structure Type | # Housing Units | % Housing Units |
| Single Unit, Detached | 2,078 | 85.4% |
| Single Unit, Attached | 243 | 10.0% |
| 2 Unit Apartments | 0 | 0.0% |
| 3 or 4 Unit Apartments | 0 | 0.0% |
| 5 to 9 Unit Apartments | 0 | 0.0% |
| 10 or more Apartments | 113 | 4.6% |
| Mobile Home / Other | 0 | 0.0% |
| Total | 2,434 | 100.0% |
Housing Structures by Occupancy in Floris
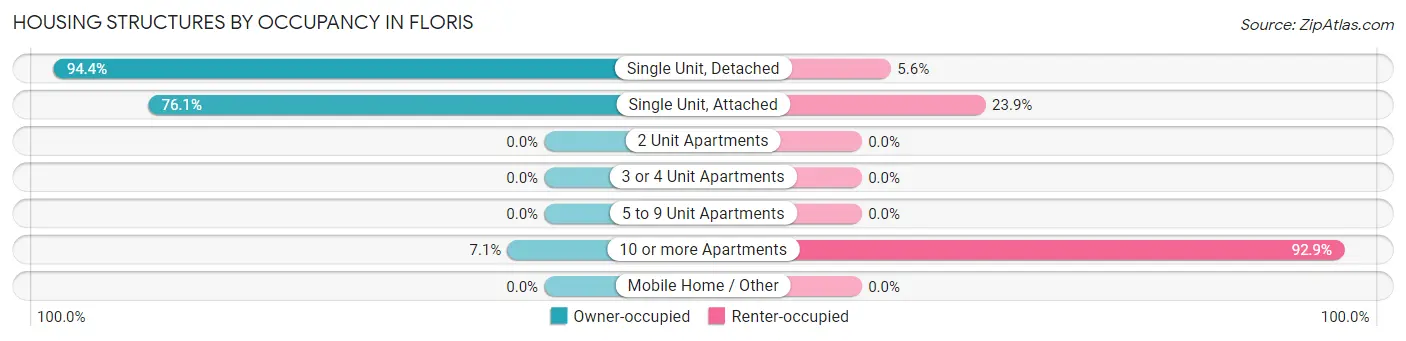
| Structure Type | Owner-occupied | Renter-occupied |
| Single Unit, Detached | 1,961 (94.4%) | 117 (5.6%) |
| Single Unit, Attached | 185 (76.1%) | 58 (23.9%) |
| 2 Unit Apartments | 0 (0.0%) | 0 (0.0%) |
| 3 or 4 Unit Apartments | 0 (0.0%) | 0 (0.0%) |
| 5 to 9 Unit Apartments | 0 (0.0%) | 0 (0.0%) |
| 10 or more Apartments | 8 (7.1%) | 105 (92.9%) |
| Mobile Home / Other | 0 (0.0%) | 0 (0.0%) |
| Total | 2,154 (88.5%) | 280 (11.5%) |
Housing Structures by Number of Rooms in Floris
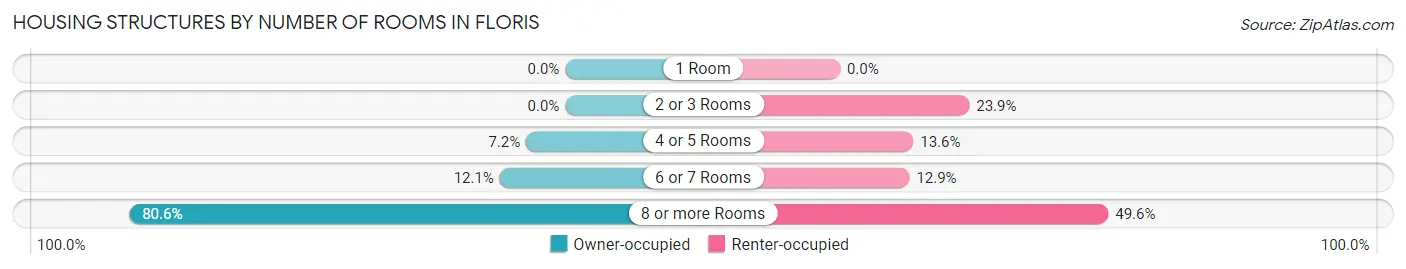
| Number of Rooms | Owner-occupied | Renter-occupied |
| 1 Room | 0 (0.0%) | 0 (0.0%) |
| 2 or 3 Rooms | 0 (0.0%) | 67 (23.9%) |
| 4 or 5 Rooms | 156 (7.2%) | 38 (13.6%) |
| 6 or 7 Rooms | 261 (12.1%) | 36 (12.9%) |
| 8 or more Rooms | 1,737 (80.6%) | 139 (49.6%) |
| Total | 2,154 (100.0%) | 280 (100.0%) |
Housing Structure by Heating Type in Floris
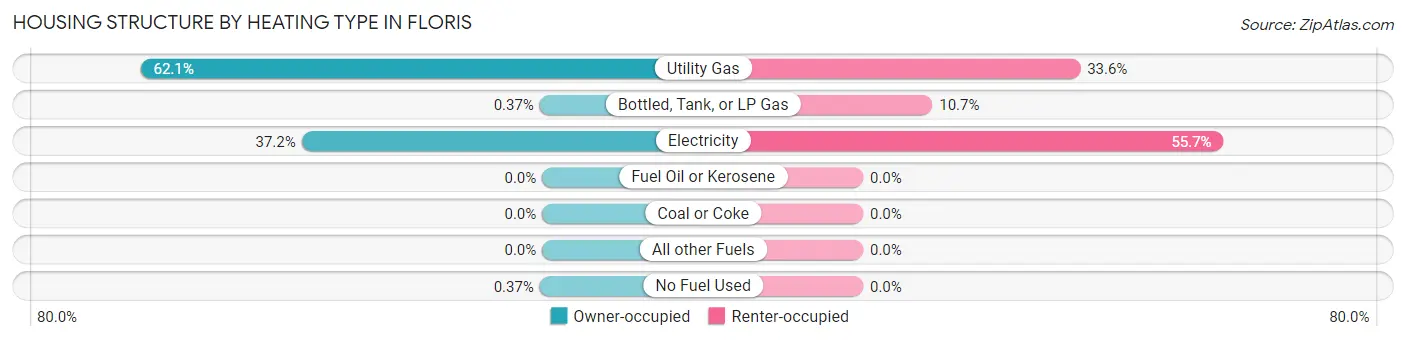
| Heating Type | Owner-occupied | Renter-occupied |
| Utility Gas | 1,337 (62.1%) | 94 (33.6%) |
| Bottled, Tank, or LP Gas | 8 (0.4%) | 30 (10.7%) |
| Electricity | 801 (37.2%) | 156 (55.7%) |
| Fuel Oil or Kerosene | 0 (0.0%) | 0 (0.0%) |
| Coal or Coke | 0 (0.0%) | 0 (0.0%) |
| All other Fuels | 0 (0.0%) | 0 (0.0%) |
| No Fuel Used | 8 (0.4%) | 0 (0.0%) |
| Total | 2,154 (100.0%) | 280 (100.0%) |
Household Vehicle Usage in Floris
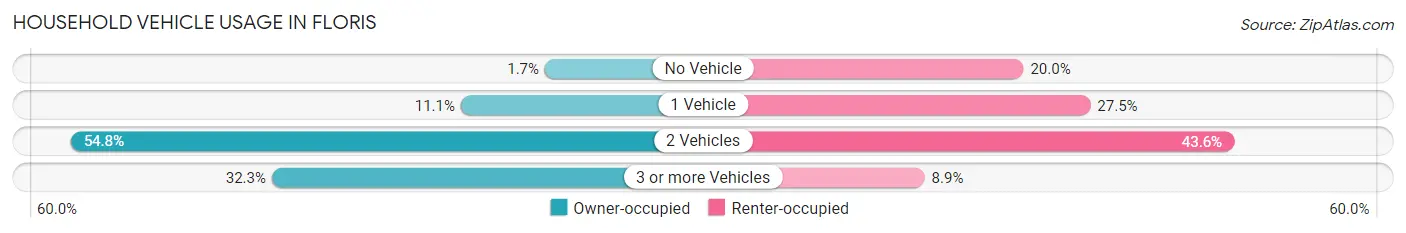
| Vehicles per Household | Owner-occupied | Renter-occupied |
| No Vehicle | 37 (1.7%) | 56 (20.0%) |
| 1 Vehicle | 240 (11.1%) | 77 (27.5%) |
| 2 Vehicles | 1,181 (54.8%) | 122 (43.6%) |
| 3 or more Vehicles | 696 (32.3%) | 25 (8.9%) |
| Total | 2,154 (100.0%) | 280 (100.0%) |
Real Estate & Mortgages in Floris
Real Estate and Mortgage Overview in Floris
| Characteristic | Without Mortgage | With Mortgage |
| Housing Units | 493 | 1,661 |
| Median Property Value | $814,700 | $811,000 |
| Median Household Income | $175,179 | $1,361 |
| Monthly Housing Costs | $1,128 | $1,269 |
| Real Estate Taxes | $8,608 | $0 |
Property Value by Mortgage Status in Floris
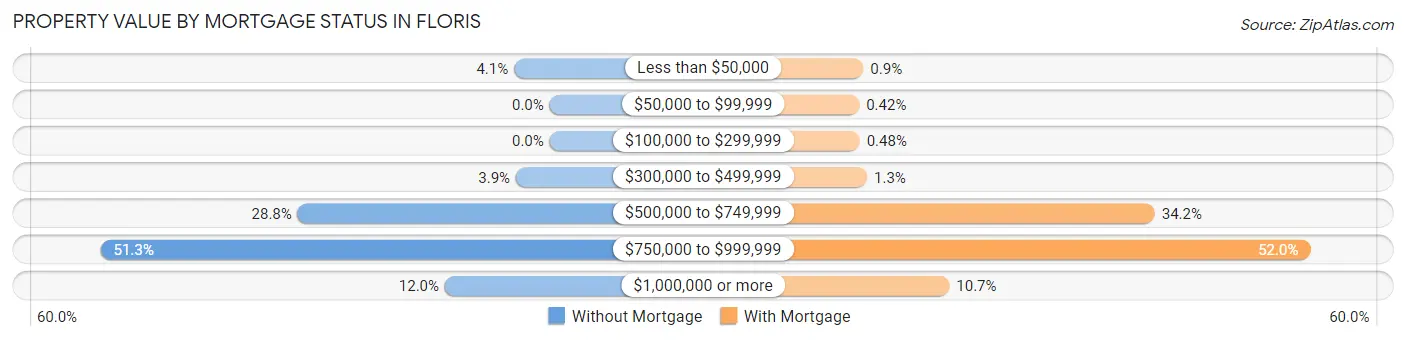
| Property Value | Without Mortgage | With Mortgage |
| Less than $50,000 | 20 (4.1%) | 15 (0.9%) |
| $50,000 to $99,999 | 0 (0.0%) | 7 (0.4%) |
| $100,000 to $299,999 | 0 (0.0%) | 8 (0.5%) |
| $300,000 to $499,999 | 19 (3.8%) | 22 (1.3%) |
| $500,000 to $749,999 | 142 (28.8%) | 568 (34.2%) |
| $750,000 to $999,999 | 253 (51.3%) | 863 (52.0%) |
| $1,000,000 or more | 59 (12.0%) | 178 (10.7%) |
| Total | 493 (100.0%) | 1,661 (100.0%) |
Household Income by Mortgage Status in Floris
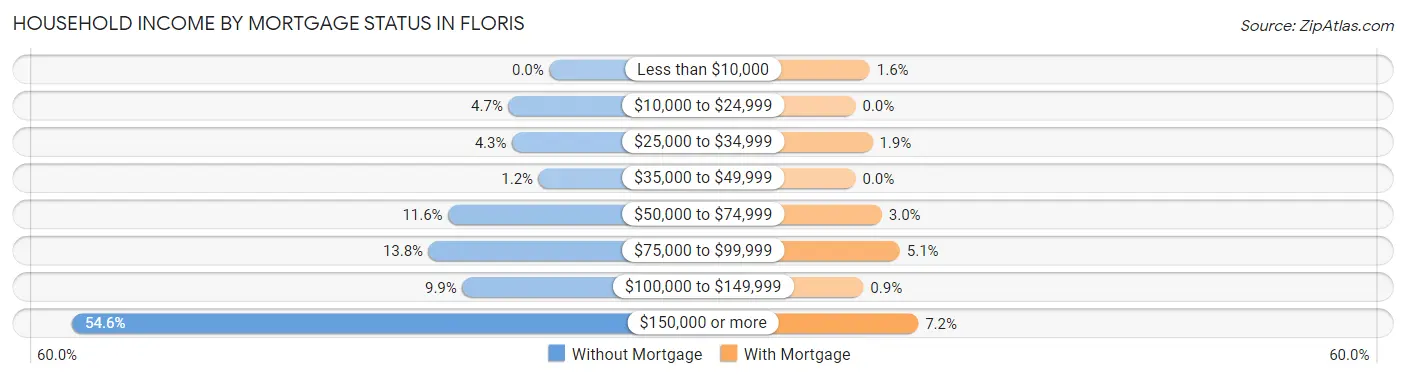
| Household Income | Without Mortgage | With Mortgage |
| Less than $10,000 | 0 (0.0%) | 27 (1.6%) |
| $10,000 to $24,999 | 23 (4.7%) | 0 (0.0%) |
| $25,000 to $34,999 | 21 (4.3%) | 32 (1.9%) |
| $35,000 to $49,999 | 6 (1.2%) | 0 (0.0%) |
| $50,000 to $74,999 | 57 (11.6%) | 50 (3.0%) |
| $75,000 to $99,999 | 68 (13.8%) | 84 (5.1%) |
| $100,000 to $149,999 | 49 (9.9%) | 15 (0.9%) |
| $150,000 or more | 269 (54.6%) | 119 (7.2%) |
| Total | 493 (100.0%) | 1,661 (100.0%) |
Property Value to Household Income Ratio in Floris
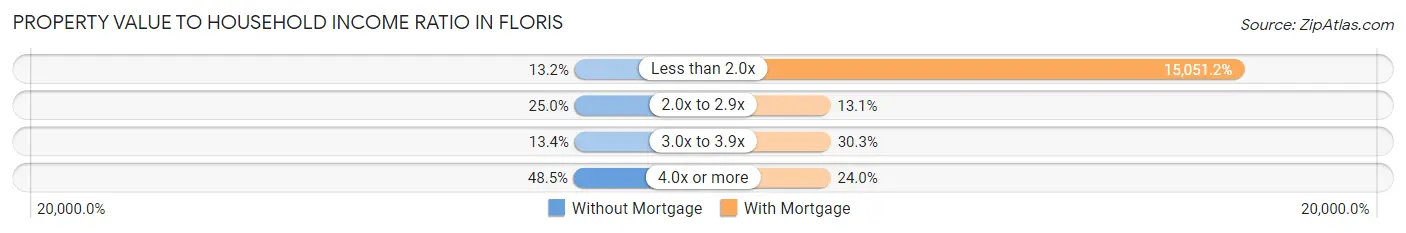
| Value-to-Income Ratio | Without Mortgage | With Mortgage |
| Less than 2.0x | 65 (13.2%) | 250,001 (15,051.2%) |
| 2.0x to 2.9x | 123 (24.9%) | 217 (13.1%) |
| 3.0x to 3.9x | 66 (13.4%) | 504 (30.3%) |
| 4.0x or more | 239 (48.5%) | 399 (24.0%) |
| Total | 493 (100.0%) | 1,661 (100.0%) |
Real Estate Taxes by Mortgage Status in Floris
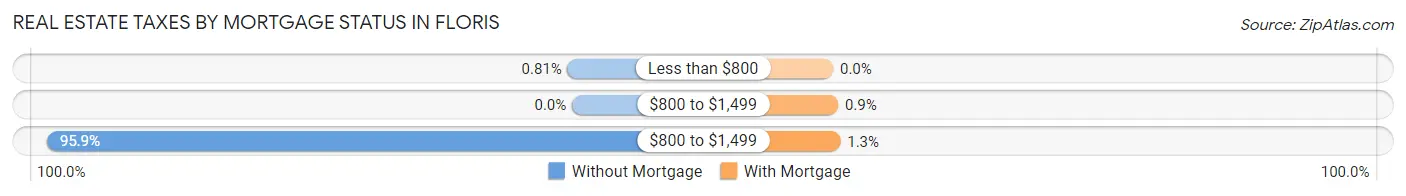
| Property Taxes | Without Mortgage | With Mortgage |
| Less than $800 | 4 (0.8%) | 0 (0.0%) |
| $800 to $1,499 | 0 (0.0%) | 15 (0.9%) |
| $800 to $1,499 | 473 (95.9%) | 22 (1.3%) |
| Total | 493 (100.0%) | 1,661 (100.0%) |
Health & Disability in Floris
Health Insurance Coverage by Age in Floris
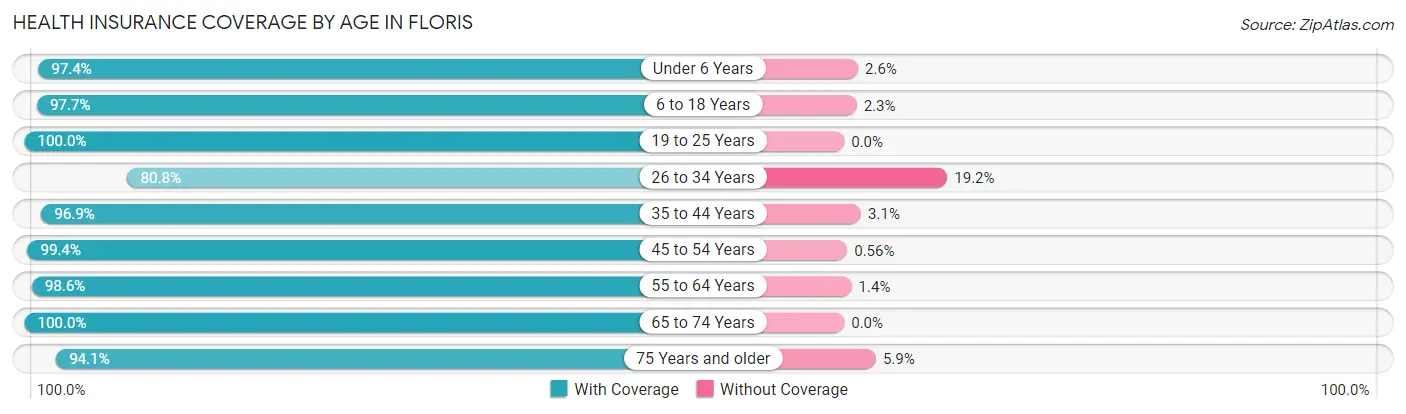
| Age Bracket | With Coverage | Without Coverage |
| Under 6 Years | 377 (97.4%) | 10 (2.6%) |
| 6 to 18 Years | 1,519 (97.7%) | 36 (2.3%) |
| 19 to 25 Years | 449 (100.0%) | 0 (0.0%) |
| 26 to 34 Years | 290 (80.8%) | 69 (19.2%) |
| 35 to 44 Years | 956 (96.9%) | 31 (3.1%) |
| 45 to 54 Years | 1,242 (99.4%) | 7 (0.6%) |
| 55 to 64 Years | 1,294 (98.6%) | 18 (1.4%) |
| 65 to 74 Years | 546 (100.0%) | 0 (0.0%) |
| 75 Years and older | 398 (94.1%) | 25 (5.9%) |
| Total | 7,071 (97.3%) | 196 (2.7%) |
Health Insurance Coverage by Citizenship Status in Floris
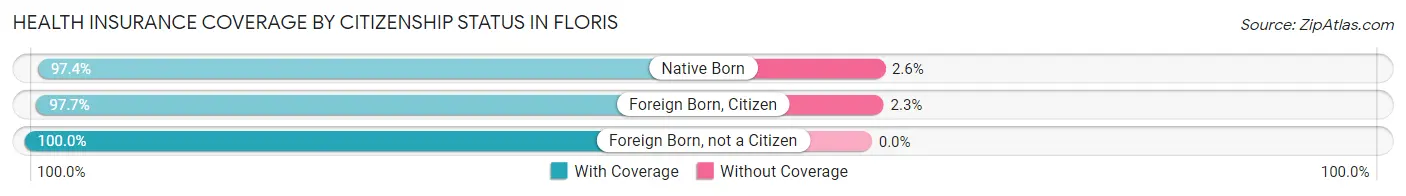
| Citizenship Status | With Coverage | Without Coverage |
| Native Born | 377 (97.4%) | 10 (2.6%) |
| Foreign Born, Citizen | 1,519 (97.7%) | 36 (2.3%) |
| Foreign Born, not a Citizen | 449 (100.0%) | 0 (0.0%) |
Health Insurance Coverage by Household Income in Floris
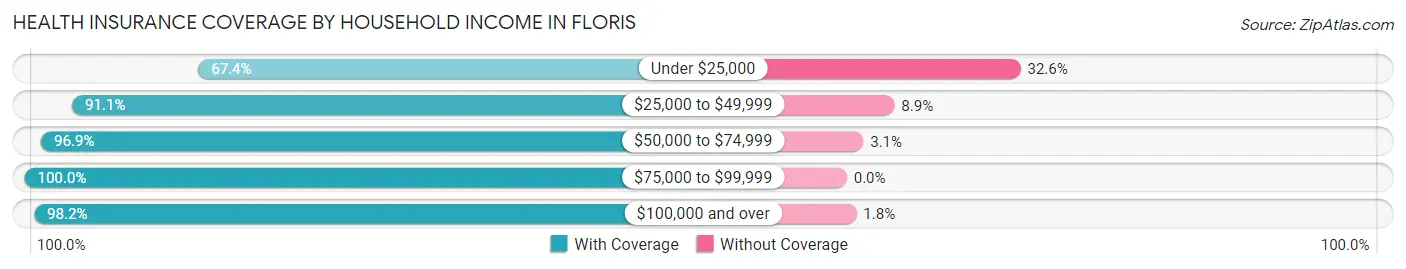
| Household Income | With Coverage | Without Coverage |
| Under $25,000 | 116 (67.4%) | 56 (32.6%) |
| $25,000 to $49,999 | 143 (91.1%) | 14 (8.9%) |
| $50,000 to $74,999 | 345 (96.9%) | 11 (3.1%) |
| $75,000 to $99,999 | 188 (100.0%) | 0 (0.0%) |
| $100,000 and over | 6,279 (98.2%) | 115 (1.8%) |
Public vs Private Health Insurance Coverage by Age in Floris
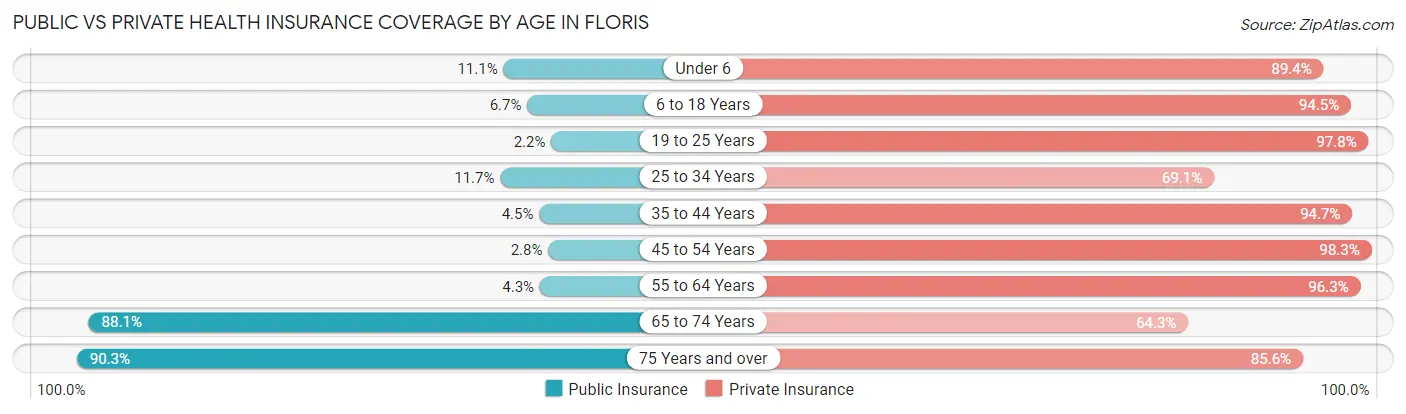
| Age Bracket | Public Insurance | Private Insurance |
| Under 6 | 43 (11.1%) | 346 (89.4%) |
| 6 to 18 Years | 104 (6.7%) | 1,470 (94.5%) |
| 19 to 25 Years | 10 (2.2%) | 439 (97.8%) |
| 25 to 34 Years | 42 (11.7%) | 248 (69.1%) |
| 35 to 44 Years | 44 (4.5%) | 935 (94.7%) |
| 45 to 54 Years | 35 (2.8%) | 1,228 (98.3%) |
| 55 to 64 Years | 57 (4.3%) | 1,263 (96.3%) |
| 65 to 74 Years | 481 (88.1%) | 351 (64.3%) |
| 75 Years and over | 382 (90.3%) | 362 (85.6%) |
| Total | 1,198 (16.5%) | 6,642 (91.4%) |
Disability Status by Sex by Age in Floris
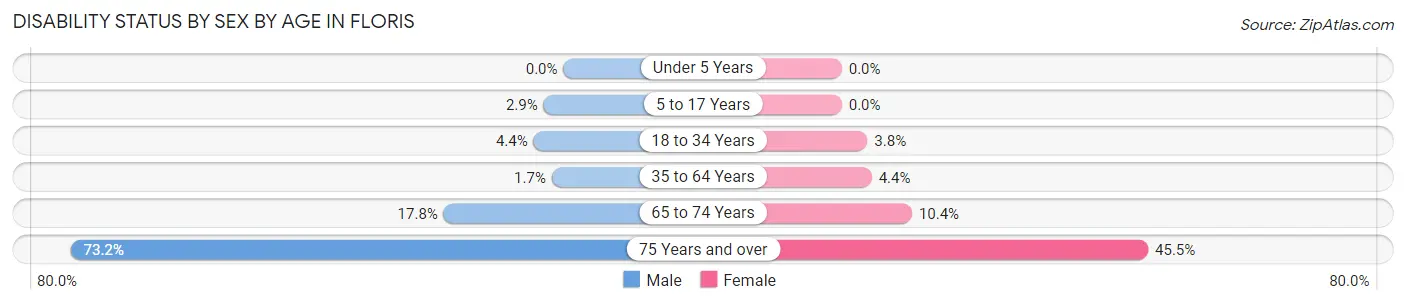
| Age Bracket | Male | Female |
| Under 5 Years | 0 (0.0%) | 0 (0.0%) |
| 5 to 17 Years | 23 (2.9%) | 0 (0.0%) |
| 18 to 34 Years | 20 (4.4%) | 17 (3.8%) |
| 35 to 64 Years | 30 (1.7%) | 80 (4.4%) |
| 65 to 74 Years | 51 (17.8%) | 27 (10.4%) |
| 75 Years and over | 139 (73.2%) | 106 (45.5%) |
Disability Class by Sex by Age in Floris
Disability Class: Hearing Difficulty
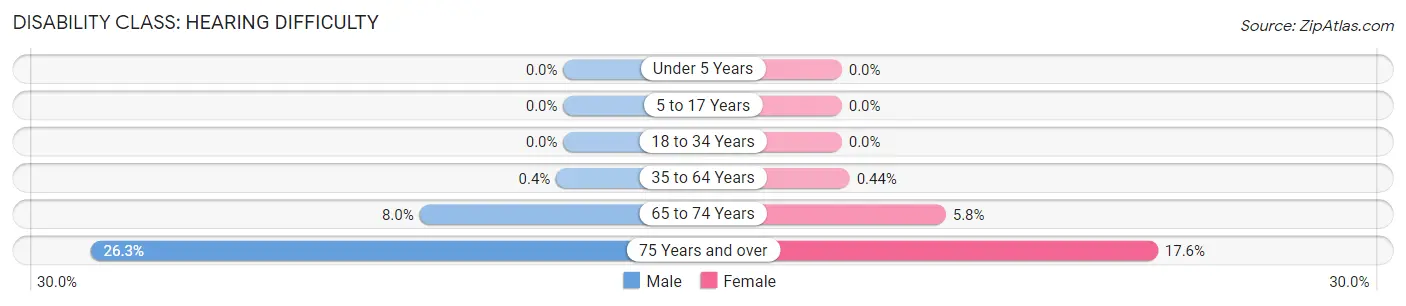
| Age Bracket | Male | Female |
| Under 5 Years | 0 (0.0%) | 0 (0.0%) |
| 5 to 17 Years | 0 (0.0%) | 0 (0.0%) |
| 18 to 34 Years | 0 (0.0%) | 0 (0.0%) |
| 35 to 64 Years | 7 (0.4%) | 8 (0.4%) |
| 65 to 74 Years | 23 (8.0%) | 15 (5.8%) |
| 75 Years and over | 50 (26.3%) | 41 (17.6%) |
Disability Class: Vision Difficulty
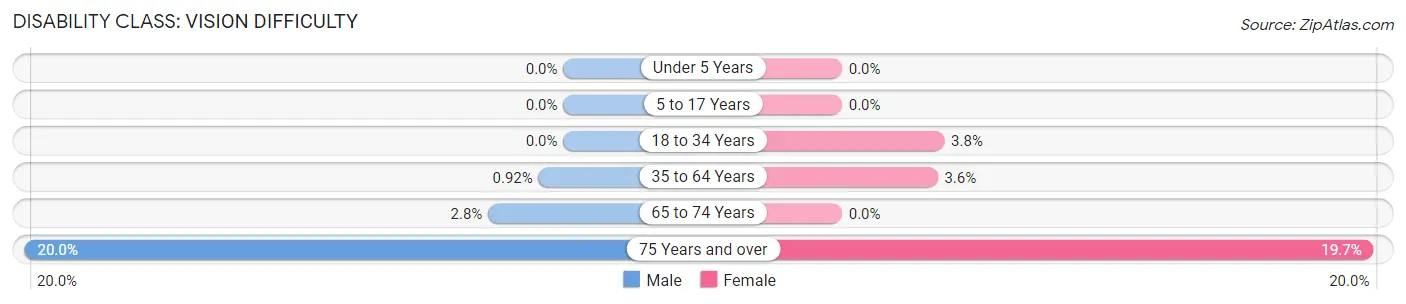
| Age Bracket | Male | Female |
| Under 5 Years | 0 (0.0%) | 0 (0.0%) |
| 5 to 17 Years | 0 (0.0%) | 0 (0.0%) |
| 18 to 34 Years | 0 (0.0%) | 17 (3.8%) |
| 35 to 64 Years | 16 (0.9%) | 64 (3.5%) |
| 65 to 74 Years | 8 (2.8%) | 0 (0.0%) |
| 75 Years and over | 38 (20.0%) | 46 (19.7%) |
Disability Class: Cognitive Difficulty
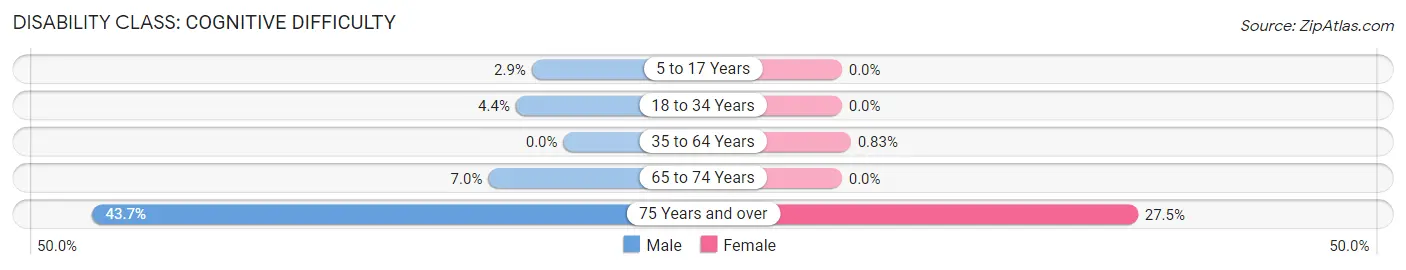
| Age Bracket | Male | Female |
| 5 to 17 Years | 23 (2.9%) | 0 (0.0%) |
| 18 to 34 Years | 20 (4.4%) | 0 (0.0%) |
| 35 to 64 Years | 0 (0.0%) | 15 (0.8%) |
| 65 to 74 Years | 20 (7.0%) | 0 (0.0%) |
| 75 Years and over | 83 (43.7%) | 64 (27.5%) |
Disability Class: Ambulatory Difficulty
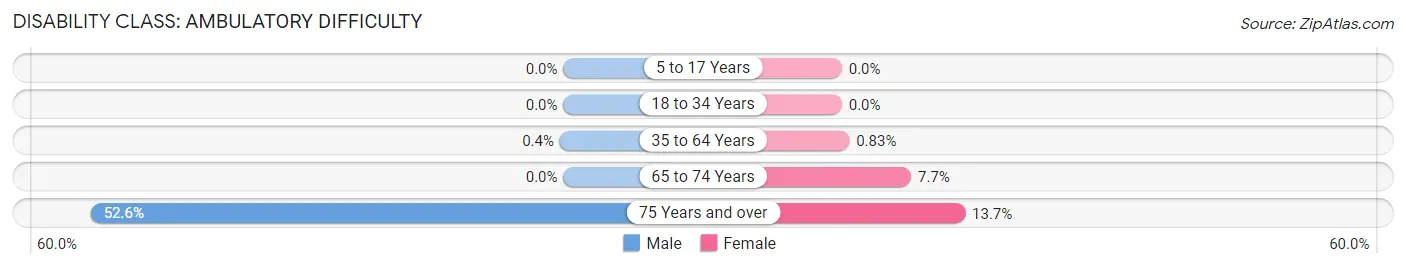
| Age Bracket | Male | Female |
| 5 to 17 Years | 0 (0.0%) | 0 (0.0%) |
| 18 to 34 Years | 0 (0.0%) | 0 (0.0%) |
| 35 to 64 Years | 7 (0.4%) | 15 (0.8%) |
| 65 to 74 Years | 0 (0.0%) | 20 (7.7%) |
| 75 Years and over | 100 (52.6%) | 32 (13.7%) |
Disability Class: Self-Care Difficulty
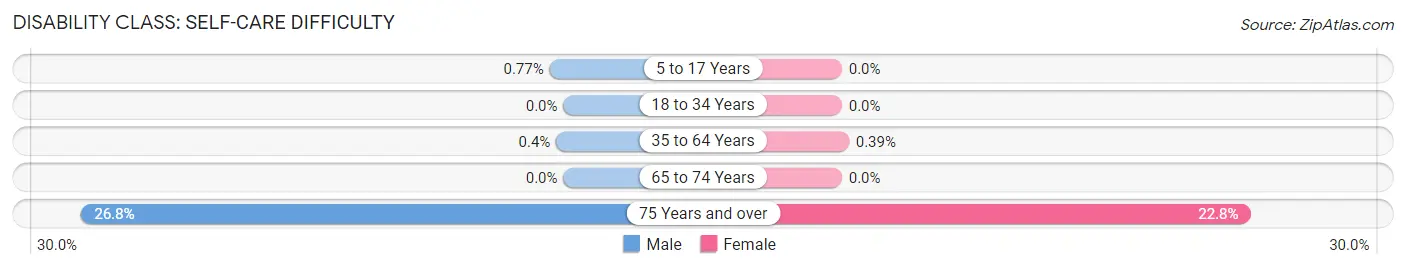
| Age Bracket | Male | Female |
| 5 to 17 Years | 6 (0.8%) | 0 (0.0%) |
| 18 to 34 Years | 0 (0.0%) | 0 (0.0%) |
| 35 to 64 Years | 7 (0.4%) | 7 (0.4%) |
| 65 to 74 Years | 0 (0.0%) | 0 (0.0%) |
| 75 Years and over | 51 (26.8%) | 53 (22.8%) |
Technology Access in Floris
Computing Device Access in Floris
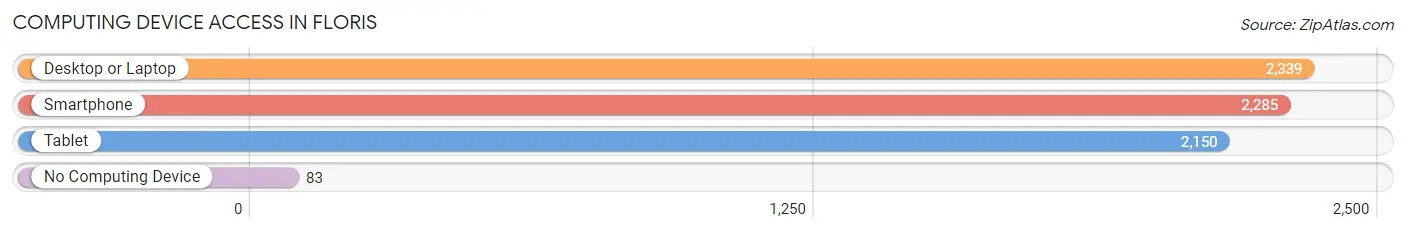
| Device Type | # Households | % Households |
| Desktop or Laptop | 2,339 | 96.1% |
| Smartphone | 2,285 | 93.9% |
| Tablet | 2,150 | 88.3% |
| No Computing Device | 83 | 3.4% |
| Total | 2,434 | 100.0% |
Internet Access in Floris
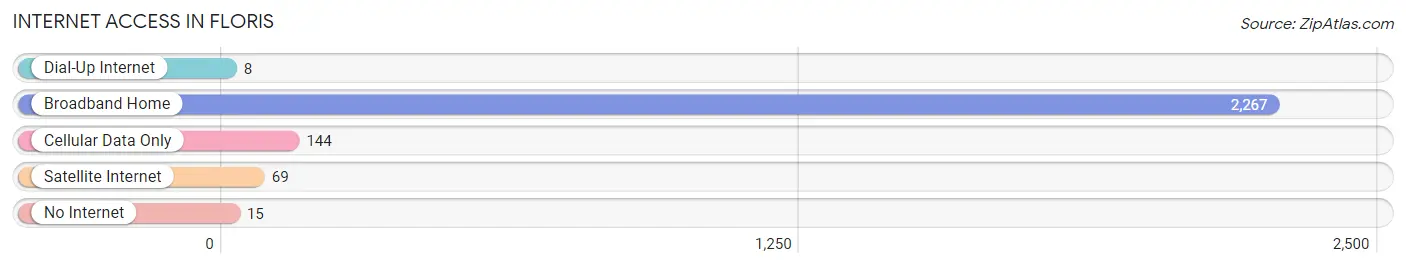
| Internet Type | # Households | % Households |
| Dial-Up Internet | 8 | 0.3% |
| Broadband Home | 2,267 | 93.1% |
| Cellular Data Only | 144 | 5.9% |
| Satellite Internet | 69 | 2.8% |
| No Internet | 15 | 0.6% |
| Total | 2,434 | 100.0% |
Floris Summary
Floris is an unincorporated community located in western Fairfax County, Virginia. It is situated in the Washington, D.C. metropolitan area and is part of the Dulles Technology Corridor. The community is located along the banks of the Potomac River and is home to a variety of businesses, including technology companies, government contractors, and retail stores.
History
The area that is now Floris was originally inhabited by Native Americans, including the Piscataway and Iroquois tribes. The first European settlers arrived in the area in the late 1700s, and the community was officially established in 1810. The community was named after a local landowner, John Floris, who owned a large tract of land in the area.
In the early 1900s, the area began to experience rapid growth as the Washington, D.C. metropolitan area expanded. The community was home to a variety of businesses, including a sawmill, a gristmill, and a general store. The area also became a popular destination for weekend getaways, as it was close to the Potomac River and the Chesapeake Bay.
Geography
Floris is located in western Fairfax County, Virginia, approximately 25 miles west of Washington, D.C. The community is situated along the banks of the Potomac River and is part of the Dulles Technology Corridor. The area is characterized by rolling hills and wooded areas, and is home to a variety of wildlife, including deer, foxes, and wild turkeys.
Economy
Floris is home to a variety of businesses, including technology companies, government contractors, and retail stores. The area is also home to a number of wineries and vineyards, as well as a number of farms and agricultural businesses. The community is also home to a variety of recreational activities, including hiking, biking, and fishing.
Demographics
As of the 2010 census, the population of Floris was 4,845. The median household income was $112,917, and the median age was 37. The population was predominantly white (90.2%), with a small percentage of African Americans (3.2%) and Asians (2.7%). The majority of the population (86.2%) was born in the United States, and the median household size was 2.7 people.
Conclusion
Floris is an unincorporated community located in western Fairfax County, Virginia. It is situated in the Washington, D.C. metropolitan area and is part of the Dulles Technology Corridor. The community is located along the banks of the Potomac River and is home to a variety of businesses, including technology companies, government contractors, and retail stores. The area is characterized by rolling hills and wooded areas, and is home to a variety of wildlife. The population of Floris was 4,845 as of the 2010 census, and the median household income was $112,917. The majority of the population was born in the United States, and the median household size was 2.7 people.
Common Questions
What is Per Capita Income in Floris?
Per Capita income in Floris is $83,792.
What is the Median Family Income in Floris?
Median Family Income in Floris is $247,603.
What is the Median Household income in Floris?
Median Household Income in Floris is $231,161.
What is Income or Wage Gap in Floris?
Income or Wage Gap in Floris is 48.4%.
Women in Floris earn 51.6 cents for every dollar earned by a man.
What is Inequality or Gini Index in Floris?
Inequality or Gini Index in Floris is 0.36.
What is the Total Population of Floris?
Total Population of Floris is 7,417.
What is the Total Male Population of Floris?
Total Male Population of Floris is 3,754.
What is the Total Female Population of Floris?
Total Female Population of Floris is 3,663.
What is the Ratio of Males per 100 Females in Floris?
There are 102.48 Males per 100 Females in Floris.
What is the Ratio of Females per 100 Males in Floris?
There are 97.58 Females per 100 Males in Floris.
What is the Median Population Age in Floris?
Median Population Age in Floris is 43.6 Years.
What is the Average Family Size in Floris
Average Family Size in Floris is 3.3 People.
What is the Average Household Size in Floris
Average Household Size in Floris is 3.0 People.
How Large is the Labor Force in Floris?
There are 4,307 People in the Labor Forcein in Floris.
What is the Percentage of People in the Labor Force in Floris?
74.0% of People are in the Labor Force in Floris.
What is the Unemployment Rate in Floris?
Unemployment Rate in Floris is 5.4%.