Buckhall, VA Map & Demographics
Buckhall Map
Buckhall Overview
$58,111
PER CAPITA INCOME
$165,641
AVG FAMILY INCOME
$155,735
AVG HOUSEHOLD INCOME
21.4%
WAGE / INCOME GAP [ % ]
78.6¢/ $1
WAGE / INCOME GAP [ $ ]
$7,967
FAMILY INCOME DEFICIT
0.36
INEQUALITY / GINI INDEX
20,095
TOTAL POPULATION
10,752
MALE POPULATION
9,343
FEMALE POPULATION
115.08
MALES / 100 FEMALES
86.90
FEMALES / 100 MALES
40.1
MEDIAN AGE
3.4
AVG FAMILY SIZE
3.2
AVG HOUSEHOLD SIZE
11,321
LABOR FORCE [ PEOPLE ]
71.6%
PERCENT IN LABOR FORCE
3.6%
UNEMPLOYMENT RATE
Income in Buckhall
Income Overview in Buckhall
Per Capita Income in Buckhall is $58,111, while median incomes of families and households are $165,641 and $155,735 respectively.
| Characteristic | Number | Measure |
| Per Capita Income | 20,095 | $58,111 |
| Median Family Income | 5,198 | $165,641 |
| Mean Family Income | 5,198 | $188,999 |
| Median Household Income | 6,270 | $155,735 |
| Mean Household Income | 6,270 | $180,667 |
| Income Deficit | 5,198 | $7,967 |
| Wage / Income Gap (%) | 20,095 | 21.39% |
| Wage / Income Gap ($) | 20,095 | 78.61¢ per $1 |
| Gini / Inequality Index | 20,095 | 0.36 |
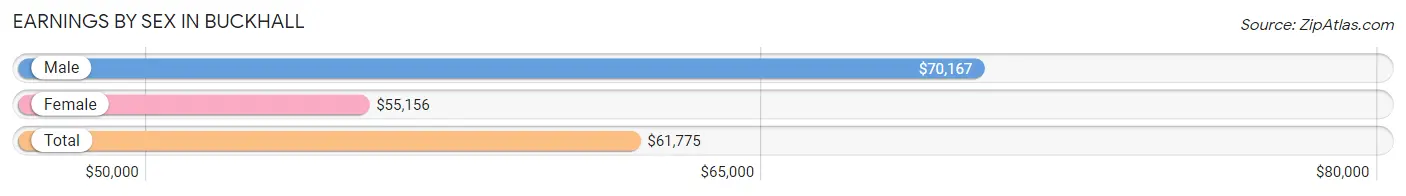
Earnings by Sex in Buckhall
Average Earnings in Buckhall are $61,775, $70,167 for men and $55,156 for women, a difference of 21.4%.
| Sex | Number | Average Earnings |
| Male | 6,708 (57.2%) | $70,167 |
| Female | 5,023 (42.8%) | $55,156 |
| Total | 11,731 (100.0%) | $61,775 |
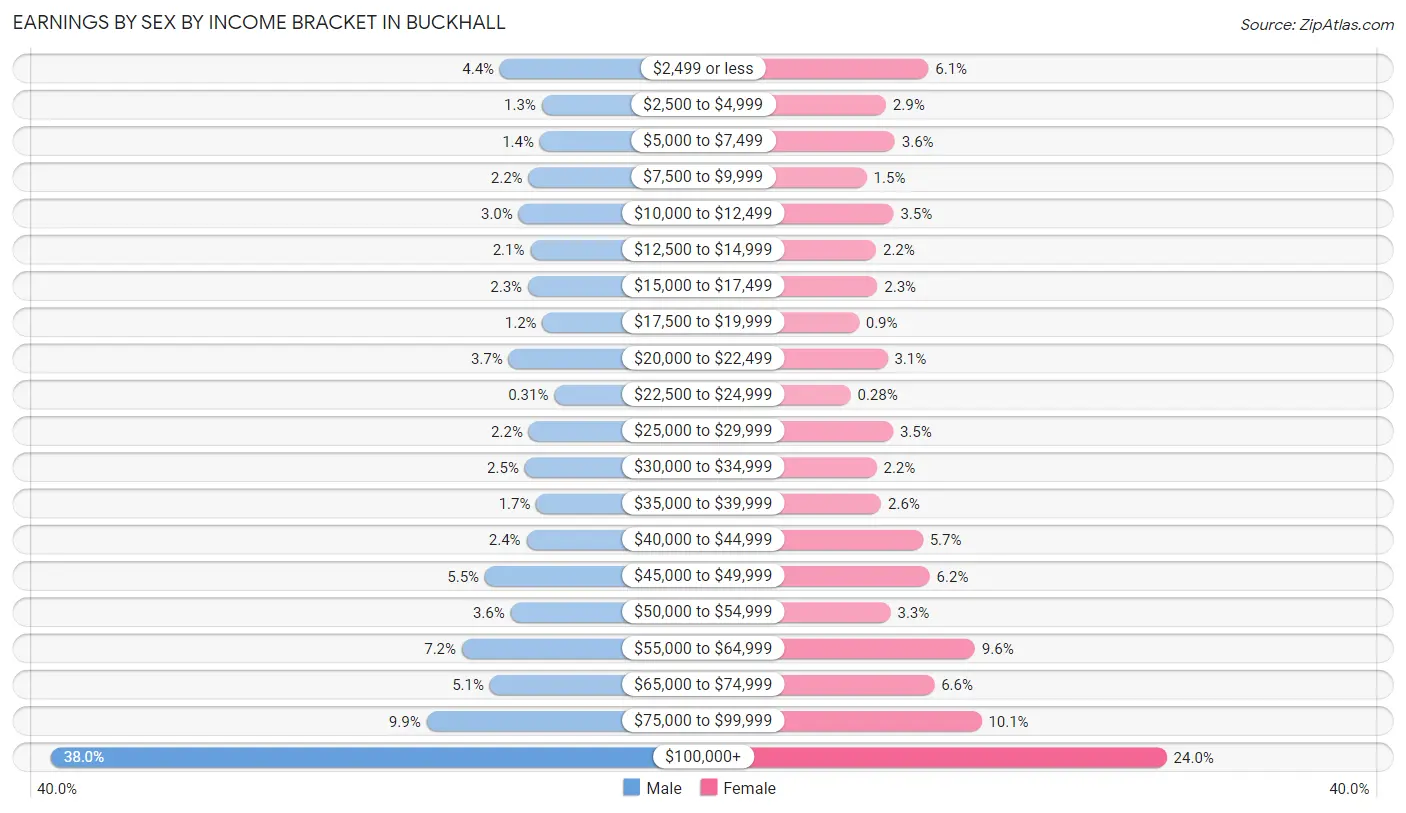
Earnings by Sex by Income Bracket in Buckhall
The most common earnings brackets in Buckhall are $100,000+ for men (2,551 | 38.0%) and $100,000+ for women (1,204 | 24.0%).
| Income | Male | Female |
| $2,499 or less | 294 (4.4%) | 307 (6.1%) |
| $2,500 to $4,999 | 84 (1.3%) | 147 (2.9%) |
| $5,000 to $7,499 | 93 (1.4%) | 181 (3.6%) |
| $7,500 to $9,999 | 150 (2.2%) | 75 (1.5%) |
| $10,000 to $12,499 | 200 (3.0%) | 176 (3.5%) |
| $12,500 to $14,999 | 141 (2.1%) | 110 (2.2%) |
| $15,000 to $17,499 | 153 (2.3%) | 115 (2.3%) |
| $17,500 to $19,999 | 80 (1.2%) | 45 (0.9%) |
| $20,000 to $22,499 | 250 (3.7%) | 153 (3.0%) |
| $22,500 to $24,999 | 21 (0.3%) | 14 (0.3%) |
| $25,000 to $29,999 | 149 (2.2%) | 174 (3.5%) |
| $30,000 to $34,999 | 169 (2.5%) | 112 (2.2%) |
| $35,000 to $39,999 | 111 (1.7%) | 129 (2.6%) |
| $40,000 to $44,999 | 160 (2.4%) | 286 (5.7%) |
| $45,000 to $49,999 | 369 (5.5%) | 312 (6.2%) |
| $50,000 to $54,999 | 240 (3.6%) | 165 (3.3%) |
| $55,000 to $64,999 | 485 (7.2%) | 482 (9.6%) |
| $65,000 to $74,999 | 345 (5.1%) | 329 (6.6%) |
| $75,000 to $99,999 | 663 (9.9%) | 507 (10.1%) |
| $100,000+ | 2,551 (38.0%) | 1,204 (24.0%) |
| Total | 6,708 (100.0%) | 5,023 (100.0%) |
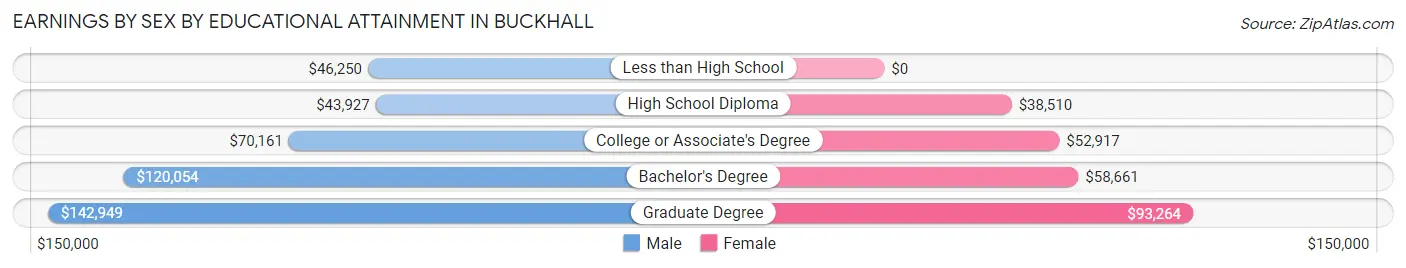
Earnings by Sex by Educational Attainment in Buckhall
Average earnings in Buckhall are $85,089 for men and $59,438 for women, a difference of 30.1%. Men with an educational attainment of graduate degree enjoy the highest average annual earnings of $142,949, while those with high school diploma education earn the least with $43,927. Women with an educational attainment of graduate degree earn the most with the average annual earnings of $93,264, while those with high school diploma education have the smallest earnings of $38,510.
| Educational Attainment | Male Income | Female Income |
| Less than High School | $46,250 | $0 |
| High School Diploma | $43,927 | $38,510 |
| College or Associate's Degree | $70,161 | $52,917 |
| Bachelor's Degree | $120,054 | $58,661 |
| Graduate Degree | $142,949 | $93,264 |
| Total | $85,089 | $59,438 |
Family Income in Buckhall
Family Income Brackets in Buckhall
According to the Buckhall family income data, there are 1,902 families falling into the $200,000+ income range, which is the most common income bracket and makes up 36.6% of all families. Conversely, the $10,000 to $14,999 income bracket is the least frequent group with only 16 families (0.3%) belonging to this category.
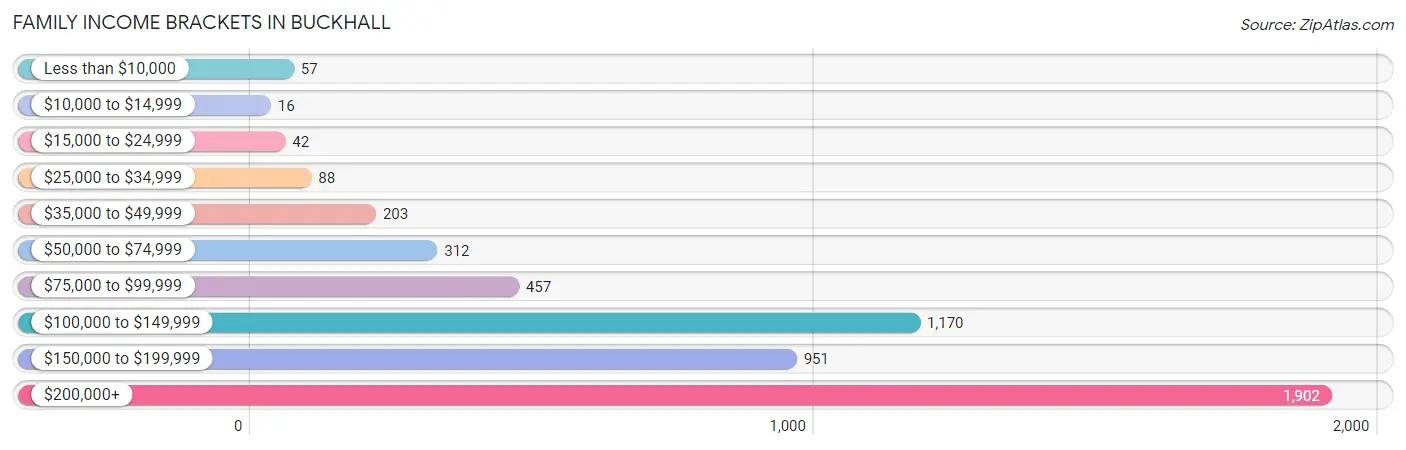
| Income Bracket | # Families | % Families |
| Less than $10,000 | 57 | 1.1% |
| $10,000 to $14,999 | 16 | 0.3% |
| $15,000 to $24,999 | 42 | 0.8% |
| $25,000 to $34,999 | 88 | 1.7% |
| $35,000 to $49,999 | 203 | 3.9% |
| $50,000 to $74,999 | 312 | 6.0% |
| $75,000 to $99,999 | 457 | 8.8% |
| $100,000 to $149,999 | 1,170 | 22.5% |
| $150,000 to $199,999 | 951 | 18.3% |
| $200,000+ | 1,902 | 36.6% |
Family Income by Famaliy Size in Buckhall
6-person families (134 | 2.6%) account for the highest median family income in Buckhall with $248,750 per family, while 2-person families (2,008 | 38.6%) have the highest median income of $74,322 per family member.
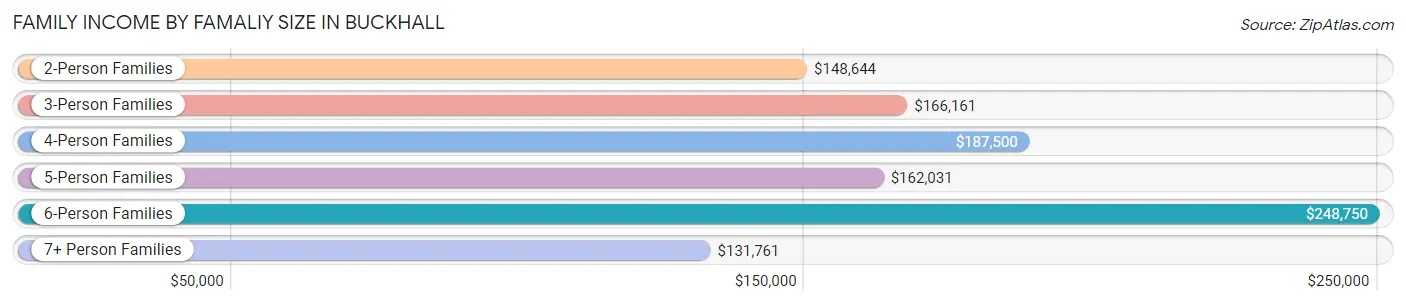
| Income Bracket | # Families | Median Income |
| 2-Person Families | 2,008 (38.6%) | $148,644 |
| 3-Person Families | 1,087 (20.9%) | $166,161 |
| 4-Person Families | 1,130 (21.7%) | $187,500 |
| 5-Person Families | 733 (14.1%) | $162,031 |
| 6-Person Families | 134 (2.6%) | $248,750 |
| 7+ Person Families | 106 (2.0%) | $131,761 |
| Total | 5,198 (100.0%) | $165,641 |
Family Income by Number of Earners in Buckhall
The median family income in Buckhall is $165,641, with families comprising 3+ earners (1,058) having the highest median family income of $210,517, while families with no earners (405) have the lowest median family income of $116,750, accounting for 20.3% and 7.8% of families, respectively.
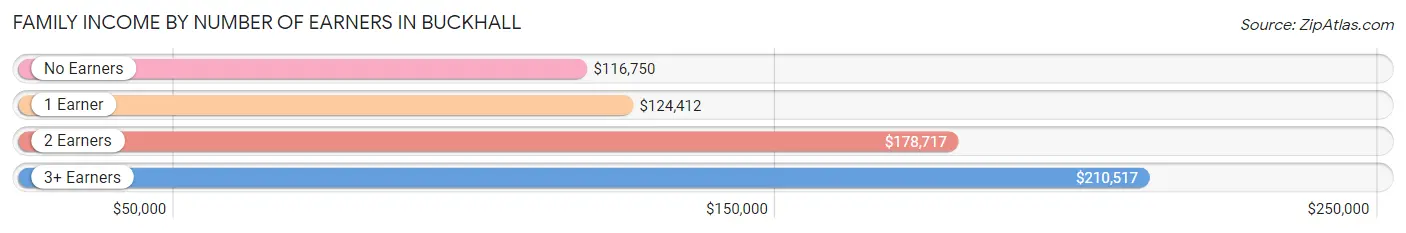
| Number of Earners | # Families | Median Income |
| No Earners | 405 (7.8%) | $116,750 |
| 1 Earner | 1,304 (25.1%) | $124,412 |
| 2 Earners | 2,431 (46.8%) | $178,717 |
| 3+ Earners | 1,058 (20.3%) | $210,517 |
| Total | 5,198 (100.0%) | $165,641 |
Household Income in Buckhall
Household Income Brackets in Buckhall
With 2,132 households falling in the category, the $200,000+ income range is the most frequent in Buckhall, accounting for 34.0% of all households. In contrast, only 38 households (0.6%) fall into the $10,000 to $14,999 income bracket, making it the least populous group.
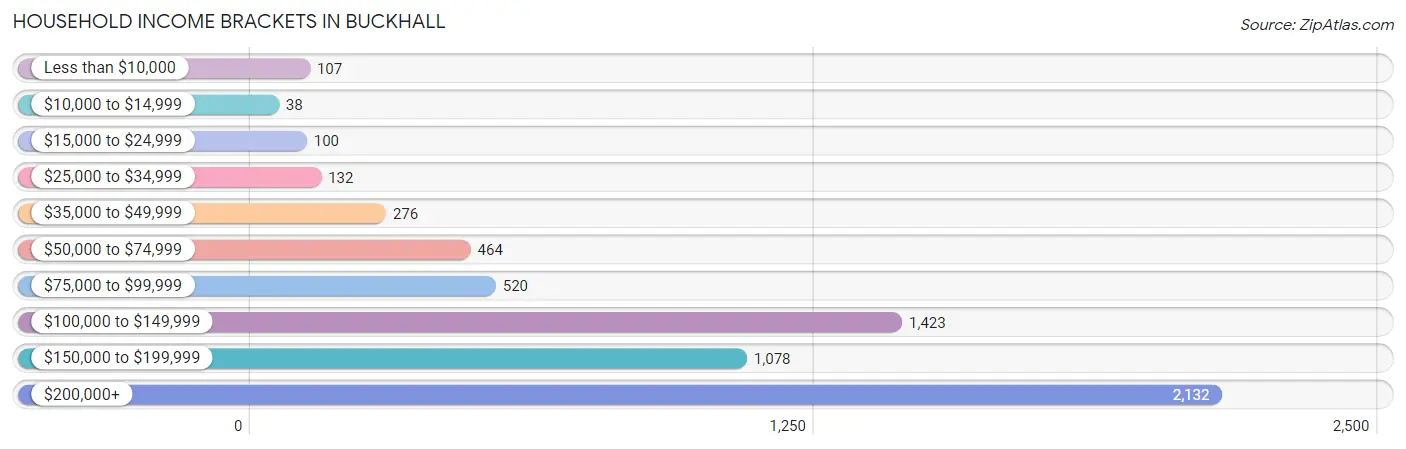
| Income Bracket | # Households | % Households |
| Less than $10,000 | 107 | 1.7% |
| $10,000 to $14,999 | 38 | 0.6% |
| $15,000 to $24,999 | 100 | 1.6% |
| $25,000 to $34,999 | 132 | 2.1% |
| $35,000 to $49,999 | 276 | 4.4% |
| $50,000 to $74,999 | 464 | 7.4% |
| $75,000 to $99,999 | 520 | 8.3% |
| $100,000 to $149,999 | 1,423 | 22.7% |
| $150,000 to $199,999 | 1,078 | 17.2% |
| $200,000+ | 2,132 | 34.0% |
Household Income by Householder Age in Buckhall
The median household income in Buckhall is $155,735, with the highest median household income of $178,779 found in the 45 to 64 years age bracket for the primary householder. A total of 2,796 households (44.6%) fall into this category. Meanwhile, the 15 to 24 years age bracket for the primary householder has the lowest median household income of $109,286, with 84 households (1.3%) in this group.
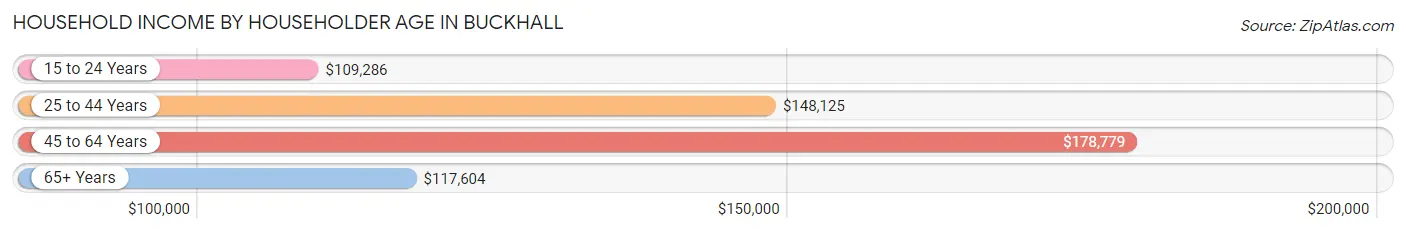
| Income Bracket | # Households | Median Income |
| 15 to 24 Years | 84 (1.3%) | $109,286 |
| 25 to 44 Years | 2,124 (33.9%) | $148,125 |
| 45 to 64 Years | 2,796 (44.6%) | $178,779 |
| 65+ Years | 1,266 (20.2%) | $117,604 |
| Total | 6,270 (100.0%) | $155,735 |
Poverty in Buckhall
Income Below Poverty by Sex and Age in Buckhall
With 3.3% poverty level for males and 6.0% for females among the residents of Buckhall, 16 and 17 year old males and 15 year old females are the most vulnerable to poverty, with 52 males (13.0%) and 17 females (18.9%) in their respective age groups living below the poverty level.
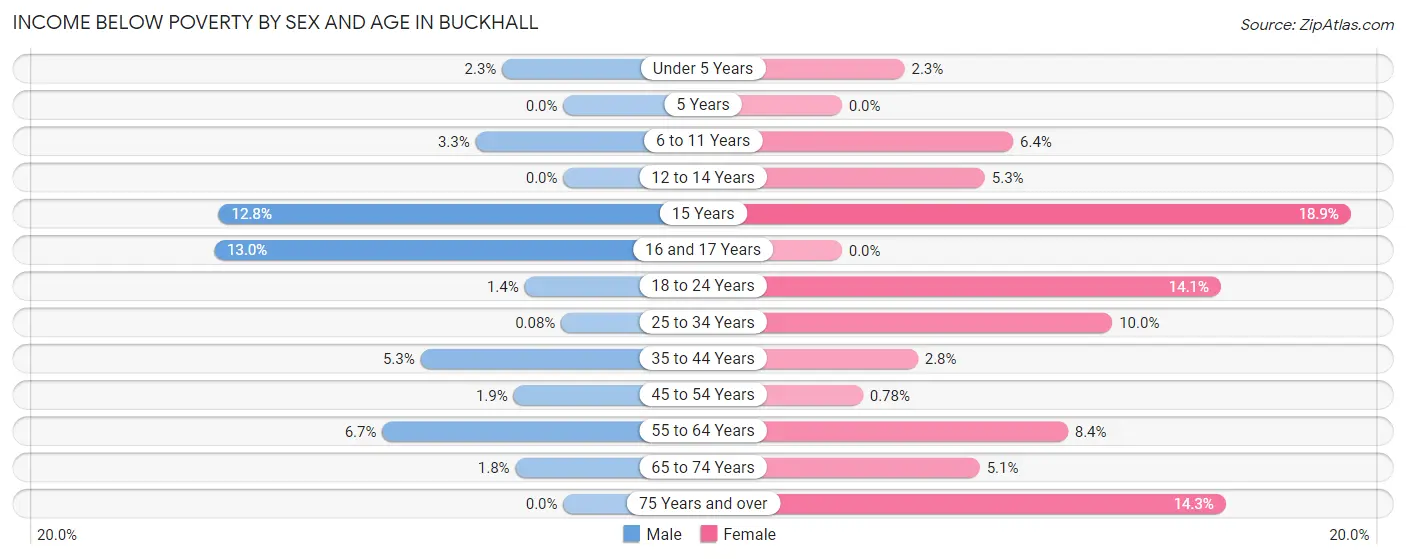
| Age Bracket | Male | Female |
| Under 5 Years | 16 (2.3%) | 16 (2.3%) |
| 5 Years | 0 (0.0%) | 0 (0.0%) |
| 6 to 11 Years | 30 (3.3%) | 45 (6.4%) |
| 12 to 14 Years | 0 (0.0%) | 19 (5.3%) |
| 15 Years | 16 (12.8%) | 17 (18.9%) |
| 16 and 17 Years | 52 (13.0%) | 0 (0.0%) |
| 18 to 24 Years | 12 (1.4%) | 75 (14.1%) |
| 25 to 34 Years | 1 (0.1%) | 128 (10.0%) |
| 35 to 44 Years | 86 (5.3%) | 41 (2.8%) |
| 45 to 54 Years | 31 (1.8%) | 11 (0.8%) |
| 55 to 64 Years | 91 (6.7%) | 104 (8.4%) |
| 65 to 74 Years | 14 (1.8%) | 42 (5.1%) |
| 75 Years and over | 0 (0.0%) | 52 (14.2%) |
| Total | 349 (3.3%) | 550 (6.0%) |
Income Above Poverty by Sex and Age in Buckhall
According to the poverty statistics in Buckhall, males aged 5 years and females aged 5 years are the age groups that are most secure financially, with 100.0% of males and 100.0% of females in these age groups living above the poverty line.
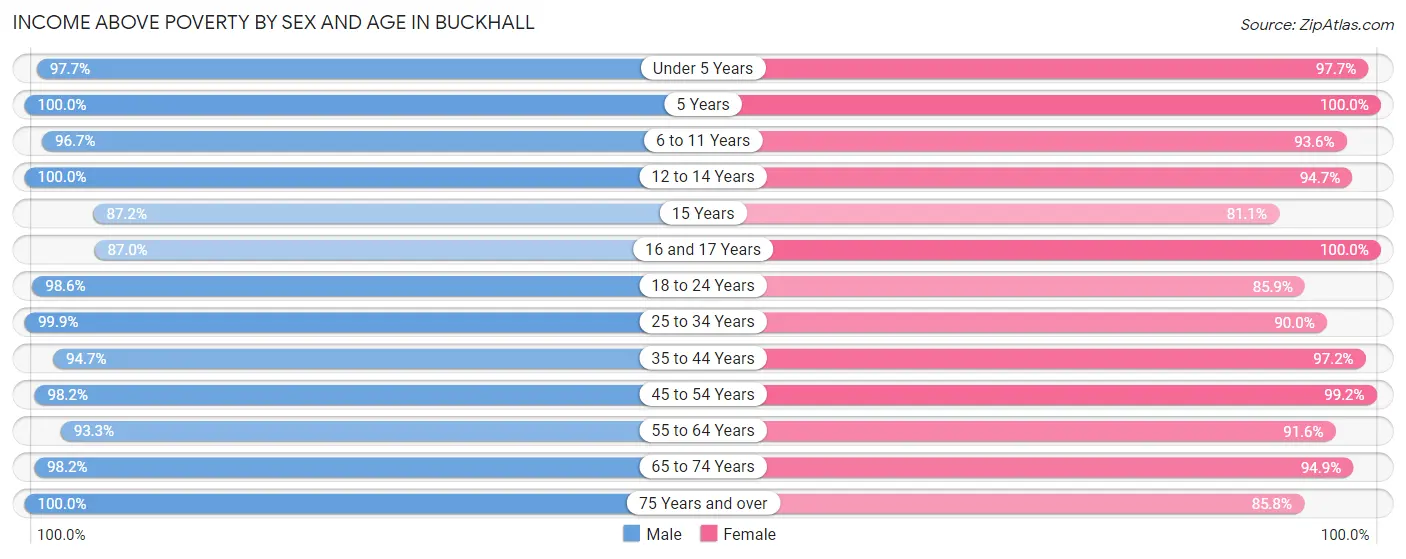
| Age Bracket | Male | Female |
| Under 5 Years | 690 (97.7%) | 672 (97.7%) |
| 5 Years | 120 (100.0%) | 88 (100.0%) |
| 6 to 11 Years | 890 (96.7%) | 663 (93.6%) |
| 12 to 14 Years | 398 (100.0%) | 339 (94.7%) |
| 15 Years | 109 (87.2%) | 73 (81.1%) |
| 16 and 17 Years | 349 (87.0%) | 185 (100.0%) |
| 18 to 24 Years | 821 (98.6%) | 458 (85.9%) |
| 25 to 34 Years | 1,281 (99.9%) | 1,147 (90.0%) |
| 35 to 44 Years | 1,538 (94.7%) | 1,411 (97.2%) |
| 45 to 54 Years | 1,647 (98.2%) | 1,406 (99.2%) |
| 55 to 64 Years | 1,263 (93.3%) | 1,135 (91.6%) |
| 65 to 74 Years | 771 (98.2%) | 778 (94.9%) |
| 75 Years and over | 365 (100.0%) | 313 (85.8%) |
| Total | 10,242 (96.7%) | 8,668 (94.0%) |
Income Below Poverty Among Married-Couple Families in Buckhall
The poverty statistics for married-couple families in Buckhall show that 2.4% or 112 of the total 4,619 families live below the poverty line. Families with 1 or 2 children have the highest poverty rate of 3.3%, comprising of 54 families. On the other hand, families with 3 or 4 children have the lowest poverty rate of 0.0%, which includes 0 families.
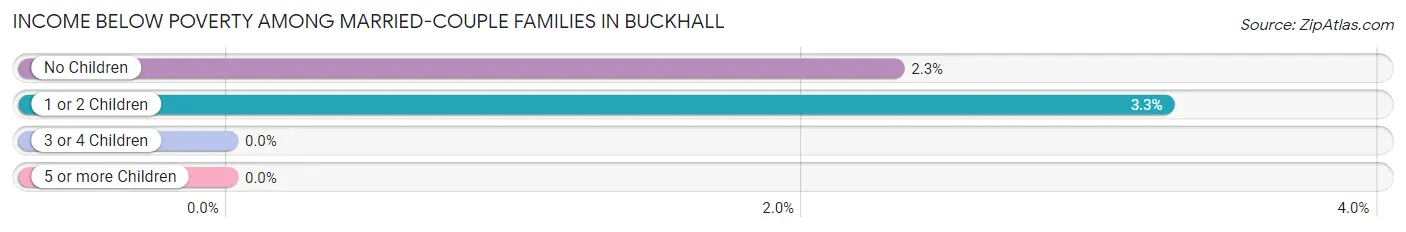
| Children | Above Poverty | Below Poverty |
| No Children | 2,445 (97.7%) | 58 (2.3%) |
| 1 or 2 Children | 1,603 (96.7%) | 54 (3.3%) |
| 3 or 4 Children | 428 (100.0%) | 0 (0.0%) |
| 5 or more Children | 31 (100.0%) | 0 (0.0%) |
| Total | 4,507 (97.6%) | 112 (2.4%) |
Income Below Poverty Among Single-Parent Households in Buckhall
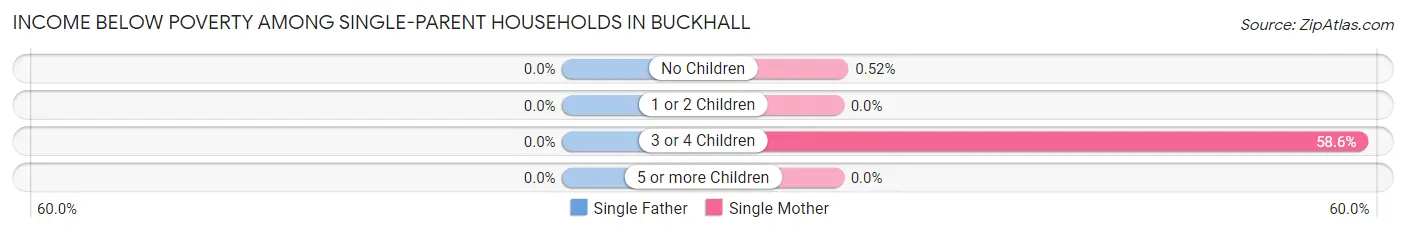
| Children | Single Father | Single Mother |
| No Children | 0 (0.0%) | 1 (0.5%) |
| 1 or 2 Children | 0 (0.0%) | 0 (0.0%) |
| 3 or 4 Children | 0 (0.0%) | 34 (58.6%) |
| 5 or more Children | 0 (0.0%) | 0 (0.0%) |
| Total | 0 (0.0%) | 35 (8.6%) |
Income Below Poverty Among Married-Couple vs Single-Parent Households in Buckhall
The poverty data for Buckhall shows that 112 of the married-couple family households (2.4%) and 35 of the single-parent households (6.0%) are living below the poverty level. Within the married-couple family households, those with 1 or 2 children have the highest poverty rate, with 54 households (3.3%) falling below the poverty line. Among the single-parent households, those with 3 or 4 children have the highest poverty rate, with 34 household (58.6%) living below poverty.
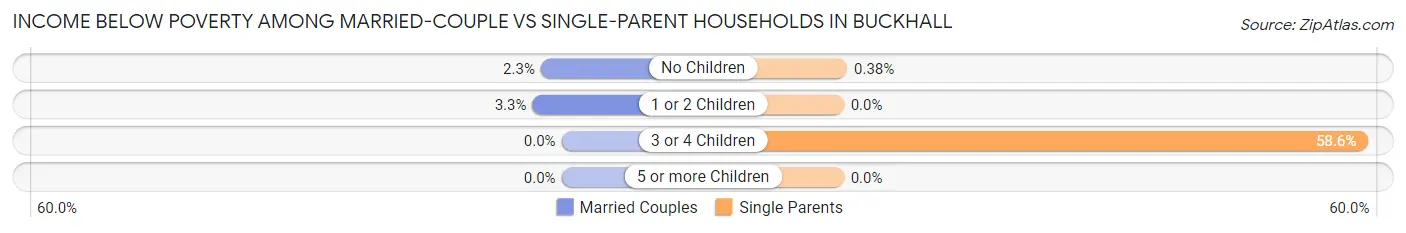
| Children | Married-Couple Families | Single-Parent Households |
| No Children | 58 (2.3%) | 1 (0.4%) |
| 1 or 2 Children | 54 (3.3%) | 0 (0.0%) |
| 3 or 4 Children | 0 (0.0%) | 34 (58.6%) |
| 5 or more Children | 0 (0.0%) | 0 (0.0%) |
| Total | 112 (2.4%) | 35 (6.0%) |
Race in Buckhall
The most populous races in Buckhall are White / Caucasian (13,091 | 65.1%), Hispanic or Latino (3,474 | 17.3%), and Two or more Races (2,741 | 13.6%).
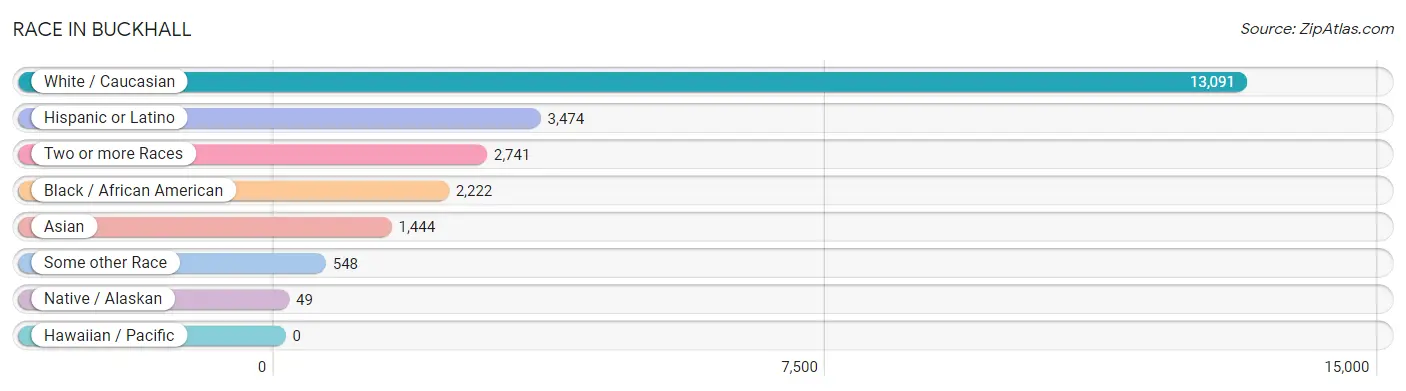
| Race | # Population | % Population |
| Asian | 1,444 | 7.2% |
| Black / African American | 2,222 | 11.1% |
| Hawaiian / Pacific | 0 | 0.0% |
| Hispanic or Latino | 3,474 | 17.3% |
| Native / Alaskan | 49 | 0.2% |
| White / Caucasian | 13,091 | 65.1% |
| Two or more Races | 2,741 | 13.6% |
| Some other Race | 548 | 2.7% |
| Total | 20,095 | 100.0% |
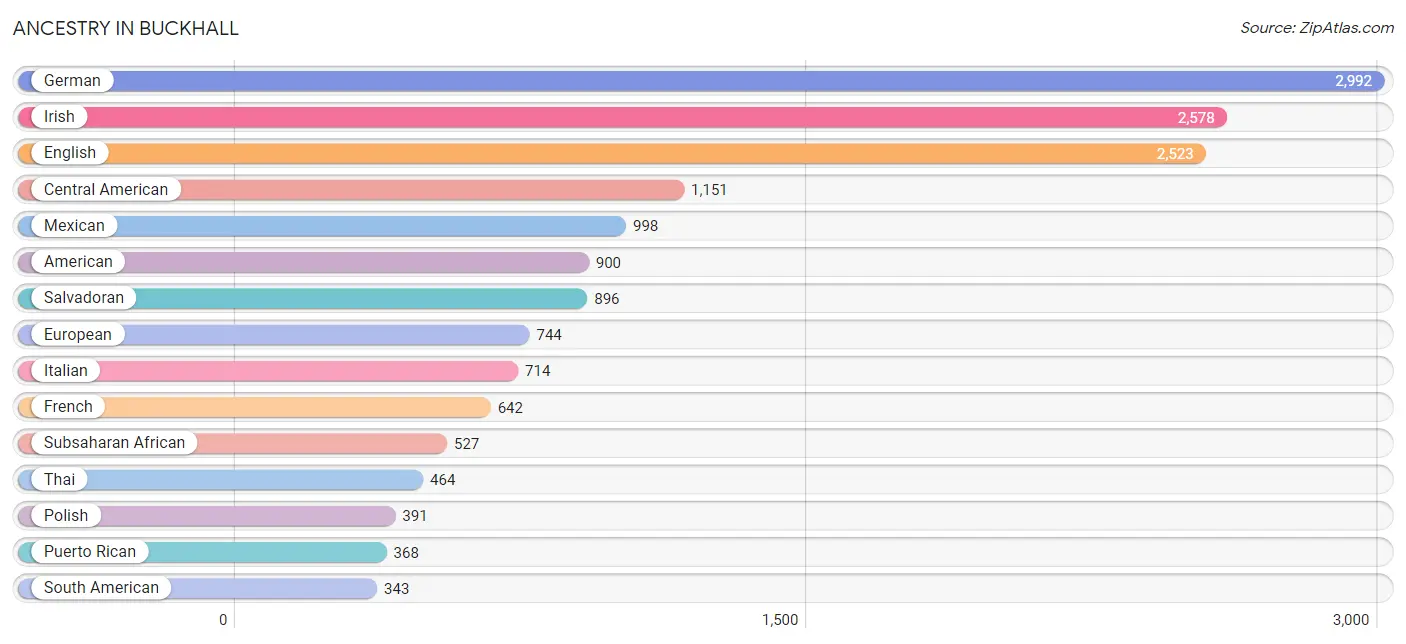
Ancestry in Buckhall
The most populous ancestries reported in Buckhall are German (2,992 | 14.9%), Irish (2,578 | 12.8%), English (2,523 | 12.6%), Central American (1,151 | 5.7%), and Mexican (998 | 5.0%), together accounting for 51.0% of all Buckhall residents.
| Ancestry | # Population | % Population |
| Afghan | 19 | 0.1% |
| African | 154 | 0.8% |
| American | 900 | 4.5% |
| Arab | 177 | 0.9% |
| Austrian | 59 | 0.3% |
| Bhutanese | 74 | 0.4% |
| Blackfeet | 27 | 0.1% |
| Bolivian | 7 | 0.0% |
| Brazilian | 23 | 0.1% |
| British | 158 | 0.8% |
| British West Indian | 22 | 0.1% |
| Burmese | 257 | 1.3% |
| Cajun | 11 | 0.1% |
| Central American | 1,151 | 5.7% |
| Central American Indian | 49 | 0.2% |
| Cherokee | 79 | 0.4% |
| Choctaw | 4 | 0.0% |
| Colombian | 154 | 0.8% |
| Comanche | 6 | 0.0% |
| Costa Rican | 28 | 0.1% |
| Creek | 23 | 0.1% |
| Croatian | 17 | 0.1% |
| Cuban | 119 | 0.6% |
| Czech | 56 | 0.3% |
| Czechoslovakian | 162 | 0.8% |
| Danish | 32 | 0.2% |
| Dominican | 264 | 1.3% |
| Dutch | 325 | 1.6% |
| Eastern European | 110 | 0.5% |
| Ecuadorian | 86 | 0.4% |
| Egyptian | 104 | 0.5% |
| English | 2,523 | 12.6% |
| Estonian | 7 | 0.0% |
| Ethiopian | 73 | 0.4% |
| European | 744 | 3.7% |
| Finnish | 25 | 0.1% |
| French | 642 | 3.2% |
| French Canadian | 38 | 0.2% |
| German | 2,992 | 14.9% |
| Ghanaian | 45 | 0.2% |
| Greek | 253 | 1.3% |
| Guatemalan | 187 | 0.9% |
| Haitian | 30 | 0.2% |
| Hungarian | 20 | 0.1% |
| Icelander | 18 | 0.1% |
| Indian (Asian) | 216 | 1.1% |
| Iranian | 17 | 0.1% |
| Irish | 2,578 | 12.8% |
| Iroquois | 9 | 0.0% |
| Italian | 714 | 3.5% |
| Jamaican | 103 | 0.5% |
| Japanese | 167 | 0.8% |
| Korean | 246 | 1.2% |
| Laotian | 22 | 0.1% |
| Lithuanian | 52 | 0.3% |
| Mexican | 998 | 5.0% |
| Mexican American Indian | 49 | 0.2% |
| Native Hawaiian | 15 | 0.1% |
| Nicaraguan | 40 | 0.2% |
| Nigerian | 13 | 0.1% |
| Northern European | 10 | 0.1% |
| Norwegian | 235 | 1.2% |
| Ottawa | 9 | 0.0% |
| Peruvian | 29 | 0.1% |
| Polish | 391 | 1.9% |
| Portuguese | 57 | 0.3% |
| Potawatomi | 26 | 0.1% |
| Puerto Rican | 368 | 1.8% |
| Russian | 157 | 0.8% |
| Salvadoran | 896 | 4.5% |
| Scandinavian | 165 | 0.8% |
| Scotch-Irish | 199 | 1.0% |
| Scottish | 314 | 1.6% |
| Slavic | 12 | 0.1% |
| Slovak | 91 | 0.4% |
| South American | 343 | 1.7% |
| Spaniard | 42 | 0.2% |
| Spanish | 29 | 0.1% |
| Sri Lankan | 209 | 1.0% |
| Subsaharan African | 527 | 2.6% |
| Sudanese | 95 | 0.5% |
| Swedish | 138 | 0.7% |
| Swiss | 41 | 0.2% |
| Thai | 464 | 2.3% |
| Trinidadian and Tobagonian | 17 | 0.1% |
| Turkish | 37 | 0.2% |
| Ukrainian | 39 | 0.2% |
| Welsh | 110 | 0.5% |
| Yugoslavian | 25 | 0.1% | View All 89 Rows |
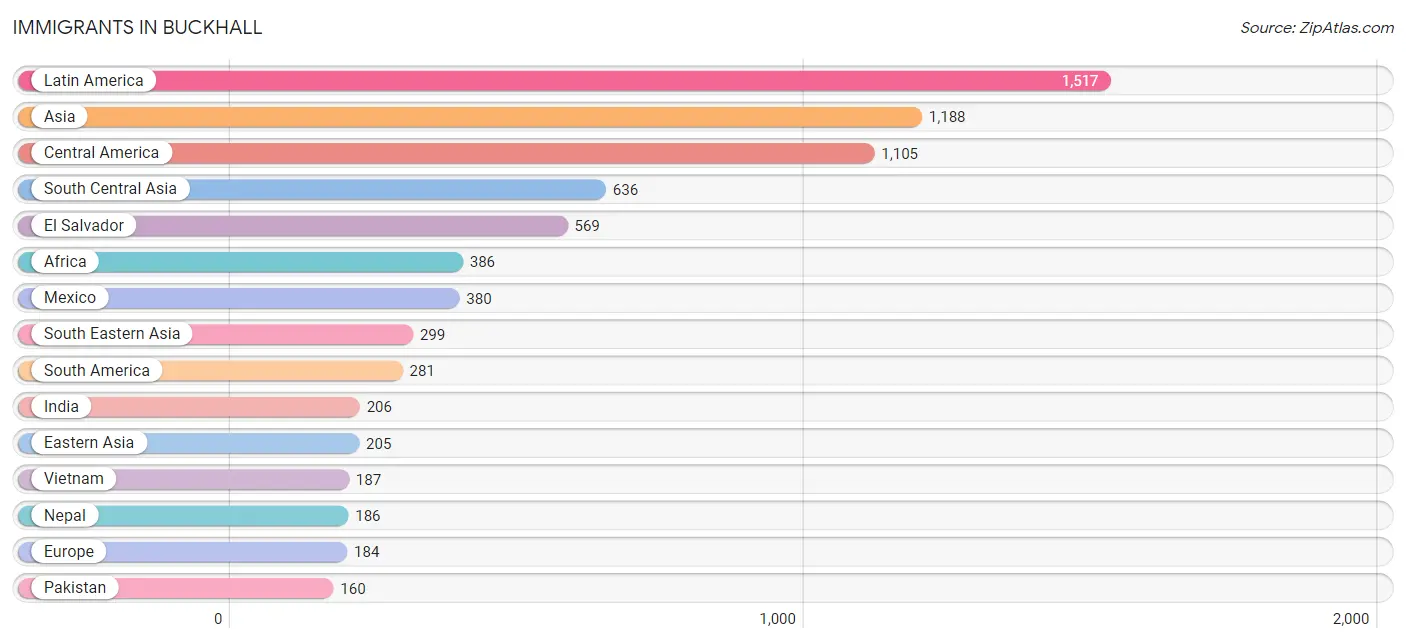
Immigrants in Buckhall
The most numerous immigrant groups reported in Buckhall came from Latin America (1,517 | 7.5%), Asia (1,188 | 5.9%), Central America (1,105 | 5.5%), South Central Asia (636 | 3.2%), and El Salvador (569 | 2.8%), together accounting for 24.9% of all Buckhall residents.
| Immigration Origin | # Population | % Population |
| Afghanistan | 39 | 0.2% |
| Africa | 386 | 1.9% |
| Asia | 1,188 | 5.9% |
| Austria | 8 | 0.0% |
| Bangladesh | 5 | 0.0% |
| Bolivia | 41 | 0.2% |
| Brazil | 41 | 0.2% |
| Cambodia | 76 | 0.4% |
| Canada | 24 | 0.1% |
| Caribbean | 131 | 0.6% |
| Central America | 1,105 | 5.5% |
| China | 75 | 0.4% |
| Colombia | 154 | 0.8% |
| Czechoslovakia | 5 | 0.0% |
| Dominican Republic | 50 | 0.3% |
| Eastern Africa | 134 | 0.7% |
| Eastern Asia | 205 | 1.0% |
| Eastern Europe | 40 | 0.2% |
| Ecuador | 32 | 0.2% |
| Egypt | 72 | 0.4% |
| El Salvador | 569 | 2.8% |
| England | 9 | 0.0% |
| Ethiopia | 57 | 0.3% |
| Europe | 184 | 0.9% |
| France | 15 | 0.1% |
| Germany | 72 | 0.4% |
| Ghana | 93 | 0.5% |
| Guatemala | 116 | 0.6% |
| Haiti | 30 | 0.2% |
| India | 206 | 1.0% |
| Indonesia | 6 | 0.0% |
| Jamaica | 51 | 0.3% |
| Japan | 20 | 0.1% |
| Jordan | 7 | 0.0% |
| Kenya | 35 | 0.2% |
| Korea | 110 | 0.5% |
| Latin America | 1,517 | 7.5% |
| Mexico | 380 | 1.9% |
| Morocco | 19 | 0.1% |
| Nepal | 186 | 0.9% |
| Nicaragua | 40 | 0.2% |
| Northern Africa | 135 | 0.7% |
| Northern Europe | 43 | 0.2% |
| Pakistan | 160 | 0.8% |
| Peru | 13 | 0.1% |
| Philippines | 24 | 0.1% |
| Portugal | 6 | 0.0% |
| Romania | 11 | 0.1% |
| Russia | 17 | 0.1% |
| Scotland | 6 | 0.0% |
| Somalia | 42 | 0.2% |
| South America | 281 | 1.4% |
| South Central Asia | 636 | 3.2% |
| South Eastern Asia | 299 | 1.5% |
| Southern Europe | 6 | 0.0% |
| Sudan | 44 | 0.2% |
| Taiwan | 36 | 0.2% |
| Thailand | 6 | 0.0% |
| Uzbekistan | 40 | 0.2% |
| Vietnam | 187 | 0.9% |
| Western Africa | 117 | 0.6% |
| Western Asia | 48 | 0.2% |
| Western Europe | 95 | 0.5% |
| Yemen | 12 | 0.1% | View All 64 Rows |
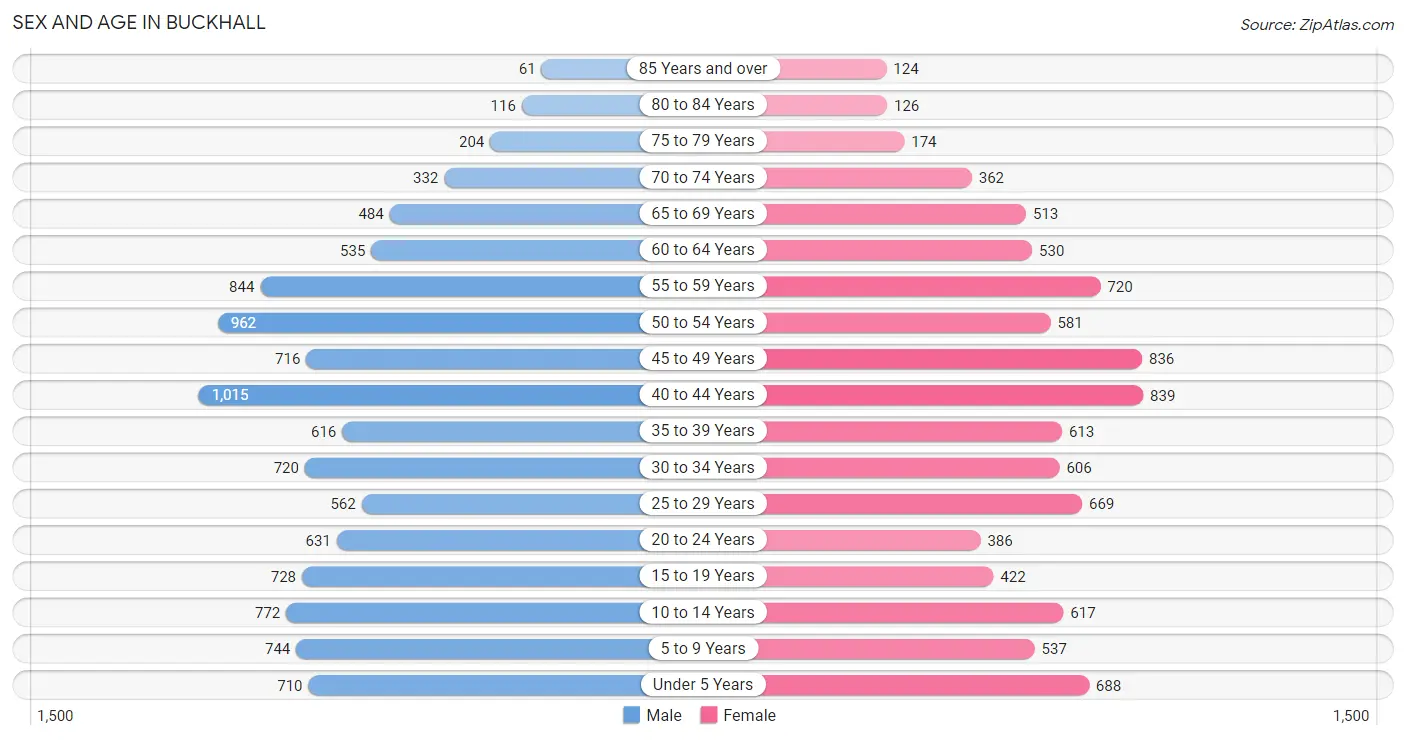
Sex and Age in Buckhall
Sex and Age in Buckhall
The most populous age groups in Buckhall are 40 to 44 Years (1,015 | 9.4%) for men and 40 to 44 Years (839 | 9.0%) for women.
| Age Bracket | Male | Female |
| Under 5 Years | 710 (6.6%) | 688 (7.4%) |
| 5 to 9 Years | 744 (6.9%) | 537 (5.8%) |
| 10 to 14 Years | 772 (7.2%) | 617 (6.6%) |
| 15 to 19 Years | 728 (6.8%) | 422 (4.5%) |
| 20 to 24 Years | 631 (5.9%) | 386 (4.1%) |
| 25 to 29 Years | 562 (5.2%) | 669 (7.2%) |
| 30 to 34 Years | 720 (6.7%) | 606 (6.5%) |
| 35 to 39 Years | 616 (5.7%) | 613 (6.6%) |
| 40 to 44 Years | 1,015 (9.4%) | 839 (9.0%) |
| 45 to 49 Years | 716 (6.7%) | 836 (8.9%) |
| 50 to 54 Years | 962 (8.9%) | 581 (6.2%) |
| 55 to 59 Years | 844 (7.9%) | 720 (7.7%) |
| 60 to 64 Years | 535 (5.0%) | 530 (5.7%) |
| 65 to 69 Years | 484 (4.5%) | 513 (5.5%) |
| 70 to 74 Years | 332 (3.1%) | 362 (3.9%) |
| 75 to 79 Years | 204 (1.9%) | 174 (1.9%) |
| 80 to 84 Years | 116 (1.1%) | 126 (1.3%) |
| 85 Years and over | 61 (0.6%) | 124 (1.3%) |
| Total | 10,752 (100.0%) | 9,343 (100.0%) |
Families and Households in Buckhall
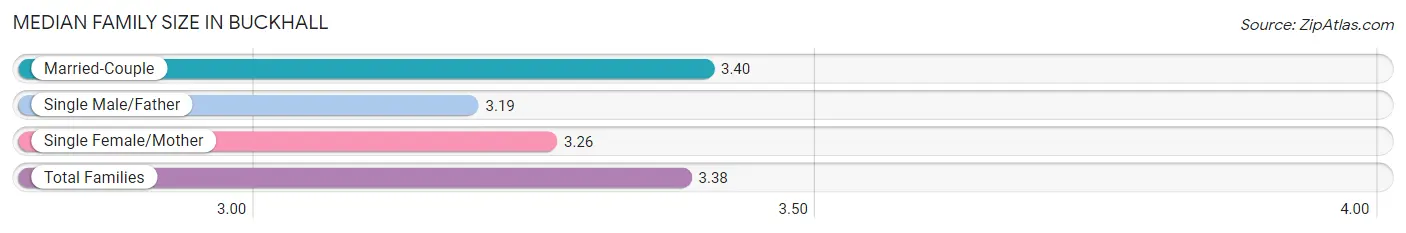
Median Family Size in Buckhall
The median family size in Buckhall is 3.38 persons per family, with married-couple families (4,619 | 88.9%) accounting for the largest median family size of 3.4 persons per family. On the other hand, single male/father families (173 | 3.3%) represent the smallest median family size with 3.19 persons per family.
| Family Type | # Families | Family Size |
| Married-Couple | 4,619 (88.9%) | 3.40 |
| Single Male/Father | 173 (3.3%) | 3.19 |
| Single Female/Mother | 406 (7.8%) | 3.26 |
| Total Families | 5,198 (100.0%) | 3.38 |
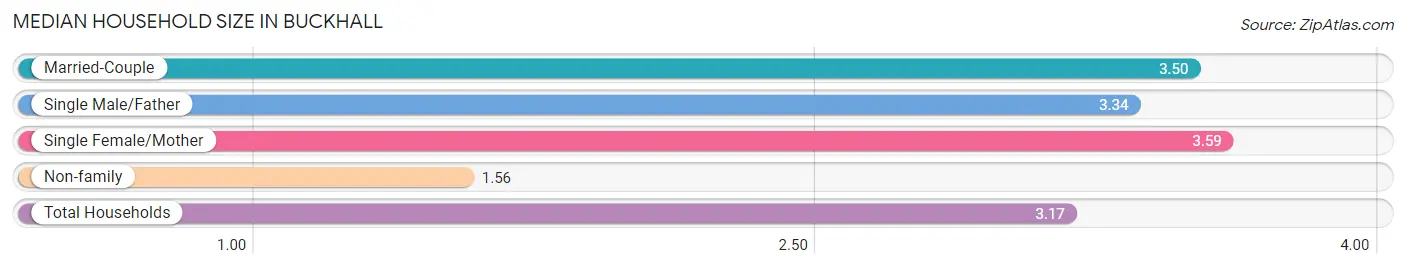
Median Household Size in Buckhall
The median household size in Buckhall is 3.17 persons per household, with single female/mother households (406 | 6.5%) accounting for the largest median household size of 3.59 persons per household. non-family households (1,072 | 17.1%) represent the smallest median household size with 1.56 persons per household.
| Household Type | # Households | Household Size |
| Married-Couple | 4,619 (73.7%) | 3.50 |
| Single Male/Father | 173 (2.8%) | 3.34 |
| Single Female/Mother | 406 (6.5%) | 3.59 |
| Non-family | 1,072 (17.1%) | 1.56 |
| Total Households | 6,270 (100.0%) | 3.17 |
Household Size by Marriage Status in Buckhall
Out of a total of 6,270 households in Buckhall, 5,198 (82.9%) are family households, while 1,072 (17.1%) are nonfamily households. The most numerous type of family households are 2-person households, comprising 1,884, and the most common type of nonfamily households are 1-person households, comprising 706.
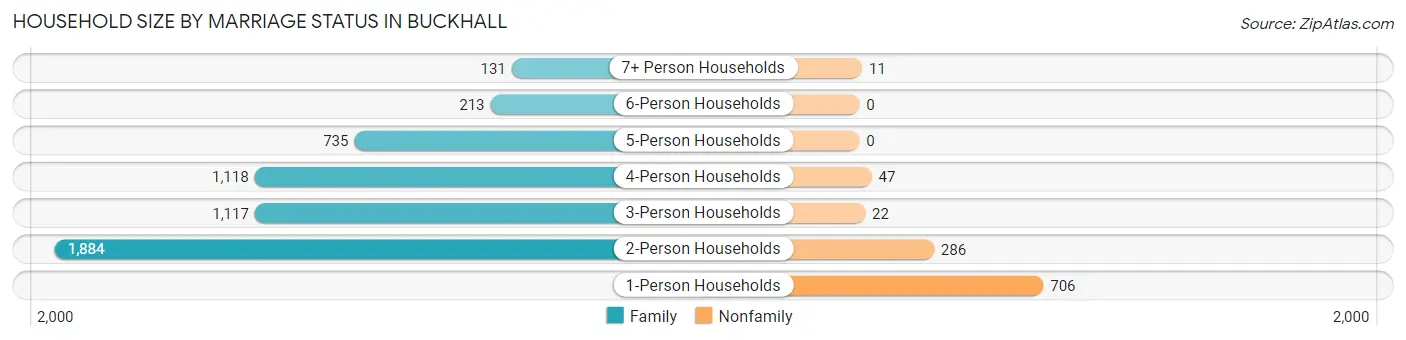
| Household Size | Family Households | Nonfamily Households |
| 1-Person Households | - | 706 (11.3%) |
| 2-Person Households | 1,884 (30.0%) | 286 (4.6%) |
| 3-Person Households | 1,117 (17.8%) | 22 (0.4%) |
| 4-Person Households | 1,118 (17.8%) | 47 (0.7%) |
| 5-Person Households | 735 (11.7%) | 0 (0.0%) |
| 6-Person Households | 213 (3.4%) | 0 (0.0%) |
| 7+ Person Households | 131 (2.1%) | 11 (0.2%) |
| Total | 5,198 (82.9%) | 1,072 (17.1%) |
Female Fertility in Buckhall
Fertility by Age in Buckhall
Average fertility rate in Buckhall is 48.0 births per 1,000 women. Women in the age bracket of 20 to 34 years have the highest fertility rate with 61.0 births per 1,000 women. Women in the age bracket of 35 to 50 years acount for 51.9% of all women with births.
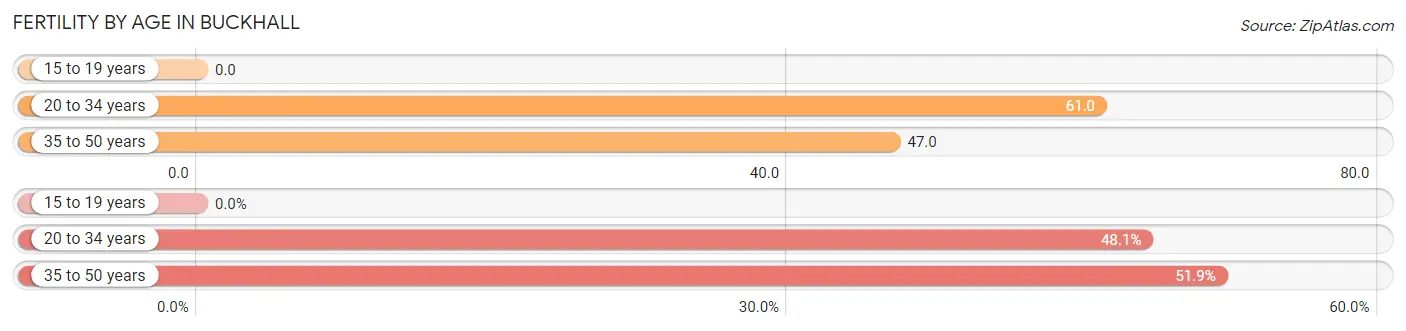
| Age Bracket | Women with Births | Births / 1,000 Women |
| 15 to 19 years | 0 (0.0%) | 0.0 |
| 20 to 34 years | 102 (48.1%) | 61.0 |
| 35 to 50 years | 110 (51.9%) | 47.0 |
| Total | 212 (100.0%) | 48.0 |
Fertility by Age by Marriage Status in Buckhall
92.9% of women with births (212) in Buckhall are married. The highest percentage of unmarried women with births falls into 20 to 34 years age bracket with 14.7% of them unmarried at the time of birth, while the lowest percentage of unmarried women with births belong to 35 to 50 years age bracket with 0.0% of them unmarried.
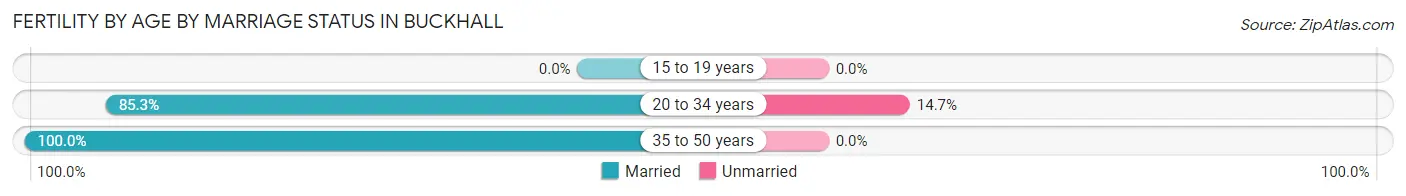
| Age Bracket | Married | Unmarried |
| 15 to 19 years | 0 (0.0%) | 0 (0.0%) |
| 20 to 34 years | 87 (85.3%) | 15 (14.7%) |
| 35 to 50 years | 110 (100.0%) | 0 (0.0%) |
| Total | 197 (92.9%) | 15 (7.1%) |
Fertility by Education in Buckhall
Average fertility rate in Buckhall is 48.0 births per 1,000 women. Women with the education attainment of graduate degree have the highest fertility rate of 60.0 births per 1,000 women, while women with the education attainment of less than high school have the lowest fertility at 24.0 births per 1,000 women. Women with the education attainment of bachelor's degree represent 32.6% of all women with births.
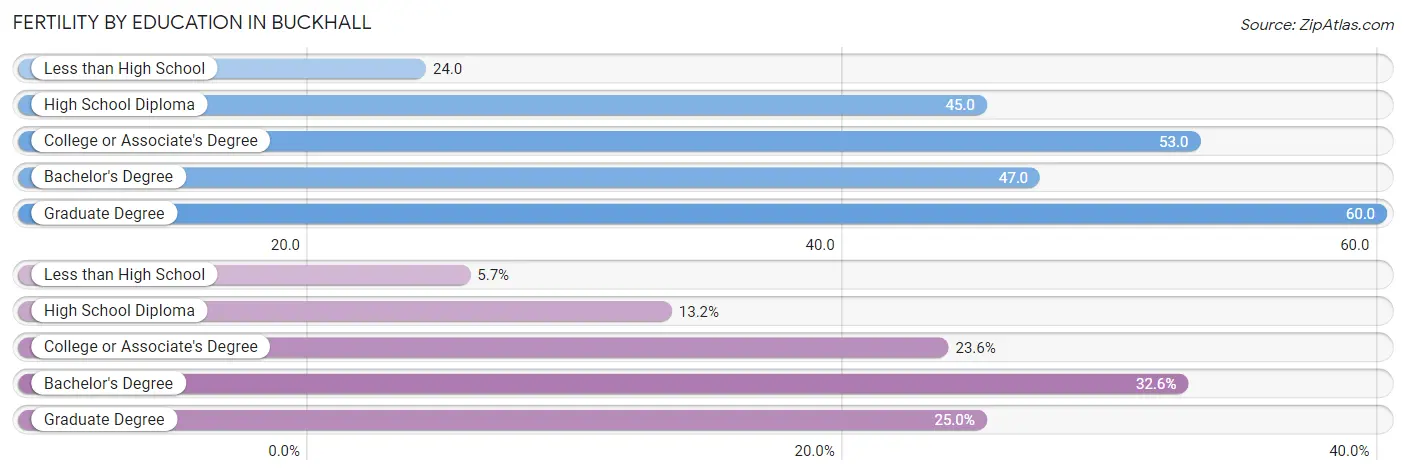
| Educational Attainment | Women with Births | Births / 1,000 Women |
| Less than High School | 12 (5.7%) | 24.0 |
| High School Diploma | 28 (13.2%) | 45.0 |
| College or Associate's Degree | 50 (23.6%) | 53.0 |
| Bachelor's Degree | 69 (32.6%) | 47.0 |
| Graduate Degree | 53 (25.0%) | 60.0 |
| Total | 212 (100.0%) | 48.0 |
Fertility by Education by Marriage Status in Buckhall
7.1% of women with births in Buckhall are unmarried. Women with the educational attainment of less than high school are most likely to be married with 100.0% of them married at childbirth, while women with the educational attainment of bachelor's degree are least likely to be married with 21.7% of them unmarried at childbirth.
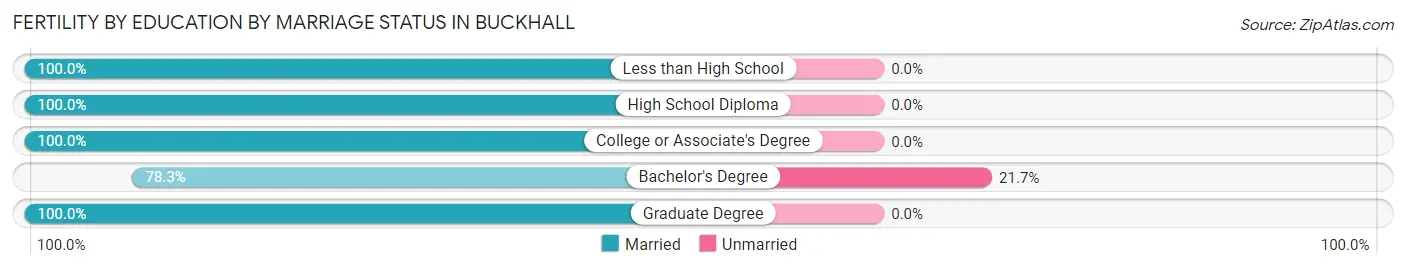
| Educational Attainment | Married | Unmarried |
| Less than High School | 12 (100.0%) | 0 (0.0%) |
| High School Diploma | 28 (100.0%) | 0 (0.0%) |
| College or Associate's Degree | 50 (100.0%) | 0 (0.0%) |
| Bachelor's Degree | 54 (78.3%) | 15 (21.7%) |
| Graduate Degree | 53 (100.0%) | 0 (0.0%) |
| Total | 197 (92.9%) | 15 (7.1%) |
Employment Characteristics in Buckhall
Employment by Class of Employer in Buckhall
Among the 10,719 employed individuals in Buckhall, private company employees (6,096 | 56.9%), federal government employees (1,732 | 16.2%), and not-for-profit organizations (944 | 8.8%) make up the most common classes of employment.
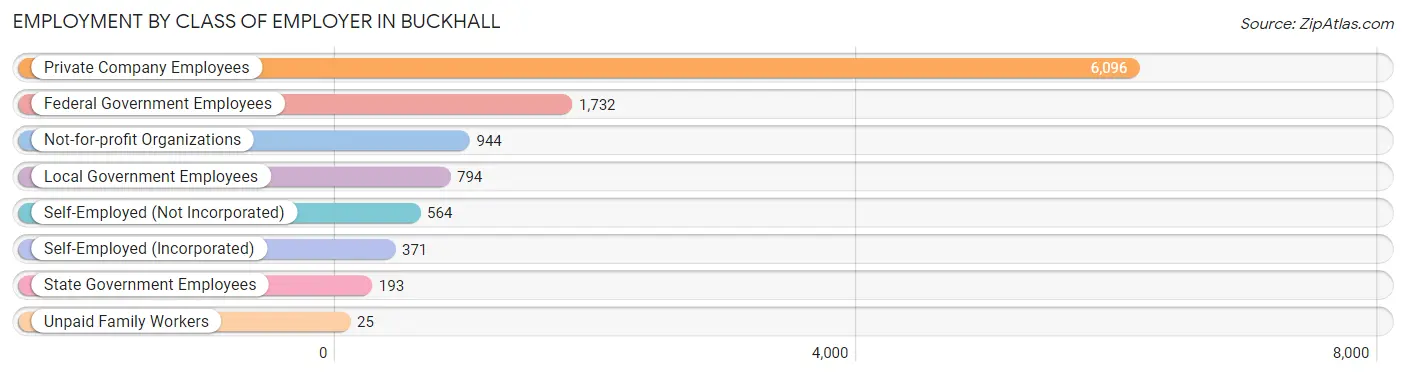
| Employer Class | # Employees | % Employees |
| Private Company Employees | 6,096 | 56.9% |
| Self-Employed (Incorporated) | 371 | 3.5% |
| Self-Employed (Not Incorporated) | 564 | 5.3% |
| Not-for-profit Organizations | 944 | 8.8% |
| Local Government Employees | 794 | 7.4% |
| State Government Employees | 193 | 1.8% |
| Federal Government Employees | 1,732 | 16.2% |
| Unpaid Family Workers | 25 | 0.2% |
| Total | 10,719 | 100.0% |
Employment Status by Age in Buckhall
According to the labor force statistics for Buckhall, out of the total population over 16 years of age (15,812), 71.6% or 11,321 individuals are in the labor force, with 3.6% or 408 of them unemployed. The age group with the highest labor force participation rate is 45 to 54 years, with 90.4% or 2,798 individuals in the labor force. Within the labor force, the 16 to 19 years age range has the highest percentage of unemployed individuals, with 15.3% or 59 of them being unemployed.
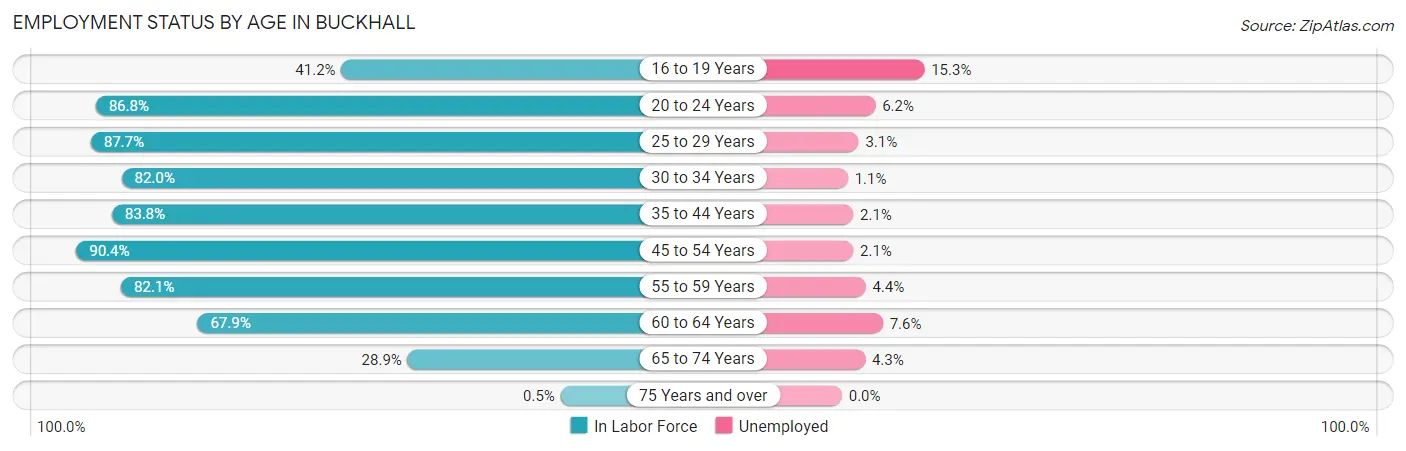
| Age Bracket | In Labor Force | Unemployed |
| 16 to 19 Years | 385 (41.2%) | 59 (15.3%) |
| 20 to 24 Years | 883 (86.8%) | 55 (6.2%) |
| 25 to 29 Years | 1,080 (87.7%) | 33 (3.1%) |
| 30 to 34 Years | 1,087 (82.0%) | 12 (1.1%) |
| 35 to 44 Years | 2,584 (83.8%) | 54 (2.1%) |
| 45 to 54 Years | 2,798 (90.4%) | 59 (2.1%) |
| 55 to 59 Years | 1,284 (82.1%) | 56 (4.4%) |
| 60 to 64 Years | 723 (67.9%) | 55 (7.6%) |
| 65 to 74 Years | 489 (28.9%) | 21 (4.3%) |
| 75 Years and over | 4 (0.5%) | 0 (0.0%) |
| Total | 11,321 (71.6%) | 408 (3.6%) |
Employment Status by Educational Attainment in Buckhall
According to labor force statistics for Buckhall, 84.1% of individuals (9,557) out of the total population between 25 and 64 years of age (11,364) are in the labor force, with 2.8% or 268 of them being unemployed. The group with the highest labor force participation rate are those with the educational attainment of bachelor's degree or higher, with 90.2% or 5,214 individuals in the labor force. Within the labor force, individuals with high school diploma education have the highest percentage of unemployment, with 8.4% or 127 of them being unemployed.
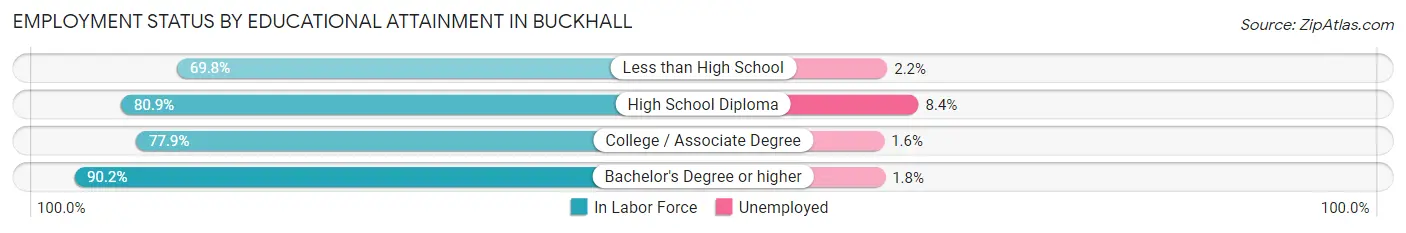
| Educational Attainment | In Labor Force | Unemployed |
| Less than High School | 534 (69.8%) | 17 (2.2%) |
| High School Diploma | 1,506 (80.9%) | 156 (8.4%) |
| College / Associate Degree | 2,304 (77.9%) | 47 (1.6%) |
| Bachelor's Degree or higher | 5,214 (90.2%) | 104 (1.8%) |
| Total | 9,557 (84.1%) | 318 (2.8%) |
Employment Occupations by Sex in Buckhall
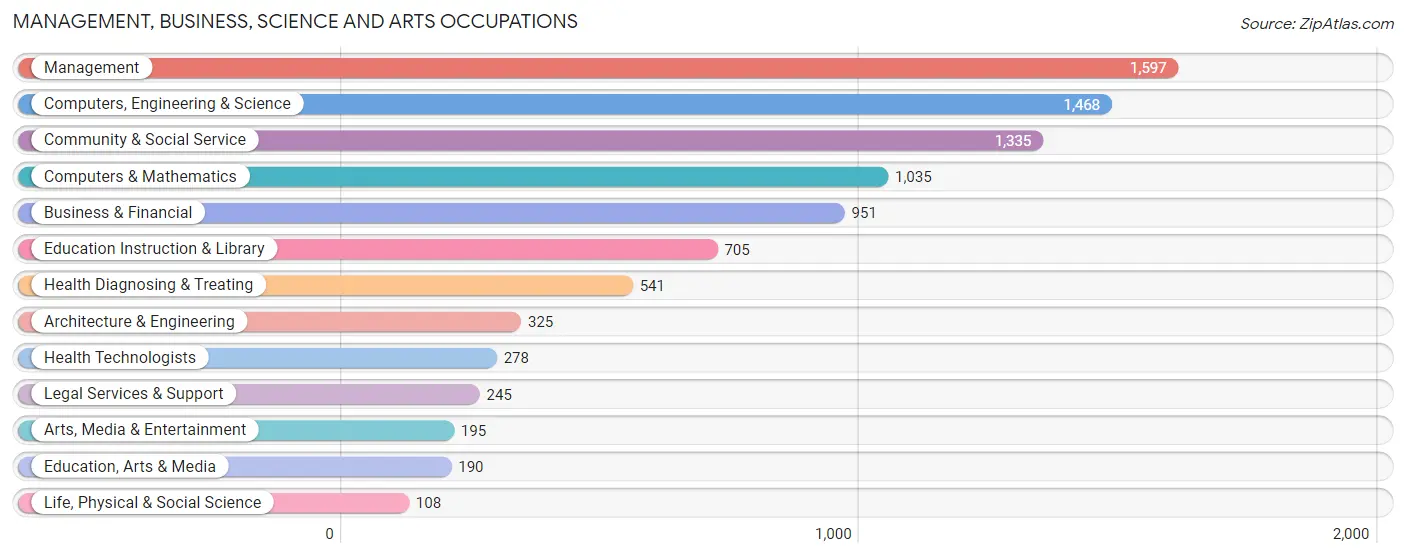
Management, Business, Science and Arts Occupations
The most common Management, Business, Science and Arts occupations in Buckhall are Management (1,597 | 14.7%), Computers, Engineering & Science (1,468 | 13.5%), Community & Social Service (1,335 | 12.3%), Computers & Mathematics (1,035 | 9.5%), and Business & Financial (951 | 8.7%).
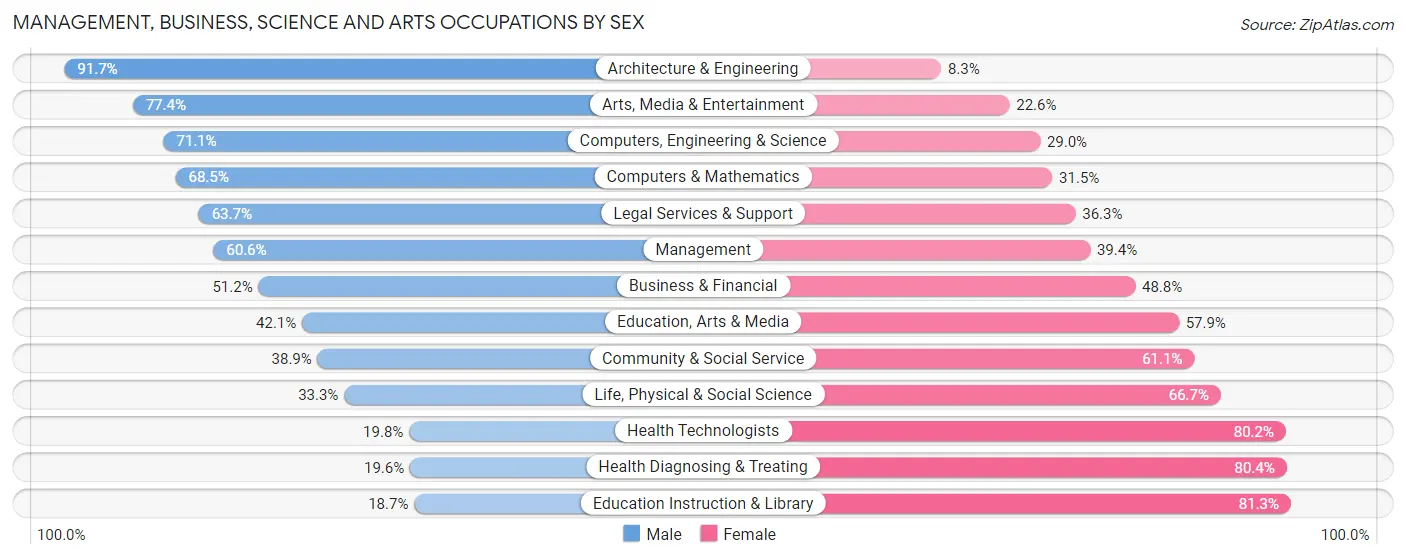
Management, Business, Science and Arts Occupations by Sex
Within the Management, Business, Science and Arts occupations in Buckhall, the most male-oriented occupations are Architecture & Engineering (91.7%), Arts, Media & Entertainment (77.4%), and Computers, Engineering & Science (71.1%), while the most female-oriented occupations are Education Instruction & Library (81.3%), Health Diagnosing & Treating (80.4%), and Health Technologists (80.2%).
| Occupation | Male | Female |
| Management | 968 (60.6%) | 629 (39.4%) |
| Business & Financial | 487 (51.2%) | 464 (48.8%) |
| Computers, Engineering & Science | 1,043 (71.1%) | 425 (28.9%) |
| Computers & Mathematics | 709 (68.5%) | 326 (31.5%) |
| Architecture & Engineering | 298 (91.7%) | 27 (8.3%) |
| Life, Physical & Social Science | 36 (33.3%) | 72 (66.7%) |
| Community & Social Service | 519 (38.9%) | 816 (61.1%) |
| Education, Arts & Media | 80 (42.1%) | 110 (57.9%) |
| Legal Services & Support | 156 (63.7%) | 89 (36.3%) |
| Education Instruction & Library | 132 (18.7%) | 573 (81.3%) |
| Arts, Media & Entertainment | 151 (77.4%) | 44 (22.6%) |
| Health Diagnosing & Treating | 106 (19.6%) | 435 (80.4%) |
| Health Technologists | 55 (19.8%) | 223 (80.2%) |
| Total (Category) | 3,123 (53.0%) | 2,769 (47.0%) |
| Total (Overall) | 6,149 (56.5%) | 4,728 (43.5%) |
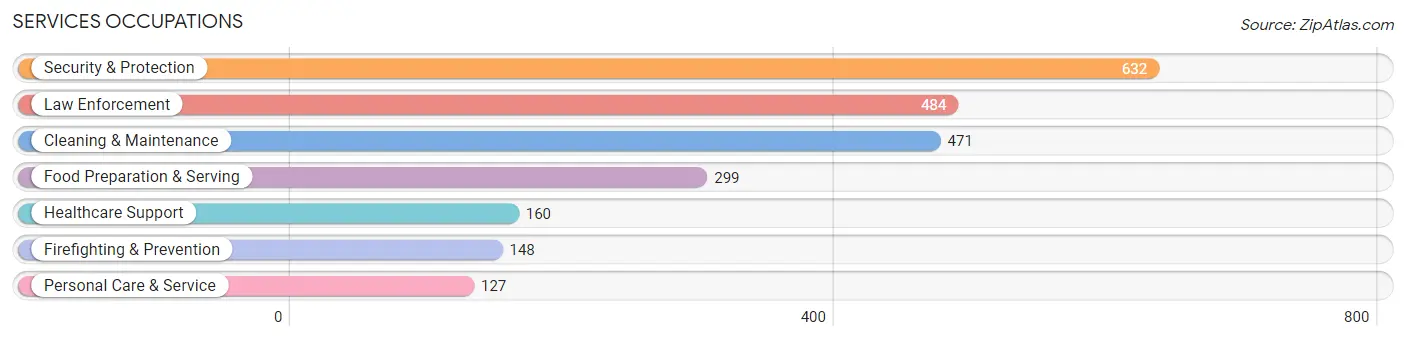
Services Occupations
The most common Services occupations in Buckhall are Security & Protection (632 | 5.8%), Law Enforcement (484 | 4.4%), Cleaning & Maintenance (471 | 4.3%), Food Preparation & Serving (299 | 2.8%), and Healthcare Support (160 | 1.5%).
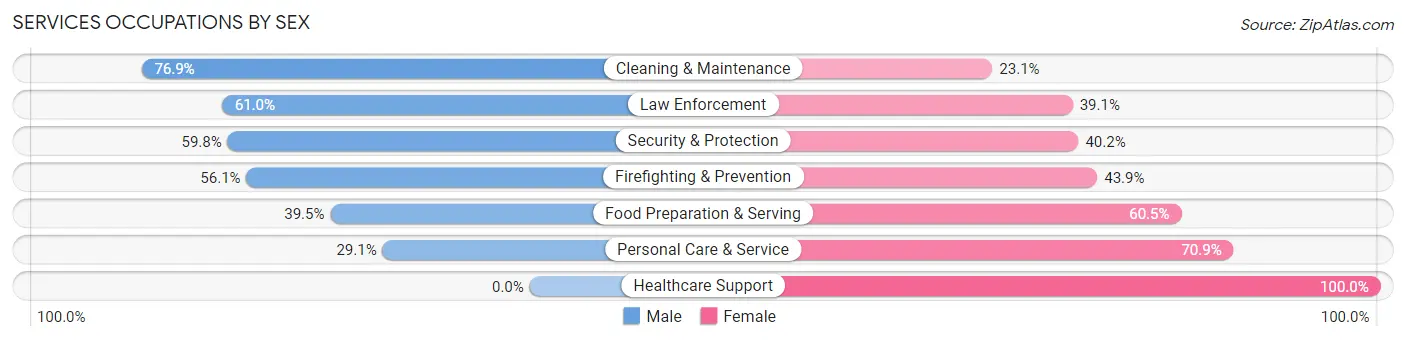
Services Occupations by Sex
Within the Services occupations in Buckhall, the most male-oriented occupations are Cleaning & Maintenance (76.9%), Law Enforcement (61.0%), and Security & Protection (59.8%), while the most female-oriented occupations are Healthcare Support (100.0%), Personal Care & Service (70.9%), and Food Preparation & Serving (60.5%).
| Occupation | Male | Female |
| Healthcare Support | 0 (0.0%) | 160 (100.0%) |
| Security & Protection | 378 (59.8%) | 254 (40.2%) |
| Firefighting & Prevention | 83 (56.1%) | 65 (43.9%) |
| Law Enforcement | 295 (61.0%) | 189 (39.1%) |
| Food Preparation & Serving | 118 (39.5%) | 181 (60.5%) |
| Cleaning & Maintenance | 362 (76.9%) | 109 (23.1%) |
| Personal Care & Service | 37 (29.1%) | 90 (70.9%) |
| Total (Category) | 895 (53.0%) | 794 (47.0%) |
| Total (Overall) | 6,149 (56.5%) | 4,728 (43.5%) |
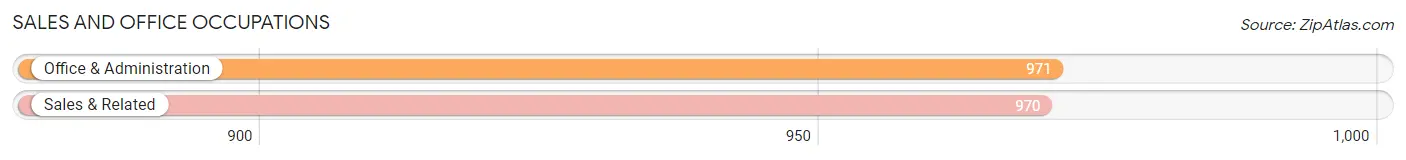
Sales and Office Occupations
The most common Sales and Office occupations in Buckhall are Office & Administration (971 | 8.9%), and Sales & Related (970 | 8.9%).
Sales and Office Occupations by Sex
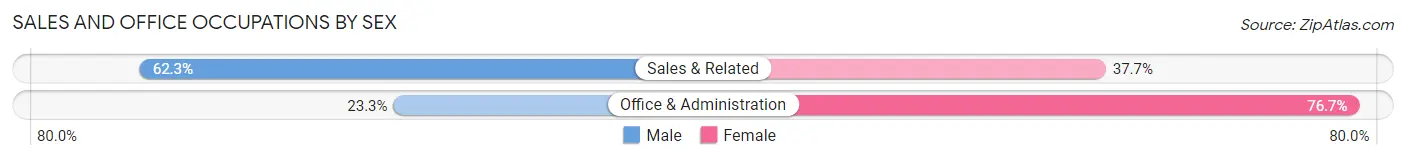
| Occupation | Male | Female |
| Sales & Related | 604 (62.3%) | 366 (37.7%) |
| Office & Administration | 226 (23.3%) | 745 (76.7%) |
| Total (Category) | 830 (42.8%) | 1,111 (57.2%) |
| Total (Overall) | 6,149 (56.5%) | 4,728 (43.5%) |
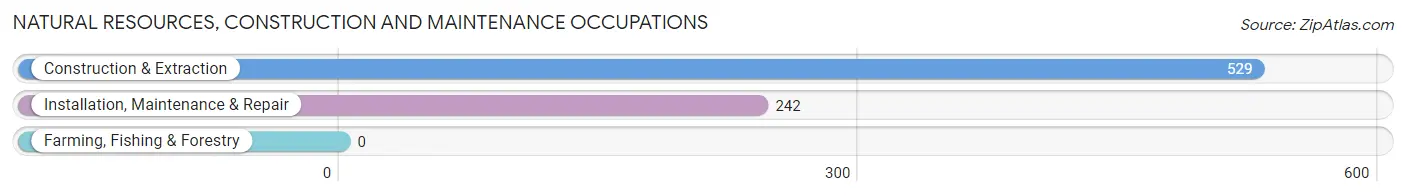
Natural Resources, Construction and Maintenance Occupations
The most common Natural Resources, Construction and Maintenance occupations in Buckhall are Construction & Extraction (529 | 4.9%), and Installation, Maintenance & Repair (242 | 2.2%).
Natural Resources, Construction and Maintenance Occupations by Sex
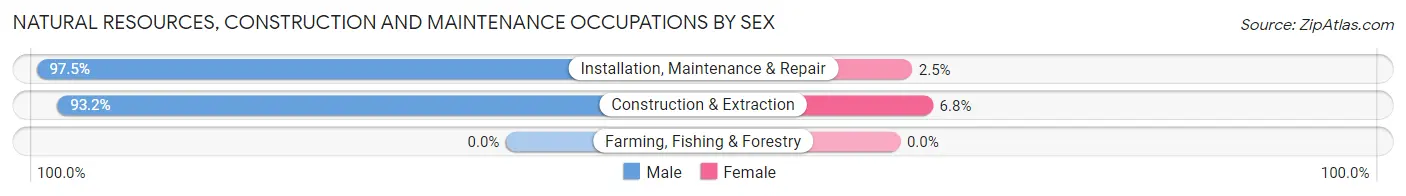
| Occupation | Male | Female |
| Farming, Fishing & Forestry | 0 (0.0%) | 0 (0.0%) |
| Construction & Extraction | 493 (93.2%) | 36 (6.8%) |
| Installation, Maintenance & Repair | 236 (97.5%) | 6 (2.5%) |
| Total (Category) | 729 (94.6%) | 42 (5.4%) |
| Total (Overall) | 6,149 (56.5%) | 4,728 (43.5%) |
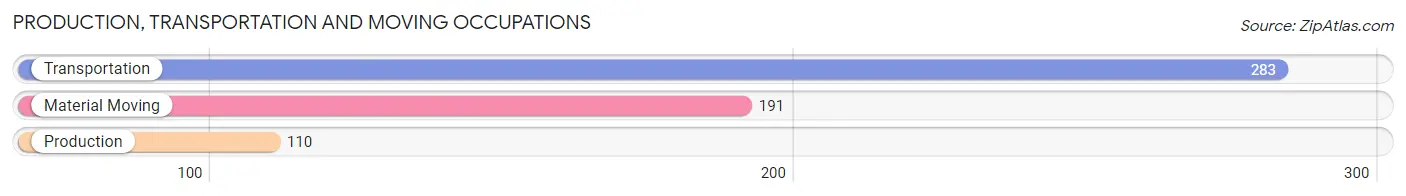
Production, Transportation and Moving Occupations
The most common Production, Transportation and Moving occupations in Buckhall are Transportation (283 | 2.6%), Material Moving (191 | 1.8%), and Production (110 | 1.0%).
Production, Transportation and Moving Occupations by Sex
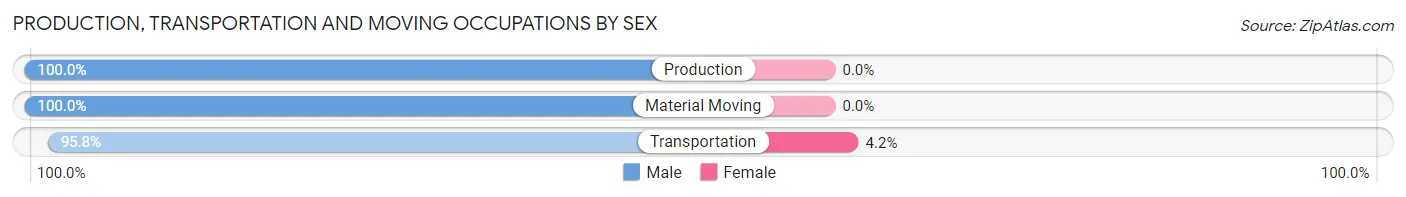
| Occupation | Male | Female |
| Production | 110 (100.0%) | 0 (0.0%) |
| Transportation | 271 (95.8%) | 12 (4.2%) |
| Material Moving | 191 (100.0%) | 0 (0.0%) |
| Total (Category) | 572 (98.0%) | 12 (2.1%) |
| Total (Overall) | 6,149 (56.5%) | 4,728 (43.5%) |
Employment Industries by Sex in Buckhall
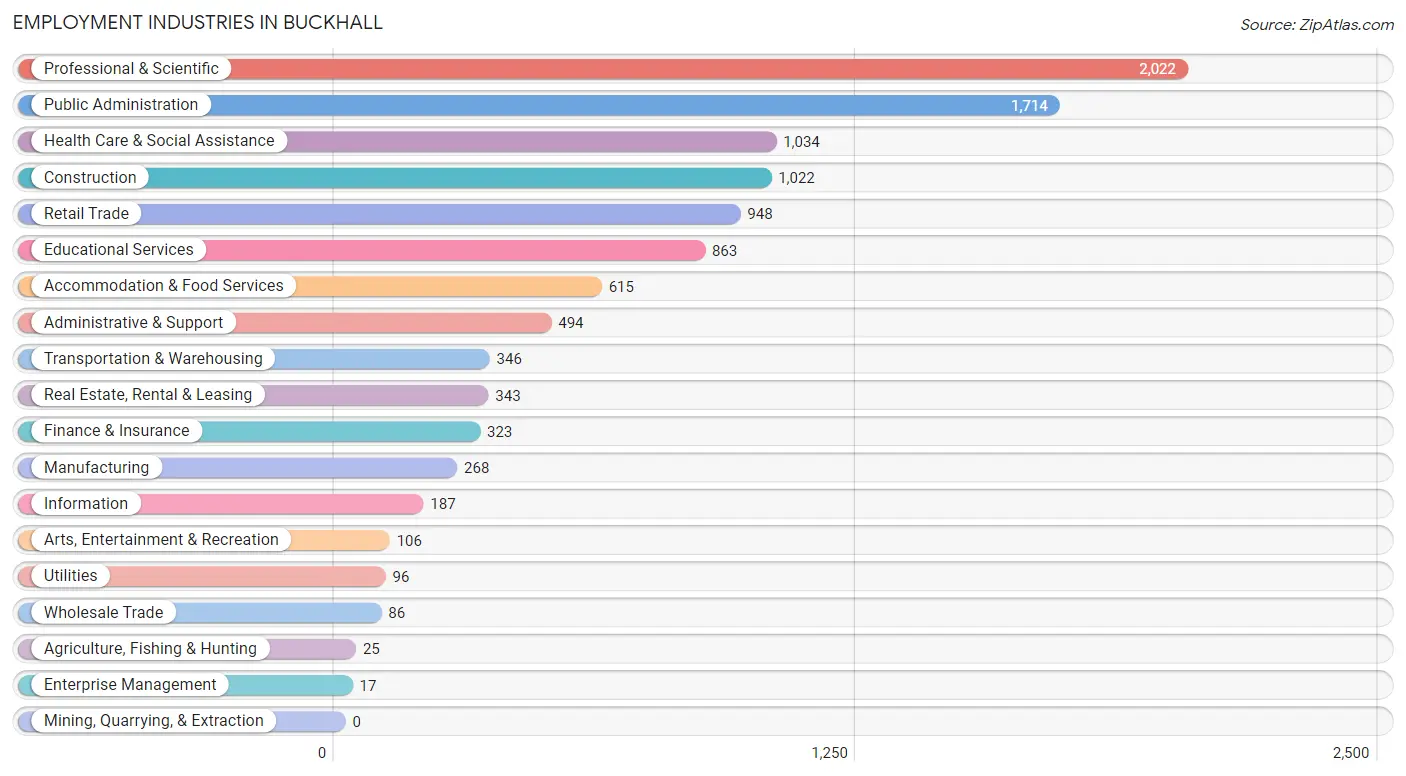
Employment Industries in Buckhall
The major employment industries in Buckhall include Professional & Scientific (2,022 | 18.6%), Public Administration (1,714 | 15.8%), Health Care & Social Assistance (1,034 | 9.5%), Construction (1,022 | 9.4%), and Retail Trade (948 | 8.7%).
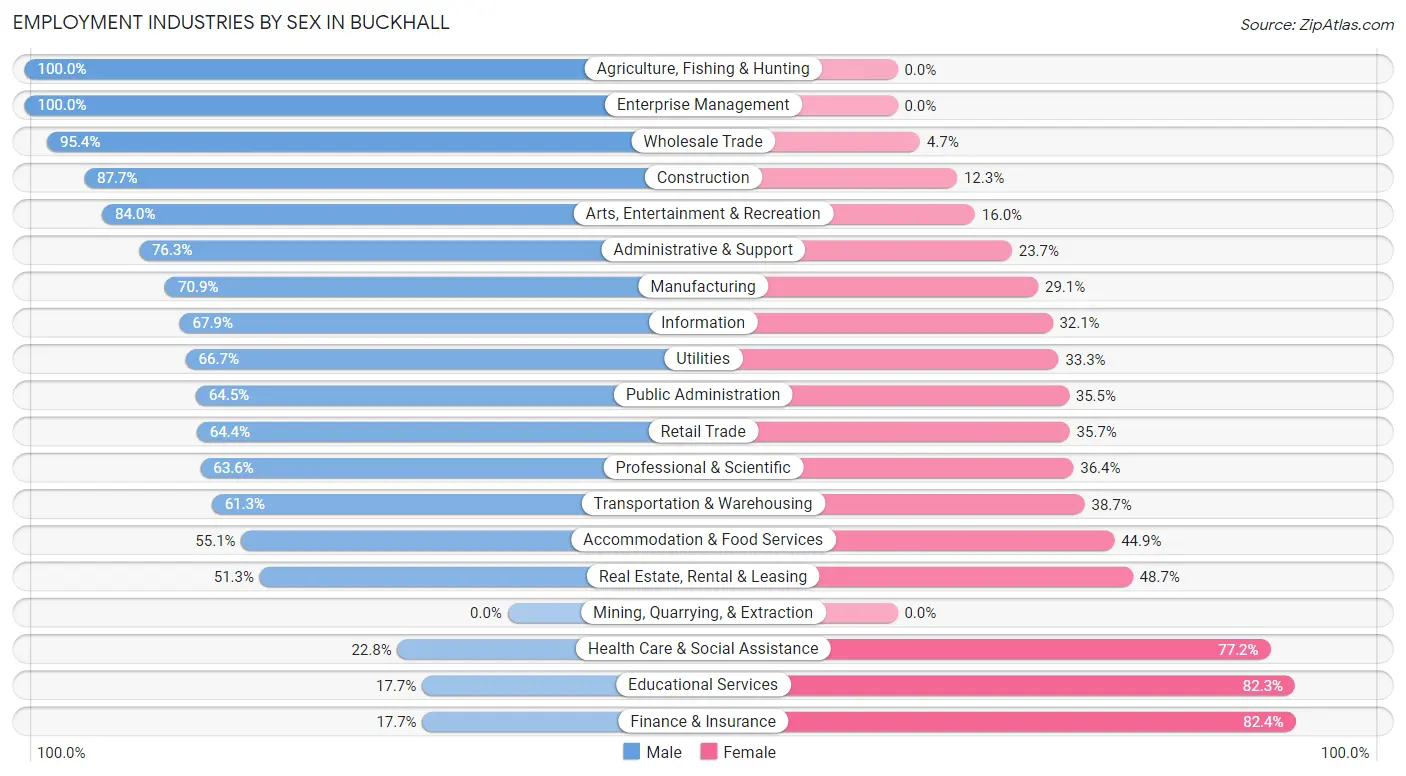
Employment Industries by Sex in Buckhall
The Buckhall industries that see more men than women are Agriculture, Fishing & Hunting (100.0%), Enterprise Management (100.0%), and Wholesale Trade (95.4%), whereas the industries that tend to have a higher number of women are Finance & Insurance (82.4%), Educational Services (82.3%), and Health Care & Social Assistance (77.2%).
| Industry | Male | Female |
| Agriculture, Fishing & Hunting | 25 (100.0%) | 0 (0.0%) |
| Mining, Quarrying, & Extraction | 0 (0.0%) | 0 (0.0%) |
| Construction | 896 (87.7%) | 126 (12.3%) |
| Manufacturing | 190 (70.9%) | 78 (29.1%) |
| Wholesale Trade | 82 (95.4%) | 4 (4.6%) |
| Retail Trade | 610 (64.3%) | 338 (35.6%) |
| Transportation & Warehousing | 212 (61.3%) | 134 (38.7%) |
| Utilities | 64 (66.7%) | 32 (33.3%) |
| Information | 127 (67.9%) | 60 (32.1%) |
| Finance & Insurance | 57 (17.6%) | 266 (82.4%) |
| Real Estate, Rental & Leasing | 176 (51.3%) | 167 (48.7%) |
| Professional & Scientific | 1,286 (63.6%) | 736 (36.4%) |
| Enterprise Management | 17 (100.0%) | 0 (0.0%) |
| Administrative & Support | 377 (76.3%) | 117 (23.7%) |
| Educational Services | 153 (17.7%) | 710 (82.3%) |
| Health Care & Social Assistance | 236 (22.8%) | 798 (77.2%) |
| Arts, Entertainment & Recreation | 89 (84.0%) | 17 (16.0%) |
| Accommodation & Food Services | 339 (55.1%) | 276 (44.9%) |
| Public Administration | 1,106 (64.5%) | 608 (35.5%) |
| Total | 6,149 (56.5%) | 4,728 (43.5%) |
Education in Buckhall
School Enrollment in Buckhall
The most common levels of schooling among the 4,971 students in Buckhall are elementary school (1,075 | 21.6%), middle school (1,051 | 21.1%), and high school (963 | 19.4%).
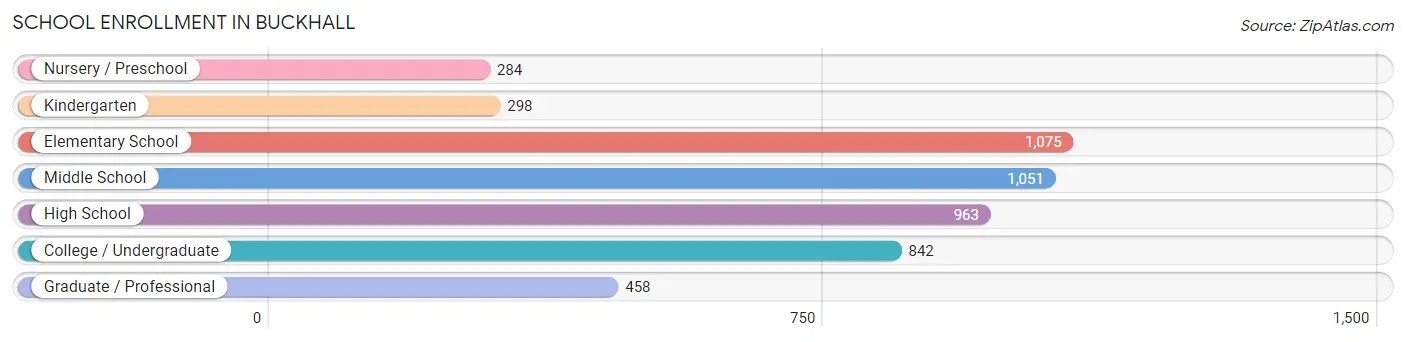
| School Level | # Students | % Students |
| Nursery / Preschool | 284 | 5.7% |
| Kindergarten | 298 | 6.0% |
| Elementary School | 1,075 | 21.6% |
| Middle School | 1,051 | 21.1% |
| High School | 963 | 19.4% |
| College / Undergraduate | 842 | 16.9% |
| Graduate / Professional | 458 | 9.2% |
| Total | 4,971 | 100.0% |
School Enrollment by Age by Funding Source in Buckhall
Out of a total of 4,971 students who are enrolled in schools in Buckhall, 1,099 (22.1%) attend a private institution, while the remaining 3,872 (77.9%) are enrolled in public schools. The age group of 3 to 4 year olds has the highest likelihood of being enrolled in private schools, with 167 (61.0% in the age bracket) enrolled. Conversely, the age group of 20 to 24 year olds has the lowest likelihood of being enrolled in a private school, with 241 (96.8% in the age bracket) attending a public institution.
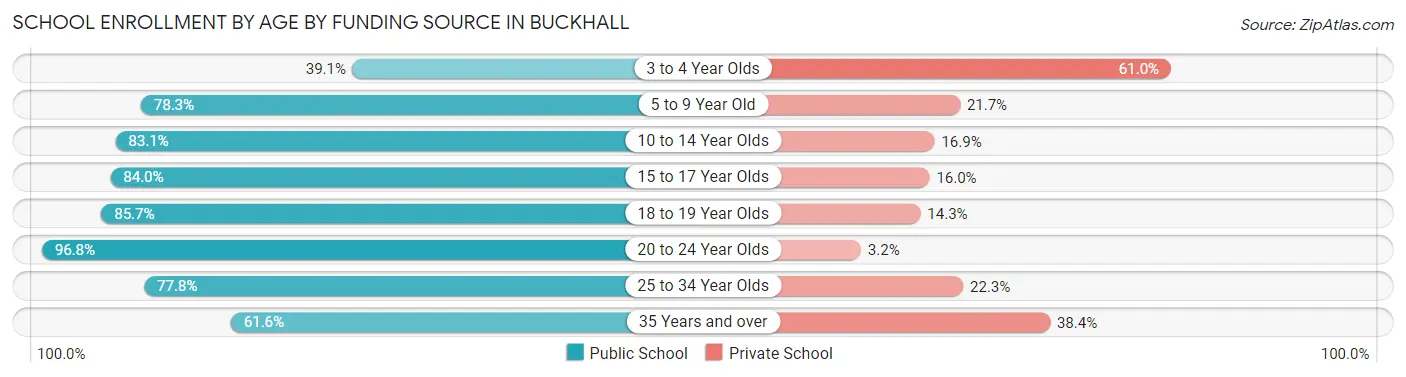
| Age Bracket | Public School | Private School |
| 3 to 4 Year Olds | 107 (39.1%) | 167 (61.0%) |
| 5 to 9 Year Old | 944 (78.3%) | 261 (21.7%) |
| 10 to 14 Year Olds | 1,080 (83.1%) | 220 (16.9%) |
| 15 to 17 Year Olds | 673 (84.0%) | 128 (16.0%) |
| 18 to 19 Year Olds | 222 (85.7%) | 37 (14.3%) |
| 20 to 24 Year Olds | 241 (96.8%) | 8 (3.2%) |
| 25 to 34 Year Olds | 290 (77.7%) | 83 (22.3%) |
| 35 Years and over | 314 (61.6%) | 196 (38.4%) |
| Total | 3,872 (77.9%) | 1,099 (22.1%) |
Educational Attainment by Field of Study in Buckhall
Business (1,286 | 17.2%), computers & mathematics (749 | 10.0%), social sciences (732 | 9.8%), science & technology (694 | 9.3%), and engineering (693 | 9.2%) are the most common fields of study among 7,489 individuals in Buckhall who have obtained a bachelor's degree or higher.
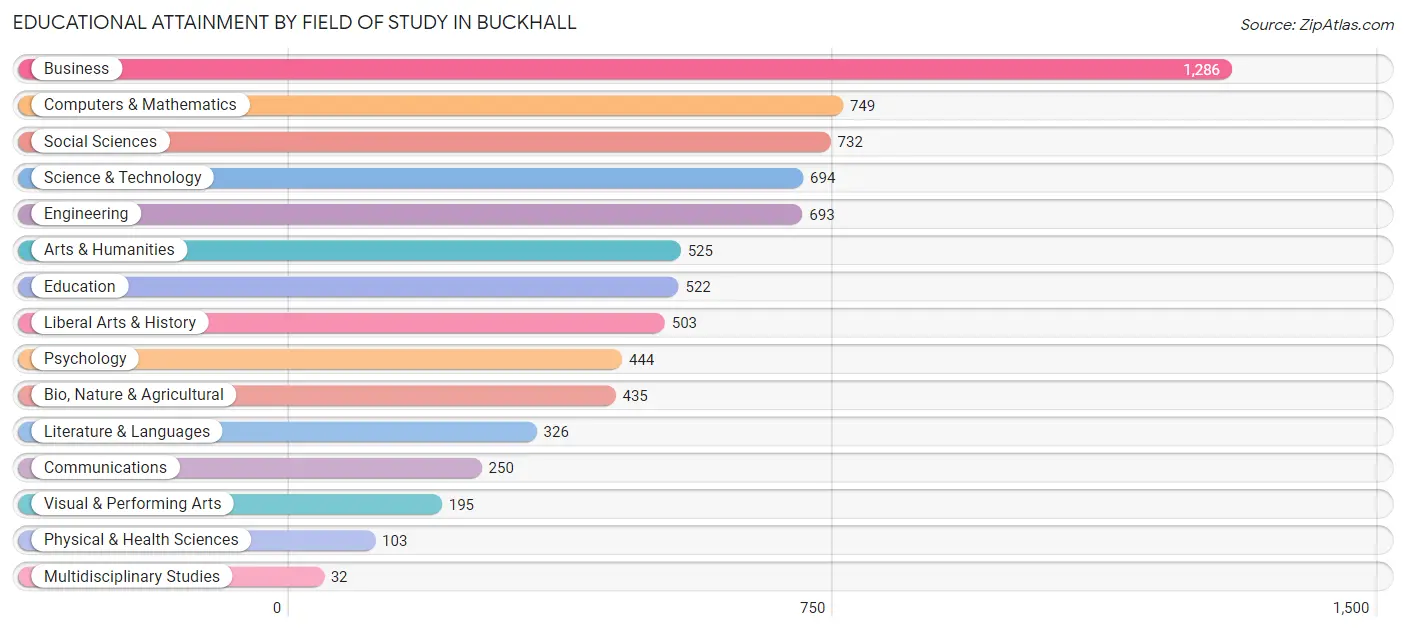
| Field of Study | # Graduates | % Graduates |
| Computers & Mathematics | 749 | 10.0% |
| Bio, Nature & Agricultural | 435 | 5.8% |
| Physical & Health Sciences | 103 | 1.4% |
| Psychology | 444 | 5.9% |
| Social Sciences | 732 | 9.8% |
| Engineering | 693 | 9.2% |
| Multidisciplinary Studies | 32 | 0.4% |
| Science & Technology | 694 | 9.3% |
| Business | 1,286 | 17.2% |
| Education | 522 | 7.0% |
| Literature & Languages | 326 | 4.3% |
| Liberal Arts & History | 503 | 6.7% |
| Visual & Performing Arts | 195 | 2.6% |
| Communications | 250 | 3.3% |
| Arts & Humanities | 525 | 7.0% |
| Total | 7,489 | 100.0% |
Transportation & Commute in Buckhall
Vehicle Availability by Sex in Buckhall
The most prevalent vehicle ownership categories in Buckhall are males with 2 vehicles (2,209, accounting for 36.2%) and females with 2 vehicles (1,784, making up 47.8%).
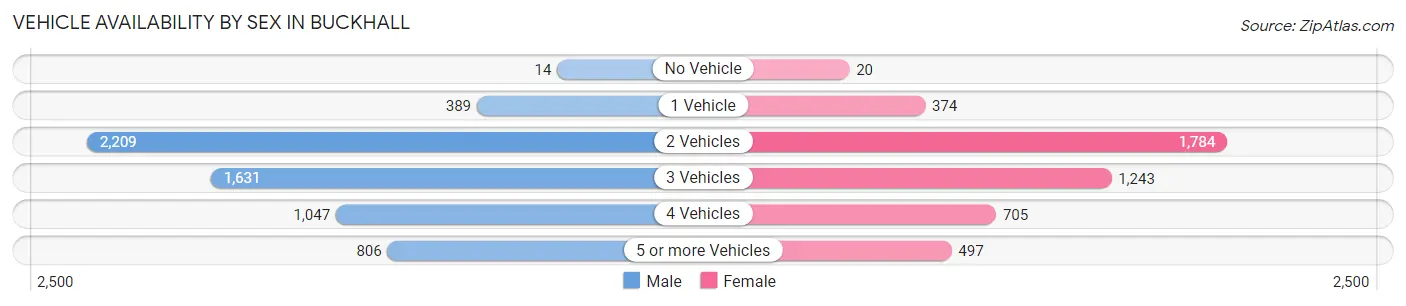
| Vehicles Available | Male | Female |
| No Vehicle | 14 (0.2%) | 20 (0.4%) |
| 1 Vehicle | 389 (6.4%) | 374 (8.1%) |
| 2 Vehicles | 2,209 (36.2%) | 1,784 (38.6%) |
| 3 Vehicles | 1,631 (26.8%) | 1,243 (26.9%) |
| 4 Vehicles | 1,047 (17.2%) | 705 (15.2%) |
| 5 or more Vehicles | 806 (13.2%) | 497 (10.7%) |
| Total | 6,096 (100.0%) | 4,623 (100.0%) |
Commute Time in Buckhall
The most frequently occuring commute durations in Buckhall are 60 to 89 minutes (1,780 commuters, 20.8%), 45 to 59 minutes (1,578 commuters, 18.4%), and 30 to 34 minutes (1,433 commuters, 16.7%).
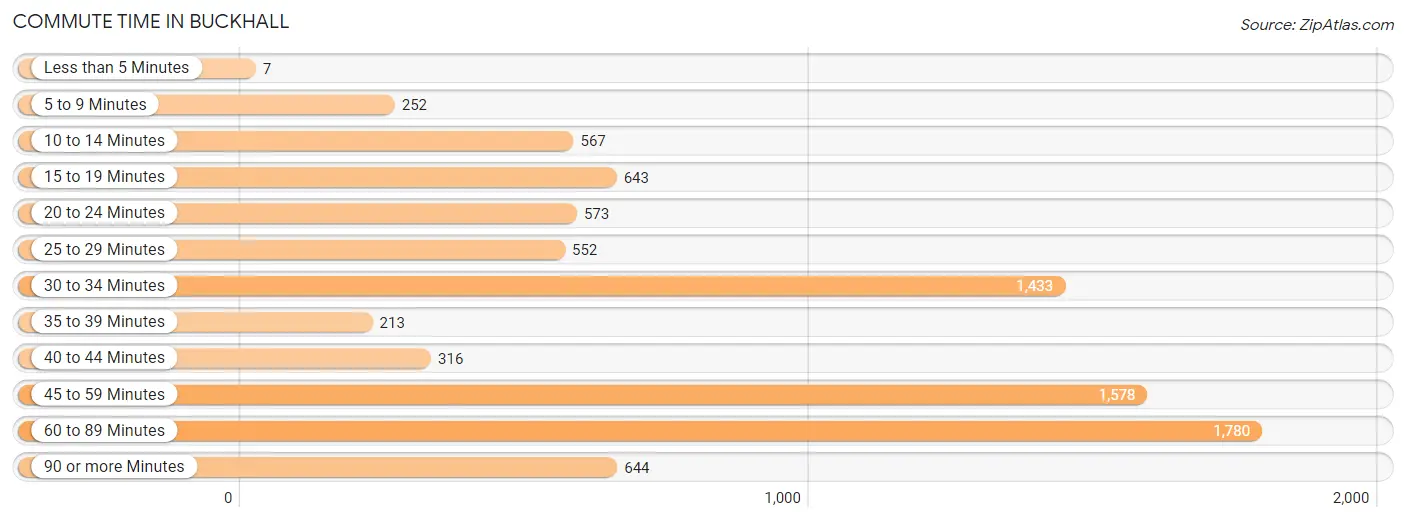
| Commute Time | # Commuters | % Commuters |
| Less than 5 Minutes | 7 | 0.1% |
| 5 to 9 Minutes | 252 | 2.9% |
| 10 to 14 Minutes | 567 | 6.6% |
| 15 to 19 Minutes | 643 | 7.5% |
| 20 to 24 Minutes | 573 | 6.7% |
| 25 to 29 Minutes | 552 | 6.5% |
| 30 to 34 Minutes | 1,433 | 16.7% |
| 35 to 39 Minutes | 213 | 2.5% |
| 40 to 44 Minutes | 316 | 3.7% |
| 45 to 59 Minutes | 1,578 | 18.4% |
| 60 to 89 Minutes | 1,780 | 20.8% |
| 90 or more Minutes | 644 | 7.5% |
Commute Time by Sex in Buckhall
The most common commute times in Buckhall are 60 to 89 minutes (1,038 commuters, 20.2%) for males and 60 to 89 minutes (742 commuters, 21.8%) for females.
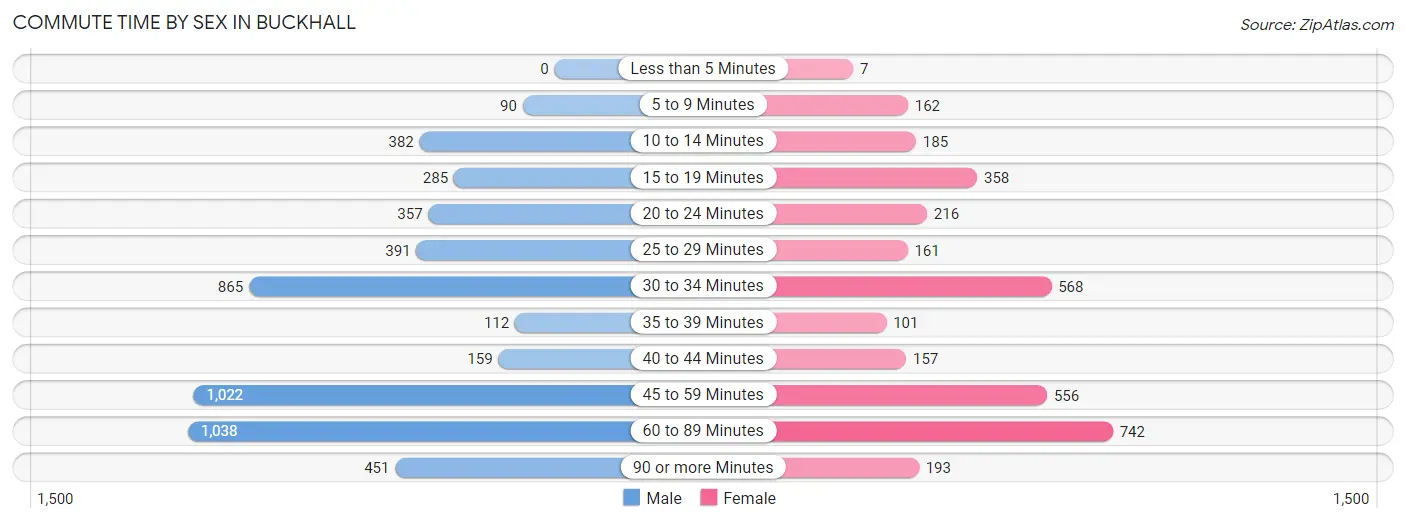
| Commute Time | Male | Female |
| Less than 5 Minutes | 0 (0.0%) | 7 (0.2%) |
| 5 to 9 Minutes | 90 (1.8%) | 162 (4.8%) |
| 10 to 14 Minutes | 382 (7.4%) | 185 (5.4%) |
| 15 to 19 Minutes | 285 (5.5%) | 358 (10.5%) |
| 20 to 24 Minutes | 357 (6.9%) | 216 (6.3%) |
| 25 to 29 Minutes | 391 (7.6%) | 161 (4.7%) |
| 30 to 34 Minutes | 865 (16.8%) | 568 (16.7%) |
| 35 to 39 Minutes | 112 (2.2%) | 101 (3.0%) |
| 40 to 44 Minutes | 159 (3.1%) | 157 (4.6%) |
| 45 to 59 Minutes | 1,022 (19.8%) | 556 (16.3%) |
| 60 to 89 Minutes | 1,038 (20.2%) | 742 (21.8%) |
| 90 or more Minutes | 451 (8.7%) | 193 (5.7%) |
Time of Departure to Work by Sex in Buckhall
The most frequent times of departure to work in Buckhall are 7:30 AM to 7:59 AM (772, 15.0%) for males and 6:00 AM to 6:29 AM (579, 17.0%) for females.
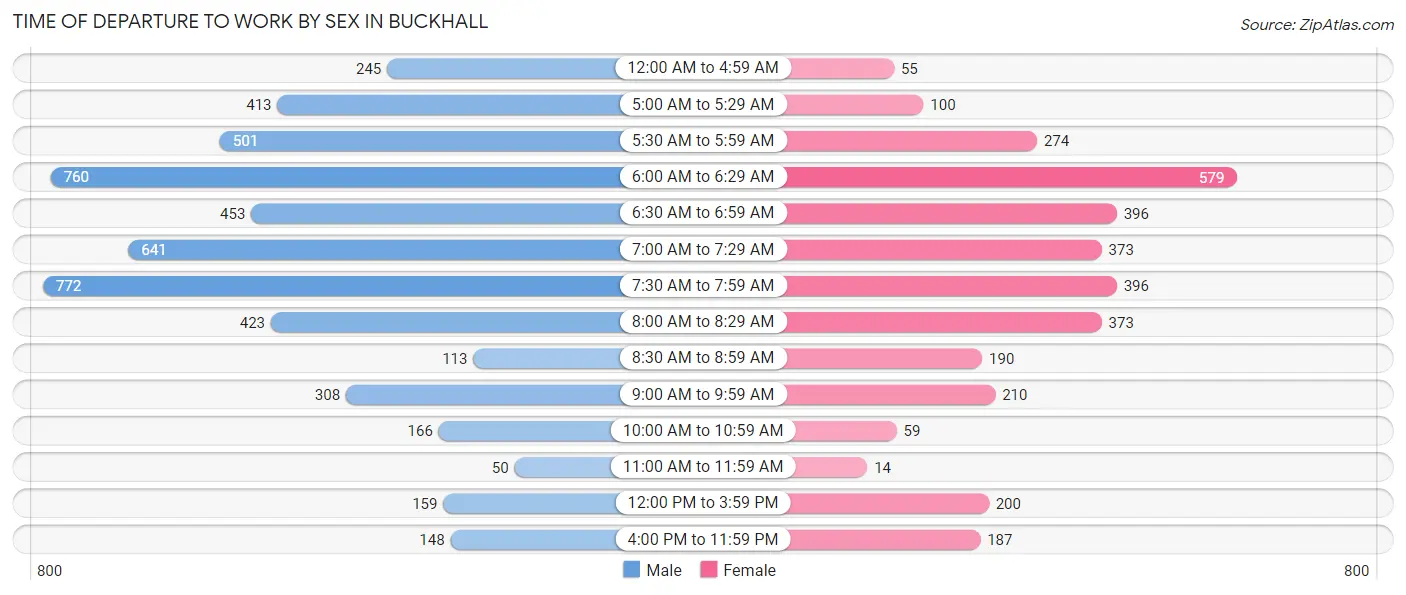
| Time of Departure | Male | Female |
| 12:00 AM to 4:59 AM | 245 (4.8%) | 55 (1.6%) |
| 5:00 AM to 5:29 AM | 413 (8.0%) | 100 (2.9%) |
| 5:30 AM to 5:59 AM | 501 (9.7%) | 274 (8.0%) |
| 6:00 AM to 6:29 AM | 760 (14.7%) | 579 (17.0%) |
| 6:30 AM to 6:59 AM | 453 (8.8%) | 396 (11.6%) |
| 7:00 AM to 7:29 AM | 641 (12.4%) | 373 (11.0%) |
| 7:30 AM to 7:59 AM | 772 (15.0%) | 396 (11.6%) |
| 8:00 AM to 8:29 AM | 423 (8.2%) | 373 (11.0%) |
| 8:30 AM to 8:59 AM | 113 (2.2%) | 190 (5.6%) |
| 9:00 AM to 9:59 AM | 308 (6.0%) | 210 (6.2%) |
| 10:00 AM to 10:59 AM | 166 (3.2%) | 59 (1.7%) |
| 11:00 AM to 11:59 AM | 50 (1.0%) | 14 (0.4%) |
| 12:00 PM to 3:59 PM | 159 (3.1%) | 200 (5.9%) |
| 4:00 PM to 11:59 PM | 148 (2.9%) | 187 (5.5%) |
| Total | 5,152 (100.0%) | 3,406 (100.0%) |
Housing Occupancy in Buckhall
Occupancy by Ownership in Buckhall
Of the total 6,270 dwellings in Buckhall, owner-occupied units account for 5,424 (86.5%), while renter-occupied units make up 846 (13.5%).
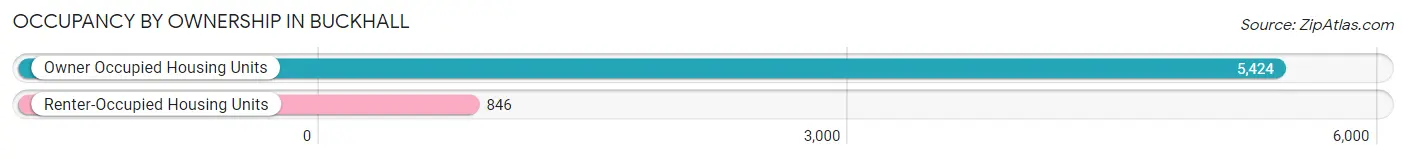
| Occupancy | # Housing Units | % Housing Units |
| Owner Occupied Housing Units | 5,424 | 86.5% |
| Renter-Occupied Housing Units | 846 | 13.5% |
| Total Occupied Housing Units | 6,270 | 100.0% |
Occupancy by Household Size in Buckhall
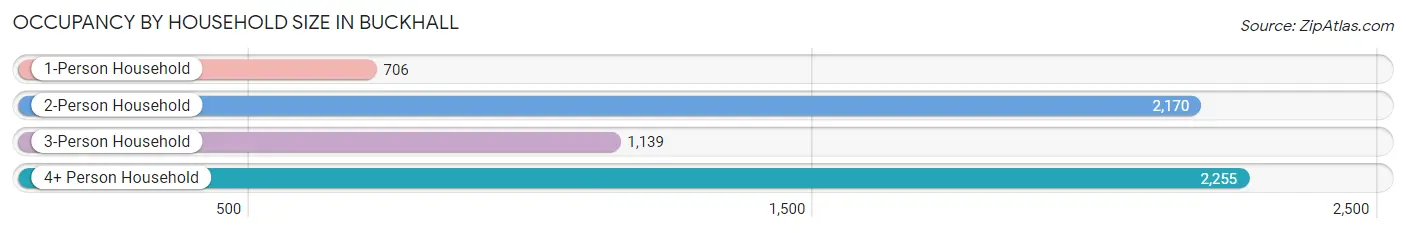
| Household Size | # Housing Units | % Housing Units |
| 1-Person Household | 706 | 11.3% |
| 2-Person Household | 2,170 | 34.6% |
| 3-Person Household | 1,139 | 18.2% |
| 4+ Person Household | 2,255 | 36.0% |
| Total Housing Units | 6,270 | 100.0% |
Occupancy by Ownership by Household Size in Buckhall
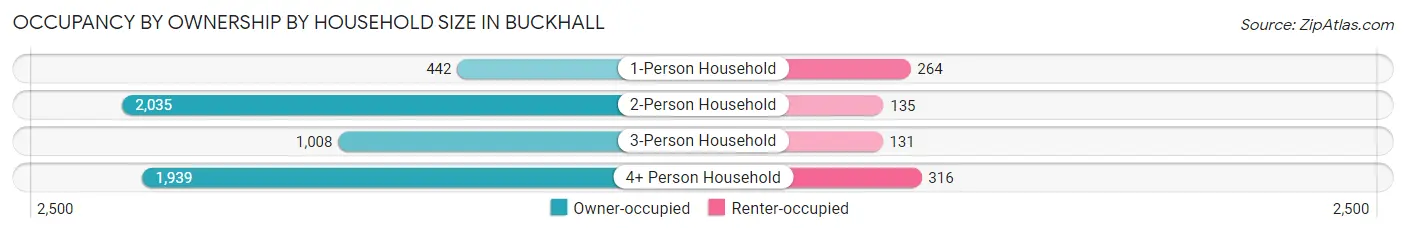
| Household Size | Owner-occupied | Renter-occupied |
| 1-Person Household | 442 (62.6%) | 264 (37.4%) |
| 2-Person Household | 2,035 (93.8%) | 135 (6.2%) |
| 3-Person Household | 1,008 (88.5%) | 131 (11.5%) |
| 4+ Person Household | 1,939 (86.0%) | 316 (14.0%) |
| Total Housing Units | 5,424 (86.5%) | 846 (13.5%) |
Occupancy by Educational Attainment in Buckhall
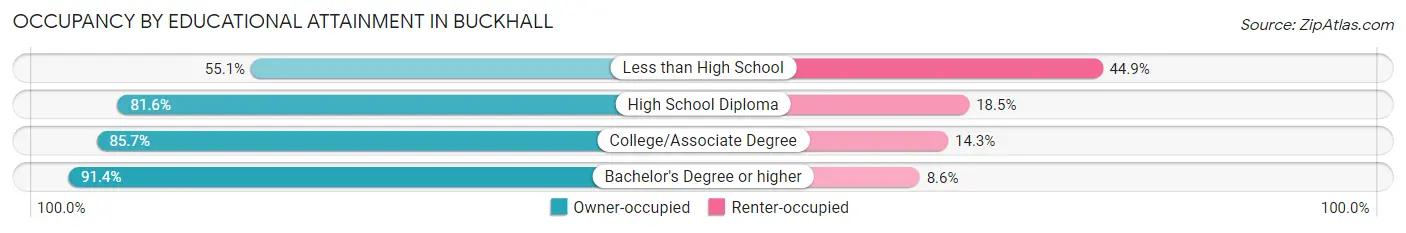
| Household Size | Owner-occupied | Renter-occupied |
| Less than High School | 242 (55.1%) | 197 (44.9%) |
| High School Diploma | 526 (81.6%) | 119 (18.4%) |
| College/Associate Degree | 1,257 (85.7%) | 209 (14.3%) |
| Bachelor's Degree or higher | 3,399 (91.4%) | 321 (8.6%) |
Occupancy by Age of Householder in Buckhall
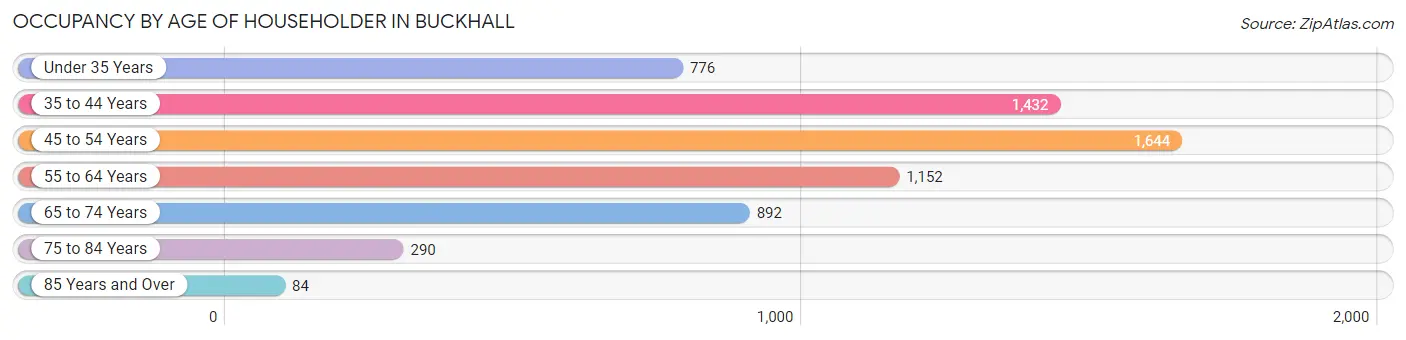
| Age Bracket | # Households | % Households |
| Under 35 Years | 776 | 12.4% |
| 35 to 44 Years | 1,432 | 22.8% |
| 45 to 54 Years | 1,644 | 26.2% |
| 55 to 64 Years | 1,152 | 18.4% |
| 65 to 74 Years | 892 | 14.2% |
| 75 to 84 Years | 290 | 4.6% |
| 85 Years and Over | 84 | 1.3% |
| Total | 6,270 | 100.0% |
Housing Finances in Buckhall
Median Income by Occupancy in Buckhall
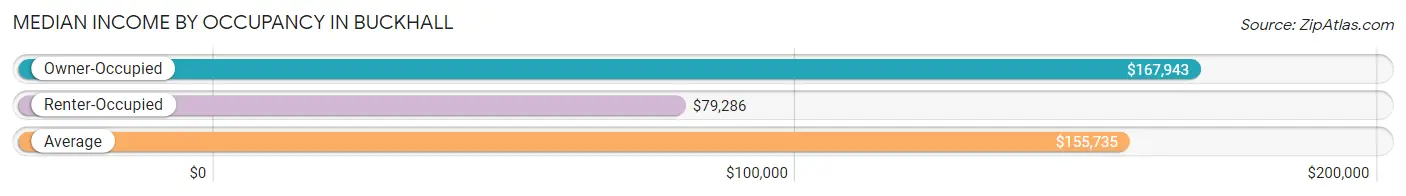
| Occupancy Type | # Households | Median Income |
| Owner-Occupied | 5,424 (86.5%) | $167,943 |
| Renter-Occupied | 846 (13.5%) | $79,286 |
| Average | 6,270 (100.0%) | $155,735 |
Occupancy by Householder Income Bracket in Buckhall
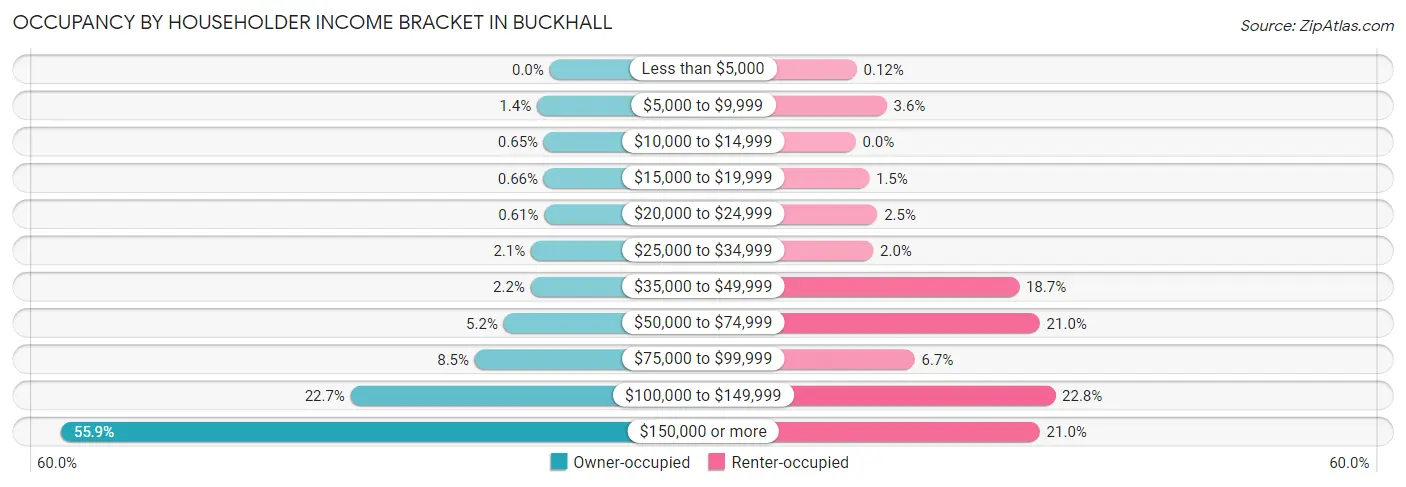
| Income Bracket | Owner-occupied | Renter-occupied |
| Less than $5,000 | 0 (0.0%) | 1 (0.1%) |
| $5,000 to $9,999 | 78 (1.4%) | 30 (3.5%) |
| $10,000 to $14,999 | 35 (0.6%) | 0 (0.0%) |
| $15,000 to $19,999 | 36 (0.7%) | 13 (1.5%) |
| $20,000 to $24,999 | 33 (0.6%) | 21 (2.5%) |
| $25,000 to $34,999 | 115 (2.1%) | 17 (2.0%) |
| $35,000 to $49,999 | 117 (2.2%) | 158 (18.7%) |
| $50,000 to $74,999 | 284 (5.2%) | 178 (21.0%) |
| $75,000 to $99,999 | 463 (8.5%) | 57 (6.7%) |
| $100,000 to $149,999 | 1,233 (22.7%) | 193 (22.8%) |
| $150,000 or more | 3,030 (55.9%) | 178 (21.0%) |
| Total | 5,424 (100.0%) | 846 (100.0%) |
Monthly Housing Cost Tiers in Buckhall
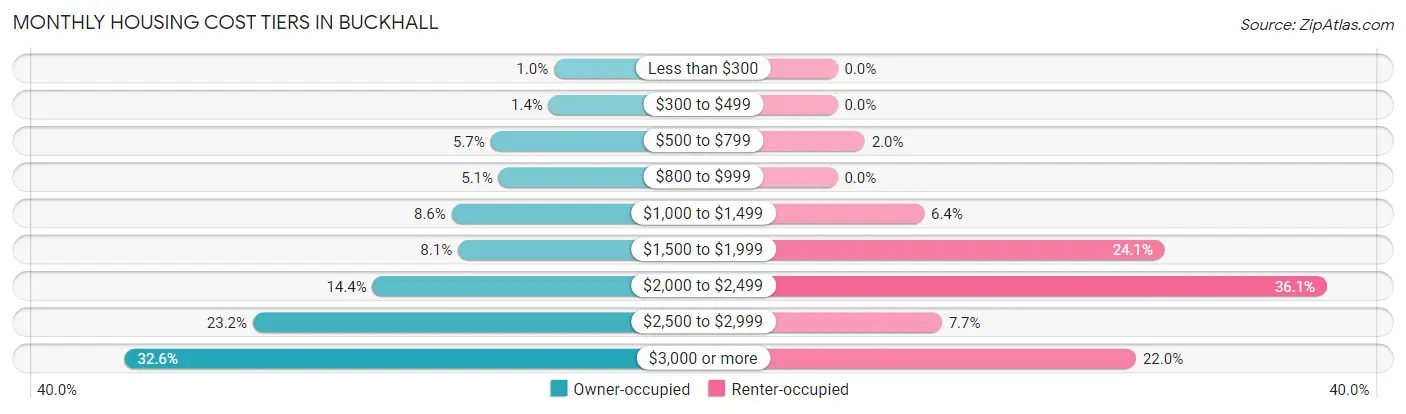
| Monthly Cost | Owner-occupied | Renter-occupied |
| Less than $300 | 55 (1.0%) | 0 (0.0%) |
| $300 to $499 | 76 (1.4%) | 0 (0.0%) |
| $500 to $799 | 308 (5.7%) | 17 (2.0%) |
| $800 to $999 | 275 (5.1%) | 0 (0.0%) |
| $1,000 to $1,499 | 464 (8.6%) | 54 (6.4%) |
| $1,500 to $1,999 | 438 (8.1%) | 204 (24.1%) |
| $2,000 to $2,499 | 780 (14.4%) | 305 (36.0%) |
| $2,500 to $2,999 | 1,258 (23.2%) | 65 (7.7%) |
| $3,000 or more | 1,770 (32.6%) | 186 (22.0%) |
| Total | 5,424 (100.0%) | 846 (100.0%) |
Physical Housing Characteristics in Buckhall
Housing Structures in Buckhall
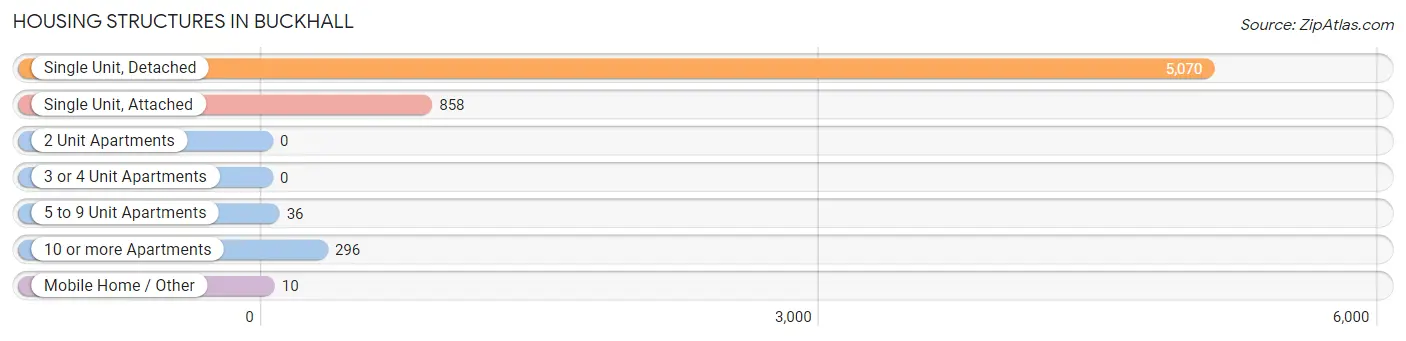
| Structure Type | # Housing Units | % Housing Units |
| Single Unit, Detached | 5,070 | 80.9% |
| Single Unit, Attached | 858 | 13.7% |
| 2 Unit Apartments | 0 | 0.0% |
| 3 or 4 Unit Apartments | 0 | 0.0% |
| 5 to 9 Unit Apartments | 36 | 0.6% |
| 10 or more Apartments | 296 | 4.7% |
| Mobile Home / Other | 10 | 0.2% |
| Total | 6,270 | 100.0% |
Housing Structures by Occupancy in Buckhall
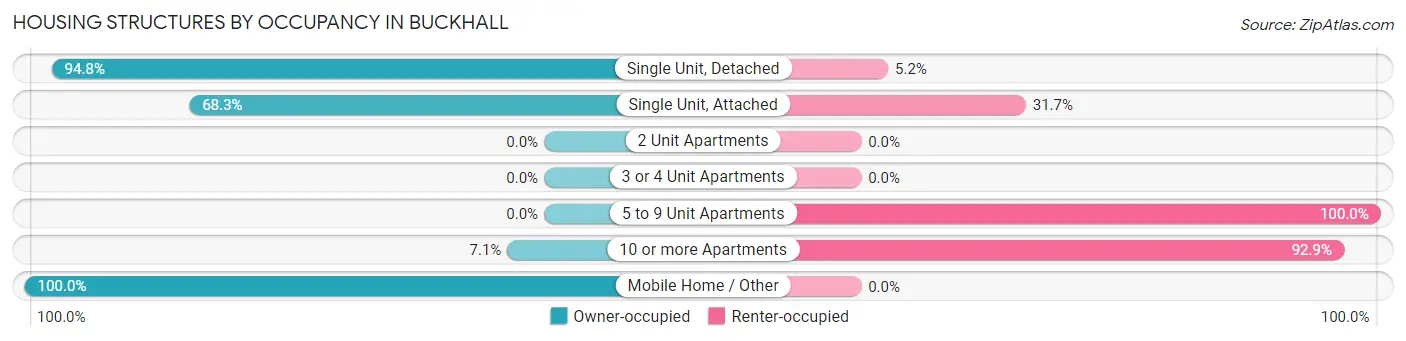
| Structure Type | Owner-occupied | Renter-occupied |
| Single Unit, Detached | 4,807 (94.8%) | 263 (5.2%) |
| Single Unit, Attached | 586 (68.3%) | 272 (31.7%) |
| 2 Unit Apartments | 0 (0.0%) | 0 (0.0%) |
| 3 or 4 Unit Apartments | 0 (0.0%) | 0 (0.0%) |
| 5 to 9 Unit Apartments | 0 (0.0%) | 36 (100.0%) |
| 10 or more Apartments | 21 (7.1%) | 275 (92.9%) |
| Mobile Home / Other | 10 (100.0%) | 0 (0.0%) |
| Total | 5,424 (86.5%) | 846 (13.5%) |
Housing Structures by Number of Rooms in Buckhall
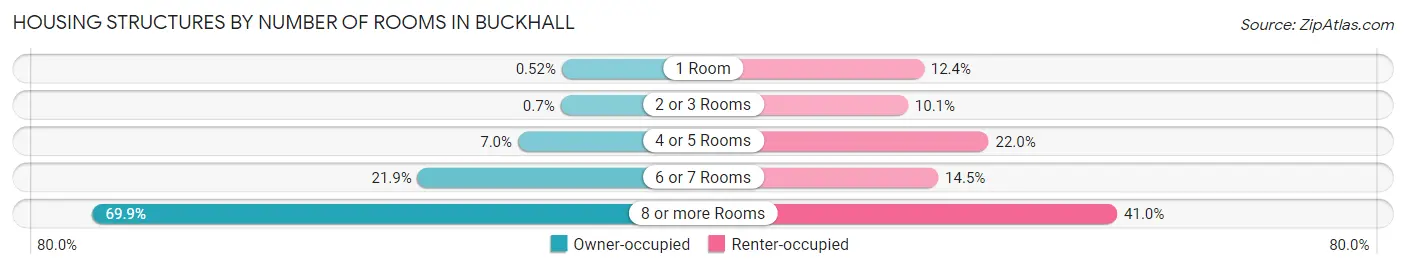
| Number of Rooms | Owner-occupied | Renter-occupied |
| 1 Room | 28 (0.5%) | 105 (12.4%) |
| 2 or 3 Rooms | 38 (0.7%) | 85 (10.1%) |
| 4 or 5 Rooms | 380 (7.0%) | 186 (22.0%) |
| 6 or 7 Rooms | 1,185 (21.8%) | 123 (14.5%) |
| 8 or more Rooms | 3,793 (69.9%) | 347 (41.0%) |
| Total | 5,424 (100.0%) | 846 (100.0%) |
Housing Structure by Heating Type in Buckhall
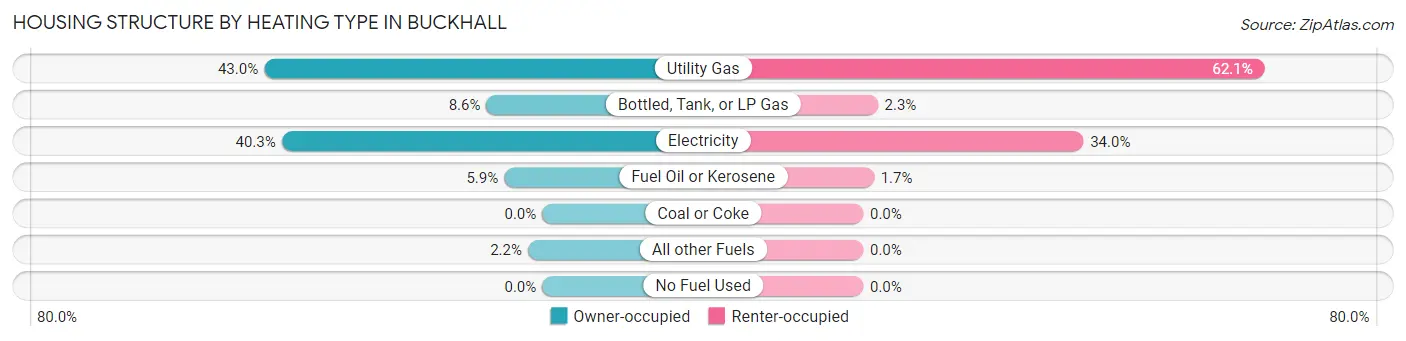
| Heating Type | Owner-occupied | Renter-occupied |
| Utility Gas | 2,332 (43.0%) | 525 (62.1%) |
| Bottled, Tank, or LP Gas | 468 (8.6%) | 19 (2.2%) |
| Electricity | 2,185 (40.3%) | 288 (34.0%) |
| Fuel Oil or Kerosene | 319 (5.9%) | 14 (1.7%) |
| Coal or Coke | 0 (0.0%) | 0 (0.0%) |
| All other Fuels | 120 (2.2%) | 0 (0.0%) |
| No Fuel Used | 0 (0.0%) | 0 (0.0%) |
| Total | 5,424 (100.0%) | 846 (100.0%) |
Household Vehicle Usage in Buckhall
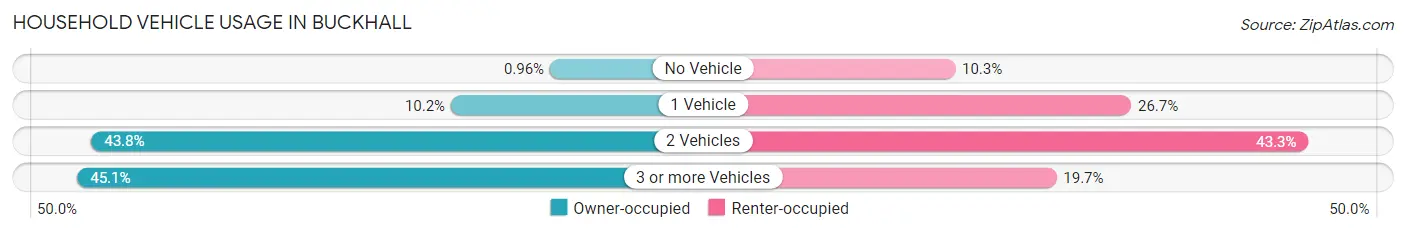
| Vehicles per Household | Owner-occupied | Renter-occupied |
| No Vehicle | 52 (1.0%) | 87 (10.3%) |
| 1 Vehicle | 553 (10.2%) | 226 (26.7%) |
| 2 Vehicles | 2,374 (43.8%) | 366 (43.3%) |
| 3 or more Vehicles | 2,445 (45.1%) | 167 (19.7%) |
| Total | 5,424 (100.0%) | 846 (100.0%) |
Real Estate & Mortgages in Buckhall
Real Estate and Mortgage Overview in Buckhall
| Characteristic | Without Mortgage | With Mortgage |
| Housing Units | 1,009 | 4,415 |
| Median Property Value | $590,000 | $554,000 |
| Median Household Income | $118,393 | $2,717 |
| Monthly Housing Costs | $877 | $1,770 |
| Real Estate Taxes | $5,841 | $22 |
Property Value by Mortgage Status in Buckhall
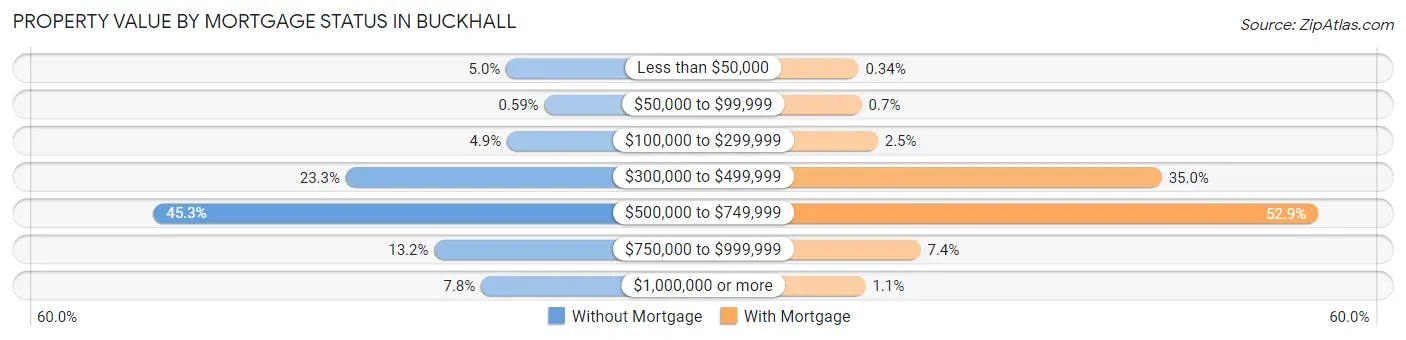
| Property Value | Without Mortgage | With Mortgage |
| Less than $50,000 | 50 (5.0%) | 15 (0.3%) |
| $50,000 to $99,999 | 6 (0.6%) | 31 (0.7%) |
| $100,000 to $299,999 | 49 (4.9%) | 112 (2.5%) |
| $300,000 to $499,999 | 235 (23.3%) | 1,545 (35.0%) |
| $500,000 to $749,999 | 457 (45.3%) | 2,334 (52.9%) |
| $750,000 to $999,999 | 133 (13.2%) | 328 (7.4%) |
| $1,000,000 or more | 79 (7.8%) | 50 (1.1%) |
| Total | 1,009 (100.0%) | 4,415 (100.0%) |
Household Income by Mortgage Status in Buckhall
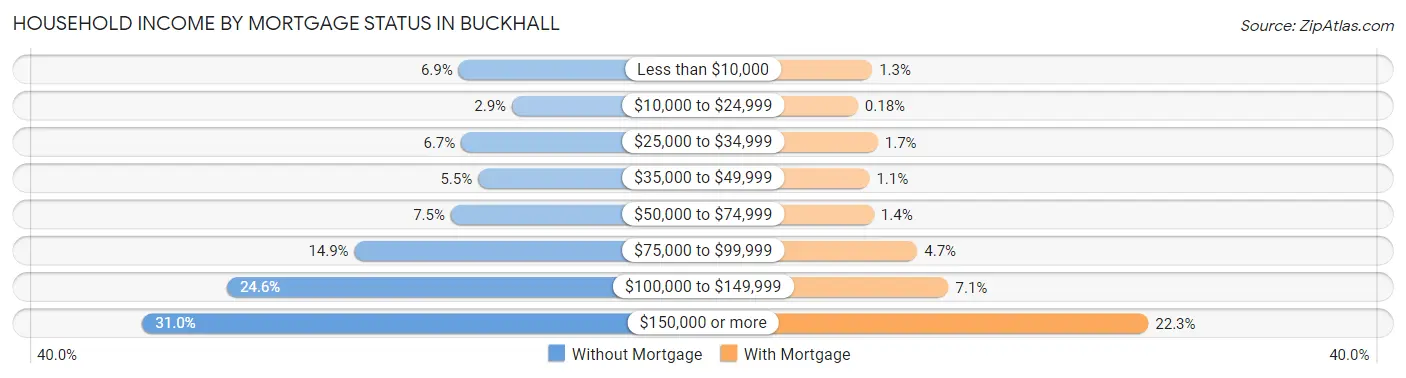
| Household Income | Without Mortgage | With Mortgage |
| Less than $10,000 | 70 (6.9%) | 56 (1.3%) |
| $10,000 to $24,999 | 29 (2.9%) | 8 (0.2%) |
| $25,000 to $34,999 | 68 (6.7%) | 75 (1.7%) |
| $35,000 to $49,999 | 55 (5.4%) | 47 (1.1%) |
| $50,000 to $74,999 | 76 (7.5%) | 62 (1.4%) |
| $75,000 to $99,999 | 150 (14.9%) | 208 (4.7%) |
| $100,000 to $149,999 | 248 (24.6%) | 313 (7.1%) |
| $150,000 or more | 313 (31.0%) | 985 (22.3%) |
| Total | 1,009 (100.0%) | 4,415 (100.0%) |
Property Value to Household Income Ratio in Buckhall
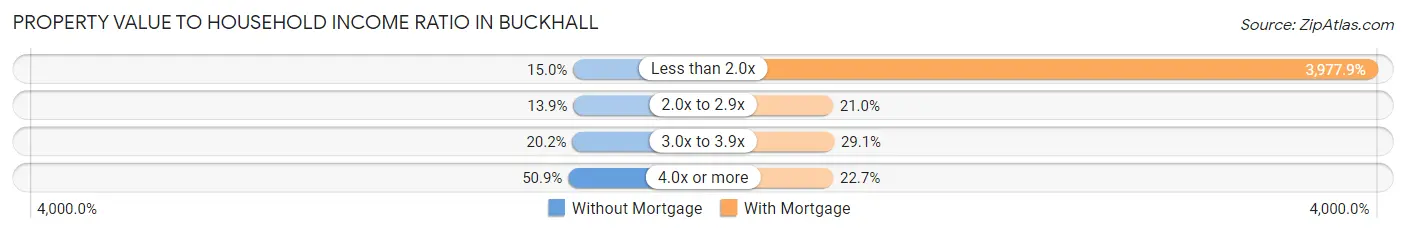
| Value-to-Income Ratio | Without Mortgage | With Mortgage |
| Less than 2.0x | 151 (15.0%) | 175,625 (3,977.9%) |
| 2.0x to 2.9x | 140 (13.9%) | 927 (21.0%) |
| 3.0x to 3.9x | 204 (20.2%) | 1,286 (29.1%) |
| 4.0x or more | 514 (50.9%) | 1,000 (22.7%) |
| Total | 1,009 (100.0%) | 4,415 (100.0%) |
Real Estate Taxes by Mortgage Status in Buckhall
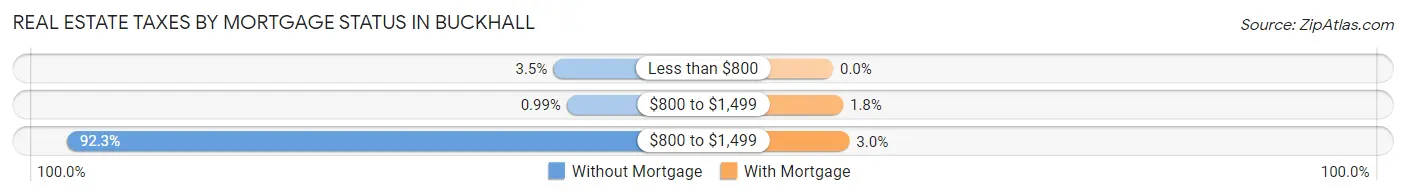
| Property Taxes | Without Mortgage | With Mortgage |
| Less than $800 | 35 (3.5%) | 0 (0.0%) |
| $800 to $1,499 | 10 (1.0%) | 81 (1.8%) |
| $800 to $1,499 | 931 (92.3%) | 132 (3.0%) |
| Total | 1,009 (100.0%) | 4,415 (100.0%) |
Health & Disability in Buckhall
Health Insurance Coverage by Age in Buckhall
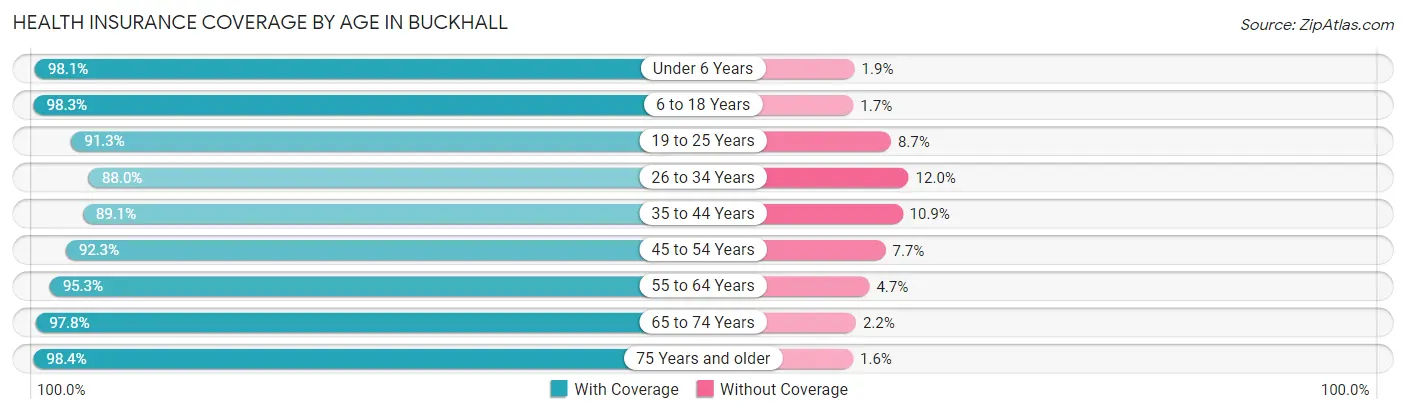
| Age Bracket | With Coverage | Without Coverage |
| Under 6 Years | 1,575 (98.1%) | 31 (1.9%) |
| 6 to 18 Years | 3,416 (98.3%) | 59 (1.7%) |
| 19 to 25 Years | 1,257 (91.3%) | 120 (8.7%) |
| 26 to 34 Years | 2,054 (88.0%) | 280 (12.0%) |
| 35 to 44 Years | 2,722 (89.1%) | 332 (10.9%) |
| 45 to 54 Years | 2,857 (92.3%) | 238 (7.7%) |
| 55 to 64 Years | 2,459 (95.3%) | 121 (4.7%) |
| 65 to 74 Years | 1,570 (97.8%) | 35 (2.2%) |
| 75 Years and older | 718 (98.4%) | 12 (1.6%) |
| Total | 18,628 (93.8%) | 1,228 (6.2%) |
Health Insurance Coverage by Citizenship Status in Buckhall
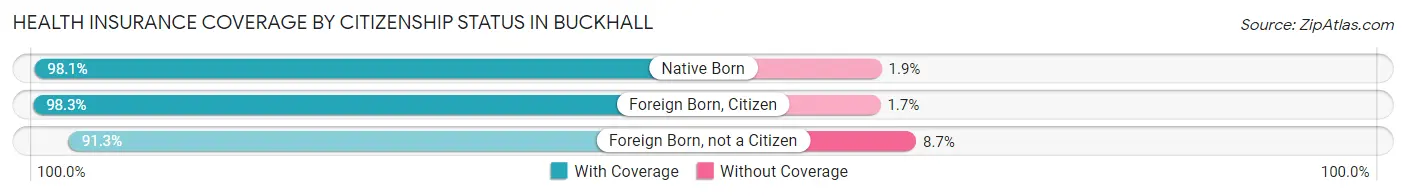
| Citizenship Status | With Coverage | Without Coverage |
| Native Born | 1,575 (98.1%) | 31 (1.9%) |
| Foreign Born, Citizen | 3,416 (98.3%) | 59 (1.7%) |
| Foreign Born, not a Citizen | 1,257 (91.3%) | 120 (8.7%) |
Health Insurance Coverage by Household Income in Buckhall
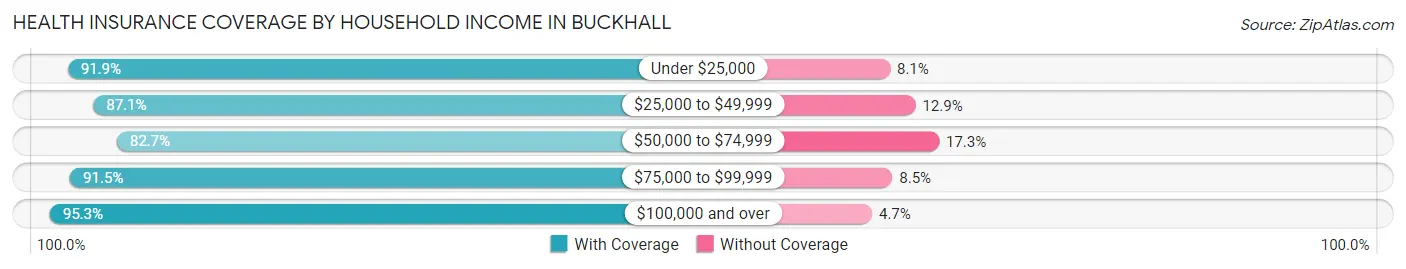
| Household Income | With Coverage | Without Coverage |
| Under $25,000 | 420 (91.9%) | 37 (8.1%) |
| $25,000 to $49,999 | 833 (87.1%) | 123 (12.9%) |
| $50,000 to $74,999 | 938 (82.7%) | 196 (17.3%) |
| $75,000 to $99,999 | 1,275 (91.5%) | 119 (8.5%) |
| $100,000 and over | 15,151 (95.3%) | 753 (4.7%) |
Public vs Private Health Insurance Coverage by Age in Buckhall
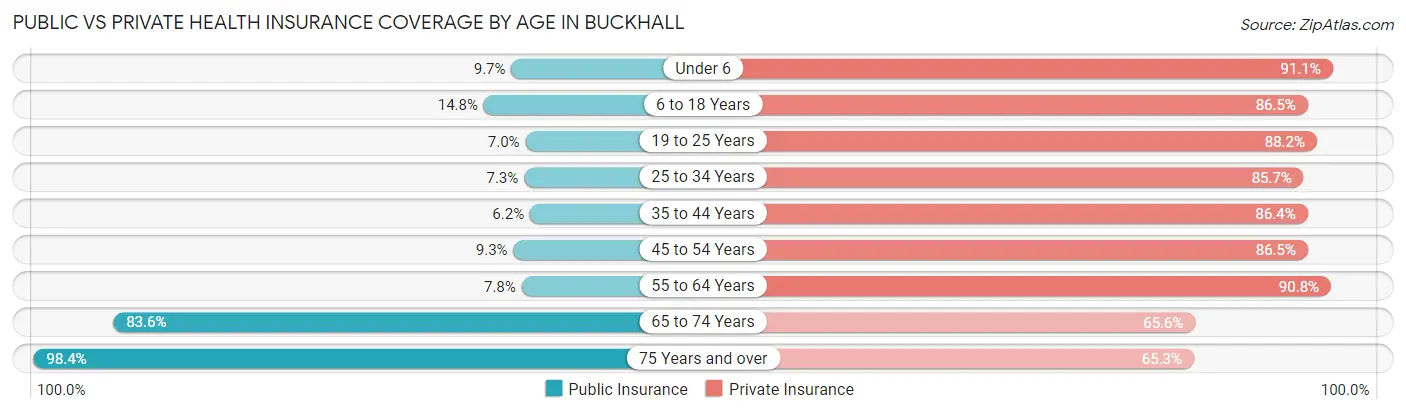
| Age Bracket | Public Insurance | Private Insurance |
| Under 6 | 155 (9.7%) | 1,463 (91.1%) |
| 6 to 18 Years | 513 (14.8%) | 3,005 (86.5%) |
| 19 to 25 Years | 97 (7.0%) | 1,214 (88.2%) |
| 25 to 34 Years | 170 (7.3%) | 2,001 (85.7%) |
| 35 to 44 Years | 189 (6.2%) | 2,640 (86.4%) |
| 45 to 54 Years | 287 (9.3%) | 2,677 (86.5%) |
| 55 to 64 Years | 200 (7.7%) | 2,342 (90.8%) |
| 65 to 74 Years | 1,341 (83.6%) | 1,053 (65.6%) |
| 75 Years and over | 718 (98.4%) | 477 (65.3%) |
| Total | 3,670 (18.5%) | 16,872 (85.0%) |
Disability Status by Sex by Age in Buckhall
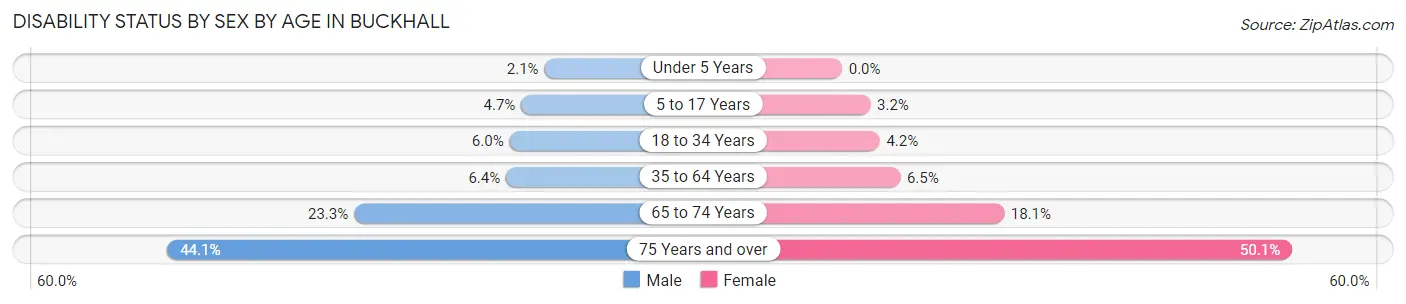
| Age Bracket | Male | Female |
| Under 5 Years | 15 (2.1%) | 0 (0.0%) |
| 5 to 17 Years | 96 (4.7%) | 45 (3.2%) |
| 18 to 34 Years | 127 (6.0%) | 76 (4.2%) |
| 35 to 64 Years | 295 (6.4%) | 266 (6.5%) |
| 65 to 74 Years | 183 (23.3%) | 148 (18.0%) |
| 75 Years and over | 161 (44.1%) | 183 (50.1%) |
Disability Class by Sex by Age in Buckhall
Disability Class: Hearing Difficulty
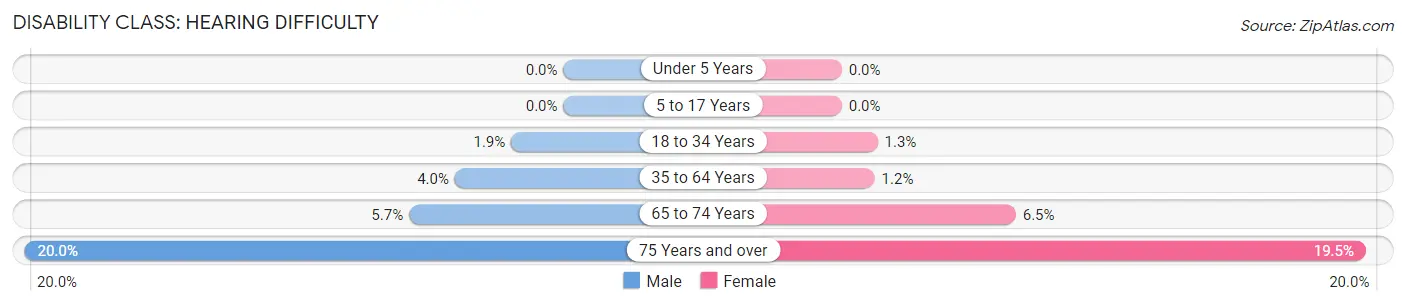
| Age Bracket | Male | Female |
| Under 5 Years | 0 (0.0%) | 0 (0.0%) |
| 5 to 17 Years | 0 (0.0%) | 0 (0.0%) |
| 18 to 34 Years | 41 (1.9%) | 24 (1.3%) |
| 35 to 64 Years | 186 (4.0%) | 50 (1.2%) |
| 65 to 74 Years | 45 (5.7%) | 53 (6.5%) |
| 75 Years and over | 73 (20.0%) | 71 (19.5%) |
Disability Class: Vision Difficulty
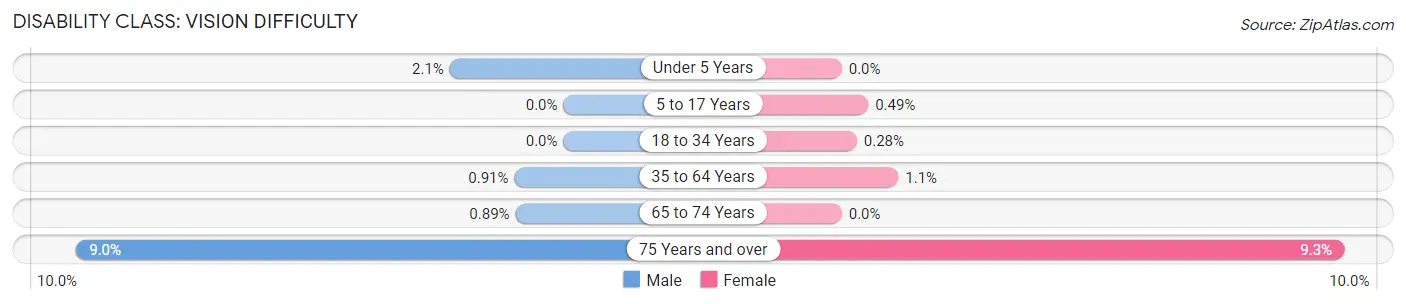
| Age Bracket | Male | Female |
| Under 5 Years | 15 (2.1%) | 0 (0.0%) |
| 5 to 17 Years | 0 (0.0%) | 7 (0.5%) |
| 18 to 34 Years | 0 (0.0%) | 5 (0.3%) |
| 35 to 64 Years | 42 (0.9%) | 43 (1.1%) |
| 65 to 74 Years | 7 (0.9%) | 0 (0.0%) |
| 75 Years and over | 33 (9.0%) | 34 (9.3%) |
Disability Class: Cognitive Difficulty
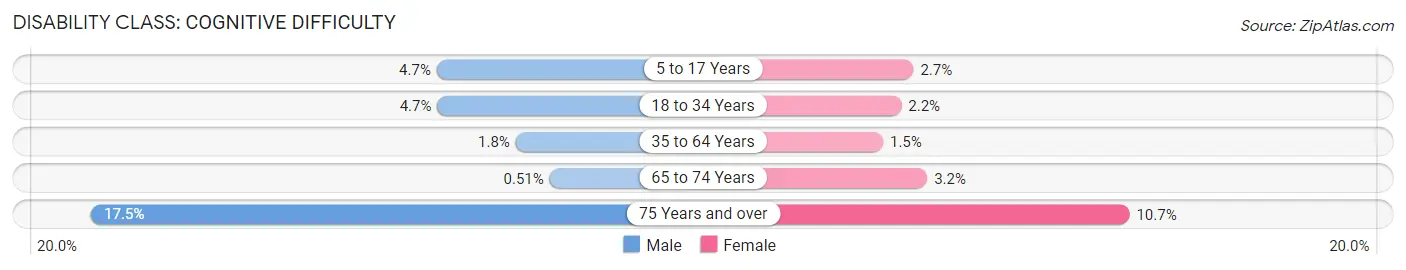
| Age Bracket | Male | Female |
| 5 to 17 Years | 96 (4.7%) | 38 (2.7%) |
| 18 to 34 Years | 99 (4.7%) | 40 (2.2%) |
| 35 to 64 Years | 82 (1.8%) | 63 (1.5%) |
| 65 to 74 Years | 4 (0.5%) | 26 (3.2%) |
| 75 Years and over | 64 (17.5%) | 39 (10.7%) |
Disability Class: Ambulatory Difficulty
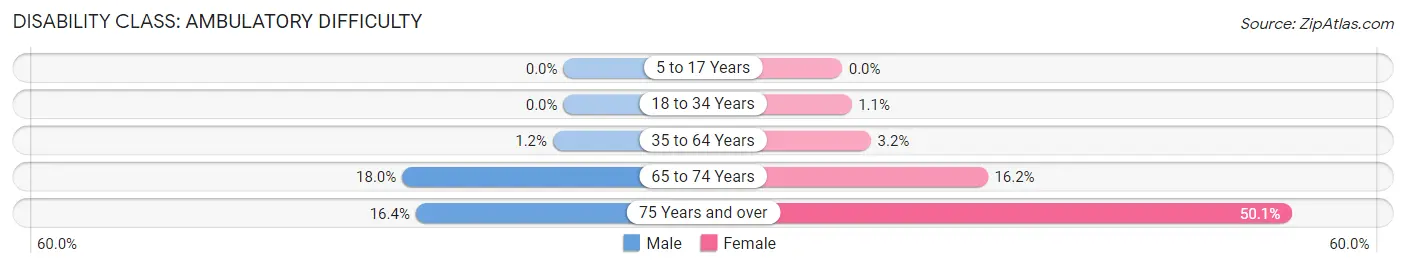
| Age Bracket | Male | Female |
| 5 to 17 Years | 0 (0.0%) | 0 (0.0%) |
| 18 to 34 Years | 0 (0.0%) | 19 (1.1%) |
| 35 to 64 Years | 54 (1.2%) | 132 (3.2%) |
| 65 to 74 Years | 141 (18.0%) | 133 (16.2%) |
| 75 Years and over | 60 (16.4%) | 183 (50.1%) |
Disability Class: Self-Care Difficulty
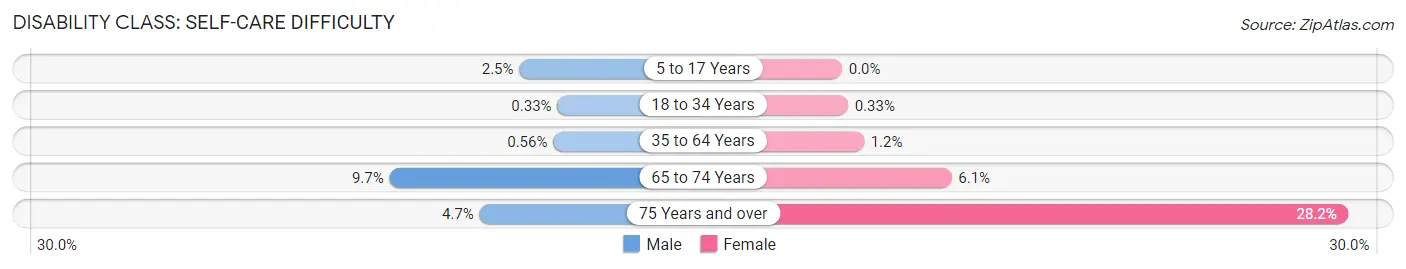
| Age Bracket | Male | Female |
| 5 to 17 Years | 50 (2.5%) | 0 (0.0%) |
| 18 to 34 Years | 7 (0.3%) | 6 (0.3%) |
| 35 to 64 Years | 26 (0.6%) | 50 (1.2%) |
| 65 to 74 Years | 76 (9.7%) | 50 (6.1%) |
| 75 Years and over | 17 (4.7%) | 103 (28.2%) |
Technology Access in Buckhall
Computing Device Access in Buckhall
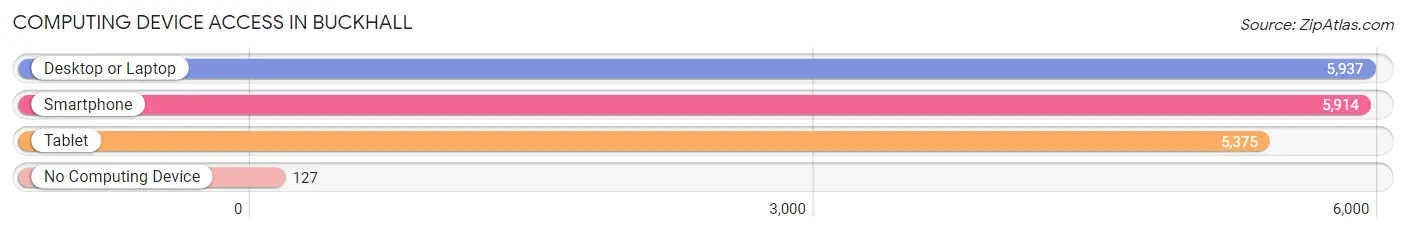
| Device Type | # Households | % Households |
| Desktop or Laptop | 5,937 | 94.7% |
| Smartphone | 5,914 | 94.3% |
| Tablet | 5,375 | 85.7% |
| No Computing Device | 127 | 2.0% |
| Total | 6,270 | 100.0% |
Internet Access in Buckhall
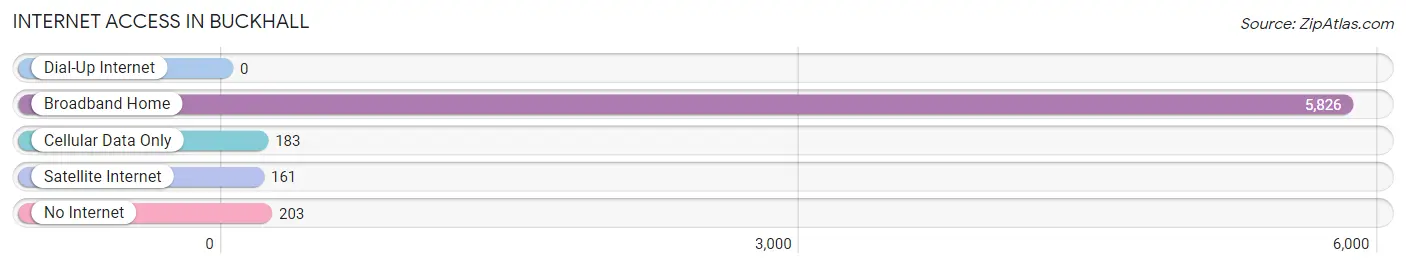
| Internet Type | # Households | % Households |
| Dial-Up Internet | 0 | 0.0% |
| Broadband Home | 5,826 | 92.9% |
| Cellular Data Only | 183 | 2.9% |
| Satellite Internet | 161 | 2.6% |
| No Internet | 203 | 3.2% |
| Total | 6,270 | 100.0% |
Buckhall Summary
Buckhall is a census-designated place (CDP) located in Prince William County, Virginia, United States. It is located approximately 25 miles southwest of Washington, D.C. and is part of the Washington metropolitan area. As of the 2010 census, the population of Buckhall was 8,845.
History
The area that is now Buckhall was originally inhabited by Native American tribes, including the Piscataway and the Doeg. The first European settlers arrived in the area in the late 17th century. The area was known as Buck Hall Plantation, and was owned by the Buck family. The Buck family owned the land until the early 19th century, when it was sold to the Fairfax family. The Fairfax family owned the land until the early 20th century, when it was sold to developers.
In the 1950s, the area was developed into a residential community. The community was named Buckhall, after the original Buck Hall Plantation. The community was incorporated as a census-designated place in 1980.
Geography
Buckhall is located at 38°44'25" North, 77°25'45" West (38.740278, -77.429167). It is situated in the eastern part of Prince William County, Virginia, approximately 25 miles southwest of Washington, D.C.
According to the United States Census Bureau, the CDP has a total area of 4.3 square miles, all of which is land.
Economy
The economy of Buckhall is largely based on the service industry. The area is home to several retail stores, restaurants, and other businesses. The area is also home to several government agencies, including the Prince William County Police Department and the Prince William County Fire and Rescue Department.
Demographics
As of the 2010 census, there were 8,845 people, 3,093 households, and 2,521 families residing in the CDP. The population density was 2,062.2 people per square mile. The racial makeup of the CDP was 68.2% White, 17.3% African American, 0.4% Native American, 8.2% Asian, 0.1% Pacific Islander, 2.3% from other races, and 3.5% from two or more races. Hispanic or Latino of any race were 6.2% of the population.
There were 3,093 households, out of which 41.2% had children under the age of 18 living with them, 63.2% were married couples living together, 10.2% had a female householder with no husband present, and 22.2% were non-families. 17.2% of all households were made up of individuals, and 4.2% had someone living alone who was 65 years of age or older. The average household size was 2.86 and the average family size was 3.22.
In the CDP, the population was spread out, with 28.2% under the age of 18, 7.2% from 18 to 24, 33.2% from 25 to 44, 24.2% from 45 to 64, and 7.2% who were 65 years of age or older. The median age was 35 years. For every 100 females, there were 97.2 males. For every 100 females age 18 and over, there were 94.2 males.
The median income for a household in the CDP was $76,944, and the median income for a family was $81,944. Males had a median income of $50,000 versus $41,250 for females. The per capita income for the CDP was $30,944. About 3.2% of families and 4.2% of the population were below the poverty line, including 5.2% of those under age 18 and none of those age 65 or over.
Common Questions
What is Per Capita Income in Buckhall?
Per Capita income in Buckhall is $58,111.
What is the Median Family Income in Buckhall?
Median Family Income in Buckhall is $165,641.
What is the Median Household income in Buckhall?
Median Household Income in Buckhall is $155,735.
What is Income or Wage Gap in Buckhall?
Income or Wage Gap in Buckhall is 21.4%.
Women in Buckhall earn 78.6 cents for every dollar earned by a man.
What is Family Income Deficit in Buckhall?
Family Income Deficit in Buckhall is $7,967.
Families that are below poverty line in Buckhall earn $7,967 less on average than the poverty threshold level.
What is Inequality or Gini Index in Buckhall?
Inequality or Gini Index in Buckhall is 0.36.
What is the Total Population of Buckhall?
Total Population of Buckhall is 20,095.
What is the Total Male Population of Buckhall?
Total Male Population of Buckhall is 10,752.
What is the Total Female Population of Buckhall?
Total Female Population of Buckhall is 9,343.
What is the Ratio of Males per 100 Females in Buckhall?
There are 115.08 Males per 100 Females in Buckhall.
What is the Ratio of Females per 100 Males in Buckhall?
There are 86.90 Females per 100 Males in Buckhall.
What is the Median Population Age in Buckhall?
Median Population Age in Buckhall is 40.1 Years.
What is the Average Family Size in Buckhall
Average Family Size in Buckhall is 3.4 People.
What is the Average Household Size in Buckhall
Average Household Size in Buckhall is 3.2 People.
How Large is the Labor Force in Buckhall?
There are 11,321 People in the Labor Forcein in Buckhall.
What is the Percentage of People in the Labor Force in Buckhall?
71.6% of People are in the Labor Force in Buckhall.
What is the Unemployment Rate in Buckhall?
Unemployment Rate in Buckhall is 3.6%.