Painter, VA Map & Demographics
Painter Map
Painter Overview
$22,711
PER CAPITA INCOME
$87,500
AVG FAMILY INCOME
$61,250
AVG HOUSEHOLD INCOME
20.2%
WAGE / INCOME GAP [ % ]
79.8¢/ $1
WAGE / INCOME GAP [ $ ]
0.37
INEQUALITY / GINI INDEX
244
TOTAL POPULATION
115
MALE POPULATION
129
FEMALE POPULATION
89.15
MALES / 100 FEMALES
112.17
FEMALES / 100 MALES
34.7
MEDIAN AGE
3.6
AVG FAMILY SIZE
2.7
AVG HOUSEHOLD SIZE
94
LABOR FORCE [ PEOPLE ]
57.3%
PERCENT IN LABOR FORCE
1.1%
UNEMPLOYMENT RATE
Painter Zip Codes
Painter Area Codes
Income in Painter
Income Overview in Painter
Per Capita Income in Painter is $22,711, while median incomes of families and households are $87,500 and $61,250 respectively.
| Characteristic | Number | Measure |
| Per Capita Income | 244 | $22,711 |
| Median Family Income | 56 | $87,500 |
| Mean Family Income | 56 | $83,171 |
| Median Household Income | 91 | $61,250 |
| Mean Household Income | 91 | $65,866 |
| Income Deficit | 56 | $0 |
| Wage / Income Gap (%) | 244 | 20.18% |
| Wage / Income Gap ($) | 244 | 79.82¢ per $1 |
| Gini / Inequality Index | 244 | 0.37 |
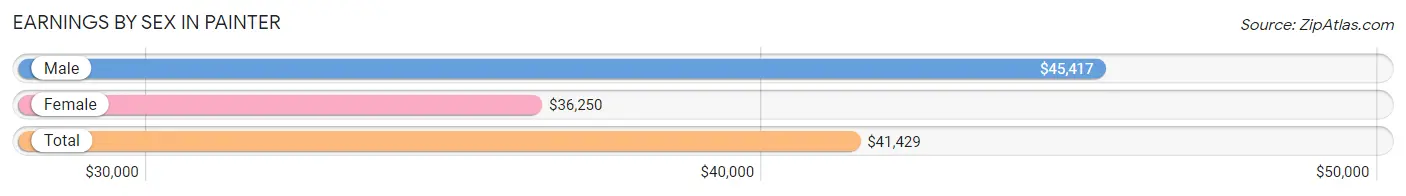
Earnings by Sex in Painter
Average Earnings in Painter are $41,429, $45,417 for men and $36,250 for women, a difference of 20.2%.
| Sex | Number | Average Earnings |
| Male | 53 (56.4%) | $45,417 |
| Female | 41 (43.6%) | $36,250 |
| Total | 94 (100.0%) | $41,429 |
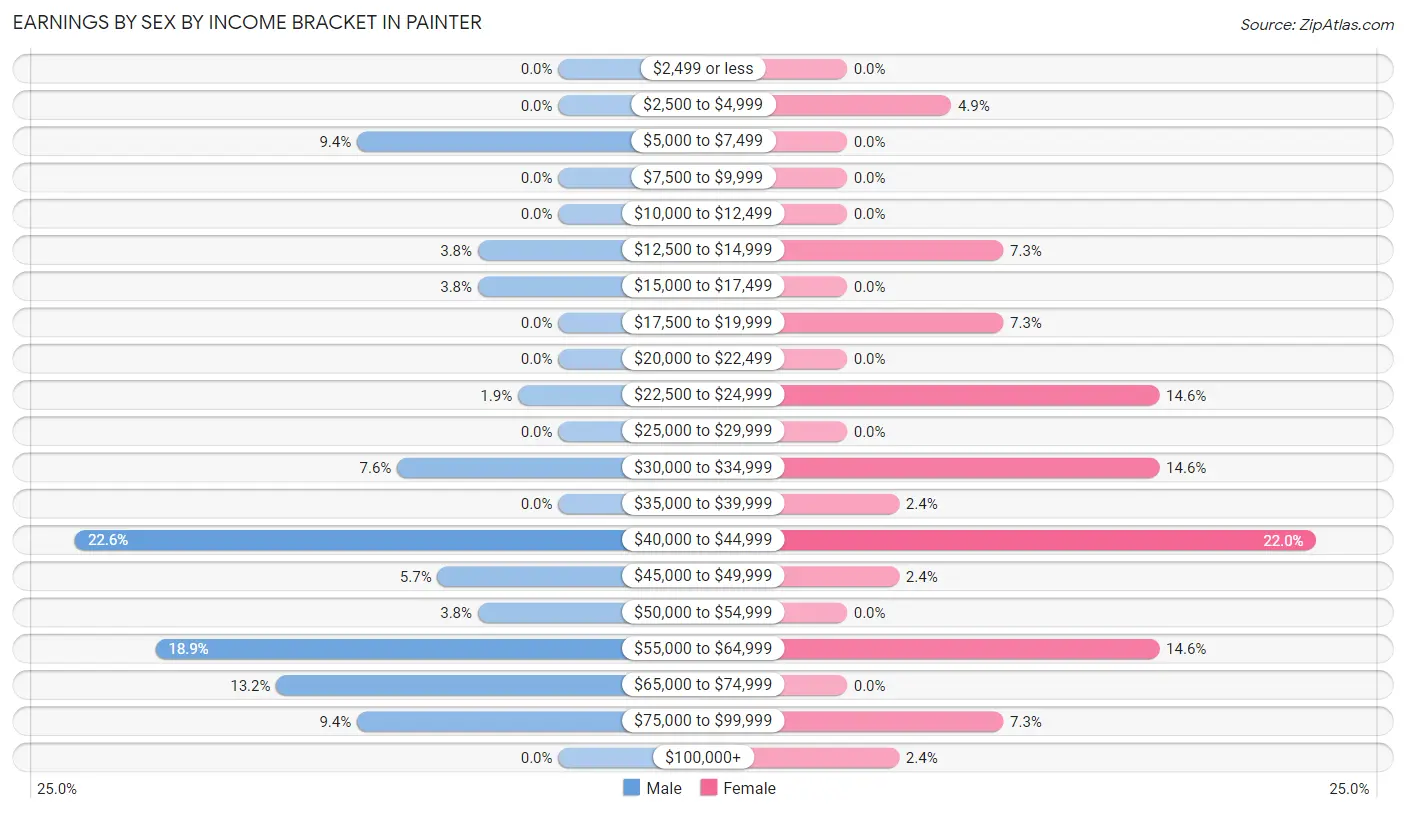
Earnings by Sex by Income Bracket in Painter
The most common earnings brackets in Painter are $40,000 to $44,999 for men (12 | 22.6%) and $40,000 to $44,999 for women (9 | 22.0%).
| Income | Male | Female |
| $2,499 or less | 0 (0.0%) | 0 (0.0%) |
| $2,500 to $4,999 | 0 (0.0%) | 2 (4.9%) |
| $5,000 to $7,499 | 5 (9.4%) | 0 (0.0%) |
| $7,500 to $9,999 | 0 (0.0%) | 0 (0.0%) |
| $10,000 to $12,499 | 0 (0.0%) | 0 (0.0%) |
| $12,500 to $14,999 | 2 (3.8%) | 3 (7.3%) |
| $15,000 to $17,499 | 2 (3.8%) | 0 (0.0%) |
| $17,500 to $19,999 | 0 (0.0%) | 3 (7.3%) |
| $20,000 to $22,499 | 0 (0.0%) | 0 (0.0%) |
| $22,500 to $24,999 | 1 (1.9%) | 6 (14.6%) |
| $25,000 to $29,999 | 0 (0.0%) | 0 (0.0%) |
| $30,000 to $34,999 | 4 (7.5%) | 6 (14.6%) |
| $35,000 to $39,999 | 0 (0.0%) | 1 (2.4%) |
| $40,000 to $44,999 | 12 (22.6%) | 9 (22.0%) |
| $45,000 to $49,999 | 3 (5.7%) | 1 (2.4%) |
| $50,000 to $54,999 | 2 (3.8%) | 0 (0.0%) |
| $55,000 to $64,999 | 10 (18.9%) | 6 (14.6%) |
| $65,000 to $74,999 | 7 (13.2%) | 0 (0.0%) |
| $75,000 to $99,999 | 5 (9.4%) | 3 (7.3%) |
| $100,000+ | 0 (0.0%) | 1 (2.4%) |
| Total | 53 (100.0%) | 41 (100.0%) |
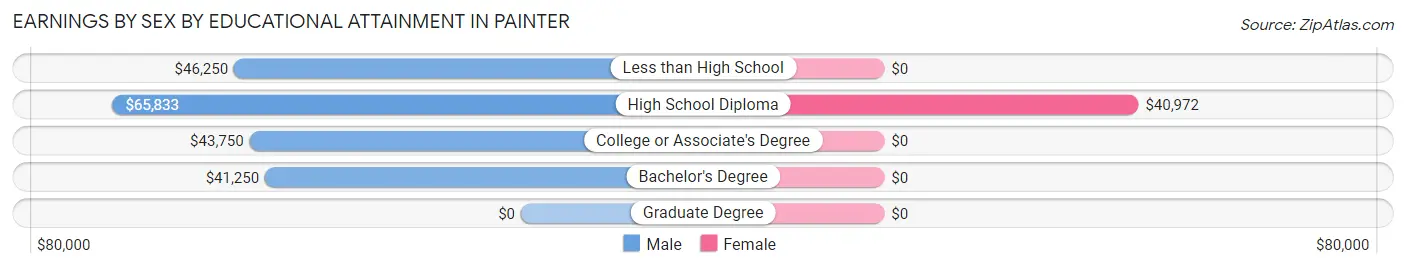
Earnings by Sex by Educational Attainment in Painter
Average earnings in Painter are $46,250 for men and $40,278 for women, a difference of 12.9%. Men with an educational attainment of high school diploma enjoy the highest average annual earnings of $65,833, while those with bachelor's degree education earn the least with $41,250. Women with an educational attainment of high school diploma earn the most with the average annual earnings of $40,972, while those with high school diploma education have the smallest earnings of $40,972.
| Educational Attainment | Male Income | Female Income |
| Less than High School | $46,250 | $0 |
| High School Diploma | $65,833 | $40,972 |
| College or Associate's Degree | $43,750 | $0 |
| Bachelor's Degree | $41,250 | $0 |
| Graduate Degree | - | - |
| Total | $46,250 | $40,278 |
Family Income in Painter
Family Income Brackets in Painter
According to the Painter family income data, there are 17 families falling into the $100,000 to $149,999 income range, which is the most common income bracket and makes up 30.4% of all families.
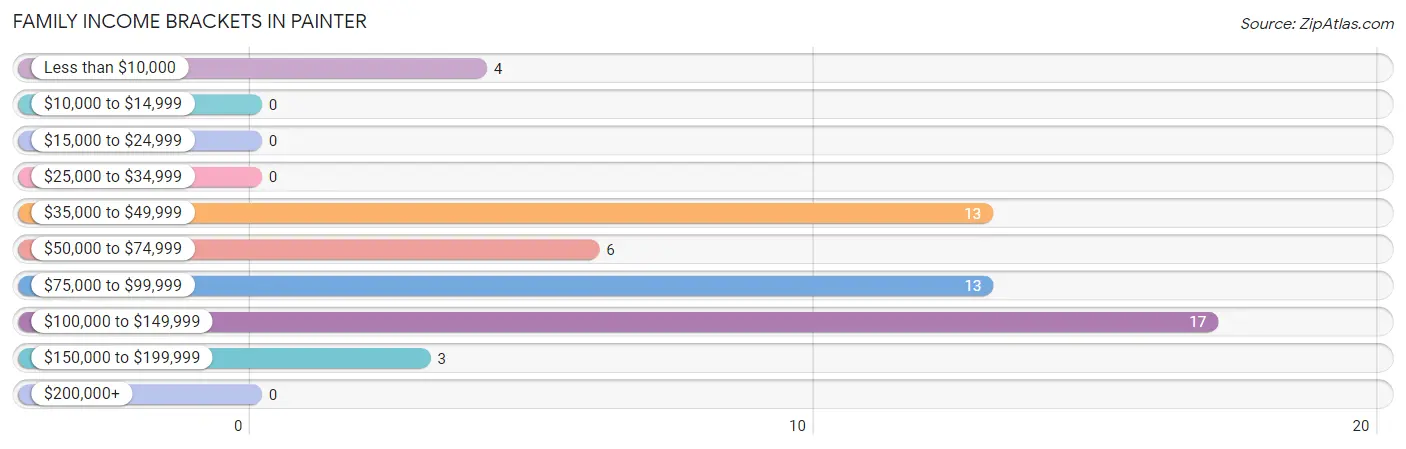
| Income Bracket | # Families | % Families |
| Less than $10,000 | 4 | 7.1% |
| $10,000 to $14,999 | 0 | 0.0% |
| $15,000 to $24,999 | 0 | 0.0% |
| $25,000 to $34,999 | 0 | 0.0% |
| $35,000 to $49,999 | 13 | 23.2% |
| $50,000 to $74,999 | 6 | 10.7% |
| $75,000 to $99,999 | 13 | 23.2% |
| $100,000 to $149,999 | 17 | 30.4% |
| $150,000 to $199,999 | 3 | 5.4% |
| $200,000+ | 0 | 0.0% |
Family Income by Famaliy Size in Painter
3-person families (13 | 23.2%) account for the highest median family income in Painter with $115,208 per family, while 3-person families (13 | 23.2%) have the highest median income of $38,403 per family member.
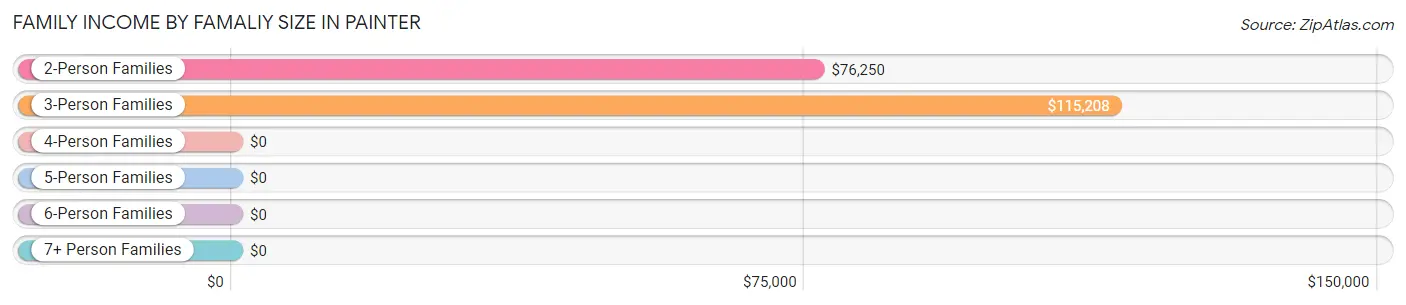
| Income Bracket | # Families | Median Income |
| 2-Person Families | 18 (32.1%) | $76,250 |
| 3-Person Families | 13 (23.2%) | $115,208 |
| 4-Person Families | 4 (7.1%) | $0 |
| 5-Person Families | 6 (10.7%) | $0 |
| 6-Person Families | 15 (26.8%) | $0 |
| 7+ Person Families | 0 (0.0%) | $0 |
| Total | 56 (100.0%) | $87,500 |
Family Income by Number of Earners in Painter
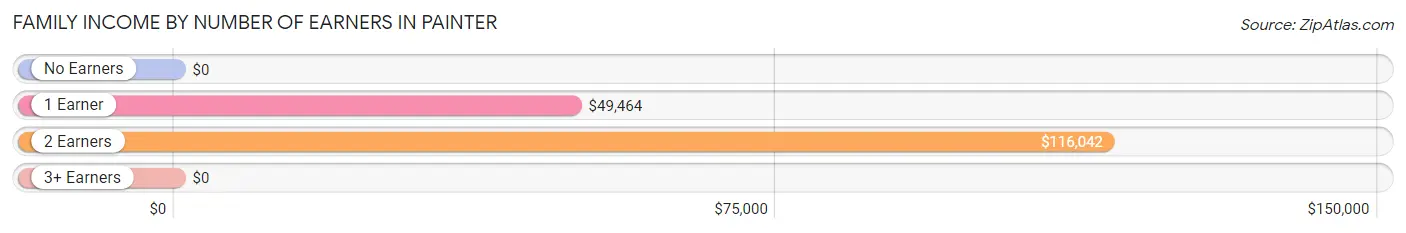
| Number of Earners | # Families | Median Income |
| No Earners | 8 (14.3%) | $0 |
| 1 Earner | 25 (44.6%) | $49,464 |
| 2 Earners | 13 (23.2%) | $116,042 |
| 3+ Earners | 10 (17.9%) | $0 |
| Total | 56 (100.0%) | $87,500 |
Household Income in Painter
Household Income Brackets in Painter
With 18 households falling in the category, the $35,000 to $49,999 income range is the most frequent in Painter, accounting for 19.8% of all households.
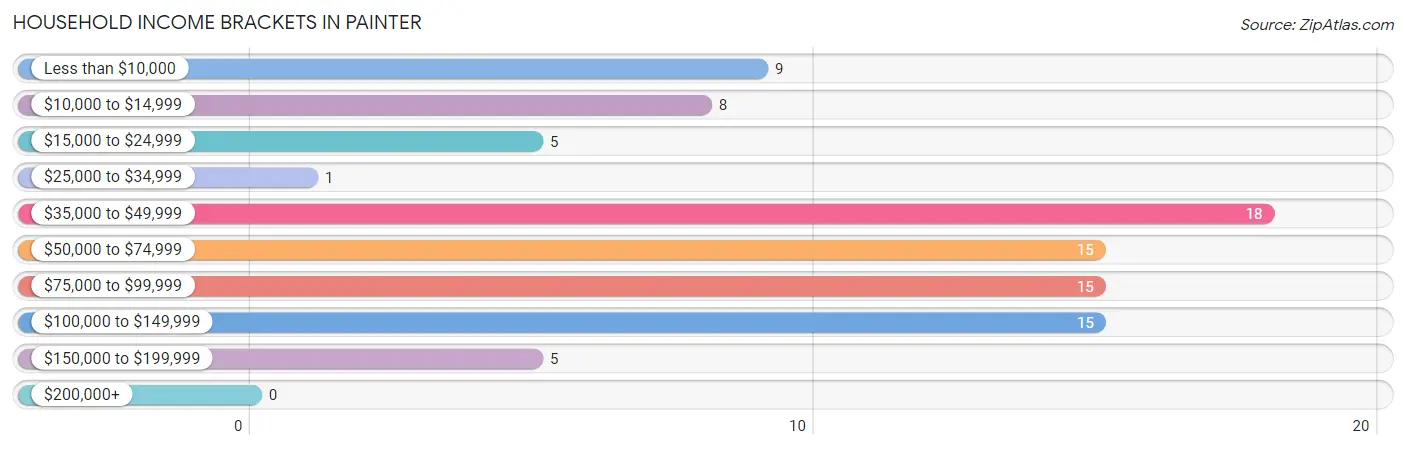
| Income Bracket | # Households | % Households |
| Less than $10,000 | 9 | 9.9% |
| $10,000 to $14,999 | 8 | 8.8% |
| $15,000 to $24,999 | 5 | 5.5% |
| $25,000 to $34,999 | 1 | 1.1% |
| $35,000 to $49,999 | 18 | 19.8% |
| $50,000 to $74,999 | 15 | 16.5% |
| $75,000 to $99,999 | 15 | 16.5% |
| $100,000 to $149,999 | 15 | 16.5% |
| $150,000 to $199,999 | 5 | 5.5% |
| $200,000+ | 0 | 0.0% |
Household Income by Householder Age in Painter
The median household income in Painter is $61,250, with the highest median household income of $87,500 found in the 65+ years age bracket for the primary householder. A total of 22 households (24.2%) fall into this category.
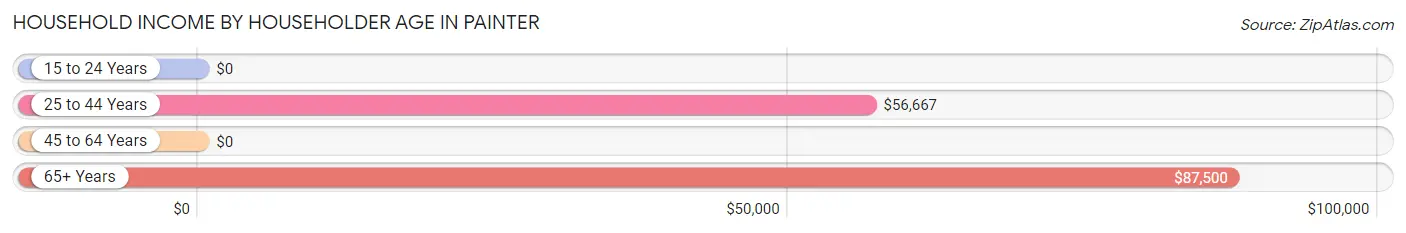
| Income Bracket | # Households | Median Income |
| 15 to 24 Years | 0 (0.0%) | $0 |
| 25 to 44 Years | 24 (26.4%) | $56,667 |
| 45 to 64 Years | 45 (49.4%) | $0 |
| 65+ Years | 22 (24.2%) | $87,500 |
| Total | 91 (100.0%) | $61,250 |
Poverty in Painter
Income Below Poverty by Sex and Age in Painter
With 17.4% poverty level for males and 8.5% for females among the residents of Painter, 5 year old males and 25 to 34 year old females are the most vulnerable to poverty, with 2 males (100.0%) and 9 females (100.0%) in their respective age groups living below the poverty level.
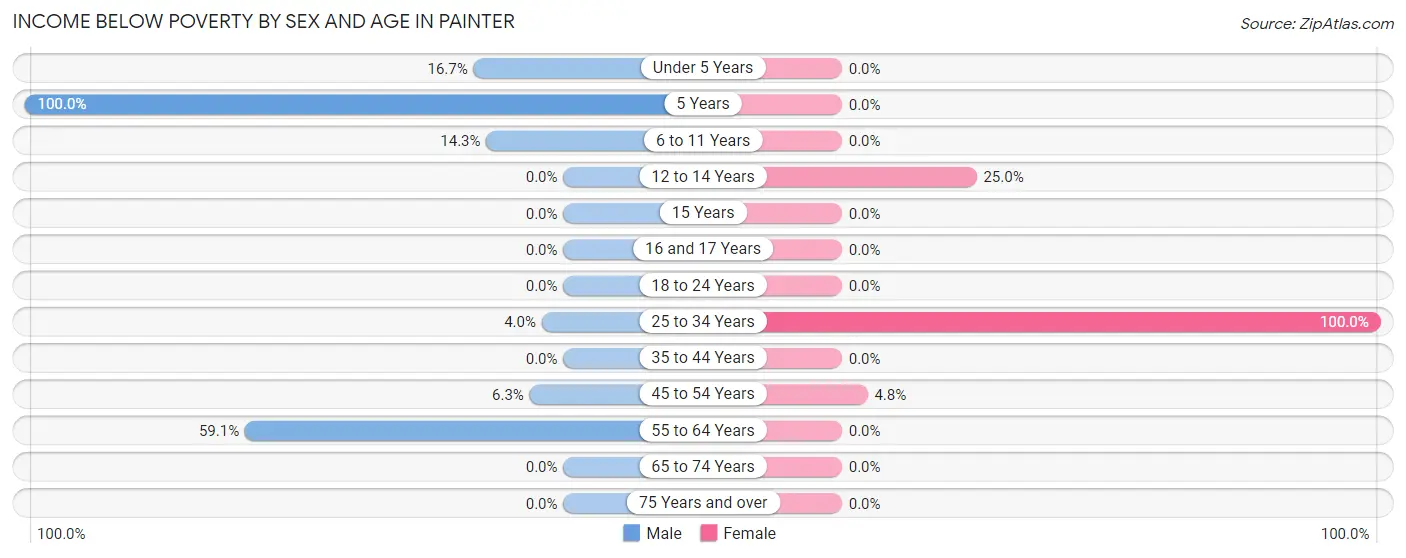
| Age Bracket | Male | Female |
| Under 5 Years | 1 (16.7%) | 0 (0.0%) |
| 5 Years | 2 (100.0%) | 0 (0.0%) |
| 6 to 11 Years | 2 (14.3%) | 0 (0.0%) |
| 12 to 14 Years | 0 (0.0%) | 1 (25.0%) |
| 15 Years | 0 (0.0%) | 0 (0.0%) |
| 16 and 17 Years | 0 (0.0%) | 0 (0.0%) |
| 18 to 24 Years | 0 (0.0%) | 0 (0.0%) |
| 25 to 34 Years | 1 (4.0%) | 9 (100.0%) |
| 35 to 44 Years | 0 (0.0%) | 0 (0.0%) |
| 45 to 54 Years | 1 (6.2%) | 1 (4.8%) |
| 55 to 64 Years | 13 (59.1%) | 0 (0.0%) |
| 65 to 74 Years | 0 (0.0%) | 0 (0.0%) |
| 75 Years and over | 0 (0.0%) | 0 (0.0%) |
| Total | 20 (17.4%) | 11 (8.5%) |
Income Above Poverty by Sex and Age in Painter
According to the poverty statistics in Painter, males aged 12 to 14 years and females aged under 5 years are the age groups that are most secure financially, with 100.0% of males and 100.0% of females in these age groups living above the poverty line.
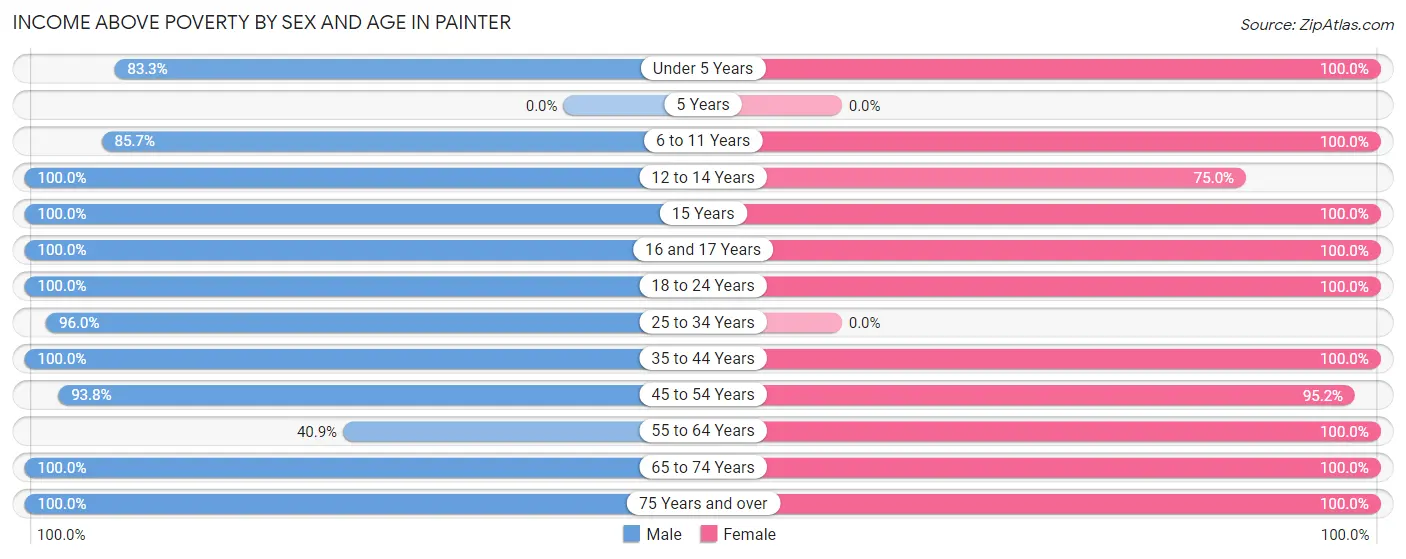
| Age Bracket | Male | Female |
| Under 5 Years | 5 (83.3%) | 24 (100.0%) |
| 5 Years | 0 (0.0%) | 0 (0.0%) |
| 6 to 11 Years | 12 (85.7%) | 9 (100.0%) |
| 12 to 14 Years | 7 (100.0%) | 3 (75.0%) |
| 15 Years | 3 (100.0%) | 11 (100.0%) |
| 16 and 17 Years | 1 (100.0%) | 2 (100.0%) |
| 18 to 24 Years | 2 (100.0%) | 4 (100.0%) |
| 25 to 34 Years | 24 (96.0%) | 0 (0.0%) |
| 35 to 44 Years | 8 (100.0%) | 11 (100.0%) |
| 45 to 54 Years | 15 (93.8%) | 20 (95.2%) |
| 55 to 64 Years | 9 (40.9%) | 8 (100.0%) |
| 65 to 74 Years | 2 (100.0%) | 18 (100.0%) |
| 75 Years and over | 7 (100.0%) | 8 (100.0%) |
| Total | 95 (82.6%) | 118 (91.5%) |
Income Below Poverty Among Married-Couple Families in Painter
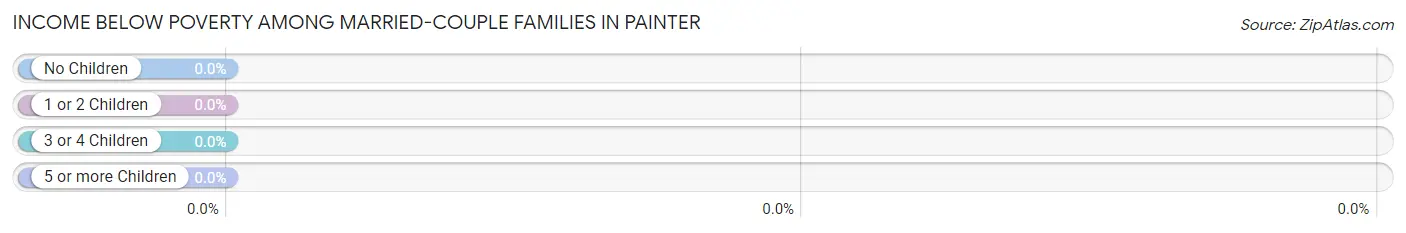
| Children | Above Poverty | Below Poverty |
| No Children | 20 (100.0%) | 0 (0.0%) |
| 1 or 2 Children | 9 (100.0%) | 0 (0.0%) |
| 3 or 4 Children | 10 (100.0%) | 0 (0.0%) |
| 5 or more Children | 0 (0.0%) | 0 (0.0%) |
| Total | 39 (100.0%) | 0 (0.0%) |
Income Below Poverty Among Single-Parent Households in Painter
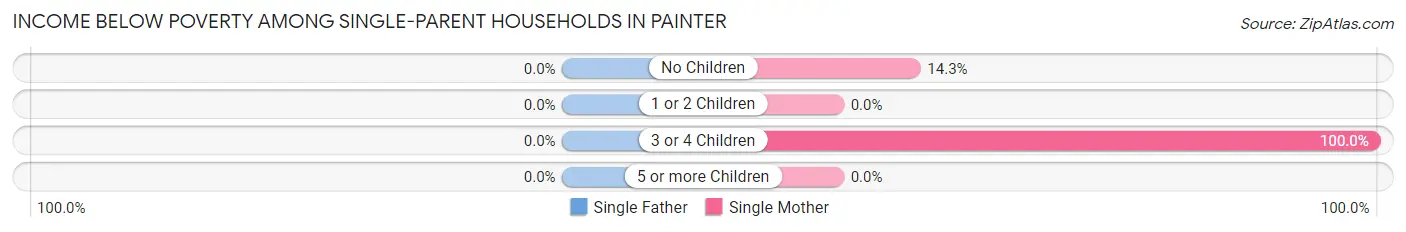
| Children | Single Father | Single Mother |
| No Children | 0 (0.0%) | 1 (14.3%) |
| 1 or 2 Children | 0 (0.0%) | 0 (0.0%) |
| 3 or 4 Children | 0 (0.0%) | 3 (100.0%) |
| 5 or more Children | 0 (0.0%) | 0 (0.0%) |
| Total | 0 (0.0%) | 4 (33.3%) |
Income Below Poverty Among Married-Couple vs Single-Parent Households in Painter
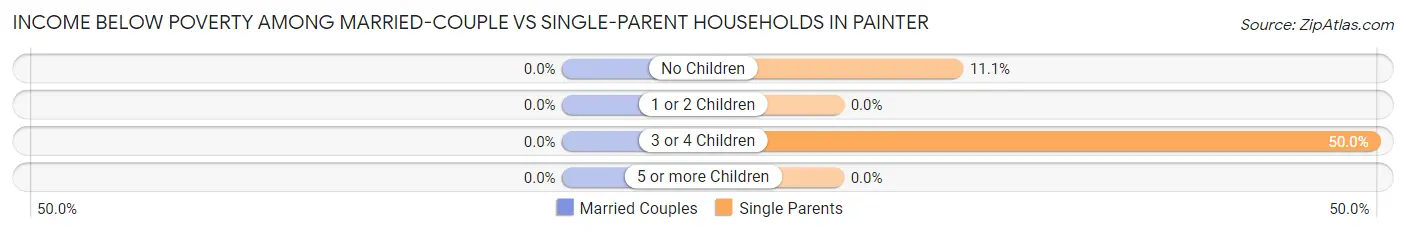
| Children | Married-Couple Families | Single-Parent Households |
| No Children | 0 (0.0%) | 1 (11.1%) |
| 1 or 2 Children | 0 (0.0%) | 0 (0.0%) |
| 3 or 4 Children | 0 (0.0%) | 3 (50.0%) |
| 5 or more Children | 0 (0.0%) | 0 (0.0%) |
| Total | 0 (0.0%) | 4 (23.5%) |
Race in Painter
The most populous races in Painter are White / Caucasian (153 | 62.7%), Hispanic or Latino (52 | 21.3%), and Two or more Races (43 | 17.6%).
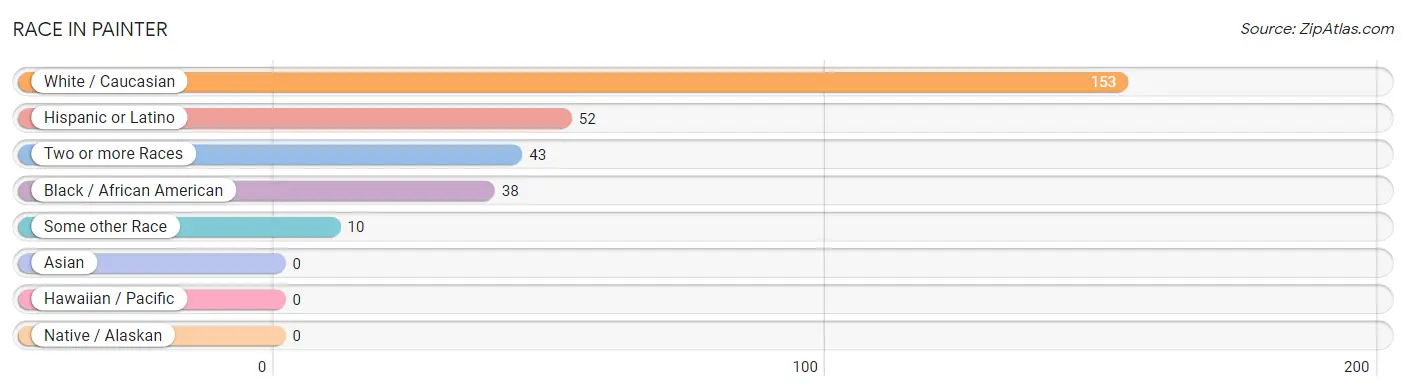
| Race | # Population | % Population |
| Asian | 0 | 0.0% |
| Black / African American | 38 | 15.6% |
| Hawaiian / Pacific | 0 | 0.0% |
| Hispanic or Latino | 52 | 21.3% |
| Native / Alaskan | 0 | 0.0% |
| White / Caucasian | 153 | 62.7% |
| Two or more Races | 43 | 17.6% |
| Some other Race | 10 | 4.1% |
| Total | 244 | 100.0% |
Ancestry in Painter
The most populous ancestries reported in Painter are American (75 | 30.7%), Mexican (48 | 19.7%), Irish (27 | 11.1%), German (24 | 9.8%), and English (22 | 9.0%), together accounting for 80.3% of all Painter residents.
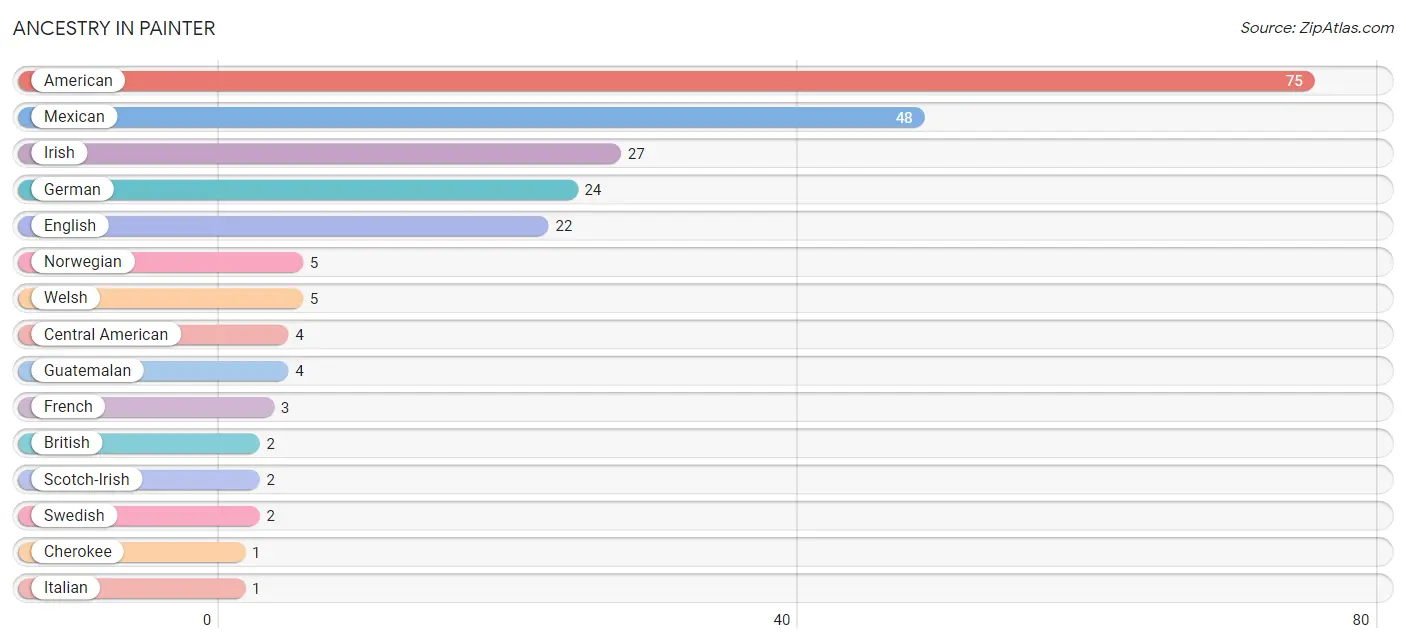
| Ancestry | # Population | % Population |
| American | 75 | 30.7% |
| British | 2 | 0.8% |
| Central American | 4 | 1.6% |
| Cherokee | 1 | 0.4% |
| English | 22 | 9.0% |
| French | 3 | 1.2% |
| German | 24 | 9.8% |
| Guatemalan | 4 | 1.6% |
| Irish | 27 | 11.1% |
| Italian | 1 | 0.4% |
| Mexican | 48 | 19.7% |
| Norwegian | 5 | 2.1% |
| Scotch-Irish | 2 | 0.8% |
| Swedish | 2 | 0.8% |
| Welsh | 5 | 2.1% | View All 15 Rows |
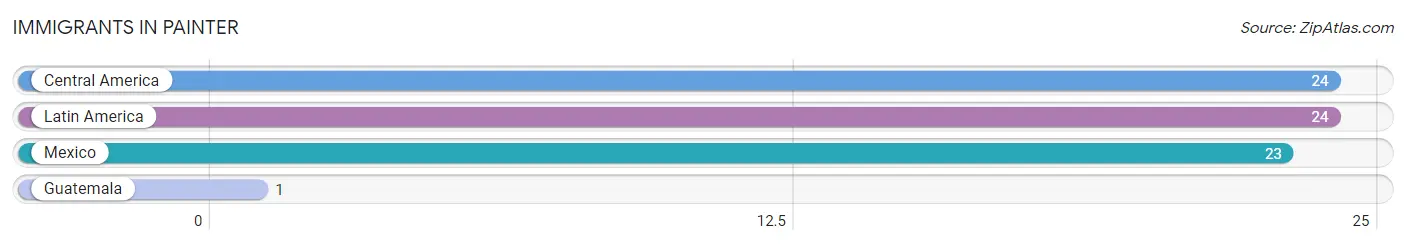
Immigrants in Painter
The most numerous immigrant groups reported in Painter came from Central America (24 | 9.8%), Latin America (24 | 9.8%), Mexico (23 | 9.4%), and Guatemala (1 | 0.4%), together accounting for 29.5% of all Painter residents.
| Immigration Origin | # Population | % Population |
| Central America | 24 | 9.8% |
| Guatemala | 1 | 0.4% |
| Latin America | 24 | 9.8% |
| Mexico | 23 | 9.4% | View All 4 Rows |
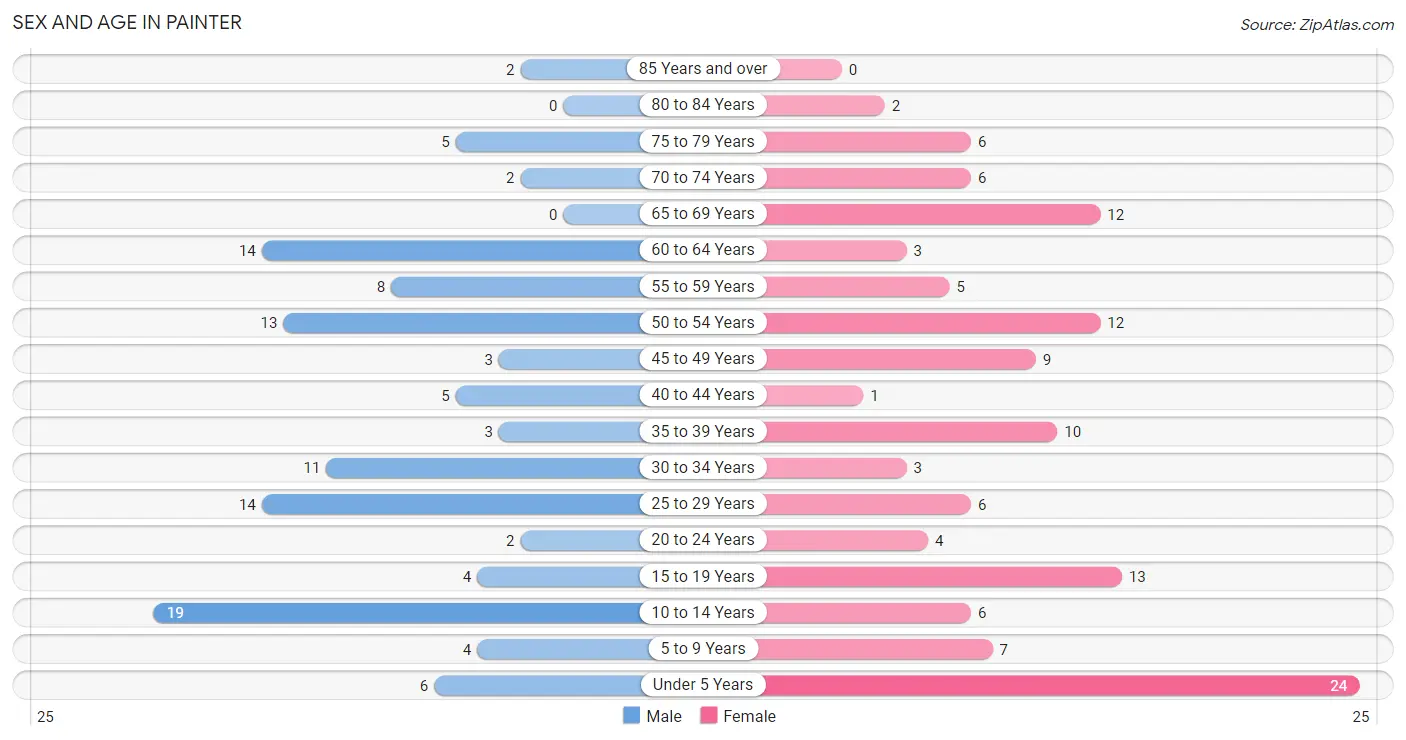
Sex and Age in Painter
Sex and Age in Painter
The most populous age groups in Painter are 10 to 14 Years (19 | 16.5%) for men and Under 5 Years (24 | 18.6%) for women.
| Age Bracket | Male | Female |
| Under 5 Years | 6 (5.2%) | 24 (18.6%) |
| 5 to 9 Years | 4 (3.5%) | 7 (5.4%) |
| 10 to 14 Years | 19 (16.5%) | 6 (4.6%) |
| 15 to 19 Years | 4 (3.5%) | 13 (10.1%) |
| 20 to 24 Years | 2 (1.7%) | 4 (3.1%) |
| 25 to 29 Years | 14 (12.2%) | 6 (4.6%) |
| 30 to 34 Years | 11 (9.6%) | 3 (2.3%) |
| 35 to 39 Years | 3 (2.6%) | 10 (7.7%) |
| 40 to 44 Years | 5 (4.3%) | 1 (0.8%) |
| 45 to 49 Years | 3 (2.6%) | 9 (7.0%) |
| 50 to 54 Years | 13 (11.3%) | 12 (9.3%) |
| 55 to 59 Years | 8 (7.0%) | 5 (3.9%) |
| 60 to 64 Years | 14 (12.2%) | 3 (2.3%) |
| 65 to 69 Years | 0 (0.0%) | 12 (9.3%) |
| 70 to 74 Years | 2 (1.7%) | 6 (4.6%) |
| 75 to 79 Years | 5 (4.3%) | 6 (4.6%) |
| 80 to 84 Years | 0 (0.0%) | 2 (1.5%) |
| 85 Years and over | 2 (1.7%) | 0 (0.0%) |
| Total | 115 (100.0%) | 129 (100.0%) |
Families and Households in Painter
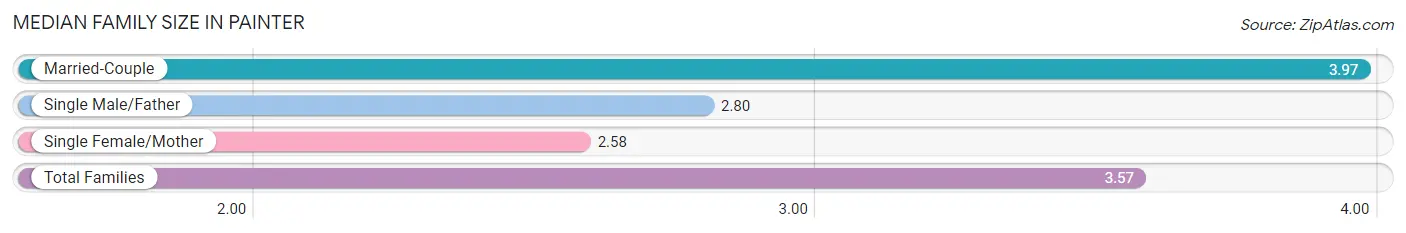
Median Family Size in Painter
The median family size in Painter is 3.57 persons per family, with married-couple families (39 | 69.6%) accounting for the largest median family size of 3.97 persons per family. On the other hand, single female/mother families (12 | 21.4%) represent the smallest median family size with 2.58 persons per family.
| Family Type | # Families | Family Size |
| Married-Couple | 39 (69.6%) | 3.97 |
| Single Male/Father | 5 (8.9%) | 2.80 |
| Single Female/Mother | 12 (21.4%) | 2.58 |
| Total Families | 56 (100.0%) | 3.57 |
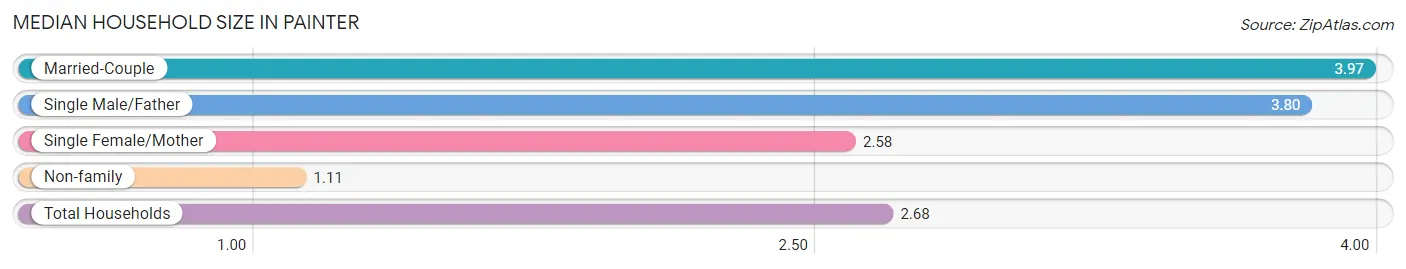
Median Household Size in Painter
The median household size in Painter is 2.68 persons per household, with married-couple households (39 | 42.9%) accounting for the largest median household size of 3.97 persons per household. non-family households (35 | 38.5%) represent the smallest median household size with 1.11 persons per household.
| Household Type | # Households | Household Size |
| Married-Couple | 39 (42.9%) | 3.97 |
| Single Male/Father | 5 (5.5%) | 3.80 |
| Single Female/Mother | 12 (13.2%) | 2.58 |
| Non-family | 35 (38.5%) | 1.11 |
| Total Households | 91 (100.0%) | 2.68 |
Household Size by Marriage Status in Painter
Out of a total of 91 households in Painter, 56 (61.5%) are family households, while 35 (38.5%) are nonfamily households. The most numerous type of family households are 2-person households, comprising 18, and the most common type of nonfamily households are 1-person households, comprising 30.
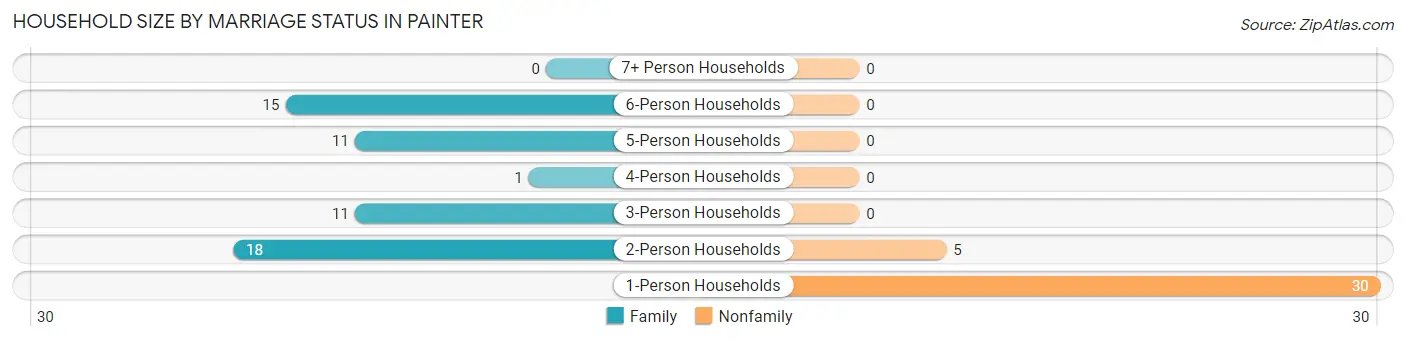
| Household Size | Family Households | Nonfamily Households |
| 1-Person Households | - | 30 (33.0%) |
| 2-Person Households | 18 (19.8%) | 5 (5.5%) |
| 3-Person Households | 11 (12.1%) | 0 (0.0%) |
| 4-Person Households | 1 (1.1%) | 0 (0.0%) |
| 5-Person Households | 11 (12.1%) | 0 (0.0%) |
| 6-Person Households | 15 (16.5%) | 0 (0.0%) |
| 7+ Person Households | 0 (0.0%) | 0 (0.0%) |
| Total | 56 (61.5%) | 35 (38.5%) |
Female Fertility in Painter
Fertility by Age in Painter
| Age Bracket | Women with Births | Births / 1,000 Women |
| 15 to 19 years | 0 (0.0%) | 0.0 |
| 20 to 34 years | 0 (0.0%) | 0.0 |
| 35 to 50 years | 0 (0.0%) | 0.0 |
| Total | 0 (0.0%) | 0.0 |
Fertility by Age by Marriage Status in Painter
| Age Bracket | Married | Unmarried |
| 15 to 19 years | 0 (0.0%) | 0 (0.0%) |
| 20 to 34 years | 0 (0.0%) | 0 (0.0%) |
| 35 to 50 years | 0 (0.0%) | 0 (0.0%) |
| Total | 0 (0.0%) | 0 (0.0%) |
Fertility by Education in Painter
| Educational Attainment | Women with Births | Births / 1,000 Women |
| Less than High School | 0 (0.0%) | 0.0 |
| High School Diploma | 0 (0.0%) | 0.0 |
| College or Associate's Degree | 0 (0.0%) | 0.0 |
| Bachelor's Degree | 0 (0.0%) | 0.0 |
| Graduate Degree | 0 (0.0%) | 0.0 |
| Total | 0 (0.0%) | 0.0 |
Fertility by Education by Marriage Status in Painter
| Educational Attainment | Married | Unmarried |
| Less than High School | 0 (0.0%) | 0 (0.0%) |
| High School Diploma | 0 (0.0%) | 0 (0.0%) |
| College or Associate's Degree | 0 (0.0%) | 0 (0.0%) |
| Bachelor's Degree | 0 (0.0%) | 0 (0.0%) |
| Graduate Degree | 0 (0.0%) | 0 (0.0%) |
| Total | 0 (0.0%) | 0 (0.0%) |
Employment Characteristics in Painter
Employment by Class of Employer in Painter
Among the 90 employed individuals in Painter, private company employees (61 | 67.8%), self-employed (not incorporated) (10 | 11.1%), and not-for-profit organizations (6 | 6.7%) make up the most common classes of employment.
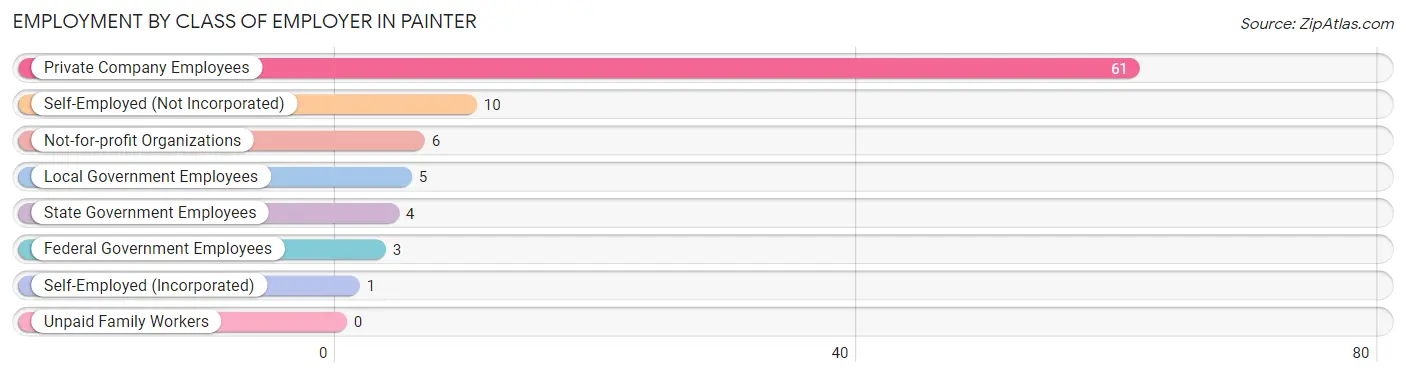
| Employer Class | # Employees | % Employees |
| Private Company Employees | 61 | 67.8% |
| Self-Employed (Incorporated) | 1 | 1.1% |
| Self-Employed (Not Incorporated) | 10 | 11.1% |
| Not-for-profit Organizations | 6 | 6.7% |
| Local Government Employees | 5 | 5.6% |
| State Government Employees | 4 | 4.4% |
| Federal Government Employees | 3 | 3.3% |
| Unpaid Family Workers | 0 | 0.0% |
| Total | 90 | 100.0% |
Employment Status by Age in Painter
According to the labor force statistics for Painter, out of the total population over 16 years of age (164), 57.3% or 94 individuals are in the labor force, with 1.1% or 1 of them unemployed. The age group with the highest labor force participation rate is 35 to 44 years, with 94.7% or 18 individuals in the labor force. Within the labor force, the 45 to 54 years age range has the highest percentage of unemployed individuals, with 3.6% or 1 of them being unemployed.
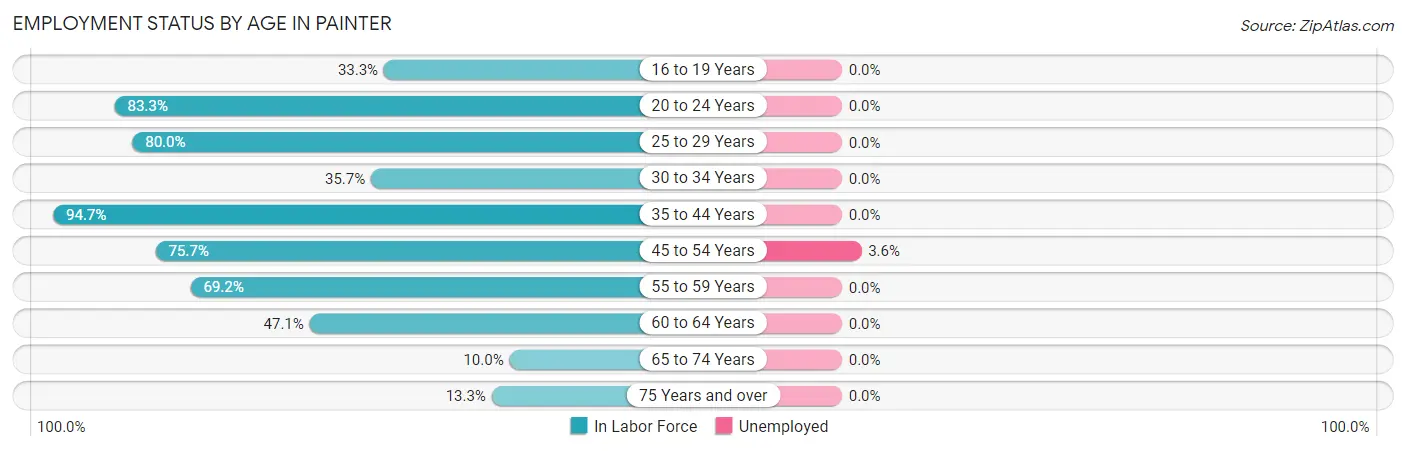
| Age Bracket | In Labor Force | Unemployed |
| 16 to 19 Years | 1 (33.3%) | 0 (0.0%) |
| 20 to 24 Years | 5 (83.3%) | 0 (0.0%) |
| 25 to 29 Years | 16 (80.0%) | 0 (0.0%) |
| 30 to 34 Years | 5 (35.7%) | 0 (0.0%) |
| 35 to 44 Years | 18 (94.7%) | 0 (0.0%) |
| 45 to 54 Years | 28 (75.7%) | 1 (3.6%) |
| 55 to 59 Years | 9 (69.2%) | 0 (0.0%) |
| 60 to 64 Years | 8 (47.1%) | 0 (0.0%) |
| 65 to 74 Years | 2 (10.0%) | 0 (0.0%) |
| 75 Years and over | 2 (13.3%) | 0 (0.0%) |
| Total | 94 (57.3%) | 1 (1.1%) |
Employment Status by Educational Attainment in Painter
According to labor force statistics for Painter, 70.0% of individuals (84) out of the total population between 25 and 64 years of age (120) are in the labor force, with 1.2% or 1 of them being unemployed. The group with the highest labor force participation rate are those with the educational attainment of bachelor's degree or higher, with 100.0% or 14 individuals in the labor force. Within the labor force, individuals with high school diploma education have the highest percentage of unemployment, with 4.2% or 1 of them being unemployed.
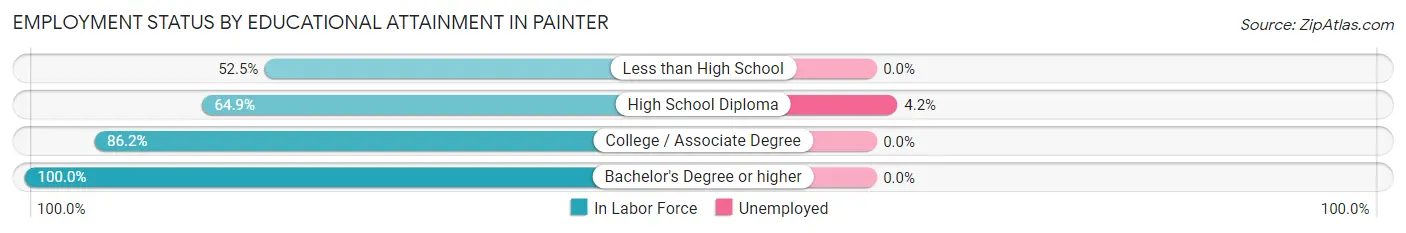
| Educational Attainment | In Labor Force | Unemployed |
| Less than High School | 21 (52.5%) | 0 (0.0%) |
| High School Diploma | 24 (64.9%) | 2 (4.2%) |
| College / Associate Degree | 25 (86.2%) | 0 (0.0%) |
| Bachelor's Degree or higher | 14 (100.0%) | 0 (0.0%) |
| Total | 84 (70.0%) | 1 (1.2%) |
Employment Occupations by Sex in Painter
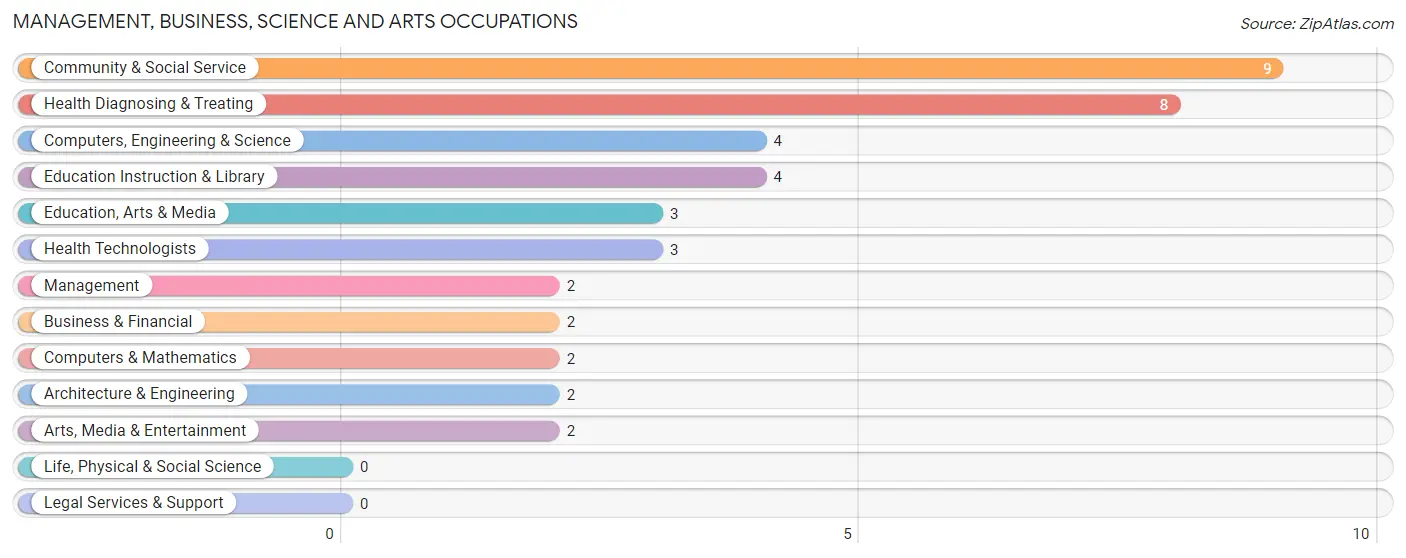
Management, Business, Science and Arts Occupations
The most common Management, Business, Science and Arts occupations in Painter are Community & Social Service (9 | 9.7%), Health Diagnosing & Treating (8 | 8.6%), Computers, Engineering & Science (4 | 4.3%), Education Instruction & Library (4 | 4.3%), and Education, Arts & Media (3 | 3.2%).
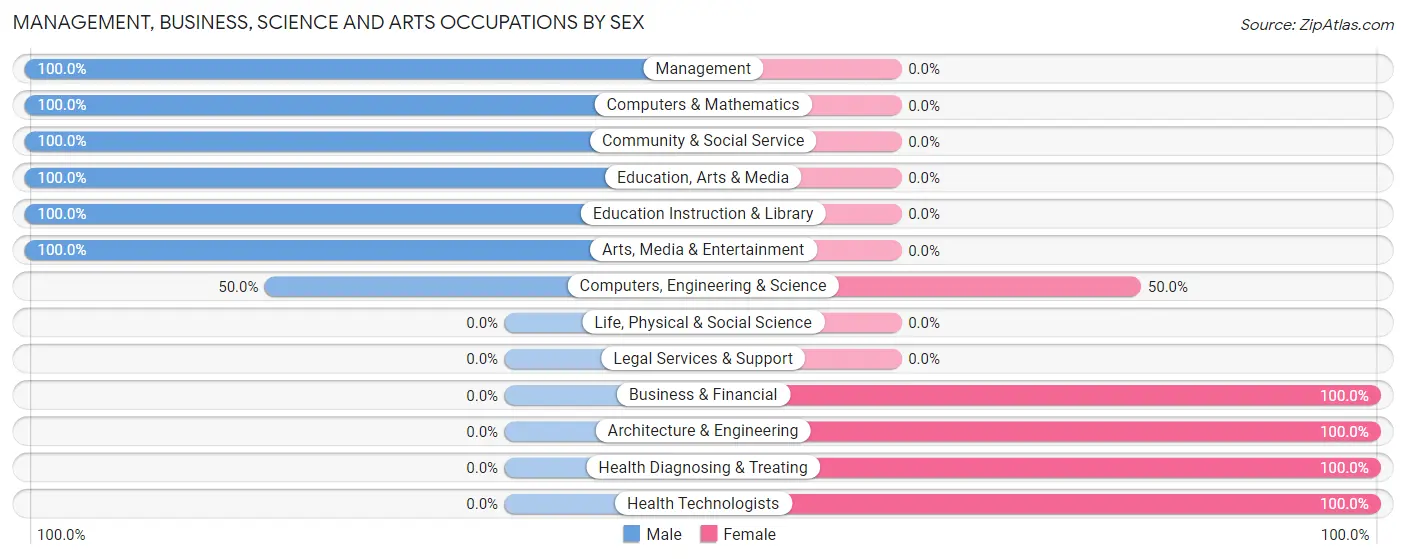
Management, Business, Science and Arts Occupations by Sex
Within the Management, Business, Science and Arts occupations in Painter, the most male-oriented occupations are Management (100.0%), Computers & Mathematics (100.0%), and Community & Social Service (100.0%), while the most female-oriented occupations are Business & Financial (100.0%), Architecture & Engineering (100.0%), and Health Diagnosing & Treating (100.0%).
| Occupation | Male | Female |
| Management | 2 (100.0%) | 0 (0.0%) |
| Business & Financial | 0 (0.0%) | 2 (100.0%) |
| Computers, Engineering & Science | 2 (50.0%) | 2 (50.0%) |
| Computers & Mathematics | 2 (100.0%) | 0 (0.0%) |
| Architecture & Engineering | 0 (0.0%) | 2 (100.0%) |
| Life, Physical & Social Science | 0 (0.0%) | 0 (0.0%) |
| Community & Social Service | 9 (100.0%) | 0 (0.0%) |
| Education, Arts & Media | 3 (100.0%) | 0 (0.0%) |
| Legal Services & Support | 0 (0.0%) | 0 (0.0%) |
| Education Instruction & Library | 4 (100.0%) | 0 (0.0%) |
| Arts, Media & Entertainment | 2 (100.0%) | 0 (0.0%) |
| Health Diagnosing & Treating | 0 (0.0%) | 8 (100.0%) |
| Health Technologists | 0 (0.0%) | 3 (100.0%) |
| Total (Category) | 13 (52.0%) | 12 (48.0%) |
| Total (Overall) | 52 (55.9%) | 41 (44.1%) |
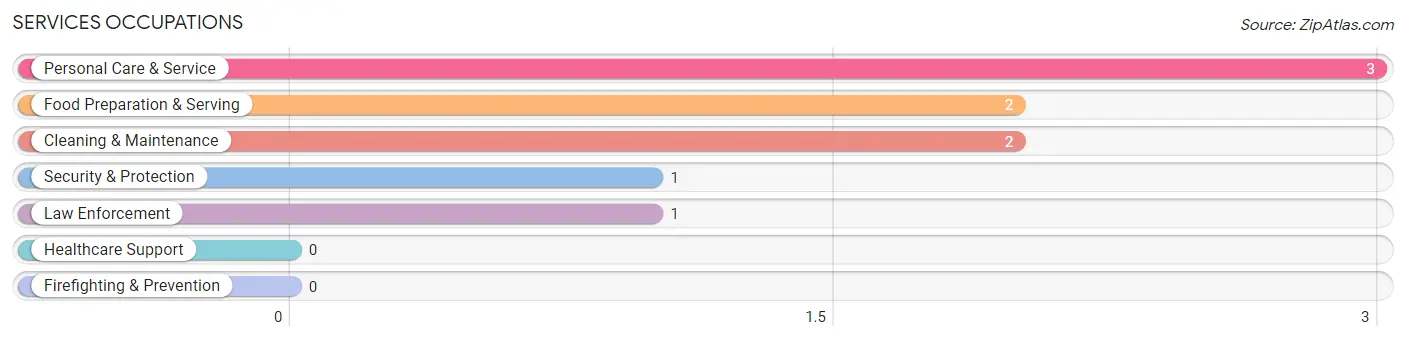
Services Occupations
The most common Services occupations in Painter are Personal Care & Service (3 | 3.2%), Food Preparation & Serving (2 | 2.1%), Cleaning & Maintenance (2 | 2.1%), Security & Protection (1 | 1.1%), and Law Enforcement (1 | 1.1%).
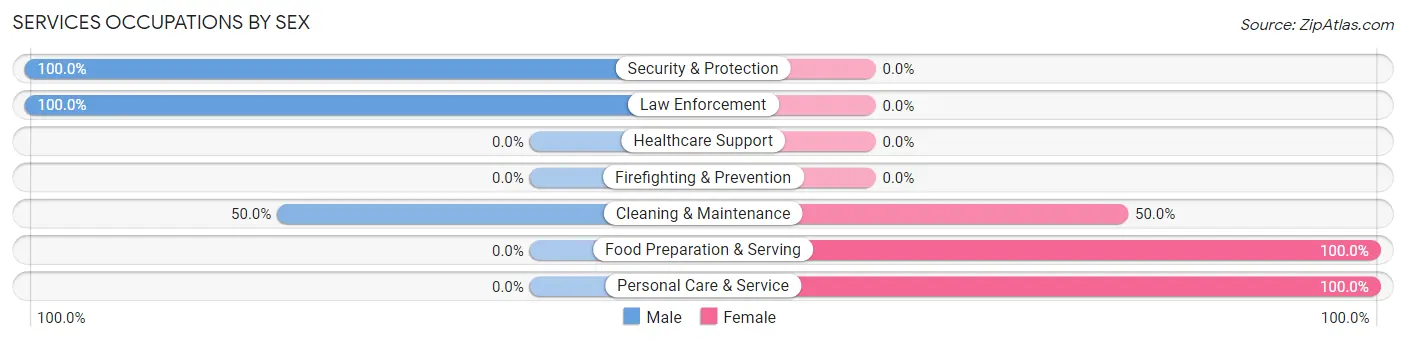
Services Occupations by Sex
Within the Services occupations in Painter, the most male-oriented occupations are Security & Protection (100.0%), Law Enforcement (100.0%), and Cleaning & Maintenance (50.0%), while the most female-oriented occupations are Food Preparation & Serving (100.0%), Personal Care & Service (100.0%), and Cleaning & Maintenance (50.0%).
| Occupation | Male | Female |
| Healthcare Support | 0 (0.0%) | 0 (0.0%) |
| Security & Protection | 1 (100.0%) | 0 (0.0%) |
| Firefighting & Prevention | 0 (0.0%) | 0 (0.0%) |
| Law Enforcement | 1 (100.0%) | 0 (0.0%) |
| Food Preparation & Serving | 0 (0.0%) | 2 (100.0%) |
| Cleaning & Maintenance | 1 (50.0%) | 1 (50.0%) |
| Personal Care & Service | 0 (0.0%) | 3 (100.0%) |
| Total (Category) | 2 (25.0%) | 6 (75.0%) |
| Total (Overall) | 52 (55.9%) | 41 (44.1%) |
Sales and Office Occupations
The most common Sales and Office occupations in Painter are Office & Administration (17 | 18.3%), and Sales & Related (12 | 12.9%).
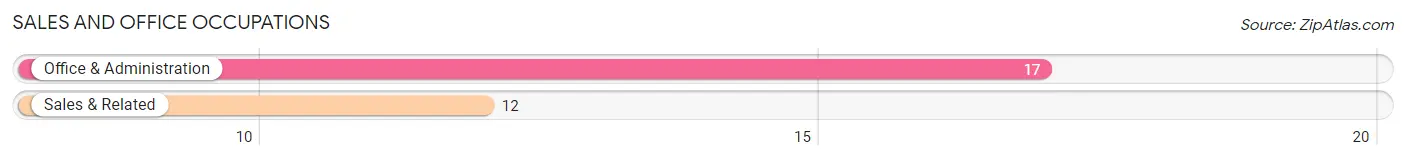
Sales and Office Occupations by Sex
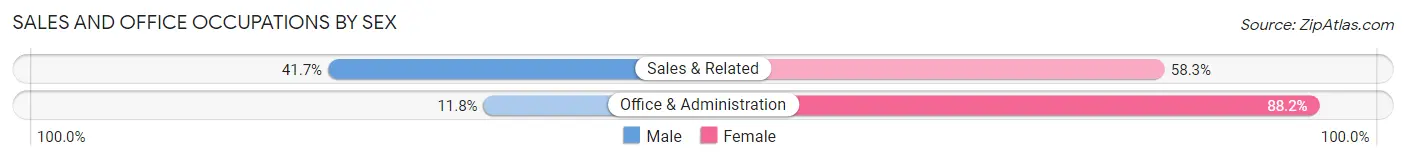
| Occupation | Male | Female |
| Sales & Related | 5 (41.7%) | 7 (58.3%) |
| Office & Administration | 2 (11.8%) | 15 (88.2%) |
| Total (Category) | 7 (24.1%) | 22 (75.9%) |
| Total (Overall) | 52 (55.9%) | 41 (44.1%) |
Natural Resources, Construction and Maintenance Occupations
The most common Natural Resources, Construction and Maintenance occupations in Painter are Construction & Extraction (14 | 15.0%), and Installation, Maintenance & Repair (10 | 10.7%).
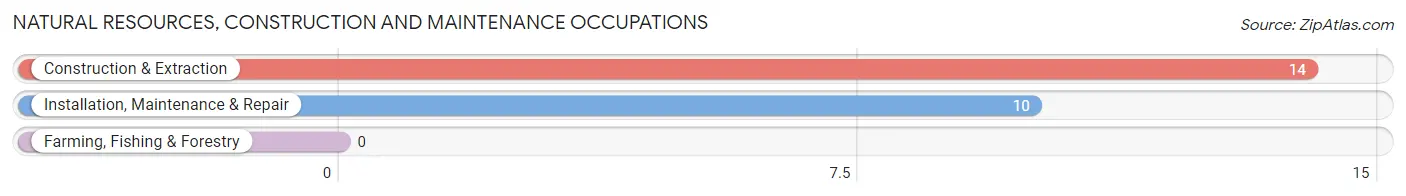
Natural Resources, Construction and Maintenance Occupations by Sex
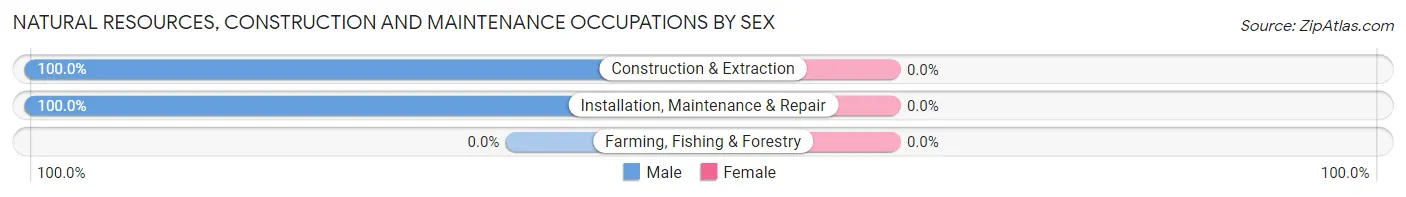
| Occupation | Male | Female |
| Farming, Fishing & Forestry | 0 (0.0%) | 0 (0.0%) |
| Construction & Extraction | 14 (100.0%) | 0 (0.0%) |
| Installation, Maintenance & Repair | 10 (100.0%) | 0 (0.0%) |
| Total (Category) | 24 (100.0%) | 0 (0.0%) |
| Total (Overall) | 52 (55.9%) | 41 (44.1%) |
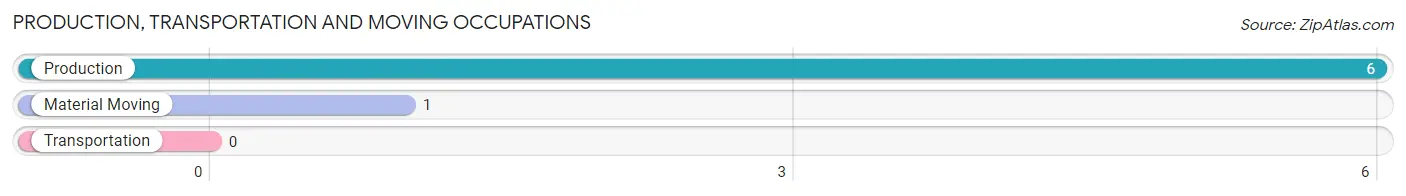
Production, Transportation and Moving Occupations
The most common Production, Transportation and Moving occupations in Painter are Production (6 | 6.5%), and Material Moving (1 | 1.1%).
Production, Transportation and Moving Occupations by Sex
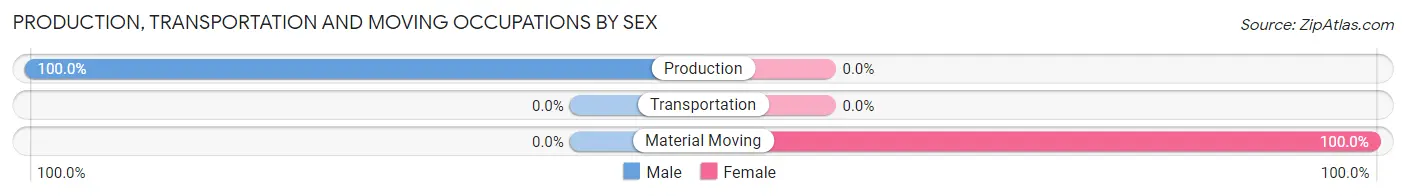
| Occupation | Male | Female |
| Production | 6 (100.0%) | 0 (0.0%) |
| Transportation | 0 (0.0%) | 0 (0.0%) |
| Material Moving | 0 (0.0%) | 1 (100.0%) |
| Total (Category) | 6 (85.7%) | 1 (14.3%) |
| Total (Overall) | 52 (55.9%) | 41 (44.1%) |
Employment Industries by Sex in Painter
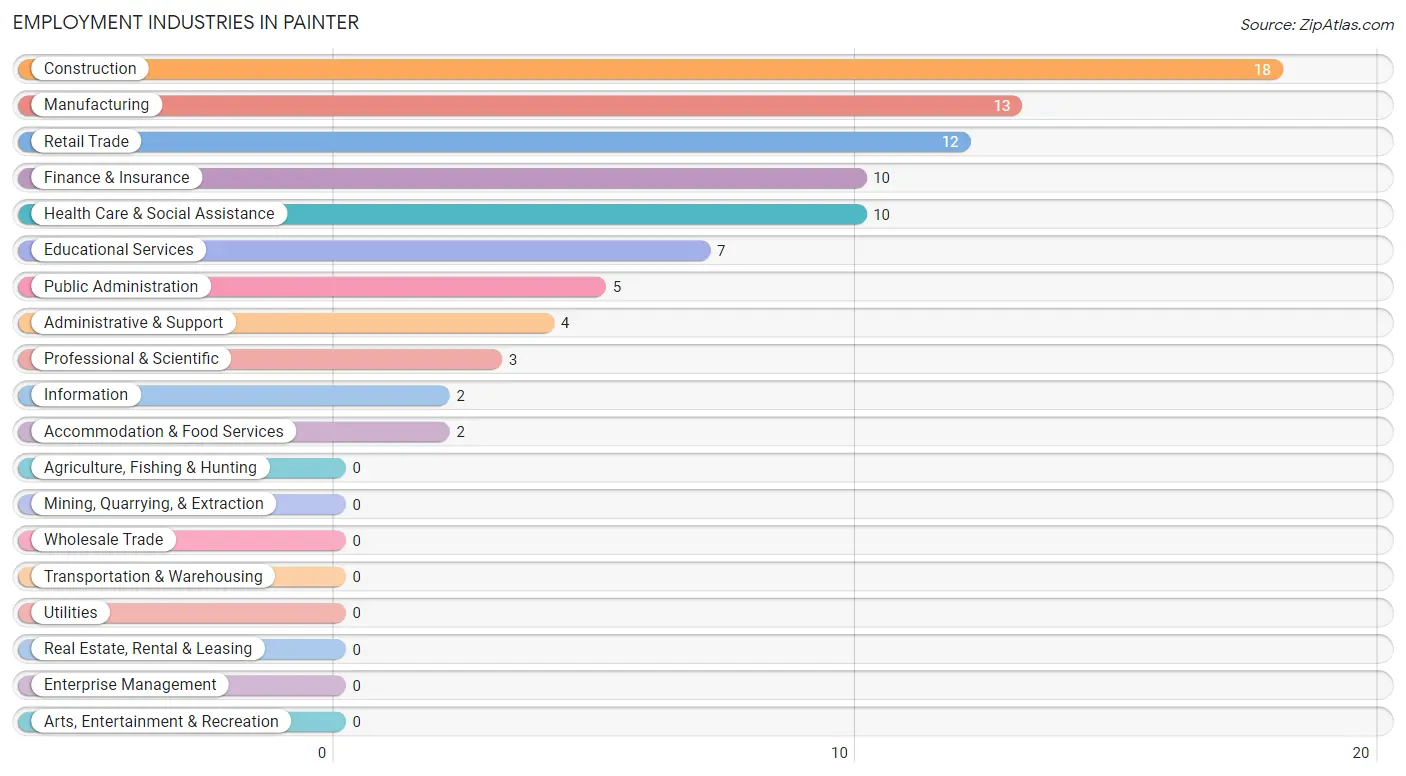
Employment Industries in Painter
The major employment industries in Painter include Construction (18 | 19.4%), Manufacturing (13 | 14.0%), Retail Trade (12 | 12.9%), Finance & Insurance (10 | 10.7%), and Health Care & Social Assistance (10 | 10.7%).
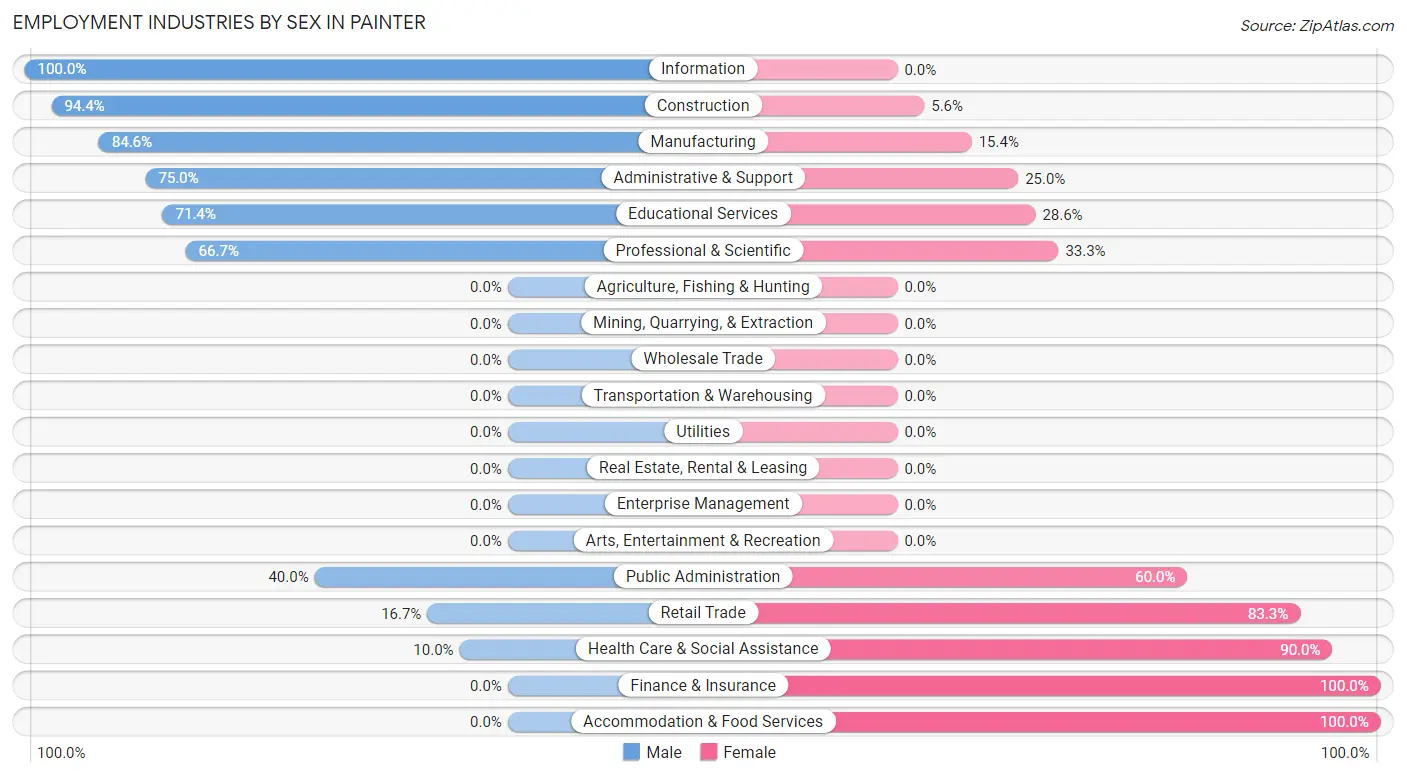
Employment Industries by Sex in Painter
The Painter industries that see more men than women are Information (100.0%), Construction (94.4%), and Manufacturing (84.6%), whereas the industries that tend to have a higher number of women are Finance & Insurance (100.0%), Accommodation & Food Services (100.0%), and Health Care & Social Assistance (90.0%).
| Industry | Male | Female |
| Agriculture, Fishing & Hunting | 0 (0.0%) | 0 (0.0%) |
| Mining, Quarrying, & Extraction | 0 (0.0%) | 0 (0.0%) |
| Construction | 17 (94.4%) | 1 (5.6%) |
| Manufacturing | 11 (84.6%) | 2 (15.4%) |
| Wholesale Trade | 0 (0.0%) | 0 (0.0%) |
| Retail Trade | 2 (16.7%) | 10 (83.3%) |
| Transportation & Warehousing | 0 (0.0%) | 0 (0.0%) |
| Utilities | 0 (0.0%) | 0 (0.0%) |
| Information | 2 (100.0%) | 0 (0.0%) |
| Finance & Insurance | 0 (0.0%) | 10 (100.0%) |
| Real Estate, Rental & Leasing | 0 (0.0%) | 0 (0.0%) |
| Professional & Scientific | 2 (66.7%) | 1 (33.3%) |
| Enterprise Management | 0 (0.0%) | 0 (0.0%) |
| Administrative & Support | 3 (75.0%) | 1 (25.0%) |
| Educational Services | 5 (71.4%) | 2 (28.6%) |
| Health Care & Social Assistance | 1 (10.0%) | 9 (90.0%) |
| Arts, Entertainment & Recreation | 0 (0.0%) | 0 (0.0%) |
| Accommodation & Food Services | 0 (0.0%) | 2 (100.0%) |
| Public Administration | 2 (40.0%) | 3 (60.0%) |
| Total | 52 (55.9%) | 41 (44.1%) |
Education in Painter
School Enrollment in Painter
The most common levels of schooling among the 66 students in Painter are middle school (26 | 39.4%), high school (15 | 22.7%), and elementary school (9 | 13.6%).
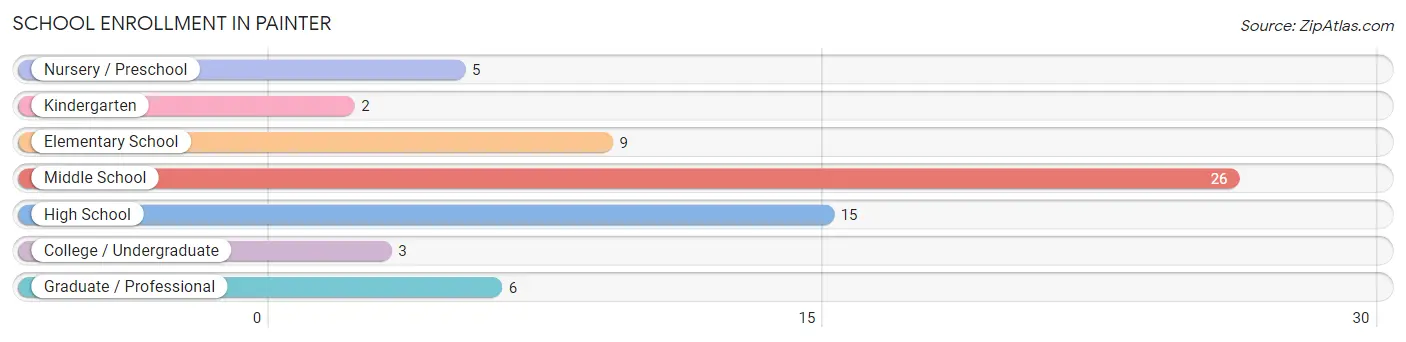
| School Level | # Students | % Students |
| Nursery / Preschool | 5 | 7.6% |
| Kindergarten | 2 | 3.0% |
| Elementary School | 9 | 13.6% |
| Middle School | 26 | 39.4% |
| High School | 15 | 22.7% |
| College / Undergraduate | 3 | 4.5% |
| Graduate / Professional | 6 | 9.1% |
| Total | 66 | 100.0% |
School Enrollment by Age by Funding Source in Painter
Out of a total of 66 students who are enrolled in schools in Painter, 12 (18.2%) attend a private institution, while the remaining 54 (81.8%) are enrolled in public schools. The age group of 25 to 34 year olds has the highest likelihood of being enrolled in private schools, with 6 (66.7% in the age bracket) enrolled. Conversely, the age group of 3 to 4 year olds has the lowest likelihood of being enrolled in a private school, with 5 (100.0% in the age bracket) attending a public institution.
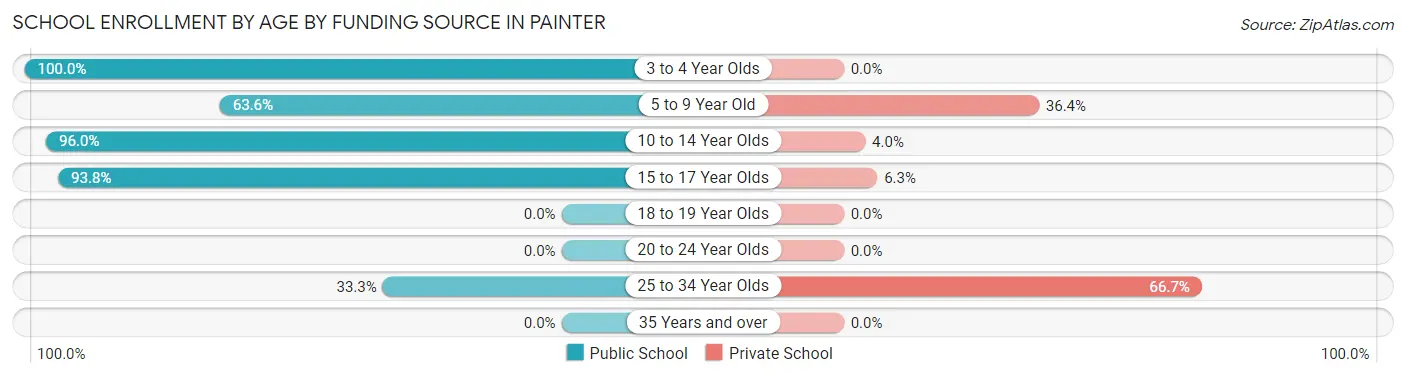
| Age Bracket | Public School | Private School |
| 3 to 4 Year Olds | 5 (100.0%) | 0 (0.0%) |
| 5 to 9 Year Old | 7 (63.6%) | 4 (36.4%) |
| 10 to 14 Year Olds | 24 (96.0%) | 1 (4.0%) |
| 15 to 17 Year Olds | 15 (93.8%) | 1 (6.2%) |
| 18 to 19 Year Olds | 0 (0.0%) | 0 (0.0%) |
| 20 to 24 Year Olds | 0 (0.0%) | 0 (0.0%) |
| 25 to 34 Year Olds | 3 (33.3%) | 6 (66.7%) |
| 35 Years and over | 0 (0.0%) | 0 (0.0%) |
| Total | 54 (81.8%) | 12 (18.2%) |
Educational Attainment by Field of Study in Painter
Education (12 | 50.0%), engineering (3 | 12.5%), business (3 | 12.5%), visual & performing arts (3 | 12.5%), and physical & health sciences (1 | 4.2%) are the most common fields of study among 24 individuals in Painter who have obtained a bachelor's degree or higher.
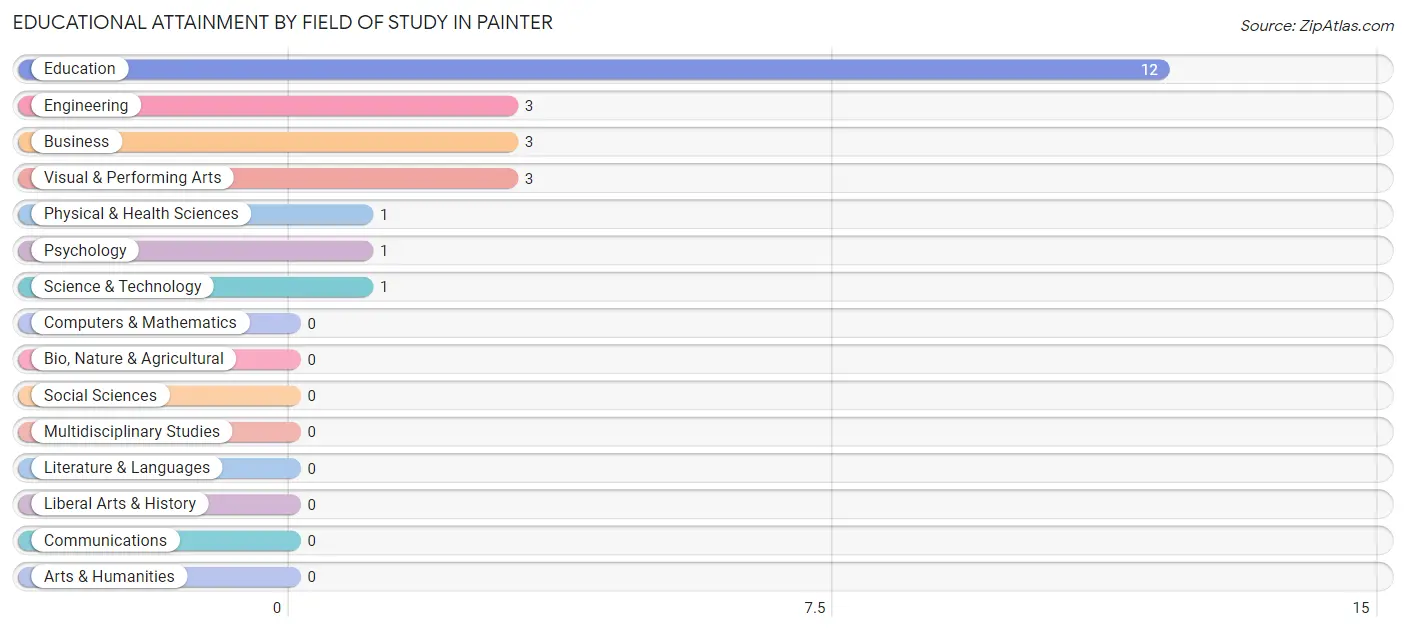
| Field of Study | # Graduates | % Graduates |
| Computers & Mathematics | 0 | 0.0% |
| Bio, Nature & Agricultural | 0 | 0.0% |
| Physical & Health Sciences | 1 | 4.2% |
| Psychology | 1 | 4.2% |
| Social Sciences | 0 | 0.0% |
| Engineering | 3 | 12.5% |
| Multidisciplinary Studies | 0 | 0.0% |
| Science & Technology | 1 | 4.2% |
| Business | 3 | 12.5% |
| Education | 12 | 50.0% |
| Literature & Languages | 0 | 0.0% |
| Liberal Arts & History | 0 | 0.0% |
| Visual & Performing Arts | 3 | 12.5% |
| Communications | 0 | 0.0% |
| Arts & Humanities | 0 | 0.0% |
| Total | 24 | 100.0% |
Transportation & Commute in Painter
Vehicle Availability by Sex in Painter
The most prevalent vehicle ownership categories in Painter are males with 4 vehicles (17, accounting for 32.7%) and females with 4 vehicles (9, making up 44.7%).
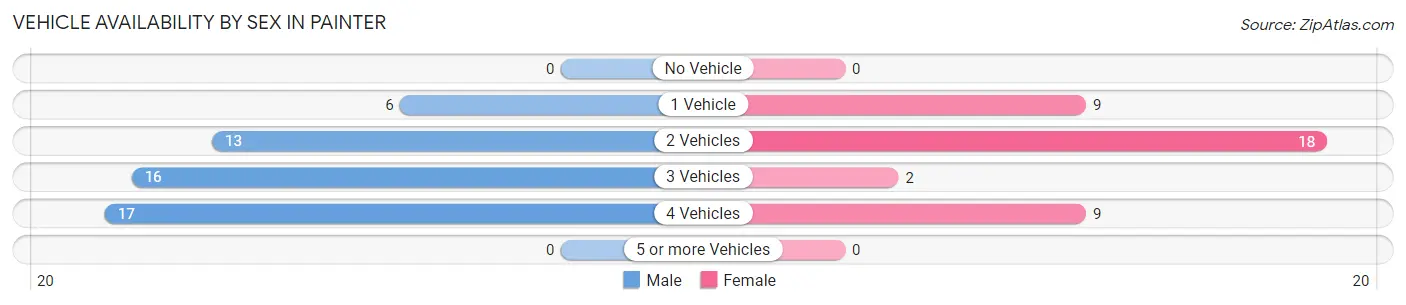
| Vehicles Available | Male | Female |
| No Vehicle | 0 (0.0%) | 0 (0.0%) |
| 1 Vehicle | 6 (11.5%) | 9 (23.7%) |
| 2 Vehicles | 13 (25.0%) | 18 (47.4%) |
| 3 Vehicles | 16 (30.8%) | 2 (5.3%) |
| 4 Vehicles | 17 (32.7%) | 9 (23.7%) |
| 5 or more Vehicles | 0 (0.0%) | 0 (0.0%) |
| Total | 52 (100.0%) | 38 (100.0%) |
Commute Time in Painter
The most frequently occuring commute durations in Painter are 15 to 19 minutes (27 commuters, 31.0%), 25 to 29 minutes (18 commuters, 20.7%), and 10 to 14 minutes (16 commuters, 18.4%).
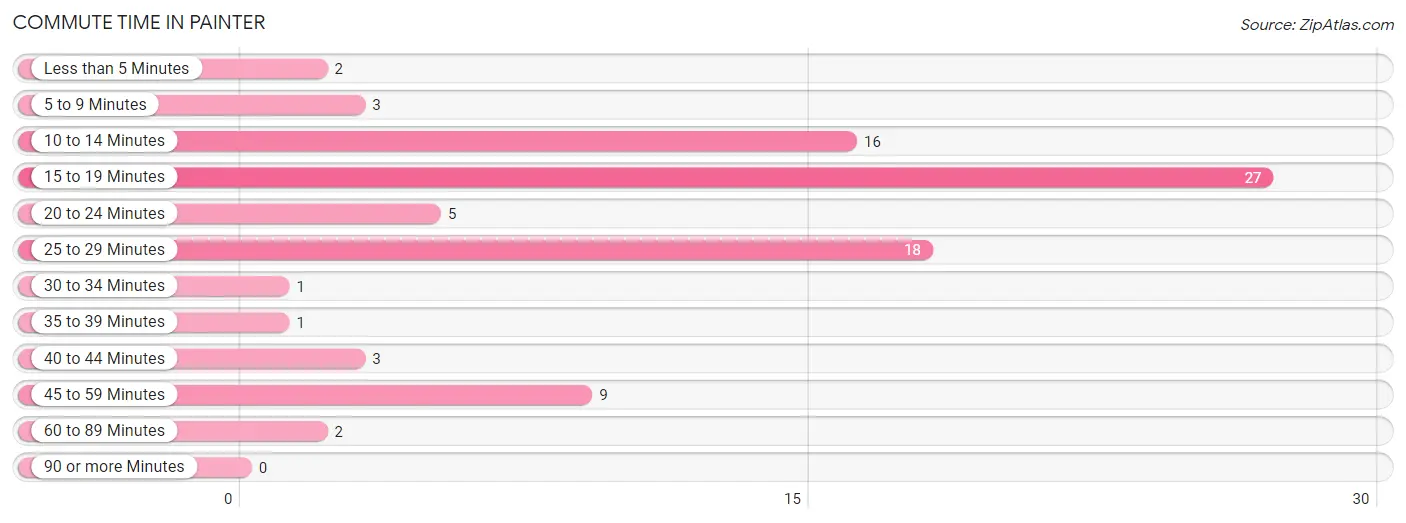
| Commute Time | # Commuters | % Commuters |
| Less than 5 Minutes | 2 | 2.3% |
| 5 to 9 Minutes | 3 | 3.5% |
| 10 to 14 Minutes | 16 | 18.4% |
| 15 to 19 Minutes | 27 | 31.0% |
| 20 to 24 Minutes | 5 | 5.8% |
| 25 to 29 Minutes | 18 | 20.7% |
| 30 to 34 Minutes | 1 | 1.1% |
| 35 to 39 Minutes | 1 | 1.1% |
| 40 to 44 Minutes | 3 | 3.5% |
| 45 to 59 Minutes | 9 | 10.3% |
| 60 to 89 Minutes | 2 | 2.3% |
| 90 or more Minutes | 0 | 0.0% |
Commute Time by Sex in Painter
The most common commute times in Painter are 15 to 19 minutes (18 commuters, 36.7%) for males and 10 to 14 minutes (15 commuters, 39.5%) for females.
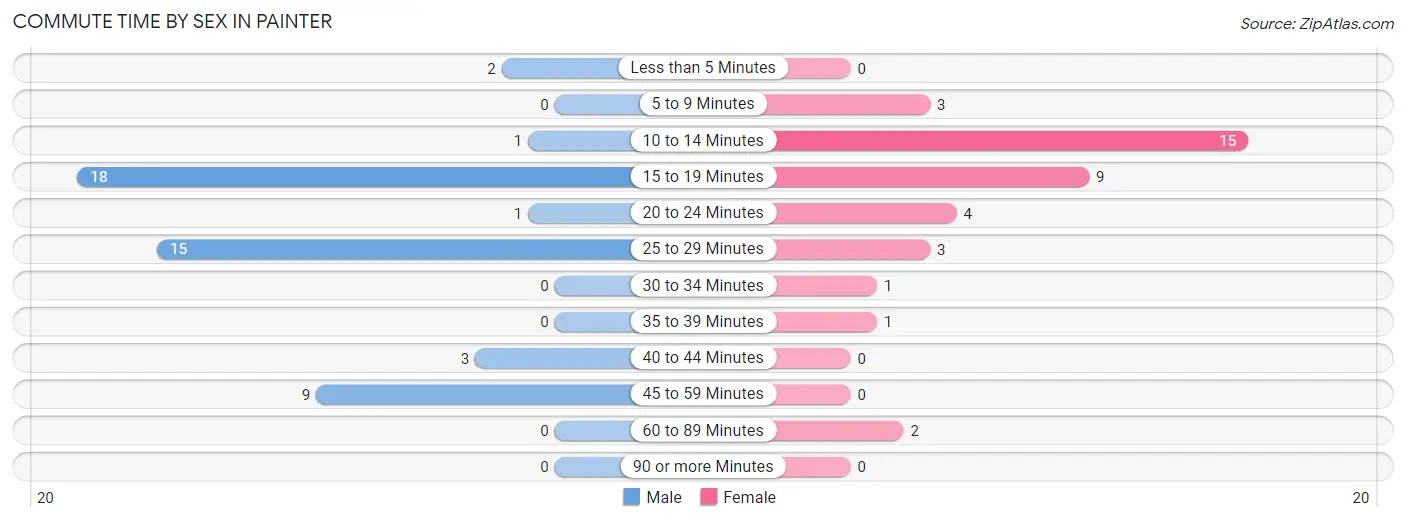
| Commute Time | Male | Female |
| Less than 5 Minutes | 2 (4.1%) | 0 (0.0%) |
| 5 to 9 Minutes | 0 (0.0%) | 3 (7.9%) |
| 10 to 14 Minutes | 1 (2.0%) | 15 (39.5%) |
| 15 to 19 Minutes | 18 (36.7%) | 9 (23.7%) |
| 20 to 24 Minutes | 1 (2.0%) | 4 (10.5%) |
| 25 to 29 Minutes | 15 (30.6%) | 3 (7.9%) |
| 30 to 34 Minutes | 0 (0.0%) | 1 (2.6%) |
| 35 to 39 Minutes | 0 (0.0%) | 1 (2.6%) |
| 40 to 44 Minutes | 3 (6.1%) | 0 (0.0%) |
| 45 to 59 Minutes | 9 (18.4%) | 0 (0.0%) |
| 60 to 89 Minutes | 0 (0.0%) | 2 (5.3%) |
| 90 or more Minutes | 0 (0.0%) | 0 (0.0%) |
Time of Departure to Work by Sex in Painter
The most frequent times of departure to work in Painter are 7:00 AM to 7:29 AM (16, 32.7%) for males and 6:30 AM to 6:59 AM (12, 31.6%) for females.
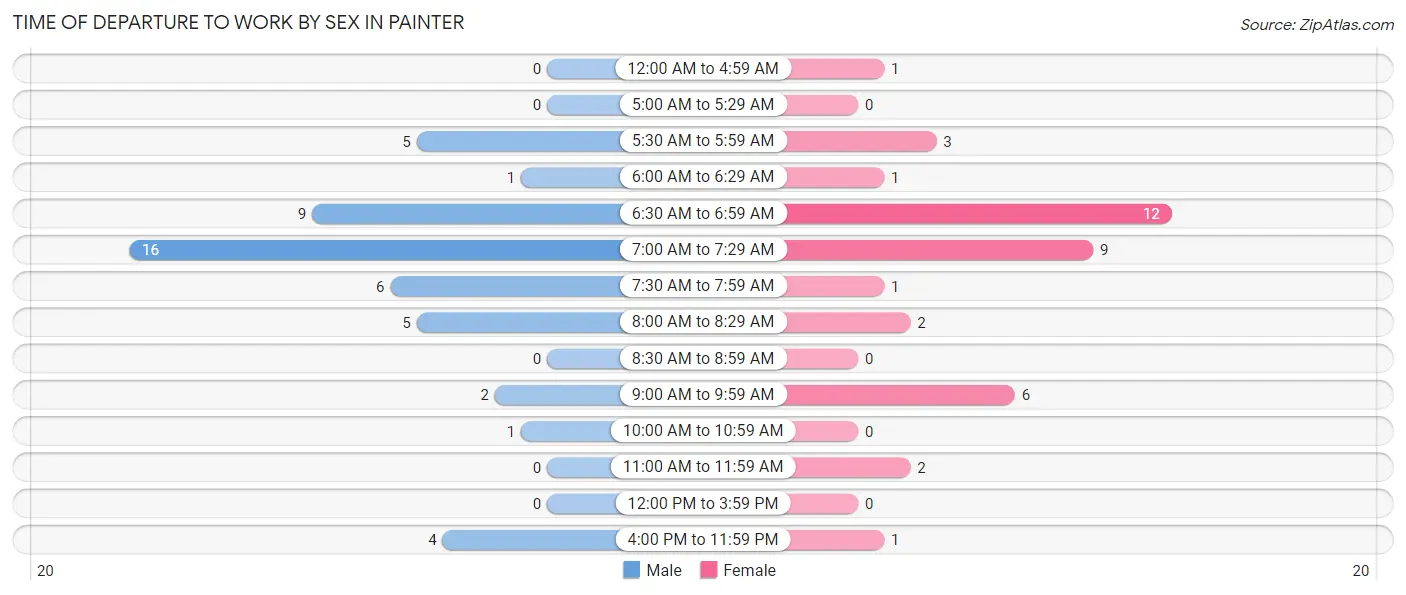
| Time of Departure | Male | Female |
| 12:00 AM to 4:59 AM | 0 (0.0%) | 1 (2.6%) |
| 5:00 AM to 5:29 AM | 0 (0.0%) | 0 (0.0%) |
| 5:30 AM to 5:59 AM | 5 (10.2%) | 3 (7.9%) |
| 6:00 AM to 6:29 AM | 1 (2.0%) | 1 (2.6%) |
| 6:30 AM to 6:59 AM | 9 (18.4%) | 12 (31.6%) |
| 7:00 AM to 7:29 AM | 16 (32.7%) | 9 (23.7%) |
| 7:30 AM to 7:59 AM | 6 (12.2%) | 1 (2.6%) |
| 8:00 AM to 8:29 AM | 5 (10.2%) | 2 (5.3%) |
| 8:30 AM to 8:59 AM | 0 (0.0%) | 0 (0.0%) |
| 9:00 AM to 9:59 AM | 2 (4.1%) | 6 (15.8%) |
| 10:00 AM to 10:59 AM | 1 (2.0%) | 0 (0.0%) |
| 11:00 AM to 11:59 AM | 0 (0.0%) | 2 (5.3%) |
| 12:00 PM to 3:59 PM | 0 (0.0%) | 0 (0.0%) |
| 4:00 PM to 11:59 PM | 4 (8.2%) | 1 (2.6%) |
| Total | 49 (100.0%) | 38 (100.0%) |
Housing Occupancy in Painter
Occupancy by Ownership in Painter
Of the total 91 dwellings in Painter, owner-occupied units account for 56 (61.5%), while renter-occupied units make up 35 (38.5%).
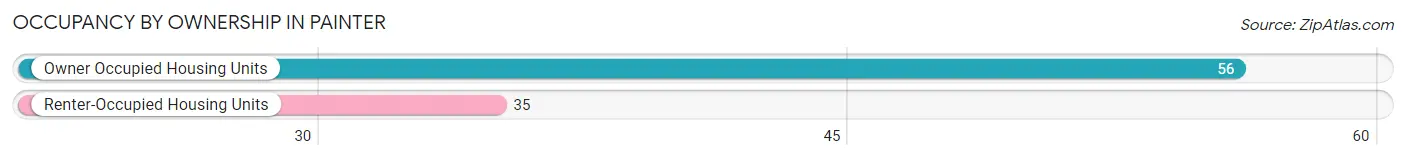
| Occupancy | # Housing Units | % Housing Units |
| Owner Occupied Housing Units | 56 | 61.5% |
| Renter-Occupied Housing Units | 35 | 38.5% |
| Total Occupied Housing Units | 91 | 100.0% |
Occupancy by Household Size in Painter
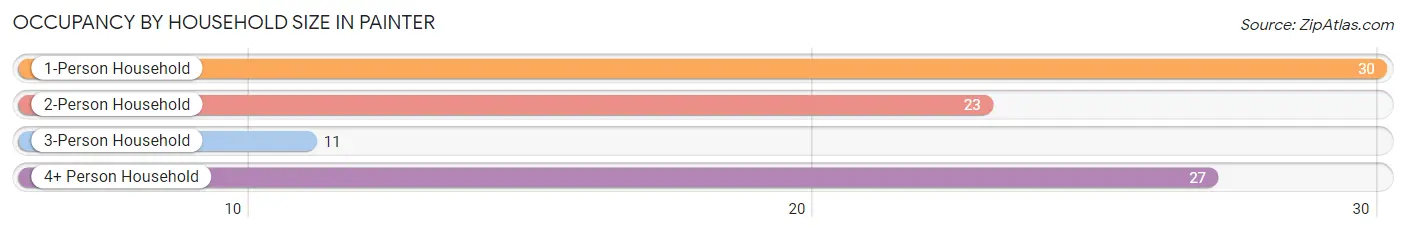
| Household Size | # Housing Units | % Housing Units |
| 1-Person Household | 30 | 33.0% |
| 2-Person Household | 23 | 25.3% |
| 3-Person Household | 11 | 12.1% |
| 4+ Person Household | 27 | 29.7% |
| Total Housing Units | 91 | 100.0% |
Occupancy by Ownership by Household Size in Painter
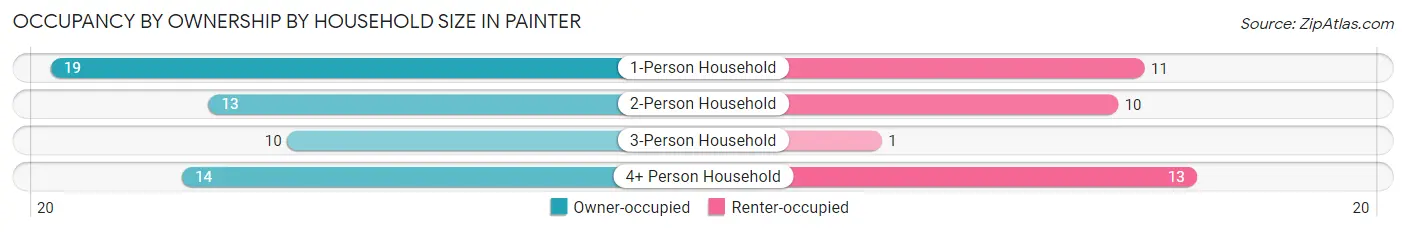
| Household Size | Owner-occupied | Renter-occupied |
| 1-Person Household | 19 (63.3%) | 11 (36.7%) |
| 2-Person Household | 13 (56.5%) | 10 (43.5%) |
| 3-Person Household | 10 (90.9%) | 1 (9.1%) |
| 4+ Person Household | 14 (51.8%) | 13 (48.1%) |
| Total Housing Units | 56 (61.5%) | 35 (38.5%) |
Occupancy by Educational Attainment in Painter
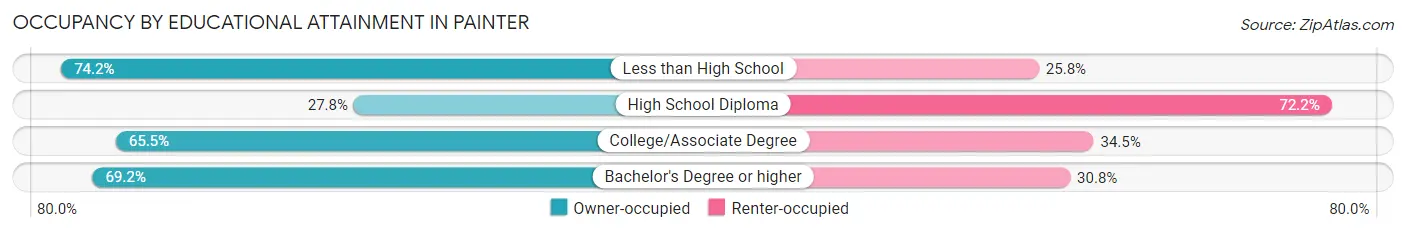
| Household Size | Owner-occupied | Renter-occupied |
| Less than High School | 23 (74.2%) | 8 (25.8%) |
| High School Diploma | 5 (27.8%) | 13 (72.2%) |
| College/Associate Degree | 19 (65.5%) | 10 (34.5%) |
| Bachelor's Degree or higher | 9 (69.2%) | 4 (30.8%) |
Occupancy by Age of Householder in Painter
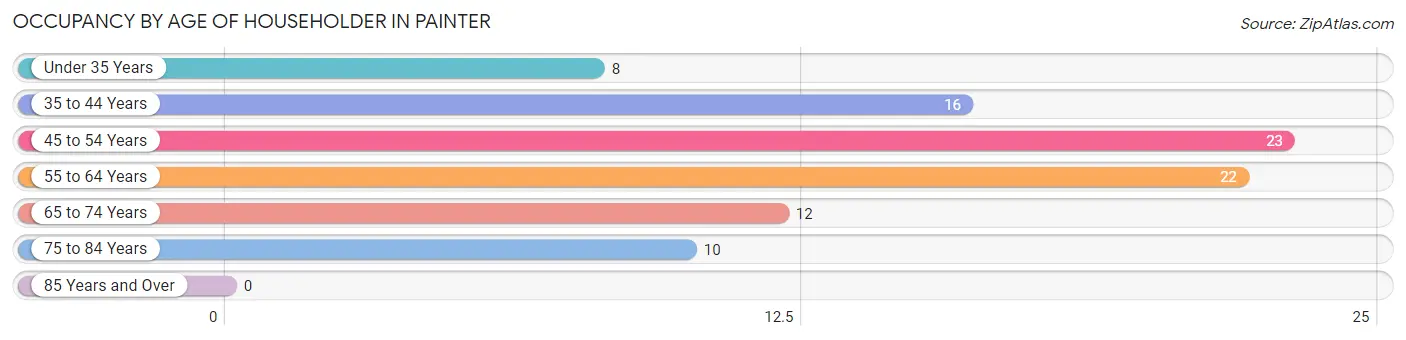
| Age Bracket | # Households | % Households |
| Under 35 Years | 8 | 8.8% |
| 35 to 44 Years | 16 | 17.6% |
| 45 to 54 Years | 23 | 25.3% |
| 55 to 64 Years | 22 | 24.2% |
| 65 to 74 Years | 12 | 13.2% |
| 75 to 84 Years | 10 | 11.0% |
| 85 Years and Over | 0 | 0.0% |
| Total | 91 | 100.0% |
Housing Finances in Painter
Median Income by Occupancy in Painter
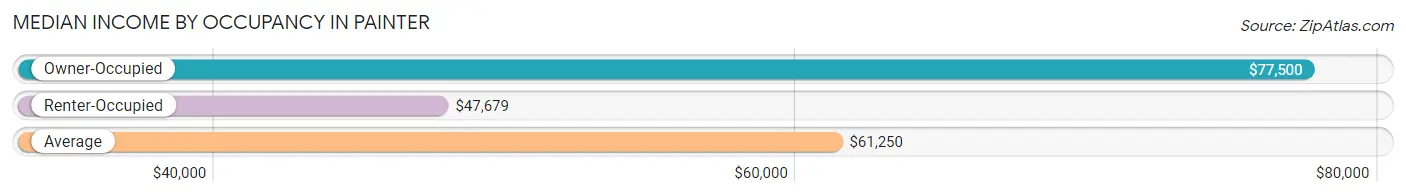
| Occupancy Type | # Households | Median Income |
| Owner-Occupied | 56 (61.5%) | $77,500 |
| Renter-Occupied | 35 (38.5%) | $47,679 |
| Average | 91 (100.0%) | $61,250 |
Occupancy by Householder Income Bracket in Painter
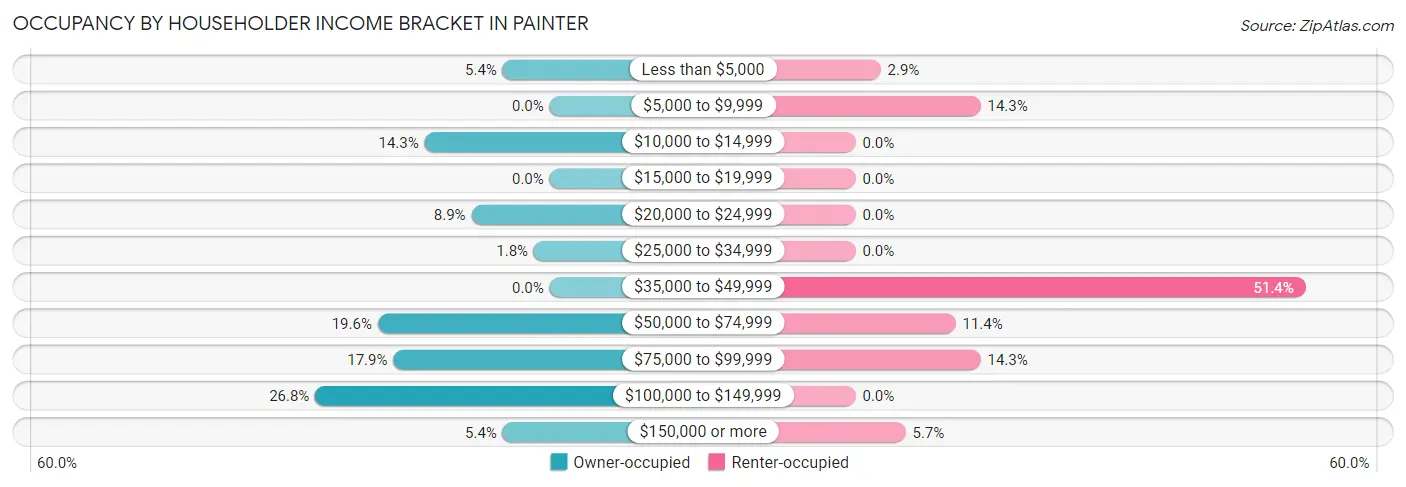
| Income Bracket | Owner-occupied | Renter-occupied |
| Less than $5,000 | 3 (5.4%) | 1 (2.9%) |
| $5,000 to $9,999 | 0 (0.0%) | 5 (14.3%) |
| $10,000 to $14,999 | 8 (14.3%) | 0 (0.0%) |
| $15,000 to $19,999 | 0 (0.0%) | 0 (0.0%) |
| $20,000 to $24,999 | 5 (8.9%) | 0 (0.0%) |
| $25,000 to $34,999 | 1 (1.8%) | 0 (0.0%) |
| $35,000 to $49,999 | 0 (0.0%) | 18 (51.4%) |
| $50,000 to $74,999 | 11 (19.6%) | 4 (11.4%) |
| $75,000 to $99,999 | 10 (17.9%) | 5 (14.3%) |
| $100,000 to $149,999 | 15 (26.8%) | 0 (0.0%) |
| $150,000 or more | 3 (5.4%) | 2 (5.7%) |
| Total | 56 (100.0%) | 35 (100.0%) |
Monthly Housing Cost Tiers in Painter
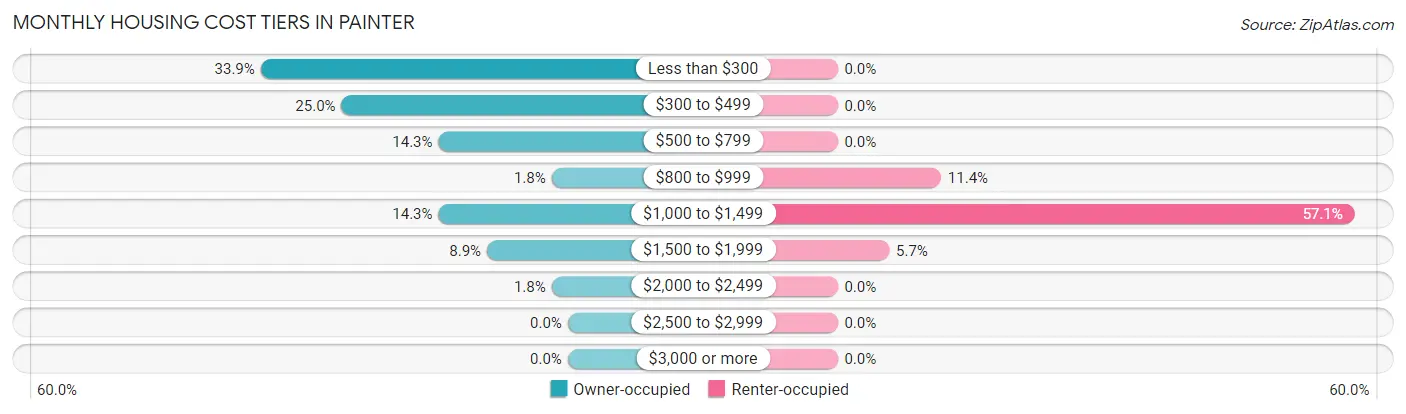
| Monthly Cost | Owner-occupied | Renter-occupied |
| Less than $300 | 19 (33.9%) | 0 (0.0%) |
| $300 to $499 | 14 (25.0%) | 0 (0.0%) |
| $500 to $799 | 8 (14.3%) | 0 (0.0%) |
| $800 to $999 | 1 (1.8%) | 4 (11.4%) |
| $1,000 to $1,499 | 8 (14.3%) | 20 (57.1%) |
| $1,500 to $1,999 | 5 (8.9%) | 2 (5.7%) |
| $2,000 to $2,499 | 1 (1.8%) | 0 (0.0%) |
| $2,500 to $2,999 | 0 (0.0%) | 0 (0.0%) |
| $3,000 or more | 0 (0.0%) | 0 (0.0%) |
| Total | 56 (100.0%) | 35 (100.0%) |
Physical Housing Characteristics in Painter
Housing Structures in Painter
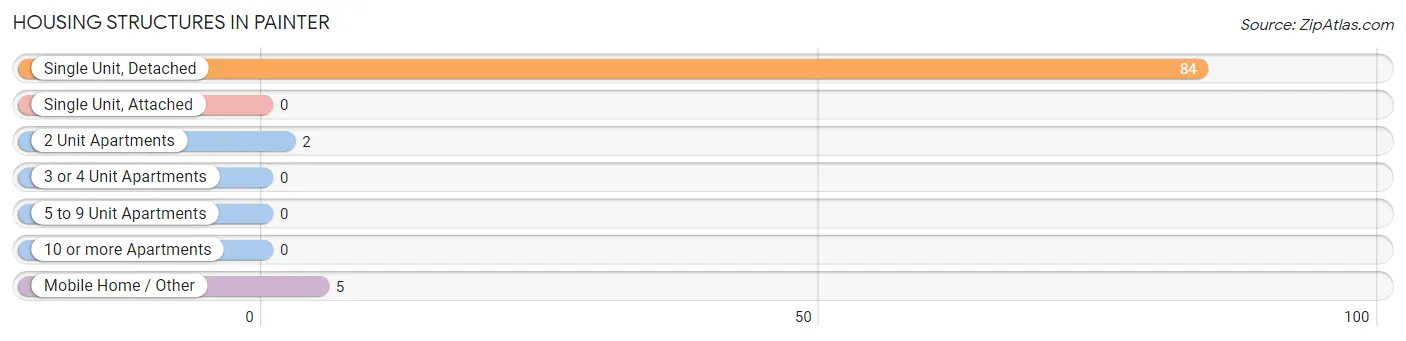
| Structure Type | # Housing Units | % Housing Units |
| Single Unit, Detached | 84 | 92.3% |
| Single Unit, Attached | 0 | 0.0% |
| 2 Unit Apartments | 2 | 2.2% |
| 3 or 4 Unit Apartments | 0 | 0.0% |
| 5 to 9 Unit Apartments | 0 | 0.0% |
| 10 or more Apartments | 0 | 0.0% |
| Mobile Home / Other | 5 | 5.5% |
| Total | 91 | 100.0% |
Housing Structures by Occupancy in Painter
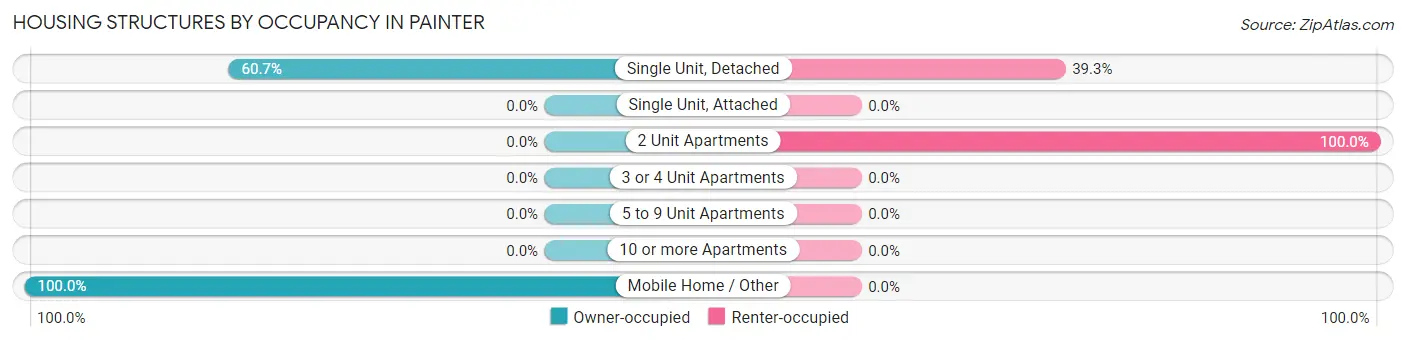
| Structure Type | Owner-occupied | Renter-occupied |
| Single Unit, Detached | 51 (60.7%) | 33 (39.3%) |
| Single Unit, Attached | 0 (0.0%) | 0 (0.0%) |
| 2 Unit Apartments | 0 (0.0%) | 2 (100.0%) |
| 3 or 4 Unit Apartments | 0 (0.0%) | 0 (0.0%) |
| 5 to 9 Unit Apartments | 0 (0.0%) | 0 (0.0%) |
| 10 or more Apartments | 0 (0.0%) | 0 (0.0%) |
| Mobile Home / Other | 5 (100.0%) | 0 (0.0%) |
| Total | 56 (61.5%) | 35 (38.5%) |
Housing Structures by Number of Rooms in Painter
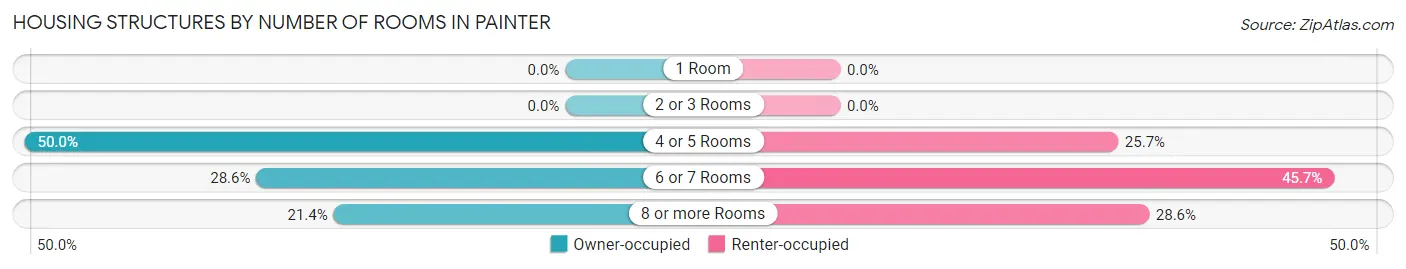
| Number of Rooms | Owner-occupied | Renter-occupied |
| 1 Room | 0 (0.0%) | 0 (0.0%) |
| 2 or 3 Rooms | 0 (0.0%) | 0 (0.0%) |
| 4 or 5 Rooms | 28 (50.0%) | 9 (25.7%) |
| 6 or 7 Rooms | 16 (28.6%) | 16 (45.7%) |
| 8 or more Rooms | 12 (21.4%) | 10 (28.6%) |
| Total | 56 (100.0%) | 35 (100.0%) |
Housing Structure by Heating Type in Painter
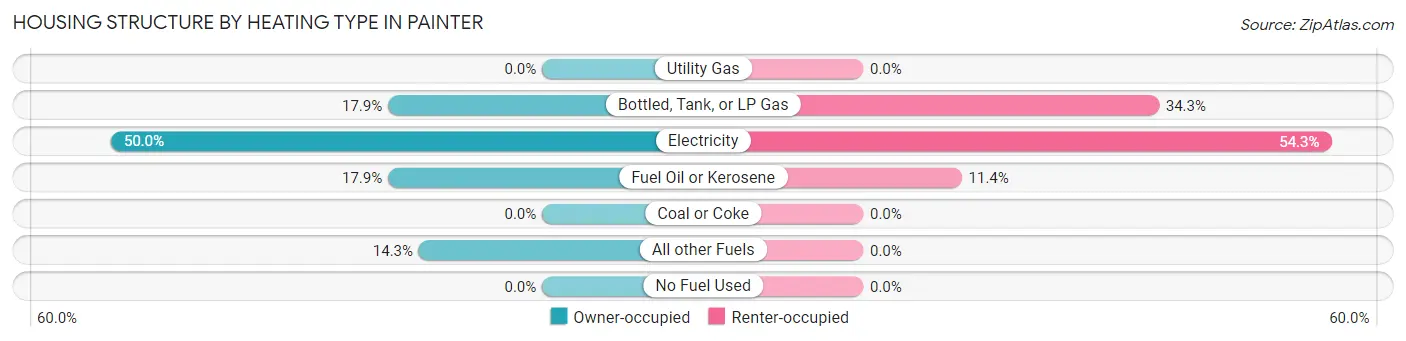
| Heating Type | Owner-occupied | Renter-occupied |
| Utility Gas | 0 (0.0%) | 0 (0.0%) |
| Bottled, Tank, or LP Gas | 10 (17.9%) | 12 (34.3%) |
| Electricity | 28 (50.0%) | 19 (54.3%) |
| Fuel Oil or Kerosene | 10 (17.9%) | 4 (11.4%) |
| Coal or Coke | 0 (0.0%) | 0 (0.0%) |
| All other Fuels | 8 (14.3%) | 0 (0.0%) |
| No Fuel Used | 0 (0.0%) | 0 (0.0%) |
| Total | 56 (100.0%) | 35 (100.0%) |
Household Vehicle Usage in Painter
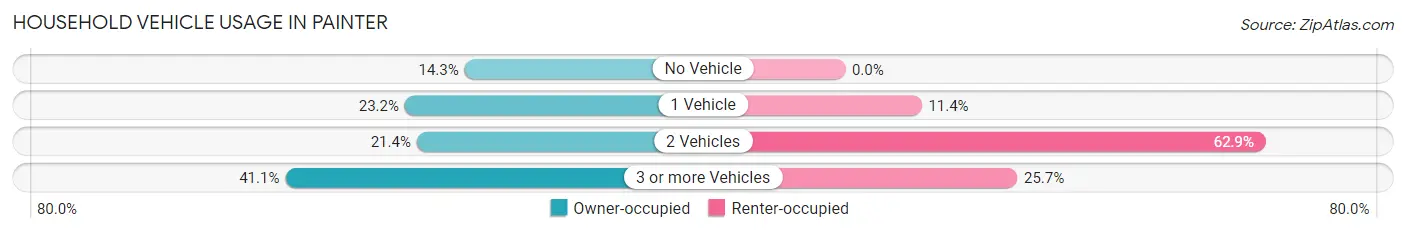
| Vehicles per Household | Owner-occupied | Renter-occupied |
| No Vehicle | 8 (14.3%) | 0 (0.0%) |
| 1 Vehicle | 13 (23.2%) | 4 (11.4%) |
| 2 Vehicles | 12 (21.4%) | 22 (62.9%) |
| 3 or more Vehicles | 23 (41.1%) | 9 (25.7%) |
| Total | 56 (100.0%) | 35 (100.0%) |
Real Estate & Mortgages in Painter
Real Estate and Mortgage Overview in Painter
| Characteristic | Without Mortgage | With Mortgage |
| Housing Units | 29 | 27 |
| Median Property Value | $88,100 | $129,200 |
| Median Household Income | - | - |
| Monthly Housing Costs | $284 | $0 |
| Real Estate Taxes | $567 | $0 |
Property Value by Mortgage Status in Painter
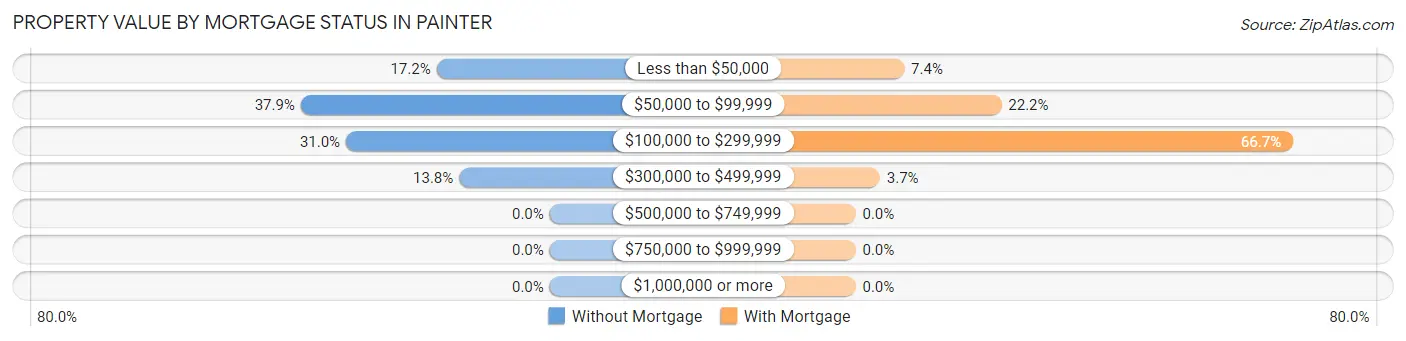
| Property Value | Without Mortgage | With Mortgage |
| Less than $50,000 | 5 (17.2%) | 2 (7.4%) |
| $50,000 to $99,999 | 11 (37.9%) | 6 (22.2%) |
| $100,000 to $299,999 | 9 (31.0%) | 18 (66.7%) |
| $300,000 to $499,999 | 4 (13.8%) | 1 (3.7%) |
| $500,000 to $749,999 | 0 (0.0%) | 0 (0.0%) |
| $750,000 to $999,999 | 0 (0.0%) | 0 (0.0%) |
| $1,000,000 or more | 0 (0.0%) | 0 (0.0%) |
| Total | 29 (100.0%) | 27 (100.0%) |
Household Income by Mortgage Status in Painter
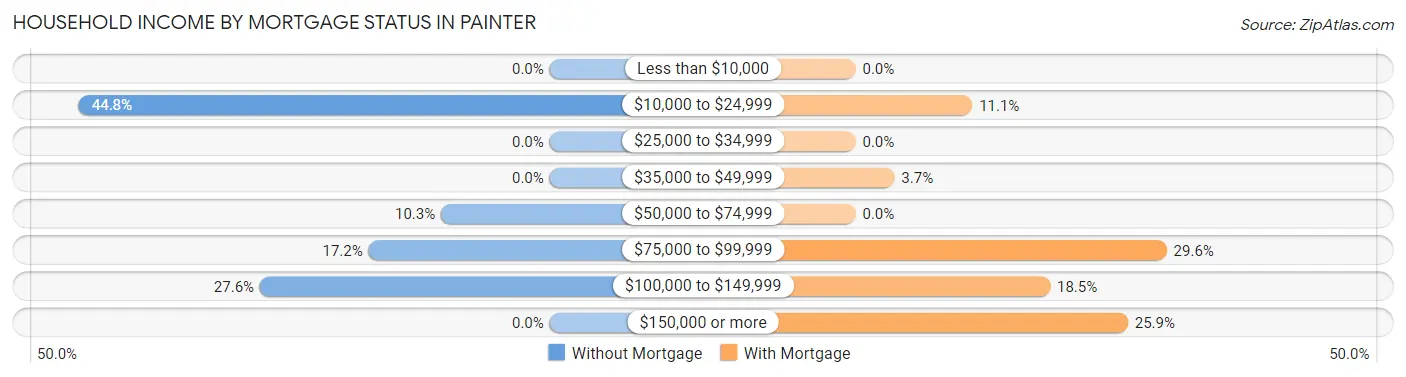
| Household Income | Without Mortgage | With Mortgage |
| Less than $10,000 | 0 (0.0%) | 0 (0.0%) |
| $10,000 to $24,999 | 13 (44.8%) | 3 (11.1%) |
| $25,000 to $34,999 | 0 (0.0%) | 0 (0.0%) |
| $35,000 to $49,999 | 0 (0.0%) | 1 (3.7%) |
| $50,000 to $74,999 | 3 (10.3%) | 0 (0.0%) |
| $75,000 to $99,999 | 5 (17.2%) | 8 (29.6%) |
| $100,000 to $149,999 | 8 (27.6%) | 5 (18.5%) |
| $150,000 or more | 0 (0.0%) | 7 (25.9%) |
| Total | 29 (100.0%) | 27 (100.0%) |
Property Value to Household Income Ratio in Painter
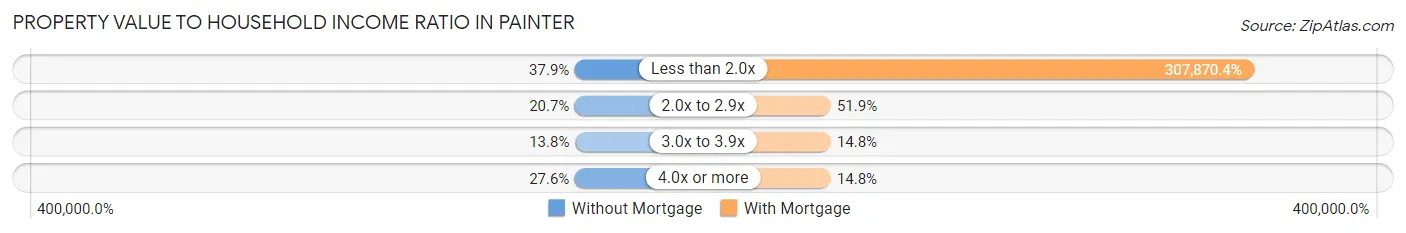
| Value-to-Income Ratio | Without Mortgage | With Mortgage |
| Less than 2.0x | 11 (37.9%) | 83,125 (307,870.4%) |
| 2.0x to 2.9x | 6 (20.7%) | 14 (51.8%) |
| 3.0x to 3.9x | 4 (13.8%) | 4 (14.8%) |
| 4.0x or more | 8 (27.6%) | 4 (14.8%) |
| Total | 29 (100.0%) | 27 (100.0%) |
Real Estate Taxes by Mortgage Status in Painter
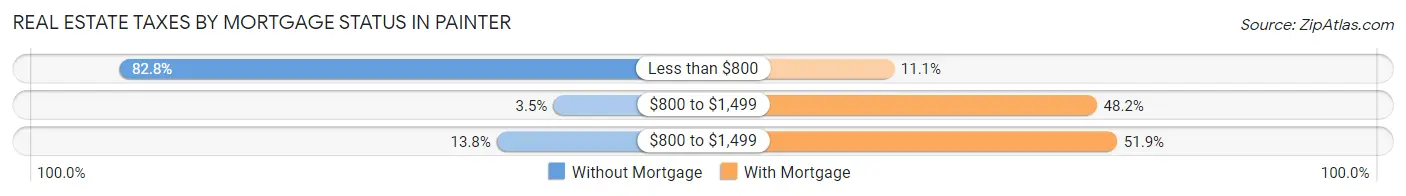
| Property Taxes | Without Mortgage | With Mortgage |
| Less than $800 | 24 (82.8%) | 3 (11.1%) |
| $800 to $1,499 | 1 (3.5%) | 13 (48.1%) |
| $800 to $1,499 | 4 (13.8%) | 14 (51.8%) |
| Total | 29 (100.0%) | 27 (100.0%) |
Health & Disability in Painter
Health Insurance Coverage by Age in Painter
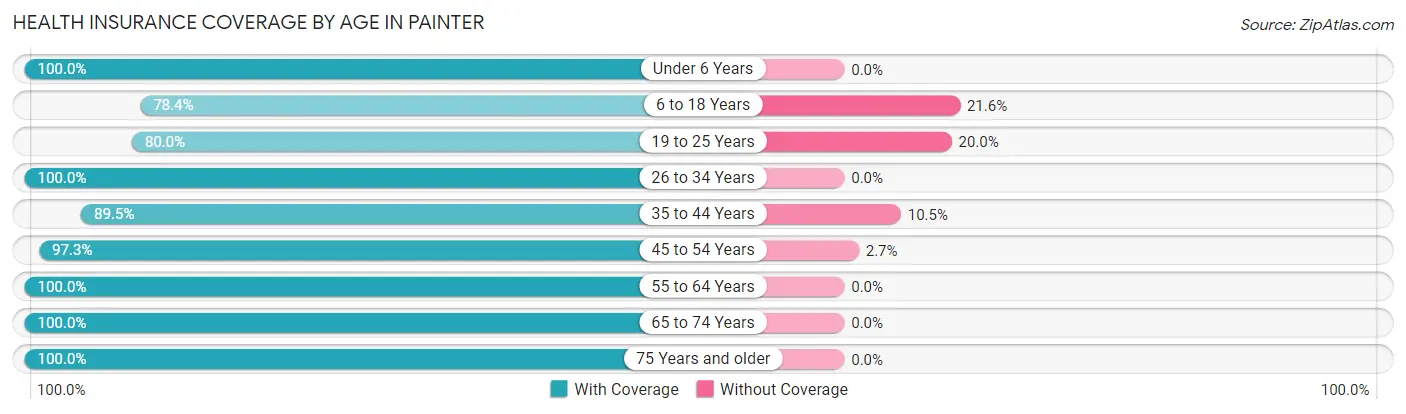
| Age Bracket | With Coverage | Without Coverage |
| Under 6 Years | 32 (100.0%) | 0 (0.0%) |
| 6 to 18 Years | 40 (78.4%) | 11 (21.6%) |
| 19 to 25 Years | 8 (80.0%) | 2 (20.0%) |
| 26 to 34 Years | 30 (100.0%) | 0 (0.0%) |
| 35 to 44 Years | 17 (89.5%) | 2 (10.5%) |
| 45 to 54 Years | 36 (97.3%) | 1 (2.7%) |
| 55 to 64 Years | 30 (100.0%) | 0 (0.0%) |
| 65 to 74 Years | 20 (100.0%) | 0 (0.0%) |
| 75 Years and older | 15 (100.0%) | 0 (0.0%) |
| Total | 228 (93.4%) | 16 (6.6%) |
Health Insurance Coverage by Citizenship Status in Painter
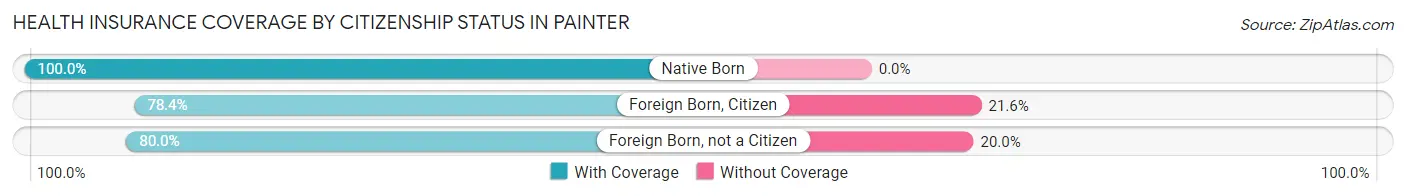
| Citizenship Status | With Coverage | Without Coverage |
| Native Born | 32 (100.0%) | 0 (0.0%) |
| Foreign Born, Citizen | 40 (78.4%) | 11 (21.6%) |
| Foreign Born, not a Citizen | 8 (80.0%) | 2 (20.0%) |
Health Insurance Coverage by Household Income in Painter
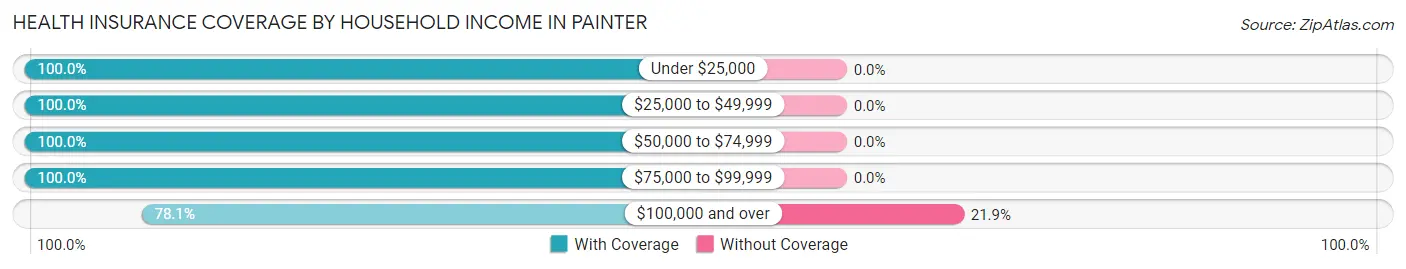
| Household Income | With Coverage | Without Coverage |
| Under $25,000 | 29 (100.0%) | 0 (0.0%) |
| $25,000 to $49,999 | 65 (100.0%) | 0 (0.0%) |
| $50,000 to $74,999 | 30 (100.0%) | 0 (0.0%) |
| $75,000 to $99,999 | 47 (100.0%) | 0 (0.0%) |
| $100,000 and over | 57 (78.1%) | 16 (21.9%) |
Public vs Private Health Insurance Coverage by Age in Painter
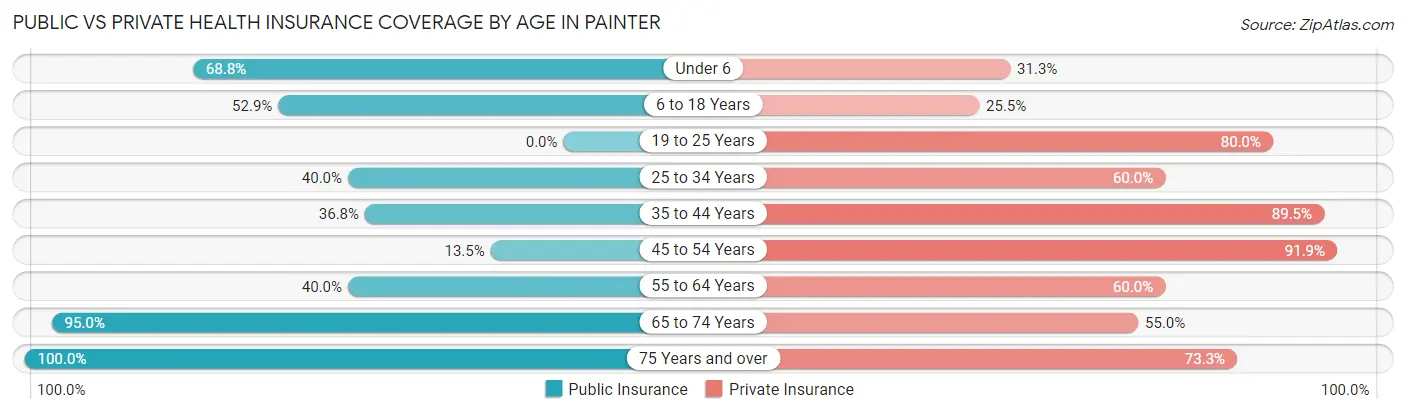
| Age Bracket | Public Insurance | Private Insurance |
| Under 6 | 22 (68.8%) | 10 (31.2%) |
| 6 to 18 Years | 27 (52.9%) | 13 (25.5%) |
| 19 to 25 Years | 0 (0.0%) | 8 (80.0%) |
| 25 to 34 Years | 12 (40.0%) | 18 (60.0%) |
| 35 to 44 Years | 7 (36.8%) | 17 (89.5%) |
| 45 to 54 Years | 5 (13.5%) | 34 (91.9%) |
| 55 to 64 Years | 12 (40.0%) | 18 (60.0%) |
| 65 to 74 Years | 19 (95.0%) | 11 (55.0%) |
| 75 Years and over | 15 (100.0%) | 11 (73.3%) |
| Total | 119 (48.8%) | 140 (57.4%) |
Disability Status by Sex by Age in Painter
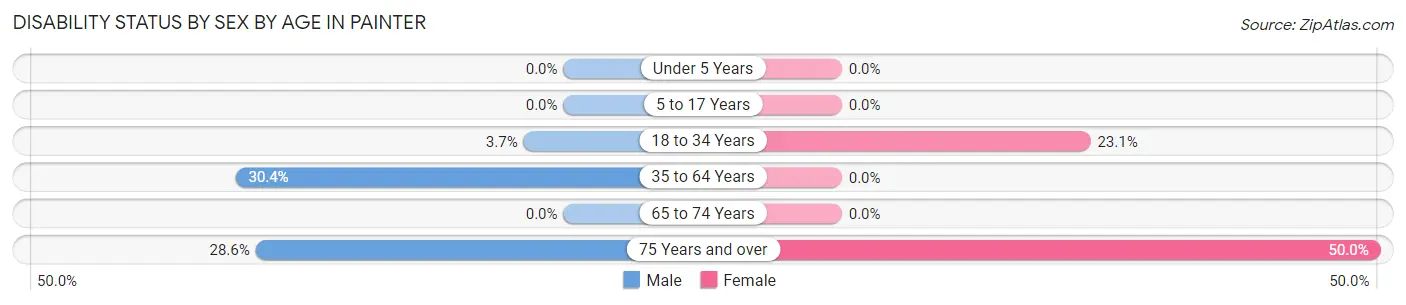
| Age Bracket | Male | Female |
| Under 5 Years | 0 (0.0%) | 0 (0.0%) |
| 5 to 17 Years | 0 (0.0%) | 0 (0.0%) |
| 18 to 34 Years | 1 (3.7%) | 3 (23.1%) |
| 35 to 64 Years | 14 (30.4%) | 0 (0.0%) |
| 65 to 74 Years | 0 (0.0%) | 0 (0.0%) |
| 75 Years and over | 2 (28.6%) | 4 (50.0%) |
Disability Class by Sex by Age in Painter
Disability Class: Hearing Difficulty
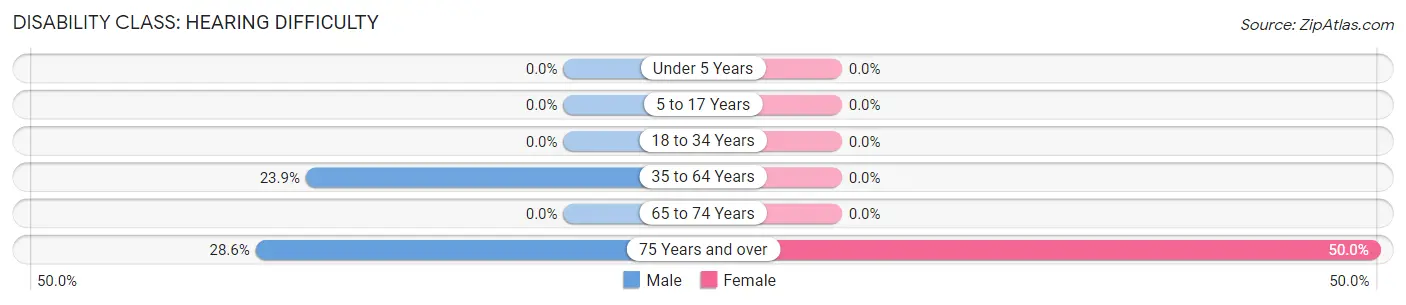
| Age Bracket | Male | Female |
| Under 5 Years | 0 (0.0%) | 0 (0.0%) |
| 5 to 17 Years | 0 (0.0%) | 0 (0.0%) |
| 18 to 34 Years | 0 (0.0%) | 0 (0.0%) |
| 35 to 64 Years | 11 (23.9%) | 0 (0.0%) |
| 65 to 74 Years | 0 (0.0%) | 0 (0.0%) |
| 75 Years and over | 2 (28.6%) | 4 (50.0%) |
Disability Class: Vision Difficulty
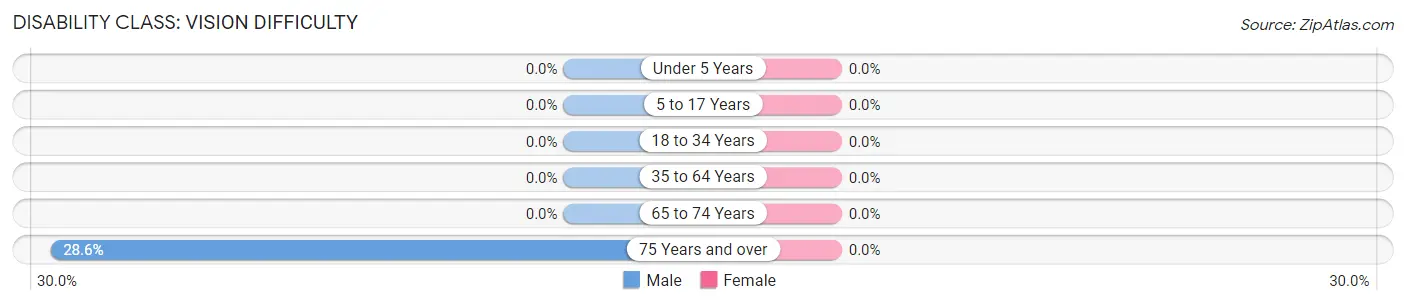
| Age Bracket | Male | Female |
| Under 5 Years | 0 (0.0%) | 0 (0.0%) |
| 5 to 17 Years | 0 (0.0%) | 0 (0.0%) |
| 18 to 34 Years | 0 (0.0%) | 0 (0.0%) |
| 35 to 64 Years | 0 (0.0%) | 0 (0.0%) |
| 65 to 74 Years | 0 (0.0%) | 0 (0.0%) |
| 75 Years and over | 2 (28.6%) | 0 (0.0%) |
Disability Class: Cognitive Difficulty
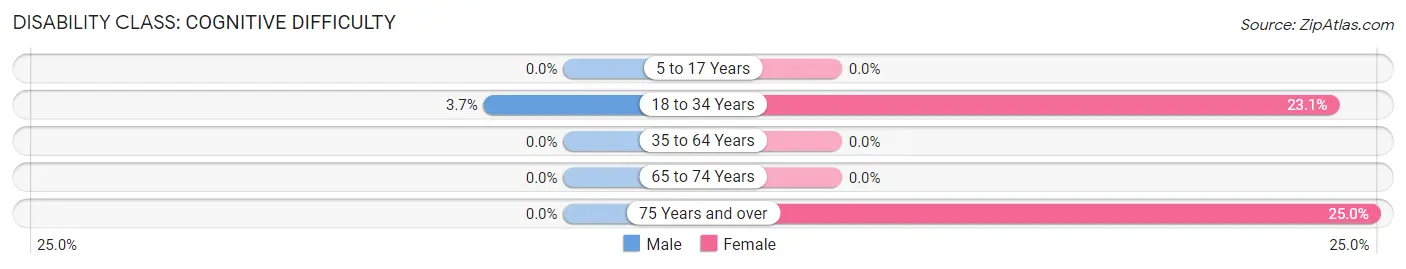
| Age Bracket | Male | Female |
| 5 to 17 Years | 0 (0.0%) | 0 (0.0%) |
| 18 to 34 Years | 1 (3.7%) | 3 (23.1%) |
| 35 to 64 Years | 0 (0.0%) | 0 (0.0%) |
| 65 to 74 Years | 0 (0.0%) | 0 (0.0%) |
| 75 Years and over | 0 (0.0%) | 2 (25.0%) |
Disability Class: Ambulatory Difficulty
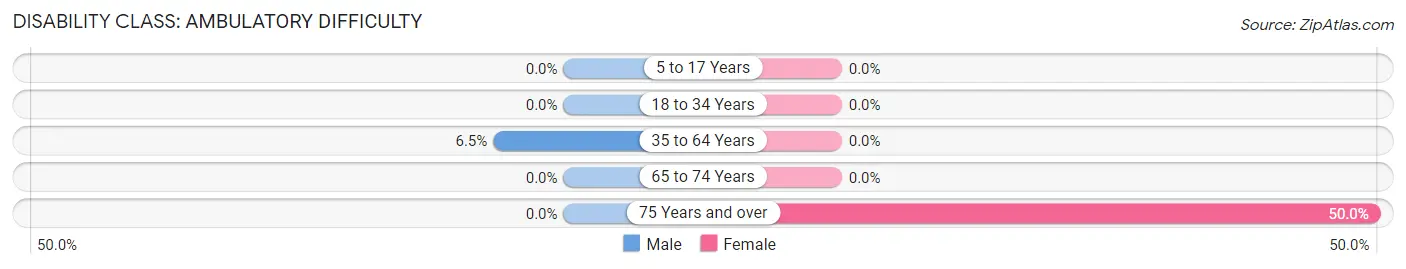
| Age Bracket | Male | Female |
| 5 to 17 Years | 0 (0.0%) | 0 (0.0%) |
| 18 to 34 Years | 0 (0.0%) | 0 (0.0%) |
| 35 to 64 Years | 3 (6.5%) | 0 (0.0%) |
| 65 to 74 Years | 0 (0.0%) | 0 (0.0%) |
| 75 Years and over | 0 (0.0%) | 4 (50.0%) |
Disability Class: Self-Care Difficulty
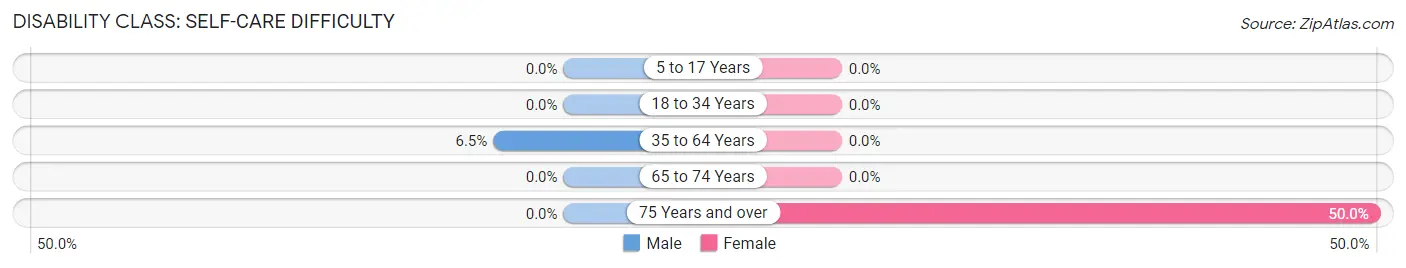
| Age Bracket | Male | Female |
| 5 to 17 Years | 0 (0.0%) | 0 (0.0%) |
| 18 to 34 Years | 0 (0.0%) | 0 (0.0%) |
| 35 to 64 Years | 3 (6.5%) | 0 (0.0%) |
| 65 to 74 Years | 0 (0.0%) | 0 (0.0%) |
| 75 Years and over | 0 (0.0%) | 4 (50.0%) |
Technology Access in Painter
Computing Device Access in Painter
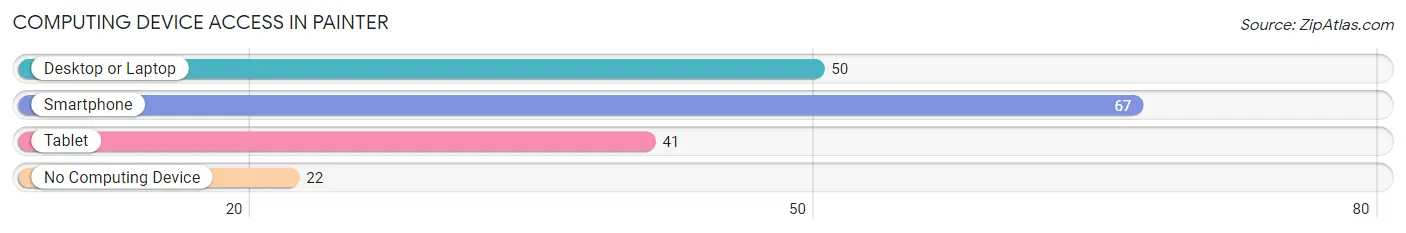
| Device Type | # Households | % Households |
| Desktop or Laptop | 50 | 54.9% |
| Smartphone | 67 | 73.6% |
| Tablet | 41 | 45.1% |
| No Computing Device | 22 | 24.2% |
| Total | 91 | 100.0% |
Internet Access in Painter
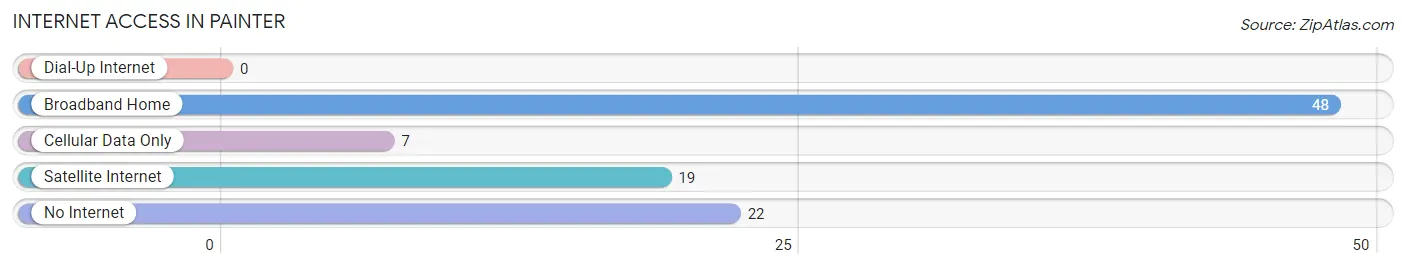
| Internet Type | # Households | % Households |
| Dial-Up Internet | 0 | 0.0% |
| Broadband Home | 48 | 52.7% |
| Cellular Data Only | 7 | 7.7% |
| Satellite Internet | 19 | 20.9% |
| No Internet | 22 | 24.2% |
| Total | 91 | 100.0% |
Painter Summary
Virginia is a state located in the Mid-Atlantic region of the United States. It is bordered by Maryland to the northeast, the Atlantic Ocean to the east, North Carolina and Tennessee to the south, and West Virginia to the southwest and Kentucky to the west. Virginia is the 12th most populous state in the United States, with an estimated population of 8.5 million in 2019. It is the 35th largest state in terms of land area, with an area of 42,774 square miles.
Geography
Virginia is divided into five distinct geographic regions: the Blue Ridge Mountains, the Piedmont Plateau, the Appalachian Plateau, the Coastal Plain, and the Tidewater. The Blue Ridge Mountains are located in the western part of the state and are part of the Appalachian Mountains. The highest point in the state is Mount Rogers, which is located in the Blue Ridge Mountains and has an elevation of 5,729 feet. The Piedmont Plateau is located in the central part of the state and is characterized by rolling hills and valleys. The Appalachian Plateau is located in the southwestern part of the state and is characterized by steep, rugged terrain. The Coastal Plain is located in the eastern part of the state and is characterized by flat, low-lying land. The Tidewater region is located in the southeastern part of the state and is characterized by low-lying, marshy land.
History
Virginia was one of the original 13 colonies that formed the United States. It was the first colony to declare its independence from Great Britain in 1776. Virginia was also the site of the first permanent English settlement in the New World, Jamestown, which was founded in 1607. During the American Revolution, Virginia was a major battleground and was the site of several major battles, including the Battle of Yorktown, which was the decisive battle of the war.
Virginia was also the site of the Civil War, which began in 1861. Virginia was a major battleground during the war and was the site of several major battles, including the Battle of Bull Run, the Battle of Chancellorsville, and the Battle of Gettysburg. After the war, Virginia was readmitted to the Union in 1870.
Economy
Virginia has a diverse economy that is driven by a variety of industries, including agriculture, manufacturing, technology, and tourism. Agriculture is a major industry in the state, with crops such as corn, soybeans, wheat, and hay being grown in the state. Manufacturing is also a major industry in the state, with products such as automobiles, chemicals, and electronics being produced in the state. Technology is a major industry in the state, with companies such as Amazon, Microsoft, and Oracle having a presence in the state. Tourism is also a major industry in the state, with attractions such as Colonial Williamsburg, the Blue Ridge Parkway, and the Shenandoah National Park drawing millions of visitors each year.
Demographics
Virginia has a population of 8.5 million people, according to the 2019 U.S. Census. The racial makeup of the state is 68.7% White, 19.7% Black or African American, 6.7% Hispanic or Latino, 2.2% Asian, 0.3% Native American, and 2.2% other. The median household income in the state is $68,711, and the median age is 38.7 years. The largest cities in the state are Virginia Beach, Norfolk, Chesapeake, Richmond, and Arlington.
Common Questions
What is Per Capita Income in Painter?
Per Capita income in Painter is $22,711.
What is the Median Family Income in Painter?
Median Family Income in Painter is $87,500.
What is the Median Household income in Painter?
Median Household Income in Painter is $61,250.
What is Income or Wage Gap in Painter?
Income or Wage Gap in Painter is 20.2%.
Women in Painter earn 79.8 cents for every dollar earned by a man.
What is Inequality or Gini Index in Painter?
Inequality or Gini Index in Painter is 0.37.
What is the Total Population of Painter?
Total Population of Painter is 244.
What is the Total Male Population of Painter?
Total Male Population of Painter is 115.
What is the Total Female Population of Painter?
Total Female Population of Painter is 129.
What is the Ratio of Males per 100 Females in Painter?
There are 89.15 Males per 100 Females in Painter.
What is the Ratio of Females per 100 Males in Painter?
There are 112.17 Females per 100 Males in Painter.
What is the Median Population Age in Painter?
Median Population Age in Painter is 34.7 Years.
What is the Average Family Size in Painter
Average Family Size in Painter is 3.6 People.
What is the Average Household Size in Painter
Average Household Size in Painter is 2.7 People.
How Large is the Labor Force in Painter?
There are 94 People in the Labor Forcein in Painter.
What is the Percentage of People in the Labor Force in Painter?
57.3% of People are in the Labor Force in Painter.
What is the Unemployment Rate in Painter?
Unemployment Rate in Painter is 1.1%.