Vinton, VA Map & Demographics
Vinton Map
Vinton Overview
$39,914
PER CAPITA INCOME
$89,599
AVG FAMILY INCOME
$65,481
AVG HOUSEHOLD INCOME
9.8%
WAGE / INCOME GAP [ % ]
90.2¢/ $1
WAGE / INCOME GAP [ $ ]
0.41
INEQUALITY / GINI INDEX
8,045
TOTAL POPULATION
3,813
MALE POPULATION
4,232
FEMALE POPULATION
90.10
MALES / 100 FEMALES
110.99
FEMALES / 100 MALES
41.1
MEDIAN AGE
2.7
AVG FAMILY SIZE
2.1
AVG HOUSEHOLD SIZE
4,276
LABOR FORCE [ PEOPLE ]
65.3%
PERCENT IN LABOR FORCE
2.0%
UNEMPLOYMENT RATE
Vinton Zip Codes
Vinton Area Codes
Income in Vinton
Income Overview in Vinton
Per Capita Income in Vinton is $39,914, while median incomes of families and households are $89,599 and $65,481 respectively.
| Characteristic | Number | Measure |
| Per Capita Income | 8,045 | $39,914 |
| Median Family Income | 2,193 | $89,599 |
| Mean Family Income | 2,193 | $106,624 |
| Median Household Income | 3,686 | $65,481 |
| Mean Household Income | 3,686 | $84,126 |
| Income Deficit | 2,193 | $0 |
| Wage / Income Gap (%) | 8,045 | 9.80% |
| Wage / Income Gap ($) | 8,045 | 90.20¢ per $1 |
| Gini / Inequality Index | 8,045 | 0.41 |
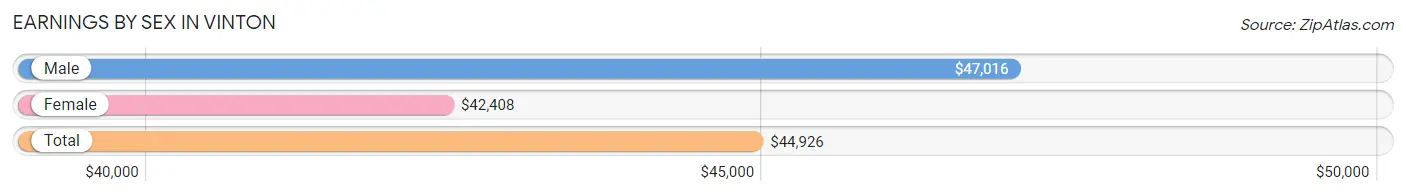
Earnings by Sex in Vinton
Average Earnings in Vinton are $44,926, $47,016 for men and $42,408 for women, a difference of 9.8%.
| Sex | Number | Average Earnings |
| Male | 2,416 (54.3%) | $47,016 |
| Female | 2,031 (45.7%) | $42,408 |
| Total | 4,447 (100.0%) | $44,926 |
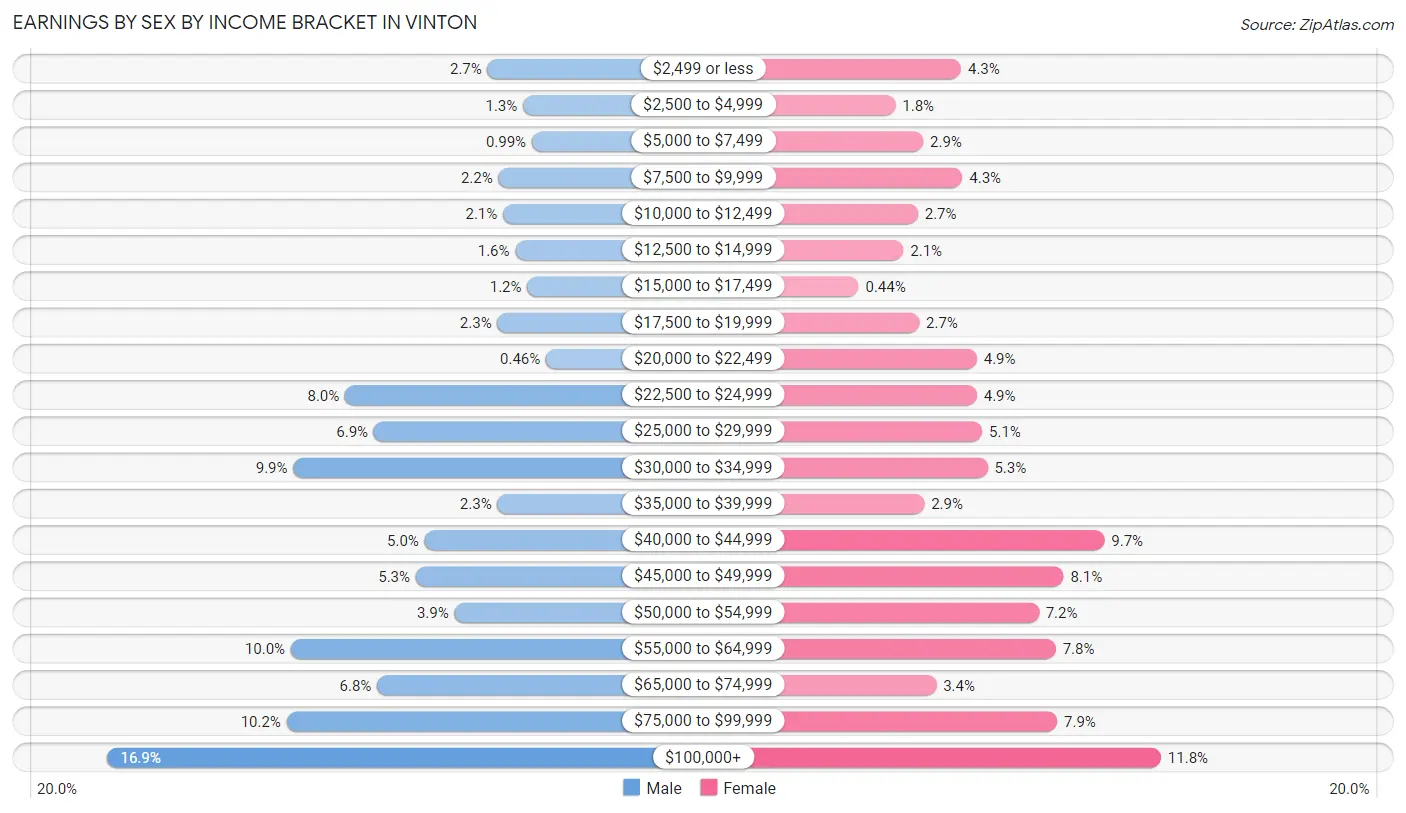
Earnings by Sex by Income Bracket in Vinton
The most common earnings brackets in Vinton are $100,000+ for men (408 | 16.9%) and $100,000+ for women (239 | 11.8%).
| Income | Male | Female |
| $2,499 or less | 64 (2.6%) | 87 (4.3%) |
| $2,500 to $4,999 | 32 (1.3%) | 37 (1.8%) |
| $5,000 to $7,499 | 24 (1.0%) | 58 (2.9%) |
| $7,500 to $9,999 | 54 (2.2%) | 88 (4.3%) |
| $10,000 to $12,499 | 50 (2.1%) | 54 (2.7%) |
| $12,500 to $14,999 | 39 (1.6%) | 43 (2.1%) |
| $15,000 to $17,499 | 28 (1.2%) | 9 (0.4%) |
| $17,500 to $19,999 | 55 (2.3%) | 55 (2.7%) |
| $20,000 to $22,499 | 11 (0.5%) | 99 (4.9%) |
| $22,500 to $24,999 | 193 (8.0%) | 99 (4.9%) |
| $25,000 to $29,999 | 167 (6.9%) | 103 (5.1%) |
| $30,000 to $34,999 | 240 (9.9%) | 107 (5.3%) |
| $35,000 to $39,999 | 55 (2.3%) | 59 (2.9%) |
| $40,000 to $44,999 | 121 (5.0%) | 196 (9.7%) |
| $45,000 to $49,999 | 129 (5.3%) | 165 (8.1%) |
| $50,000 to $54,999 | 94 (3.9%) | 146 (7.2%) |
| $55,000 to $64,999 | 242 (10.0%) | 159 (7.8%) |
| $65,000 to $74,999 | 164 (6.8%) | 68 (3.4%) |
| $75,000 to $99,999 | 246 (10.2%) | 160 (7.9%) |
| $100,000+ | 408 (16.9%) | 239 (11.8%) |
| Total | 2,416 (100.0%) | 2,031 (100.0%) |
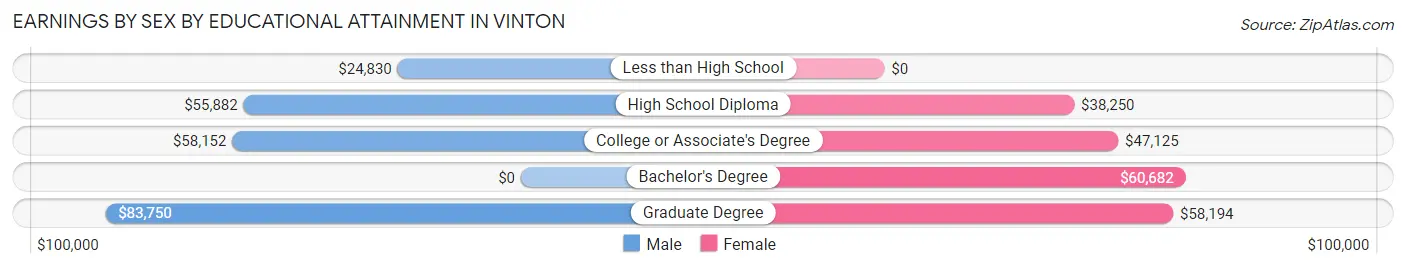
Earnings by Sex by Educational Attainment in Vinton
Average earnings in Vinton are $56,829 for men and $44,426 for women, a difference of 21.8%. Men with an educational attainment of graduate degree enjoy the highest average annual earnings of $83,750, while those with less than high school education earn the least with $24,830. Women with an educational attainment of bachelor's degree earn the most with the average annual earnings of $60,682, while those with high school diploma education have the smallest earnings of $38,250.
| Educational Attainment | Male Income | Female Income |
| Less than High School | $24,830 | $0 |
| High School Diploma | $55,882 | $38,250 |
| College or Associate's Degree | $58,152 | $47,125 |
| Bachelor's Degree | - | - |
| Graduate Degree | $83,750 | $58,194 |
| Total | $56,829 | $44,426 |
Family Income in Vinton
Family Income Brackets in Vinton
According to the Vinton family income data, there are 605 families falling into the $100,000 to $149,999 income range, which is the most common income bracket and makes up 27.6% of all families. Conversely, the $10,000 to $14,999 income bracket is the least frequent group with only 46 families (2.1%) belonging to this category.
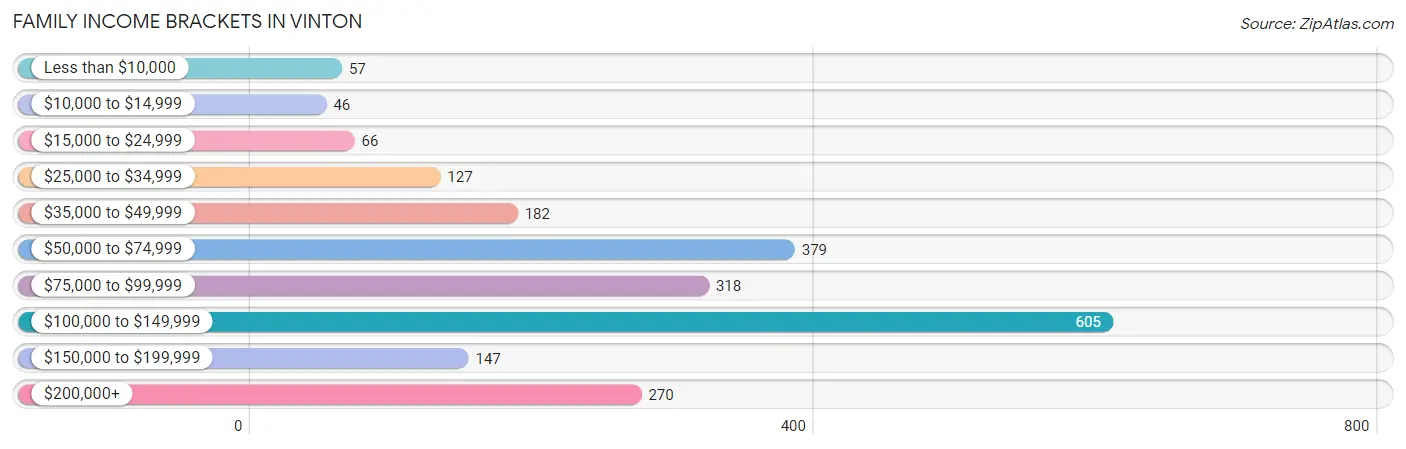
| Income Bracket | # Families | % Families |
| Less than $10,000 | 57 | 2.6% |
| $10,000 to $14,999 | 46 | 2.1% |
| $15,000 to $24,999 | 66 | 3.0% |
| $25,000 to $34,999 | 127 | 5.8% |
| $35,000 to $49,999 | 182 | 8.3% |
| $50,000 to $74,999 | 379 | 17.3% |
| $75,000 to $99,999 | 318 | 14.5% |
| $100,000 to $149,999 | 605 | 27.6% |
| $150,000 to $199,999 | 147 | 6.7% |
| $200,000+ | 270 | 12.3% |
Family Income by Famaliy Size in Vinton
5-person families (113 | 5.1%) account for the highest median family income in Vinton with $121,838 per family, while 3-person families (606 | 27.6%) have the highest median income of $39,524 per family member.
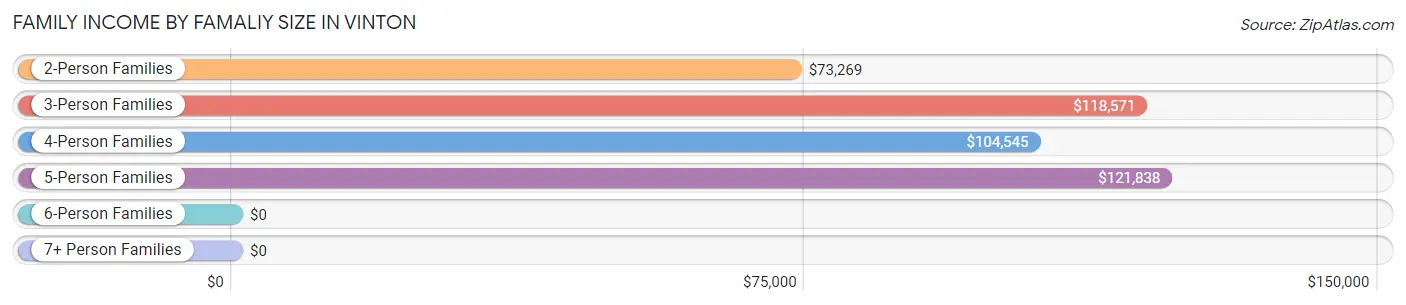
| Income Bracket | # Families | Median Income |
| 2-Person Families | 1,228 (56.0%) | $73,269 |
| 3-Person Families | 606 (27.6%) | $118,571 |
| 4-Person Families | 240 (10.9%) | $104,545 |
| 5-Person Families | 113 (5.1%) | $121,838 |
| 6-Person Families | 6 (0.3%) | $0 |
| 7+ Person Families | 0 (0.0%) | $0 |
| Total | 2,193 (100.0%) | $89,599 |
Family Income by Number of Earners in Vinton
The median family income in Vinton is $89,599, with families comprising 3+ earners (214) having the highest median family income of $124,034, while families with no earners (239) have the lowest median family income of $38,359, accounting for 9.8% and 10.9% of families, respectively.
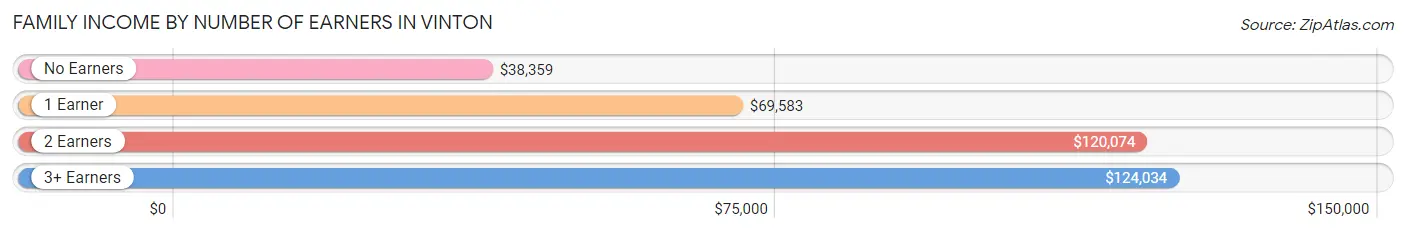
| Number of Earners | # Families | Median Income |
| No Earners | 239 (10.9%) | $38,359 |
| 1 Earner | 900 (41.0%) | $69,583 |
| 2 Earners | 840 (38.3%) | $120,074 |
| 3+ Earners | 214 (9.8%) | $124,034 |
| Total | 2,193 (100.0%) | $89,599 |
Household Income in Vinton
Household Income Brackets in Vinton
With 704 households falling in the category, the $50,000 to $74,999 income range is the most frequent in Vinton, accounting for 19.1% of all households. In contrast, only 70 households (1.9%) fall into the less than $10,000 income bracket, making it the least populous group.
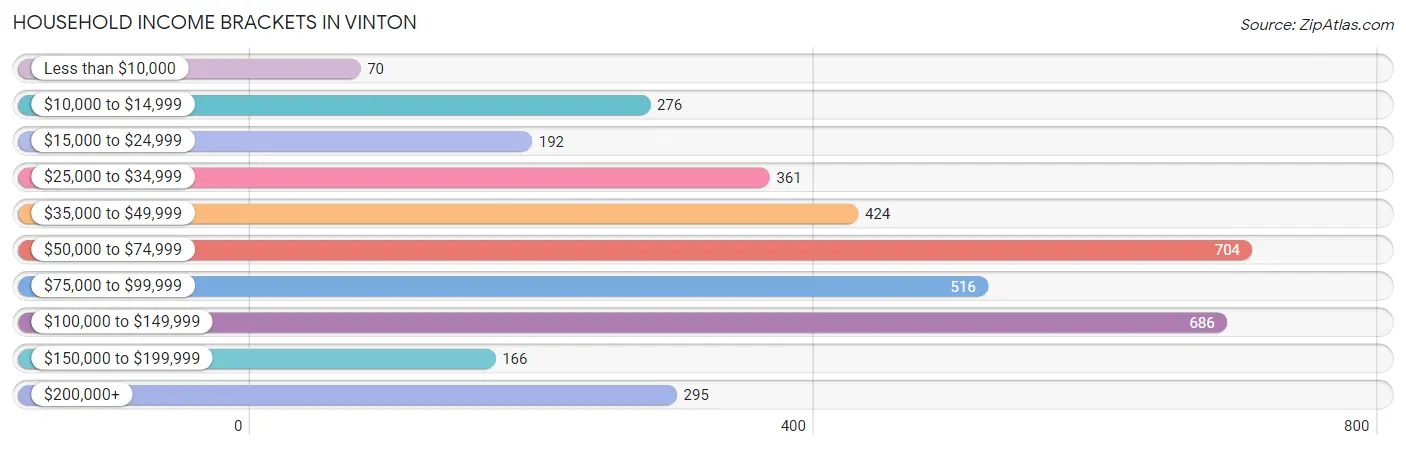
| Income Bracket | # Households | % Households |
| Less than $10,000 | 70 | 1.9% |
| $10,000 to $14,999 | 276 | 7.5% |
| $15,000 to $24,999 | 192 | 5.2% |
| $25,000 to $34,999 | 361 | 9.8% |
| $35,000 to $49,999 | 424 | 11.5% |
| $50,000 to $74,999 | 704 | 19.1% |
| $75,000 to $99,999 | 516 | 14.0% |
| $100,000 to $149,999 | 686 | 18.6% |
| $150,000 to $199,999 | 166 | 4.5% |
| $200,000+ | 295 | 8.0% |
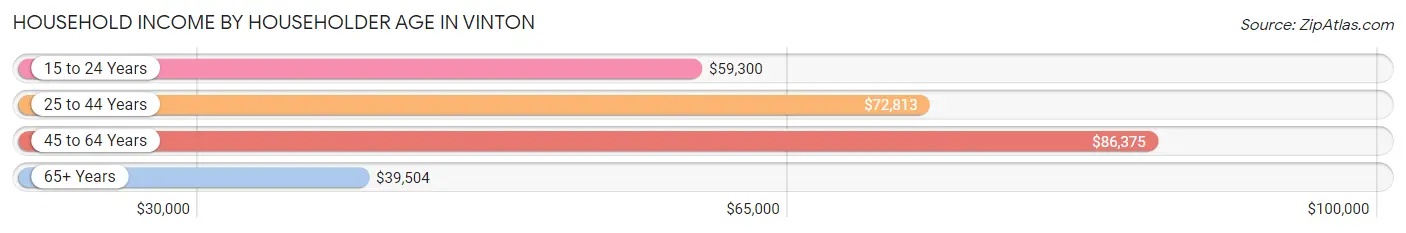
Household Income by Householder Age in Vinton
The median household income in Vinton is $65,481, with the highest median household income of $86,375 found in the 45 to 64 years age bracket for the primary householder. A total of 1,462 households (39.7%) fall into this category. Meanwhile, the 65+ years age bracket for the primary householder has the lowest median household income of $39,504, with 1,007 households (27.3%) in this group.
| Income Bracket | # Households | Median Income |
| 15 to 24 Years | 94 (2.5%) | $59,300 |
| 25 to 44 Years | 1,123 (30.5%) | $72,813 |
| 45 to 64 Years | 1,462 (39.7%) | $86,375 |
| 65+ Years | 1,007 (27.3%) | $39,504 |
| Total | 3,686 (100.0%) | $65,481 |
Poverty in Vinton
Income Below Poverty by Sex and Age in Vinton
With 7.2% poverty level for males and 11.8% for females among the residents of Vinton, 6 to 11 year old males and 25 to 34 year old females are the most vulnerable to poverty, with 80 males (26.9%) and 117 females (25.2%) in their respective age groups living below the poverty level.
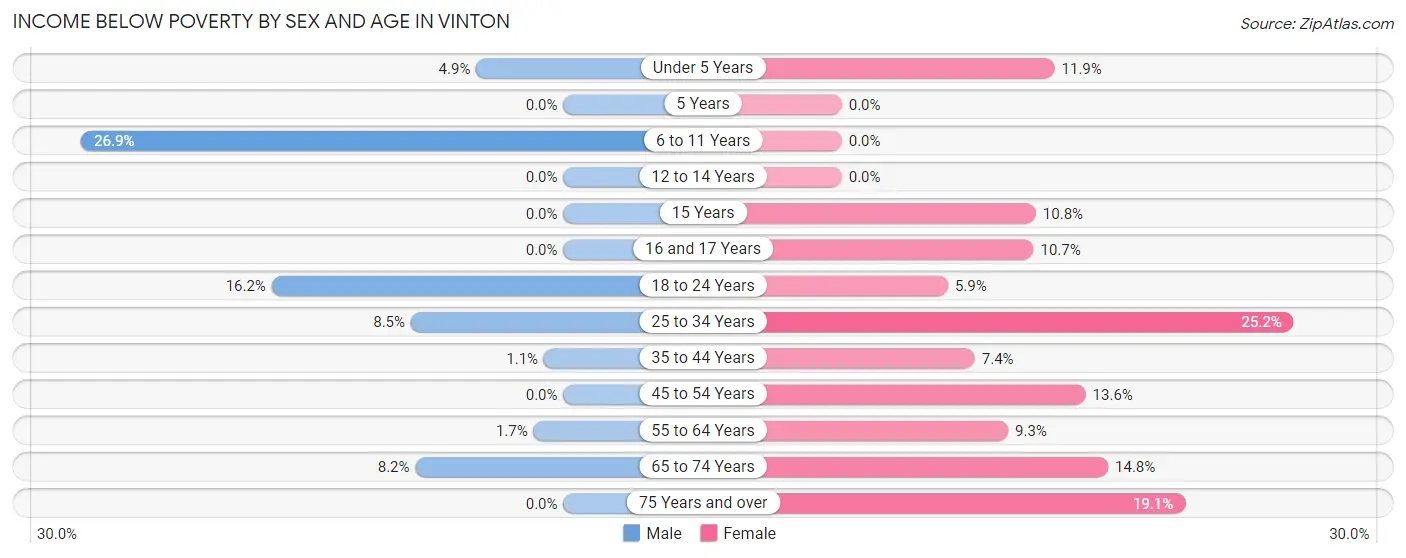
| Age Bracket | Male | Female |
| Under 5 Years | 11 (4.9%) | 16 (11.8%) |
| 5 Years | 0 (0.0%) | 0 (0.0%) |
| 6 to 11 Years | 80 (26.9%) | 0 (0.0%) |
| 12 to 14 Years | 0 (0.0%) | 0 (0.0%) |
| 15 Years | 0 (0.0%) | 24 (10.8%) |
| 16 and 17 Years | 0 (0.0%) | 11 (10.7%) |
| 18 to 24 Years | 77 (16.2%) | 11 (5.9%) |
| 25 to 34 Years | 55 (8.5%) | 117 (25.2%) |
| 35 to 44 Years | 3 (1.1%) | 45 (7.4%) |
| 45 to 54 Years | 0 (0.0%) | 69 (13.6%) |
| 55 to 64 Years | 9 (1.7%) | 61 (9.3%) |
| 65 to 74 Years | 36 (8.2%) | 58 (14.8%) |
| 75 Years and over | 0 (0.0%) | 69 (19.1%) |
| Total | 271 (7.2%) | 481 (11.8%) |
Income Above Poverty by Sex and Age in Vinton
According to the poverty statistics in Vinton, males aged 5 years and females aged 5 years are the age groups that are most secure financially, with 100.0% of males and 100.0% of females in these age groups living above the poverty line.
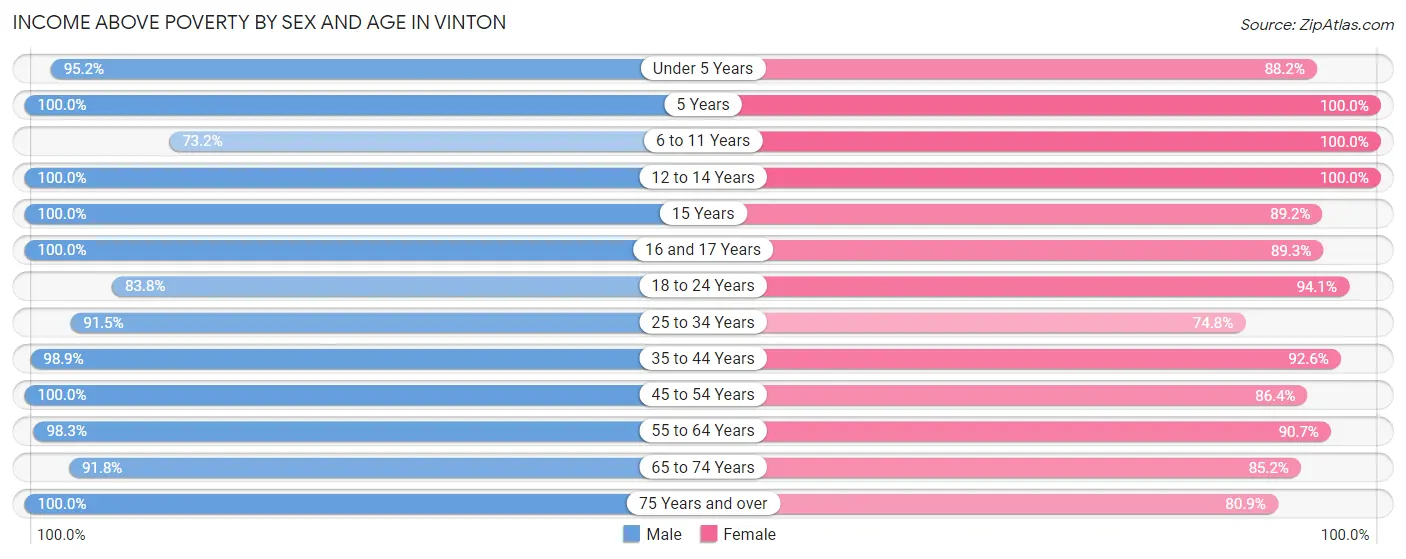
| Age Bracket | Male | Female |
| Under 5 Years | 216 (95.2%) | 119 (88.1%) |
| 5 Years | 44 (100.0%) | 91 (100.0%) |
| 6 to 11 Years | 218 (73.2%) | 270 (100.0%) |
| 12 to 14 Years | 100 (100.0%) | 93 (100.0%) |
| 15 Years | 7 (100.0%) | 198 (89.2%) |
| 16 and 17 Years | 87 (100.0%) | 92 (89.3%) |
| 18 to 24 Years | 397 (83.8%) | 175 (94.1%) |
| 25 to 34 Years | 593 (91.5%) | 348 (74.8%) |
| 35 to 44 Years | 274 (98.9%) | 562 (92.6%) |
| 45 to 54 Years | 421 (100.0%) | 439 (86.4%) |
| 55 to 64 Years | 532 (98.3%) | 598 (90.7%) |
| 65 to 74 Years | 401 (91.8%) | 333 (85.2%) |
| 75 Years and over | 185 (100.0%) | 292 (80.9%) |
| Total | 3,475 (92.8%) | 3,610 (88.2%) |
Income Below Poverty Among Married-Couple Families in Vinton
The poverty statistics for married-couple families in Vinton show that 1.2% or 14 of the total 1,184 families live below the poverty line. Families with no children have the highest poverty rate of 1.9%, comprising of 14 families. On the other hand, families with 1 or 2 children have the lowest poverty rate of 0.0%, which includes 0 families.
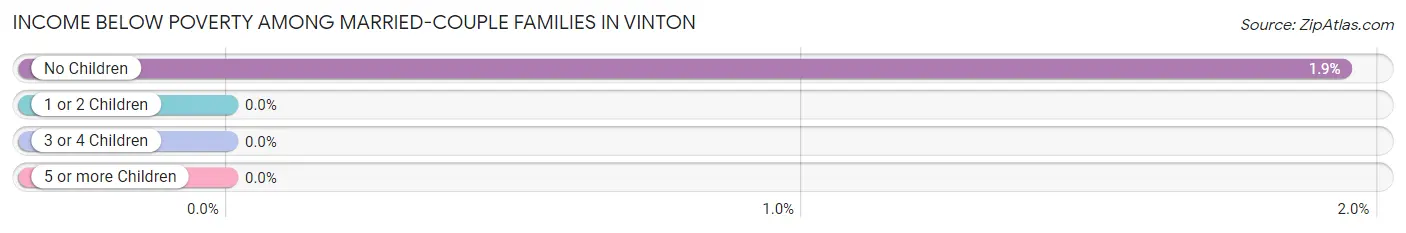
| Children | Above Poverty | Below Poverty |
| No Children | 707 (98.1%) | 14 (1.9%) |
| 1 or 2 Children | 371 (100.0%) | 0 (0.0%) |
| 3 or 4 Children | 92 (100.0%) | 0 (0.0%) |
| 5 or more Children | 0 (0.0%) | 0 (0.0%) |
| Total | 1,170 (98.8%) | 14 (1.2%) |
Income Below Poverty Among Single-Parent Households in Vinton
According to the poverty data in Vinton, 1.6% or 6 single-father households and 18.8% or 120 single-mother households are living below the poverty line. Among single-father households, those with 1 or 2 children have the highest poverty rate, with 6 households (2.0%) experiencing poverty. Likewise, among single-mother households, those with 1 or 2 children have the highest poverty rate, with 120 households (33.4%) falling below the poverty line.
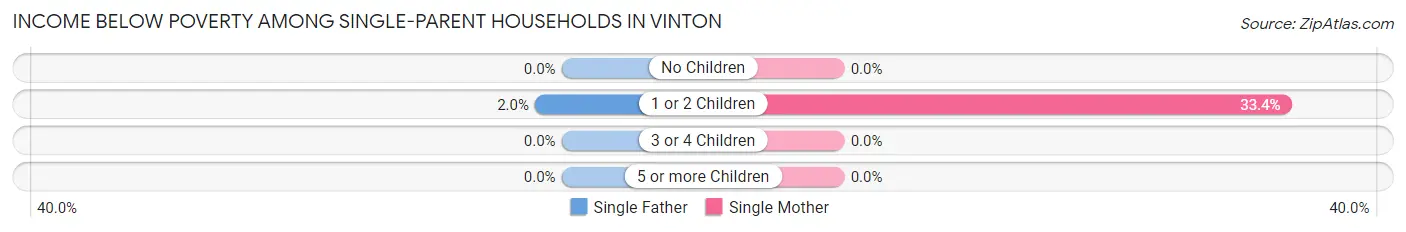
| Children | Single Father | Single Mother |
| No Children | 0 (0.0%) | 0 (0.0%) |
| 1 or 2 Children | 6 (2.0%) | 120 (33.4%) |
| 3 or 4 Children | 0 (0.0%) | 0 (0.0%) |
| 5 or more Children | 0 (0.0%) | 0 (0.0%) |
| Total | 6 (1.6%) | 120 (18.8%) |
Income Below Poverty Among Married-Couple vs Single-Parent Households in Vinton
The poverty data for Vinton shows that 14 of the married-couple family households (1.2%) and 126 of the single-parent households (12.5%) are living below the poverty level. Within the married-couple family households, those with no children have the highest poverty rate, with 14 households (1.9%) falling below the poverty line. Among the single-parent households, those with 1 or 2 children have the highest poverty rate, with 126 household (19.1%) living below poverty.
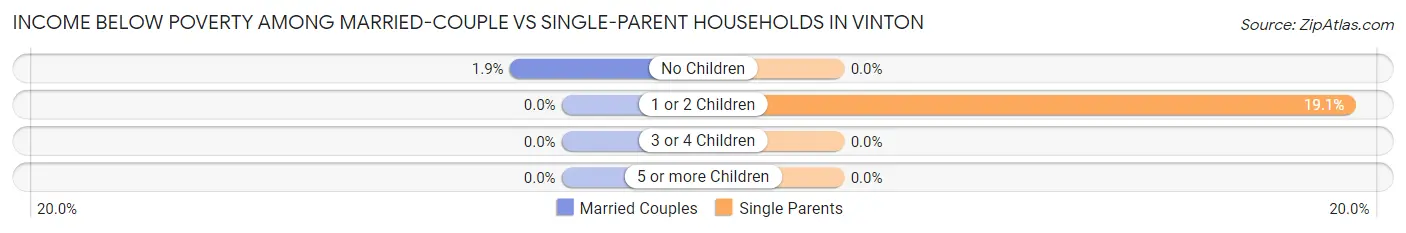
| Children | Married-Couple Families | Single-Parent Households |
| No Children | 14 (1.9%) | 0 (0.0%) |
| 1 or 2 Children | 0 (0.0%) | 126 (19.1%) |
| 3 or 4 Children | 0 (0.0%) | 0 (0.0%) |
| 5 or more Children | 0 (0.0%) | 0 (0.0%) |
| Total | 14 (1.2%) | 126 (12.5%) |
Race in Vinton
The most populous races in Vinton are White / Caucasian (7,364 | 91.5%), Black / African American (276 | 3.4%), and Hispanic or Latino (225 | 2.8%).
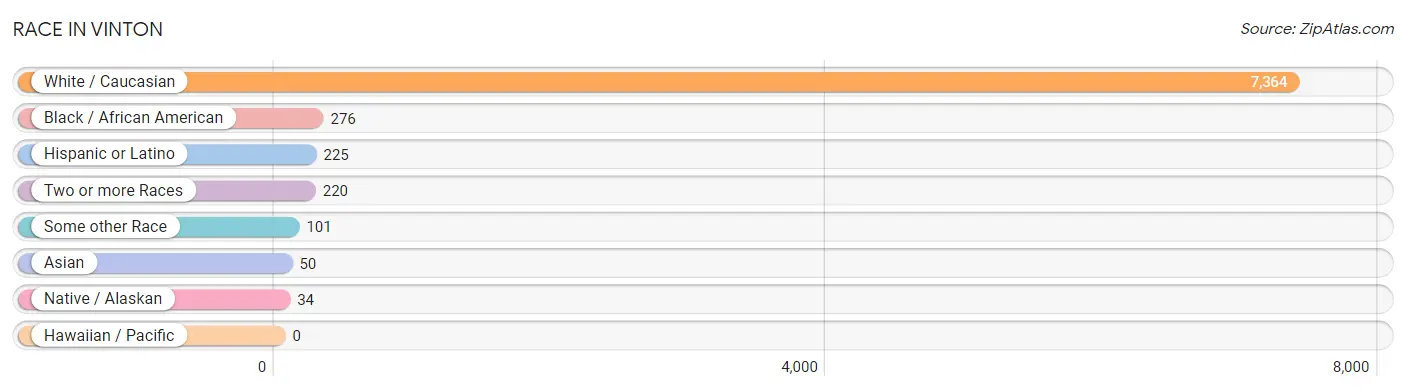
| Race | # Population | % Population |
| Asian | 50 | 0.6% |
| Black / African American | 276 | 3.4% |
| Hawaiian / Pacific | 0 | 0.0% |
| Hispanic or Latino | 225 | 2.8% |
| Native / Alaskan | 34 | 0.4% |
| White / Caucasian | 7,364 | 91.5% |
| Two or more Races | 220 | 2.7% |
| Some other Race | 101 | 1.3% |
| Total | 8,045 | 100.0% |
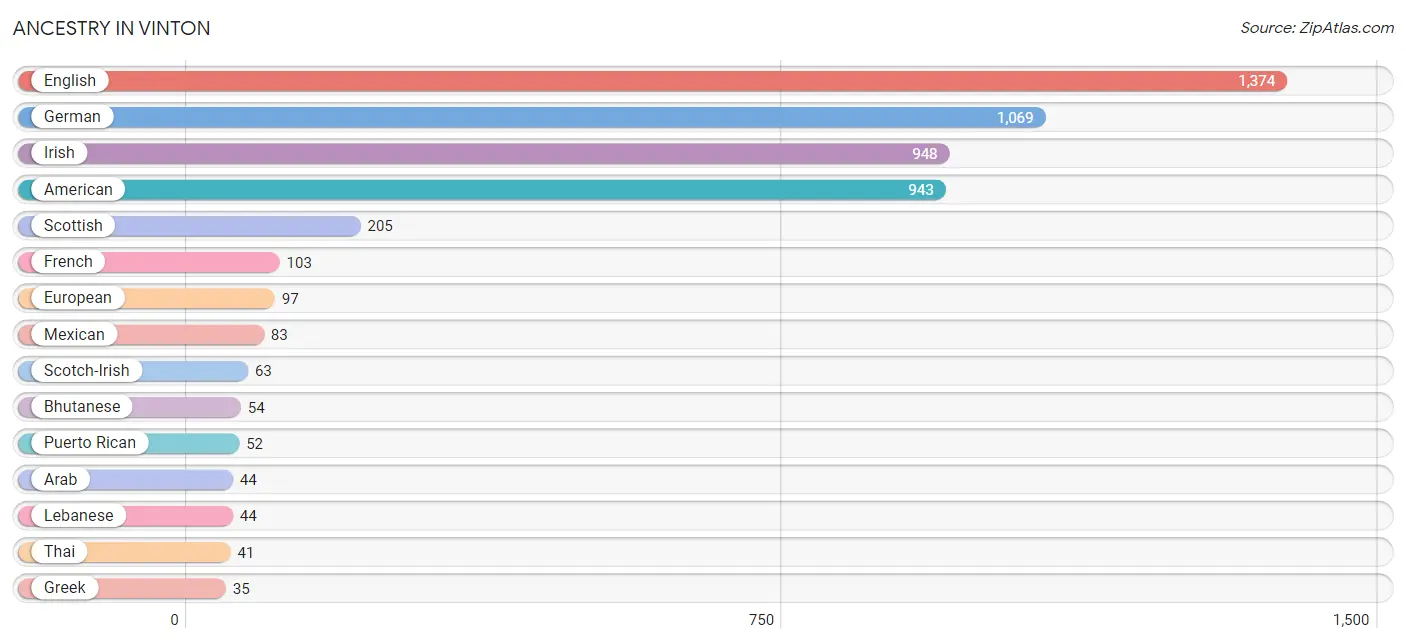
Ancestry in Vinton
The most populous ancestries reported in Vinton are English (1,374 | 17.1%), German (1,069 | 13.3%), Irish (948 | 11.8%), American (943 | 11.7%), and Scottish (205 | 2.5%), together accounting for 56.4% of all Vinton residents.
| Ancestry | # Population | % Population |
| African | 11 | 0.1% |
| American | 943 | 11.7% |
| Arab | 44 | 0.5% |
| Bhutanese | 54 | 0.7% |
| British | 27 | 0.3% |
| Cherokee | 16 | 0.2% |
| Chippewa | 8 | 0.1% |
| Cuban | 26 | 0.3% |
| Czech | 14 | 0.2% |
| Danish | 13 | 0.2% |
| Dutch | 30 | 0.4% |
| English | 1,374 | 17.1% |
| European | 97 | 1.2% |
| French | 103 | 1.3% |
| French Canadian | 19 | 0.2% |
| German | 1,069 | 13.3% |
| Greek | 35 | 0.4% |
| Hungarian | 16 | 0.2% |
| Irish | 948 | 11.8% |
| Iroquois | 2 | 0.0% |
| Italian | 24 | 0.3% |
| Lebanese | 44 | 0.5% |
| Mexican | 83 | 1.0% |
| Navajo | 24 | 0.3% |
| Norwegian | 21 | 0.3% |
| Polish | 9 | 0.1% |
| Portuguese | 20 | 0.3% |
| Puerto Rican | 52 | 0.6% |
| Russian | 11 | 0.1% |
| Scandinavian | 9 | 0.1% |
| Scotch-Irish | 63 | 0.8% |
| Scottish | 205 | 2.5% |
| Serbian | 8 | 0.1% |
| Sierra Leonean | 6 | 0.1% |
| Spaniard | 22 | 0.3% |
| Subsaharan African | 17 | 0.2% |
| Swedish | 33 | 0.4% |
| Thai | 41 | 0.5% |
| Ukrainian | 9 | 0.1% |
| Welsh | 8 | 0.1% | View All 40 Rows |
Immigrants in Vinton
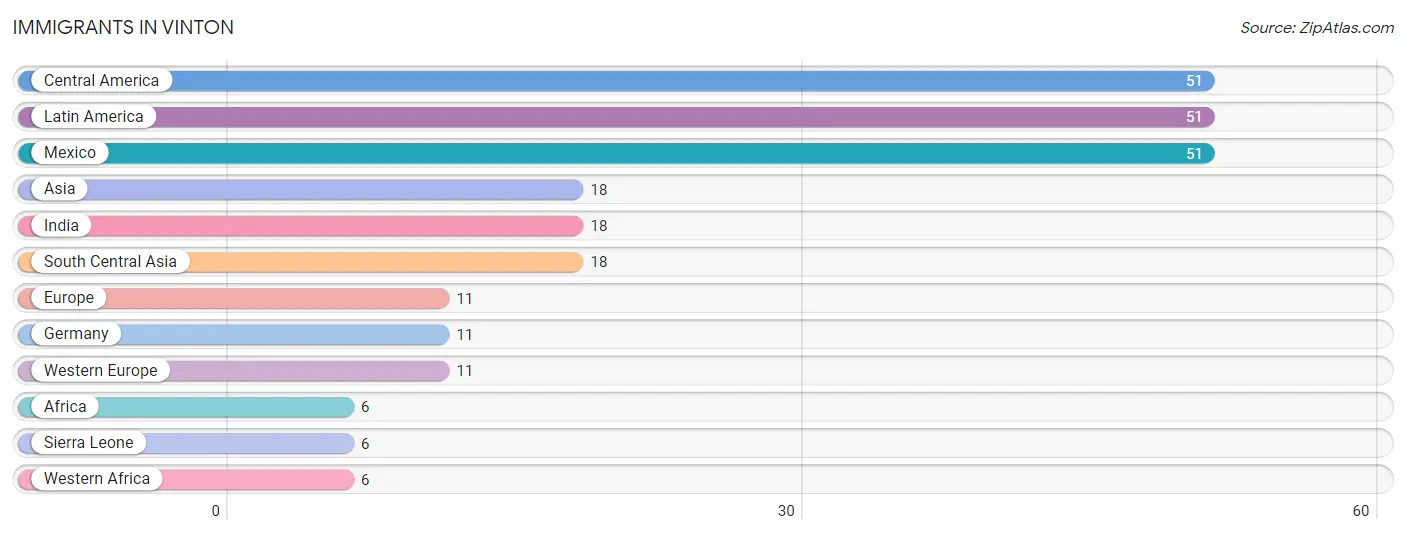
The most numerous immigrant groups reported in Vinton came from Central America (51 | 0.6%), Latin America (51 | 0.6%), Mexico (51 | 0.6%), Asia (18 | 0.2%), and India (18 | 0.2%), together accounting for 2.3% of all Vinton residents.
| Immigration Origin | # Population | % Population |
| Africa | 6 | 0.1% |
| Asia | 18 | 0.2% |
| Central America | 51 | 0.6% |
| Europe | 11 | 0.1% |
| Germany | 11 | 0.1% |
| India | 18 | 0.2% |
| Latin America | 51 | 0.6% |
| Mexico | 51 | 0.6% |
| Sierra Leone | 6 | 0.1% |
| South Central Asia | 18 | 0.2% |
| Western Africa | 6 | 0.1% |
| Western Europe | 11 | 0.1% | View All 12 Rows |
Sex and Age in Vinton
Sex and Age in Vinton
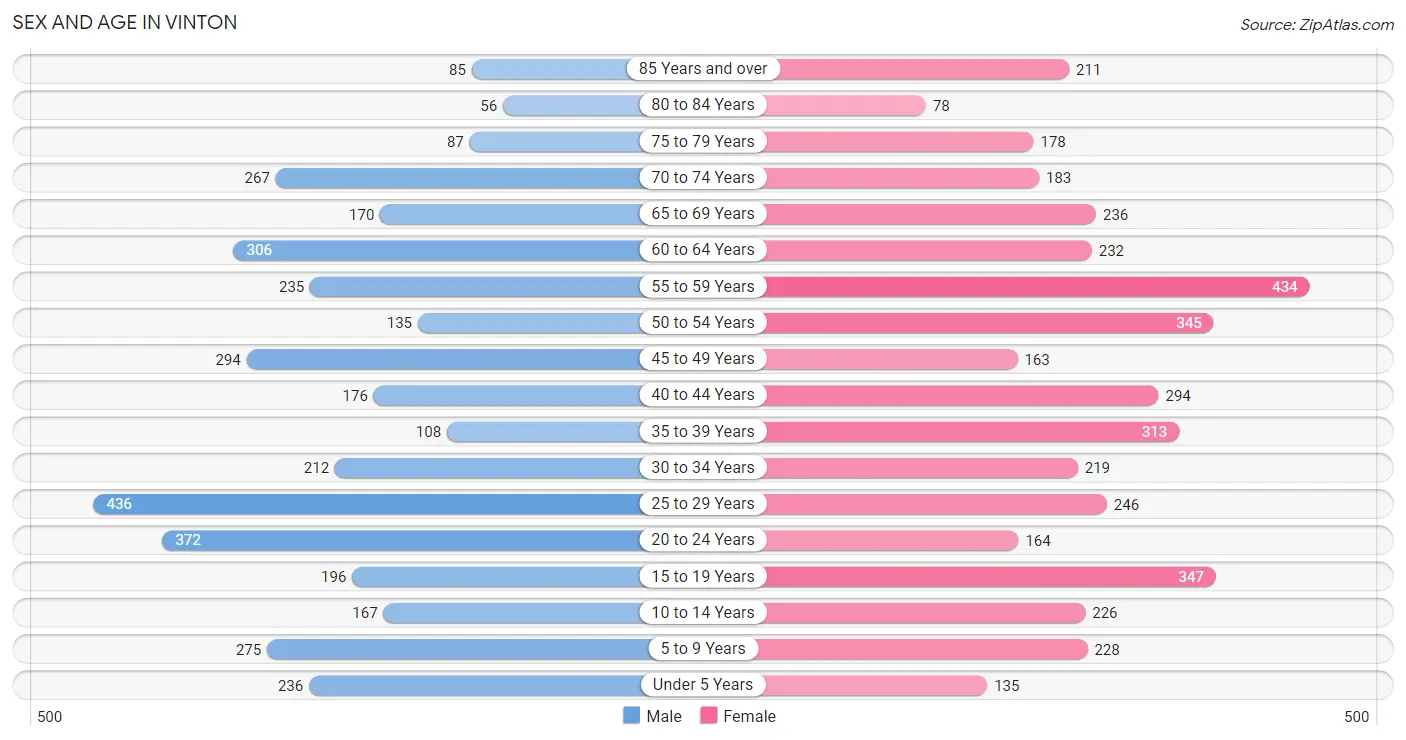
The most populous age groups in Vinton are 25 to 29 Years (436 | 11.4%) for men and 55 to 59 Years (434 | 10.3%) for women.
| Age Bracket | Male | Female |
| Under 5 Years | 236 (6.2%) | 135 (3.2%) |
| 5 to 9 Years | 275 (7.2%) | 228 (5.4%) |
| 10 to 14 Years | 167 (4.4%) | 226 (5.3%) |
| 15 to 19 Years | 196 (5.1%) | 347 (8.2%) |
| 20 to 24 Years | 372 (9.8%) | 164 (3.9%) |
| 25 to 29 Years | 436 (11.4%) | 246 (5.8%) |
| 30 to 34 Years | 212 (5.6%) | 219 (5.2%) |
| 35 to 39 Years | 108 (2.8%) | 313 (7.4%) |
| 40 to 44 Years | 176 (4.6%) | 294 (7.0%) |
| 45 to 49 Years | 294 (7.7%) | 163 (3.8%) |
| 50 to 54 Years | 135 (3.5%) | 345 (8.2%) |
| 55 to 59 Years | 235 (6.2%) | 434 (10.3%) |
| 60 to 64 Years | 306 (8.0%) | 232 (5.5%) |
| 65 to 69 Years | 170 (4.5%) | 236 (5.6%) |
| 70 to 74 Years | 267 (7.0%) | 183 (4.3%) |
| 75 to 79 Years | 87 (2.3%) | 178 (4.2%) |
| 80 to 84 Years | 56 (1.5%) | 78 (1.8%) |
| 85 Years and over | 85 (2.2%) | 211 (5.0%) |
| Total | 3,813 (100.0%) | 4,232 (100.0%) |
Families and Households in Vinton
Median Family Size in Vinton
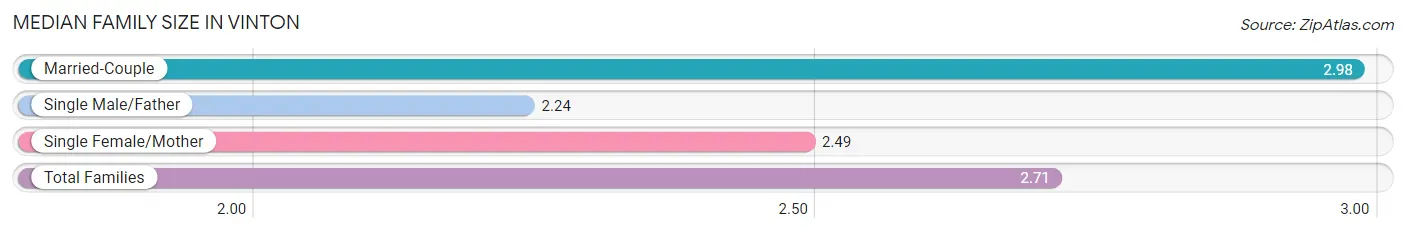
The median family size in Vinton is 2.71 persons per family, with married-couple families (1,184 | 54.0%) accounting for the largest median family size of 2.98 persons per family. On the other hand, single male/father families (369 | 16.8%) represent the smallest median family size with 2.24 persons per family.
| Family Type | # Families | Family Size |
| Married-Couple | 1,184 (54.0%) | 2.98 |
| Single Male/Father | 369 (16.8%) | 2.24 |
| Single Female/Mother | 640 (29.2%) | 2.49 |
| Total Families | 2,193 (100.0%) | 2.71 |
Median Household Size in Vinton
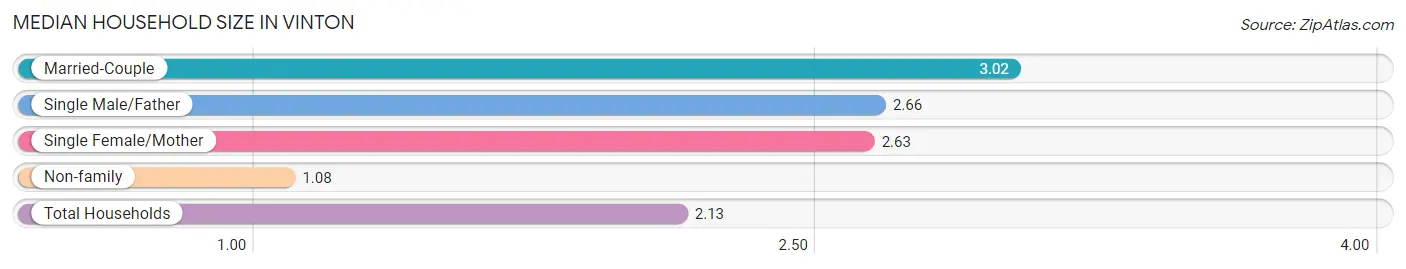
The median household size in Vinton is 2.13 persons per household, with married-couple households (1,184 | 32.1%) accounting for the largest median household size of 3.02 persons per household. non-family households (1,493 | 40.5%) represent the smallest median household size with 1.08 persons per household.
| Household Type | # Households | Household Size |
| Married-Couple | 1,184 (32.1%) | 3.02 |
| Single Male/Father | 369 (10.0%) | 2.66 |
| Single Female/Mother | 640 (17.4%) | 2.63 |
| Non-family | 1,493 (40.5%) | 1.08 |
| Total Households | 3,686 (100.0%) | 2.13 |
Household Size by Marriage Status in Vinton
Out of a total of 3,686 households in Vinton, 2,193 (59.5%) are family households, while 1,493 (40.5%) are nonfamily households. The most numerous type of family households are 2-person households, comprising 1,062, and the most common type of nonfamily households are 1-person households, comprising 1,380.
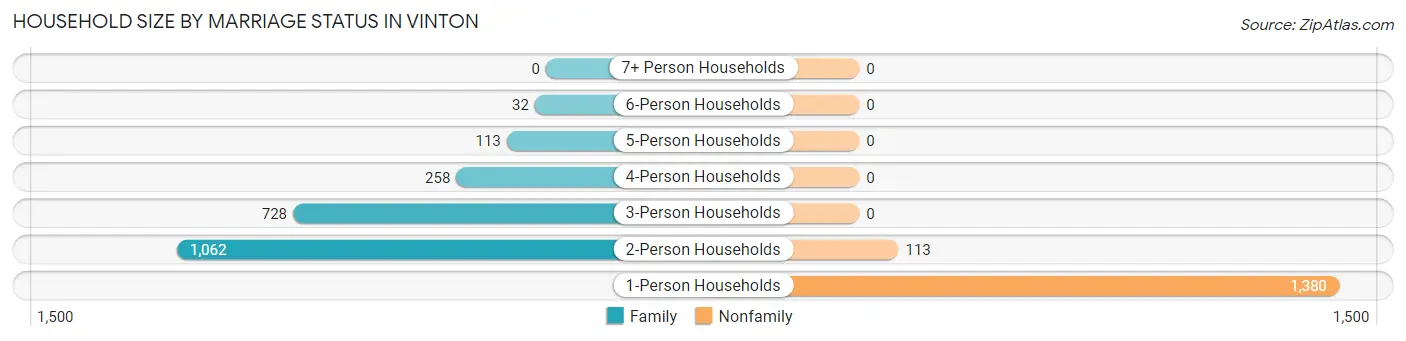
| Household Size | Family Households | Nonfamily Households |
| 1-Person Households | - | 1,380 (37.4%) |
| 2-Person Households | 1,062 (28.8%) | 113 (3.1%) |
| 3-Person Households | 728 (19.8%) | 0 (0.0%) |
| 4-Person Households | 258 (7.0%) | 0 (0.0%) |
| 5-Person Households | 113 (3.1%) | 0 (0.0%) |
| 6-Person Households | 32 (0.9%) | 0 (0.0%) |
| 7+ Person Households | 0 (0.0%) | 0 (0.0%) |
| Total | 2,193 (59.5%) | 1,493 (40.5%) |
Female Fertility in Vinton
Fertility by Age in Vinton
Average fertility rate in Vinton is 44.0 births per 1,000 women. Women in the age bracket of 20 to 34 years have the highest fertility rate with 111.0 births per 1,000 women. Women in the age bracket of 20 to 34 years acount for 88.6% of all women with births.
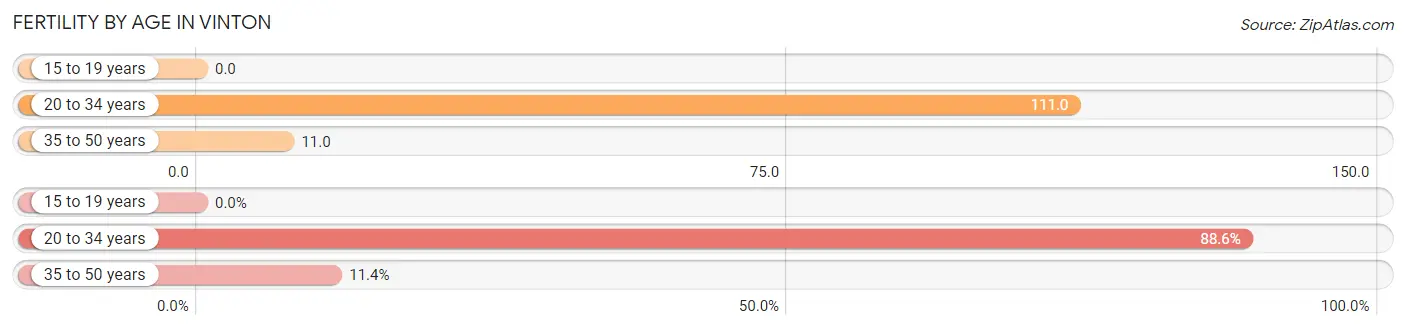
| Age Bracket | Women with Births | Births / 1,000 Women |
| 15 to 19 years | 0 (0.0%) | 0.0 |
| 20 to 34 years | 70 (88.6%) | 111.0 |
| 35 to 50 years | 9 (11.4%) | 11.0 |
| Total | 79 (100.0%) | 44.0 |
Fertility by Age by Marriage Status in Vinton
59.5% of women with births (79) in Vinton are married. The highest percentage of unmarried women with births falls into 20 to 34 years age bracket with 45.7% of them unmarried at the time of birth, while the lowest percentage of unmarried women with births belong to 35 to 50 years age bracket with 0.0% of them unmarried.
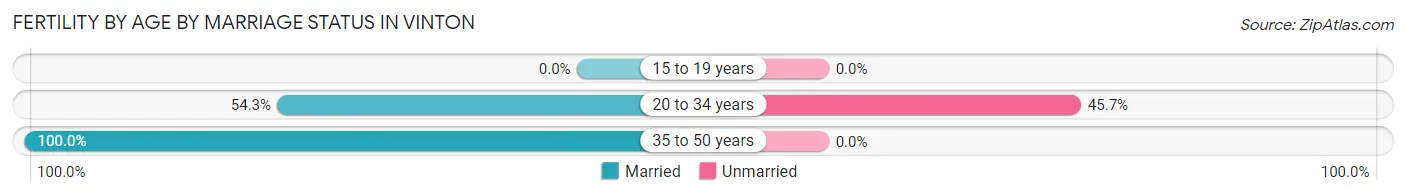
| Age Bracket | Married | Unmarried |
| 15 to 19 years | 0 (0.0%) | 0 (0.0%) |
| 20 to 34 years | 38 (54.3%) | 32 (45.7%) |
| 35 to 50 years | 9 (100.0%) | 0 (0.0%) |
| Total | 47 (59.5%) | 32 (40.5%) |
Fertility by Education in Vinton
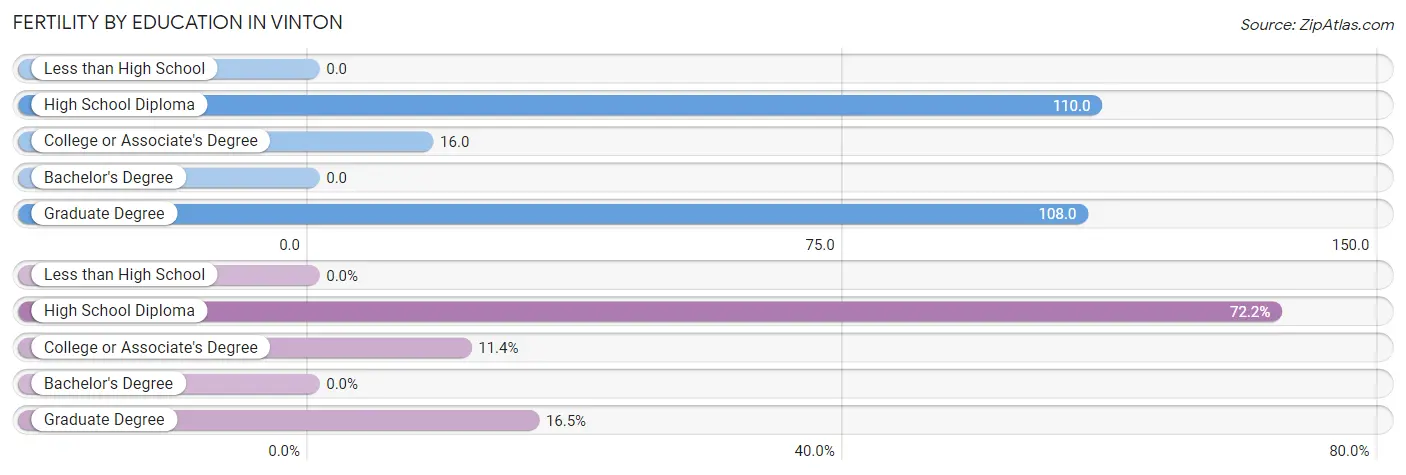
| Educational Attainment | Women with Births | Births / 1,000 Women |
| Less than High School | 0 (0.0%) | 0.0 |
| High School Diploma | 57 (72.2%) | 110.0 |
| College or Associate's Degree | 9 (11.4%) | 16.0 |
| Bachelor's Degree | 0 (0.0%) | 0.0 |
| Graduate Degree | 13 (16.5%) | 108.0 |
| Total | 79 (100.0%) | 44.0 |
Fertility by Education by Marriage Status in Vinton
40.5% of women with births in Vinton are unmarried. Women with the educational attainment of college or associate's degree are most likely to be married with 100.0% of them married at childbirth, while women with the educational attainment of high school diploma are least likely to be married with 56.1% of them unmarried at childbirth.
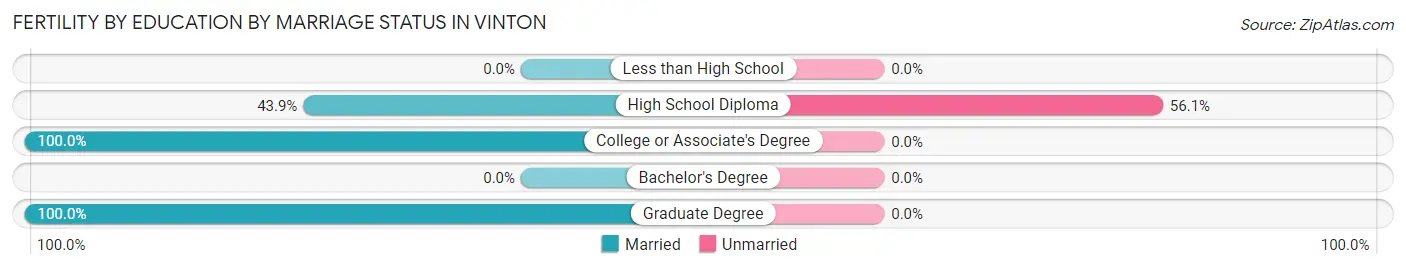
| Educational Attainment | Married | Unmarried |
| Less than High School | 0 (0.0%) | 0 (0.0%) |
| High School Diploma | 25 (43.9%) | 32 (56.1%) |
| College or Associate's Degree | 9 (100.0%) | 0 (0.0%) |
| Bachelor's Degree | 0 (0.0%) | 0 (0.0%) |
| Graduate Degree | 13 (100.0%) | 0 (0.0%) |
| Total | 47 (59.5%) | 32 (40.5%) |
Employment Characteristics in Vinton
Employment by Class of Employer in Vinton
Among the 3,950 employed individuals in Vinton, private company employees (2,795 | 70.8%), local government employees (306 | 7.7%), and not-for-profit organizations (288 | 7.3%) make up the most common classes of employment.
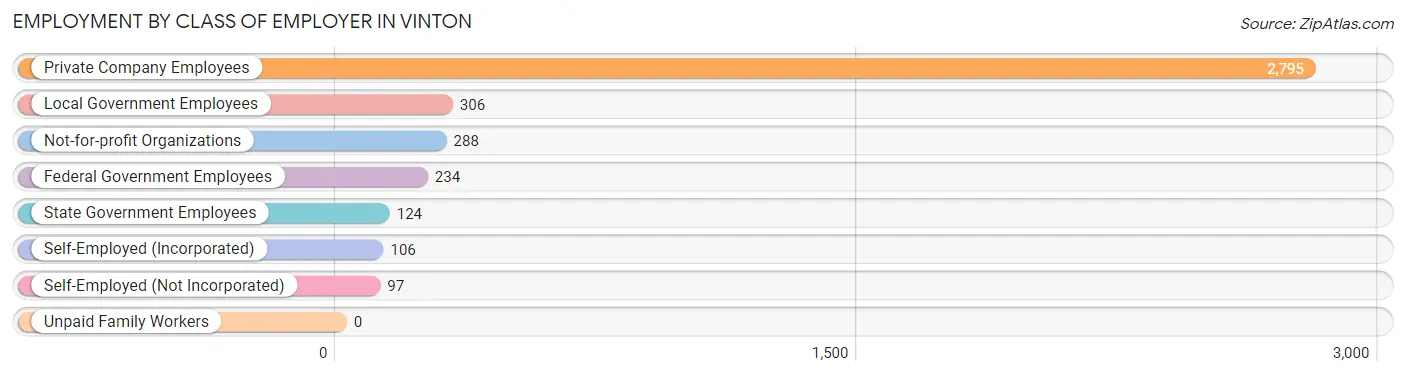
| Employer Class | # Employees | % Employees |
| Private Company Employees | 2,795 | 70.8% |
| Self-Employed (Incorporated) | 106 | 2.7% |
| Self-Employed (Not Incorporated) | 97 | 2.5% |
| Not-for-profit Organizations | 288 | 7.3% |
| Local Government Employees | 306 | 7.7% |
| State Government Employees | 124 | 3.1% |
| Federal Government Employees | 234 | 5.9% |
| Unpaid Family Workers | 0 | 0.0% |
| Total | 3,950 | 100.0% |
Employment Status by Age in Vinton
According to the labor force statistics for Vinton, out of the total population over 16 years of age (6,549), 65.3% or 4,276 individuals are in the labor force, with 2.0% or 86 of them unemployed. The age group with the highest labor force participation rate is 30 to 34 years, with 97.9% or 422 individuals in the labor force. Within the labor force, the 75 years and over age range has the highest percentage of unemployed individuals, with 36.8% or 14 of them being unemployed.
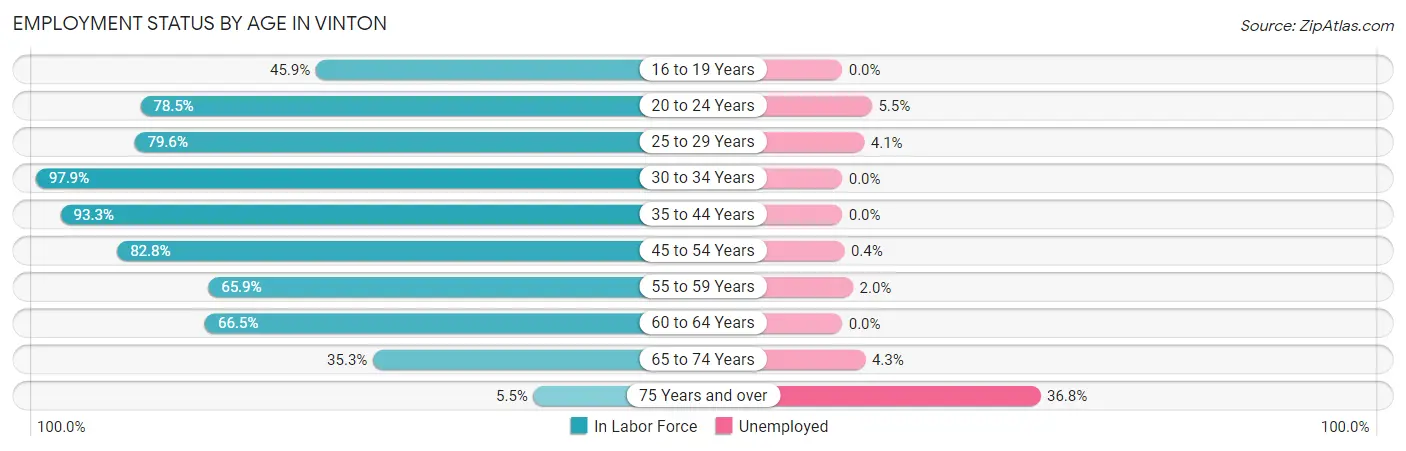
| Age Bracket | In Labor Force | Unemployed |
| 16 to 19 Years | 144 (45.9%) | 0 (0.0%) |
| 20 to 24 Years | 421 (78.5%) | 23 (5.5%) |
| 25 to 29 Years | 543 (79.6%) | 22 (4.1%) |
| 30 to 34 Years | 422 (97.9%) | 0 (0.0%) |
| 35 to 44 Years | 831 (93.3%) | 0 (0.0%) |
| 45 to 54 Years | 776 (82.8%) | 3 (0.4%) |
| 55 to 59 Years | 441 (65.9%) | 9 (2.0%) |
| 60 to 64 Years | 358 (66.5%) | 0 (0.0%) |
| 65 to 74 Years | 302 (35.3%) | 13 (4.3%) |
| 75 Years and over | 38 (5.5%) | 14 (36.8%) |
| Total | 4,276 (65.3%) | 86 (2.0%) |
Employment Status by Educational Attainment in Vinton
According to labor force statistics for Vinton, 81.3% of individuals (3,372) out of the total population between 25 and 64 years of age (4,148) are in the labor force, with 1.0% or 34 of them being unemployed. The group with the highest labor force participation rate are those with the educational attainment of college / associate degree, with 92.6% or 1,285 individuals in the labor force. Within the labor force, individuals with bachelor's degree or higher education have the highest percentage of unemployment, with 2.6% or 22 of them being unemployed.
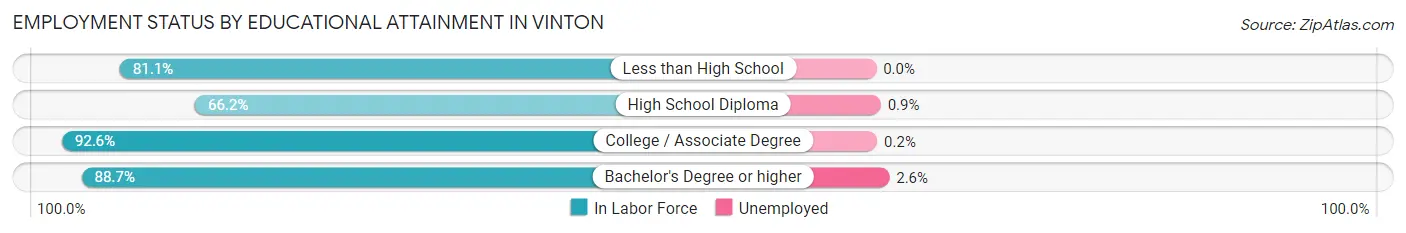
| Educational Attainment | In Labor Force | Unemployed |
| Less than High School | 245 (81.1%) | 0 (0.0%) |
| High School Diploma | 997 (66.2%) | 14 (0.9%) |
| College / Associate Degree | 1,285 (92.6%) | 3 (0.2%) |
| Bachelor's Degree or higher | 844 (88.7%) | 25 (2.6%) |
| Total | 3,372 (81.3%) | 41 (1.0%) |
Employment Occupations by Sex in Vinton
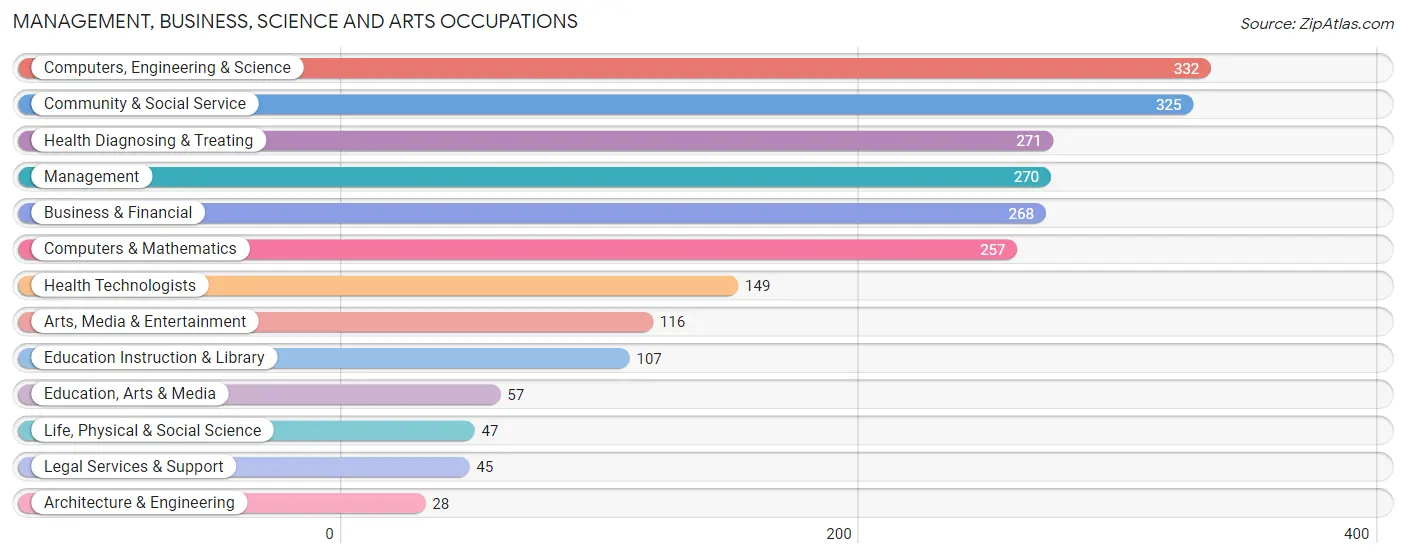
Management, Business, Science and Arts Occupations
The most common Management, Business, Science and Arts occupations in Vinton are Computers, Engineering & Science (332 | 7.9%), Community & Social Service (325 | 7.7%), Health Diagnosing & Treating (271 | 6.5%), Management (270 | 6.4%), and Business & Financial (268 | 6.4%).
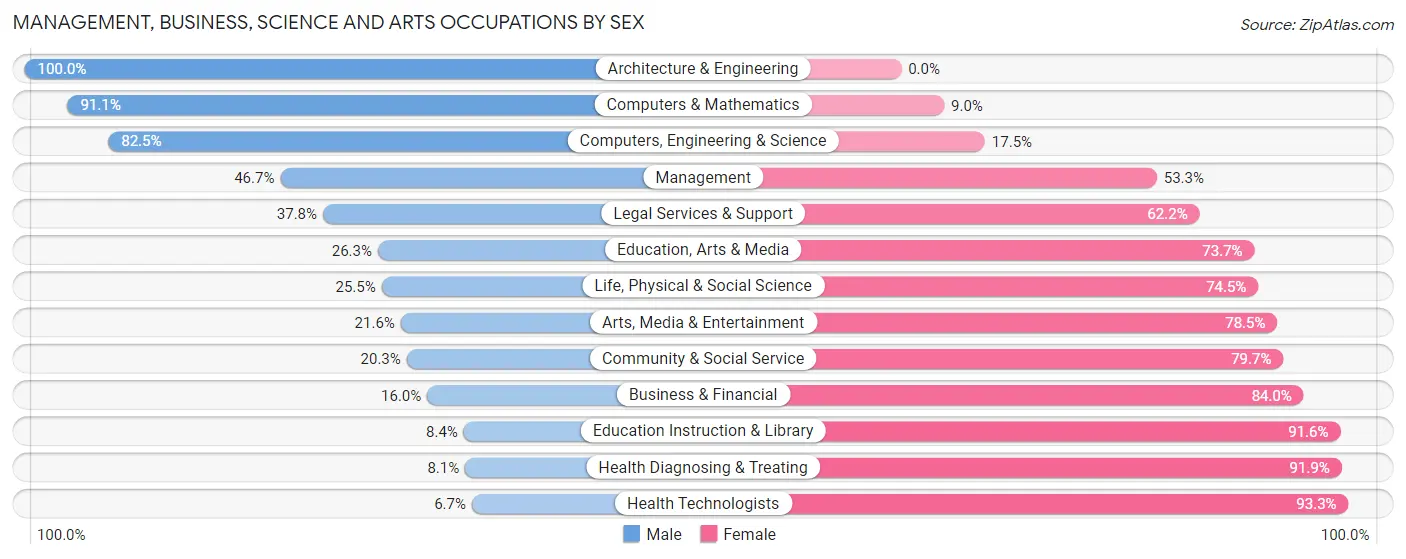
Management, Business, Science and Arts Occupations by Sex
Within the Management, Business, Science and Arts occupations in Vinton, the most male-oriented occupations are Architecture & Engineering (100.0%), Computers & Mathematics (91.0%), and Computers, Engineering & Science (82.5%), while the most female-oriented occupations are Health Technologists (93.3%), Health Diagnosing & Treating (91.9%), and Education Instruction & Library (91.6%).
| Occupation | Male | Female |
| Management | 126 (46.7%) | 144 (53.3%) |
| Business & Financial | 43 (16.0%) | 225 (84.0%) |
| Computers, Engineering & Science | 274 (82.5%) | 58 (17.5%) |
| Computers & Mathematics | 234 (91.0%) | 23 (8.9%) |
| Architecture & Engineering | 28 (100.0%) | 0 (0.0%) |
| Life, Physical & Social Science | 12 (25.5%) | 35 (74.5%) |
| Community & Social Service | 66 (20.3%) | 259 (79.7%) |
| Education, Arts & Media | 15 (26.3%) | 42 (73.7%) |
| Legal Services & Support | 17 (37.8%) | 28 (62.2%) |
| Education Instruction & Library | 9 (8.4%) | 98 (91.6%) |
| Arts, Media & Entertainment | 25 (21.5%) | 91 (78.4%) |
| Health Diagnosing & Treating | 22 (8.1%) | 249 (91.9%) |
| Health Technologists | 10 (6.7%) | 139 (93.3%) |
| Total (Category) | 531 (36.2%) | 935 (63.8%) |
| Total (Overall) | 2,255 (53.8%) | 1,937 (46.2%) |
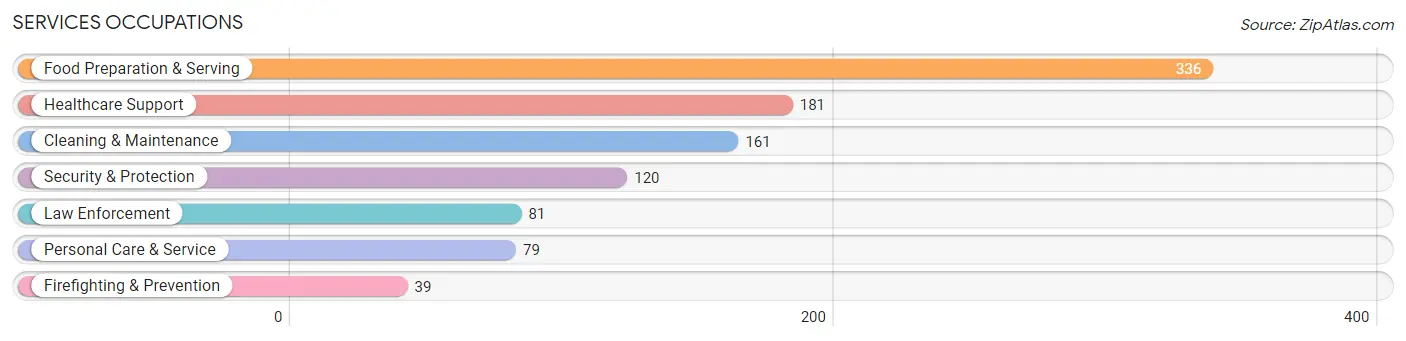
Services Occupations
The most common Services occupations in Vinton are Food Preparation & Serving (336 | 8.0%), Healthcare Support (181 | 4.3%), Cleaning & Maintenance (161 | 3.8%), Security & Protection (120 | 2.9%), and Law Enforcement (81 | 1.9%).
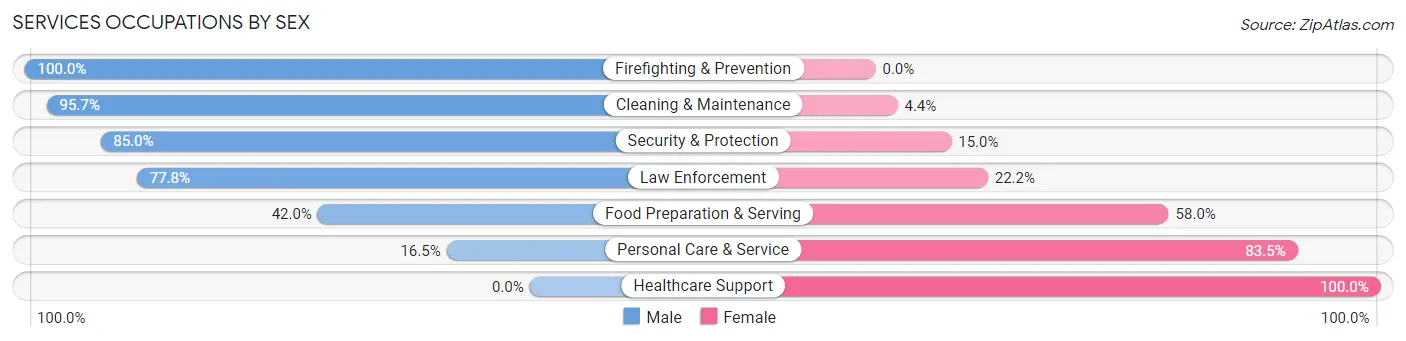
Services Occupations by Sex
Within the Services occupations in Vinton, the most male-oriented occupations are Firefighting & Prevention (100.0%), Cleaning & Maintenance (95.7%), and Security & Protection (85.0%), while the most female-oriented occupations are Healthcare Support (100.0%), Personal Care & Service (83.5%), and Food Preparation & Serving (58.0%).
| Occupation | Male | Female |
| Healthcare Support | 0 (0.0%) | 181 (100.0%) |
| Security & Protection | 102 (85.0%) | 18 (15.0%) |
| Firefighting & Prevention | 39 (100.0%) | 0 (0.0%) |
| Law Enforcement | 63 (77.8%) | 18 (22.2%) |
| Food Preparation & Serving | 141 (42.0%) | 195 (58.0%) |
| Cleaning & Maintenance | 154 (95.7%) | 7 (4.3%) |
| Personal Care & Service | 13 (16.5%) | 66 (83.5%) |
| Total (Category) | 410 (46.8%) | 467 (53.2%) |
| Total (Overall) | 2,255 (53.8%) | 1,937 (46.2%) |
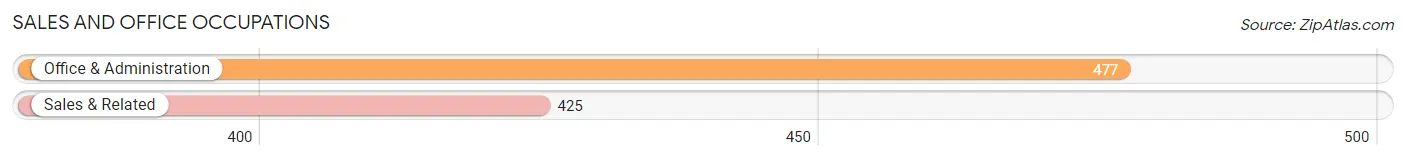
Sales and Office Occupations
The most common Sales and Office occupations in Vinton are Office & Administration (477 | 11.4%), and Sales & Related (425 | 10.1%).
Sales and Office Occupations by Sex
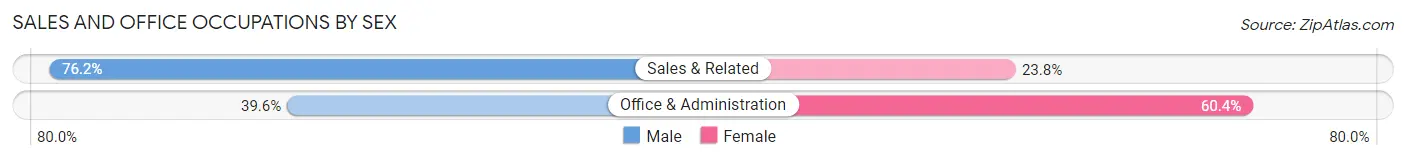
| Occupation | Male | Female |
| Sales & Related | 324 (76.2%) | 101 (23.8%) |
| Office & Administration | 189 (39.6%) | 288 (60.4%) |
| Total (Category) | 513 (56.9%) | 389 (43.1%) |
| Total (Overall) | 2,255 (53.8%) | 1,937 (46.2%) |
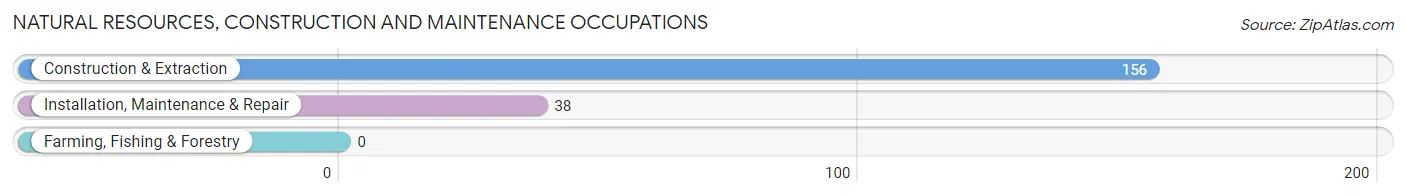
Natural Resources, Construction and Maintenance Occupations
The most common Natural Resources, Construction and Maintenance occupations in Vinton are Construction & Extraction (156 | 3.7%), and Installation, Maintenance & Repair (38 | 0.9%).
Natural Resources, Construction and Maintenance Occupations by Sex
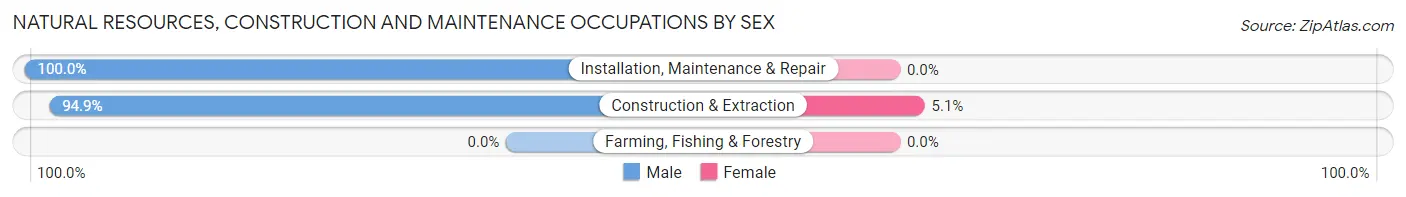
| Occupation | Male | Female |
| Farming, Fishing & Forestry | 0 (0.0%) | 0 (0.0%) |
| Construction & Extraction | 148 (94.9%) | 8 (5.1%) |
| Installation, Maintenance & Repair | 38 (100.0%) | 0 (0.0%) |
| Total (Category) | 186 (95.9%) | 8 (4.1%) |
| Total (Overall) | 2,255 (53.8%) | 1,937 (46.2%) |
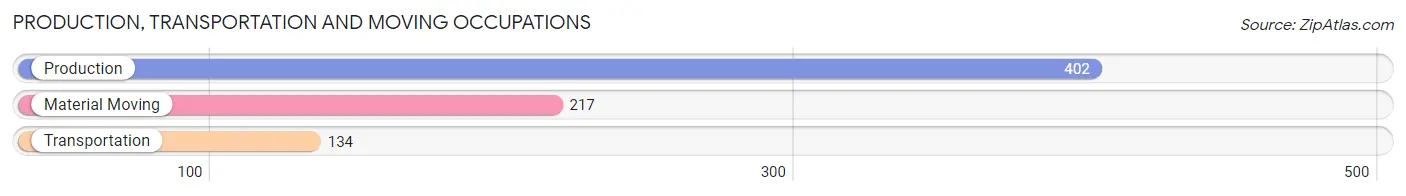
Production, Transportation and Moving Occupations
The most common Production, Transportation and Moving occupations in Vinton are Production (402 | 9.6%), Material Moving (217 | 5.2%), and Transportation (134 | 3.2%).
Production, Transportation and Moving Occupations by Sex
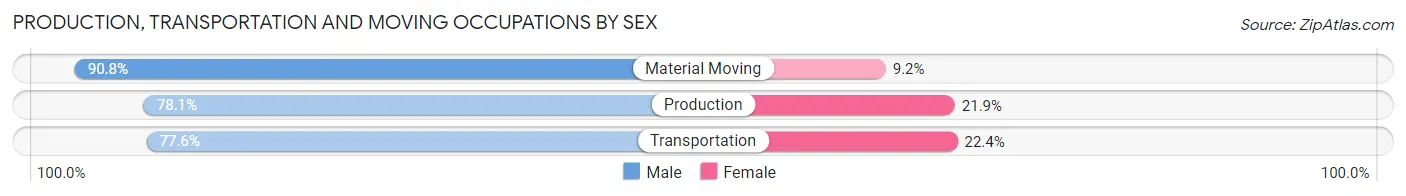
| Occupation | Male | Female |
| Production | 314 (78.1%) | 88 (21.9%) |
| Transportation | 104 (77.6%) | 30 (22.4%) |
| Material Moving | 197 (90.8%) | 20 (9.2%) |
| Total (Category) | 615 (81.7%) | 138 (18.3%) |
| Total (Overall) | 2,255 (53.8%) | 1,937 (46.2%) |
Employment Industries by Sex in Vinton
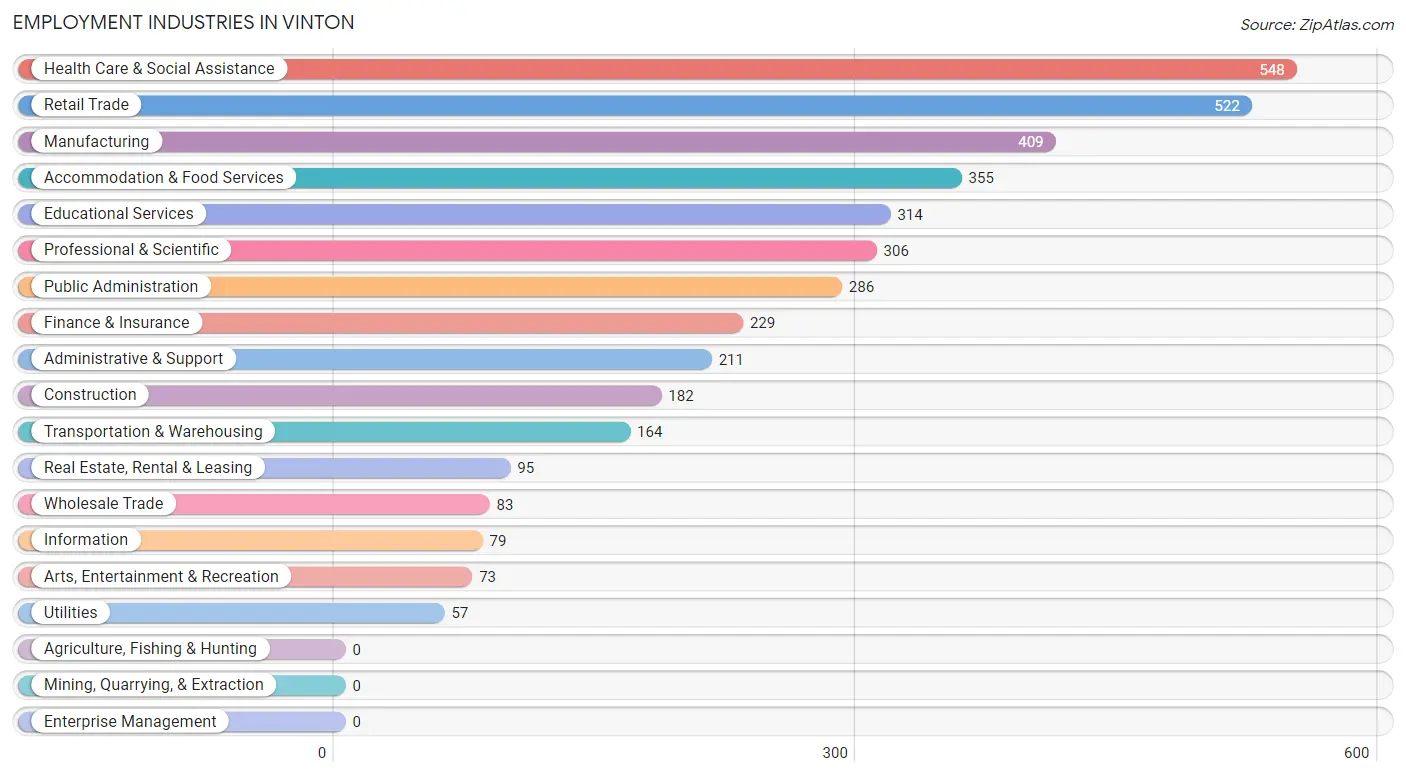
Employment Industries in Vinton
The major employment industries in Vinton include Health Care & Social Assistance (548 | 13.1%), Retail Trade (522 | 12.4%), Manufacturing (409 | 9.8%), Accommodation & Food Services (355 | 8.5%), and Educational Services (314 | 7.5%).
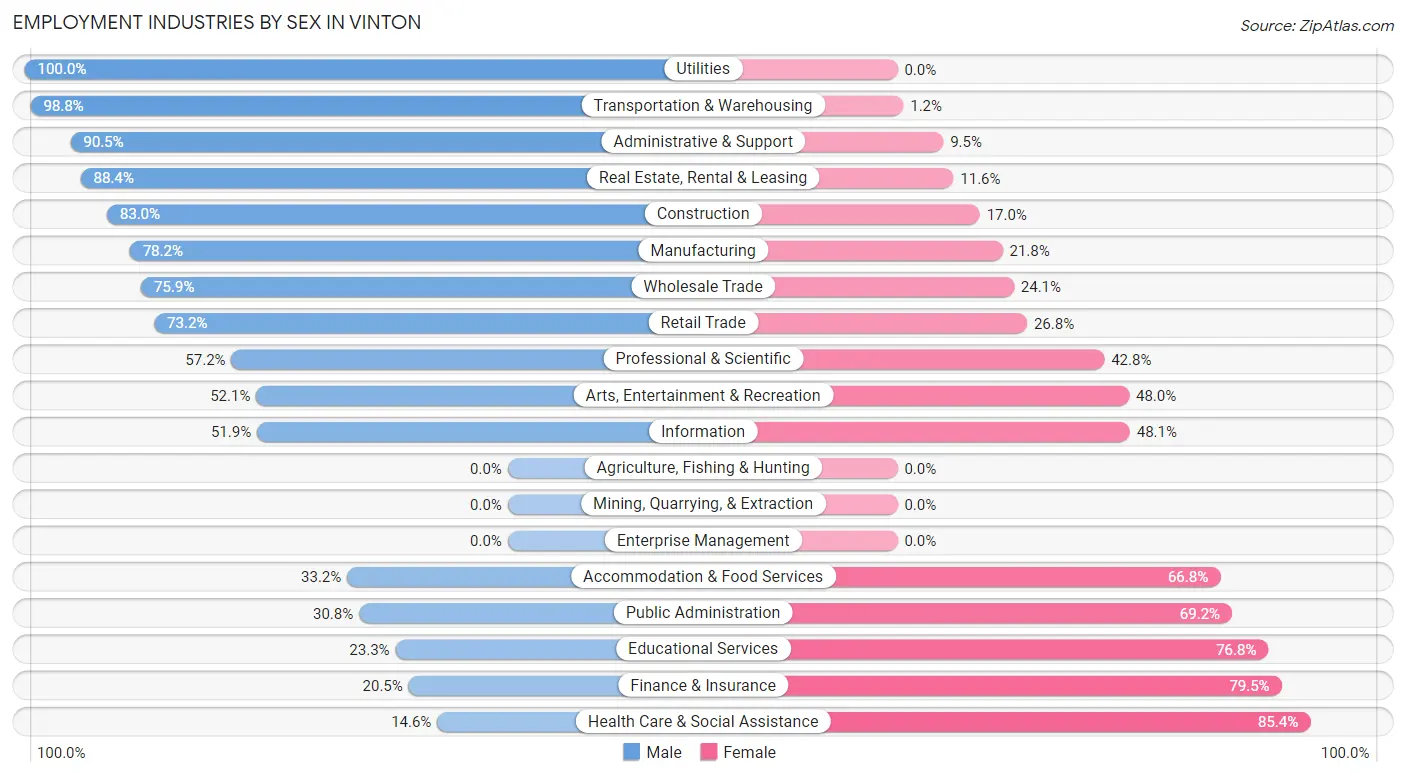
Employment Industries by Sex in Vinton
The Vinton industries that see more men than women are Utilities (100.0%), Transportation & Warehousing (98.8%), and Administrative & Support (90.5%), whereas the industries that tend to have a higher number of women are Health Care & Social Assistance (85.4%), Finance & Insurance (79.5%), and Educational Services (76.7%).
| Industry | Male | Female |
| Agriculture, Fishing & Hunting | 0 (0.0%) | 0 (0.0%) |
| Mining, Quarrying, & Extraction | 0 (0.0%) | 0 (0.0%) |
| Construction | 151 (83.0%) | 31 (17.0%) |
| Manufacturing | 320 (78.2%) | 89 (21.8%) |
| Wholesale Trade | 63 (75.9%) | 20 (24.1%) |
| Retail Trade | 382 (73.2%) | 140 (26.8%) |
| Transportation & Warehousing | 162 (98.8%) | 2 (1.2%) |
| Utilities | 57 (100.0%) | 0 (0.0%) |
| Information | 41 (51.9%) | 38 (48.1%) |
| Finance & Insurance | 47 (20.5%) | 182 (79.5%) |
| Real Estate, Rental & Leasing | 84 (88.4%) | 11 (11.6%) |
| Professional & Scientific | 175 (57.2%) | 131 (42.8%) |
| Enterprise Management | 0 (0.0%) | 0 (0.0%) |
| Administrative & Support | 191 (90.5%) | 20 (9.5%) |
| Educational Services | 73 (23.3%) | 241 (76.7%) |
| Health Care & Social Assistance | 80 (14.6%) | 468 (85.4%) |
| Arts, Entertainment & Recreation | 38 (52.0%) | 35 (47.9%) |
| Accommodation & Food Services | 118 (33.2%) | 237 (66.8%) |
| Public Administration | 88 (30.8%) | 198 (69.2%) |
| Total | 2,255 (53.8%) | 1,937 (46.2%) |
Education in Vinton
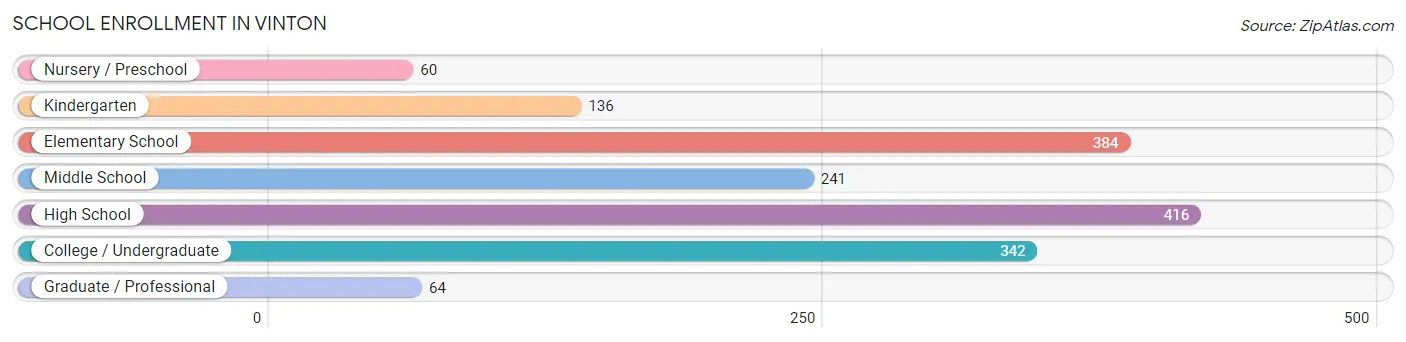
School Enrollment in Vinton
The most common levels of schooling among the 1,643 students in Vinton are high school (416 | 25.3%), elementary school (384 | 23.4%), and college / undergraduate (342 | 20.8%).
| School Level | # Students | % Students |
| Nursery / Preschool | 60 | 3.6% |
| Kindergarten | 136 | 8.3% |
| Elementary School | 384 | 23.4% |
| Middle School | 241 | 14.7% |
| High School | 416 | 25.3% |
| College / Undergraduate | 342 | 20.8% |
| Graduate / Professional | 64 | 3.9% |
| Total | 1,643 | 100.0% |
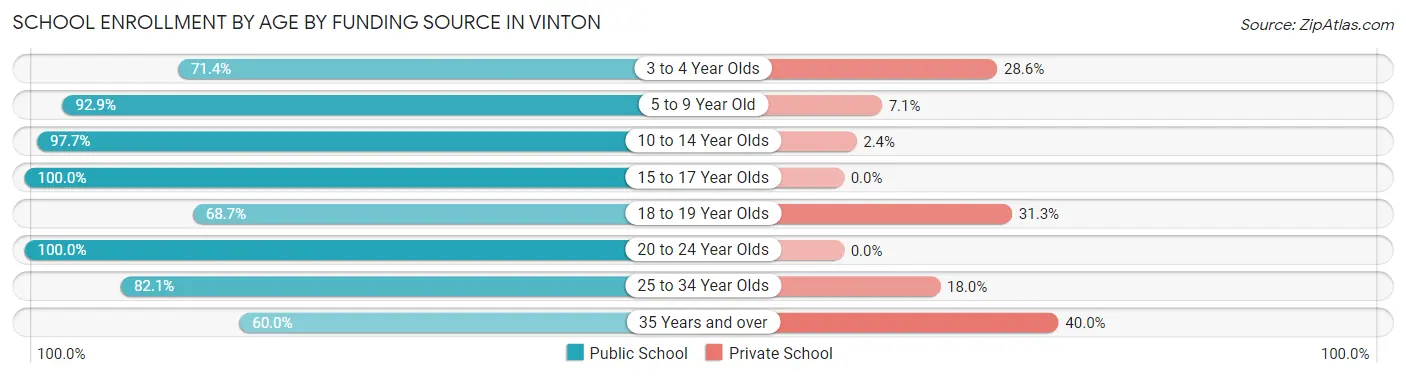
School Enrollment by Age by Funding Source in Vinton
Out of a total of 1,643 students who are enrolled in schools in Vinton, 104 (6.3%) attend a private institution, while the remaining 1,539 (93.7%) are enrolled in public schools. The age group of 35 years and over has the highest likelihood of being enrolled in private schools, with 16 (40.0% in the age bracket) enrolled. Conversely, the age group of 15 to 17 year olds has the lowest likelihood of being enrolled in a private school, with 419 (100.0% in the age bracket) attending a public institution.
| Age Bracket | Public School | Private School |
| 3 to 4 Year Olds | 30 (71.4%) | 12 (28.6%) |
| 5 to 9 Year Old | 420 (92.9%) | 32 (7.1%) |
| 10 to 14 Year Olds | 374 (97.7%) | 9 (2.4%) |
| 15 to 17 Year Olds | 419 (100.0%) | 0 (0.0%) |
| 18 to 19 Year Olds | 46 (68.7%) | 21 (31.3%) |
| 20 to 24 Year Olds | 162 (100.0%) | 0 (0.0%) |
| 25 to 34 Year Olds | 64 (82.1%) | 14 (17.9%) |
| 35 Years and over | 24 (60.0%) | 16 (40.0%) |
| Total | 1,539 (93.7%) | 104 (6.3%) |
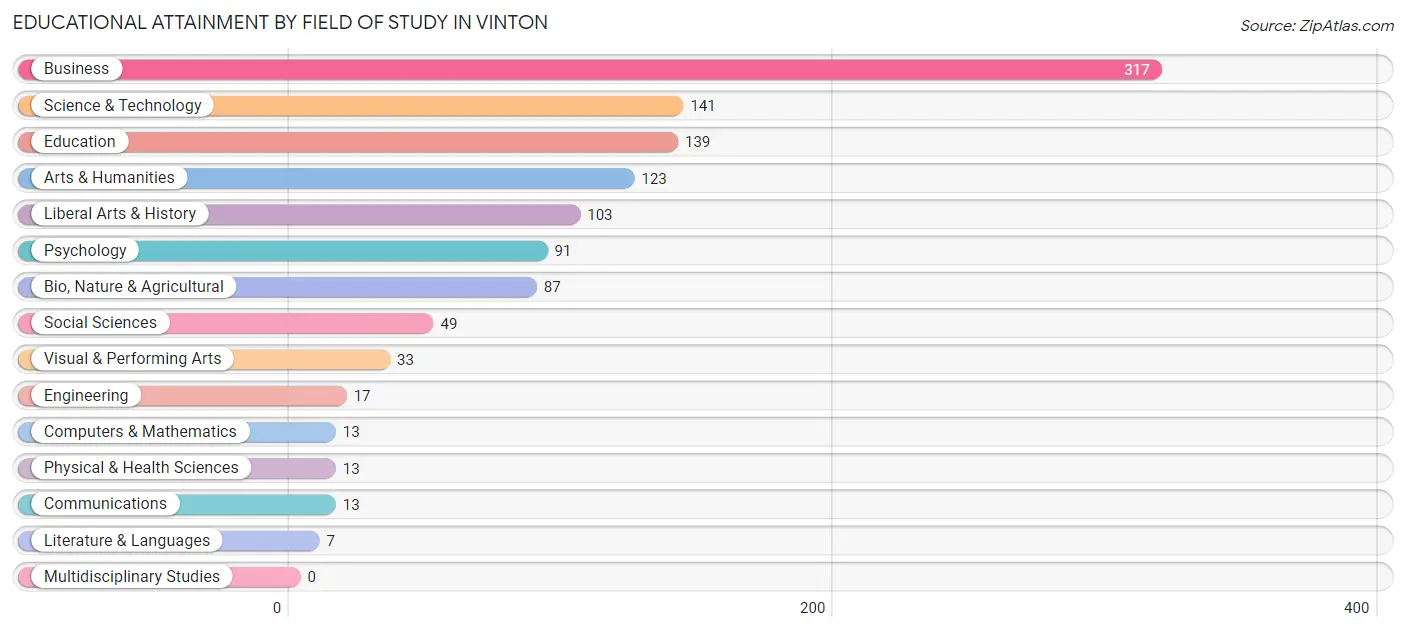
Educational Attainment by Field of Study in Vinton
Business (317 | 27.7%), science & technology (141 | 12.3%), education (139 | 12.1%), arts & humanities (123 | 10.7%), and liberal arts & history (103 | 9.0%) are the most common fields of study among 1,146 individuals in Vinton who have obtained a bachelor's degree or higher.
| Field of Study | # Graduates | % Graduates |
| Computers & Mathematics | 13 | 1.1% |
| Bio, Nature & Agricultural | 87 | 7.6% |
| Physical & Health Sciences | 13 | 1.1% |
| Psychology | 91 | 7.9% |
| Social Sciences | 49 | 4.3% |
| Engineering | 17 | 1.5% |
| Multidisciplinary Studies | 0 | 0.0% |
| Science & Technology | 141 | 12.3% |
| Business | 317 | 27.7% |
| Education | 139 | 12.1% |
| Literature & Languages | 7 | 0.6% |
| Liberal Arts & History | 103 | 9.0% |
| Visual & Performing Arts | 33 | 2.9% |
| Communications | 13 | 1.1% |
| Arts & Humanities | 123 | 10.7% |
| Total | 1,146 | 100.0% |
Transportation & Commute in Vinton
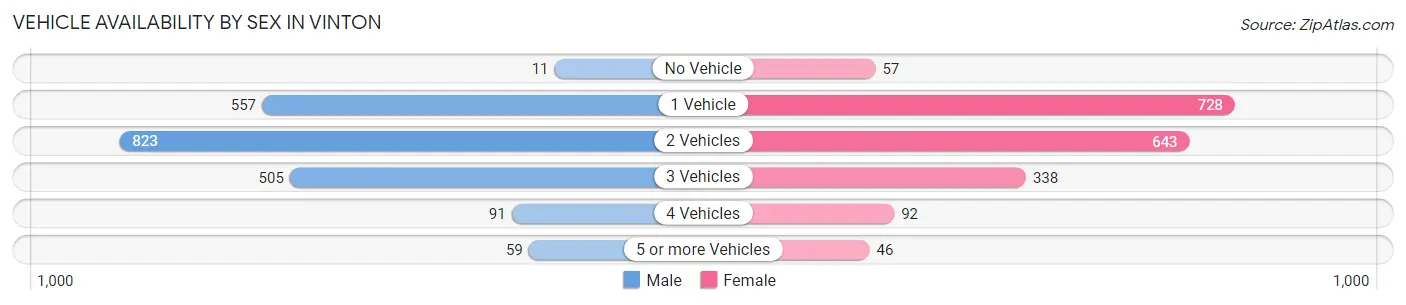
Vehicle Availability by Sex in Vinton
The most prevalent vehicle ownership categories in Vinton are males with 2 vehicles (823, accounting for 40.2%) and females with 2 vehicles (643, making up 43.2%).
| Vehicles Available | Male | Female |
| No Vehicle | 11 (0.5%) | 57 (3.0%) |
| 1 Vehicle | 557 (27.2%) | 728 (38.2%) |
| 2 Vehicles | 823 (40.2%) | 643 (33.8%) |
| 3 Vehicles | 505 (24.7%) | 338 (17.7%) |
| 4 Vehicles | 91 (4.4%) | 92 (4.8%) |
| 5 or more Vehicles | 59 (2.9%) | 46 (2.4%) |
| Total | 2,046 (100.0%) | 1,904 (100.0%) |
Commute Time in Vinton
The most frequently occuring commute durations in Vinton are 30 to 34 minutes (747 commuters, 21.2%), 15 to 19 minutes (730 commuters, 20.8%), and 20 to 24 minutes (648 commuters, 18.4%).
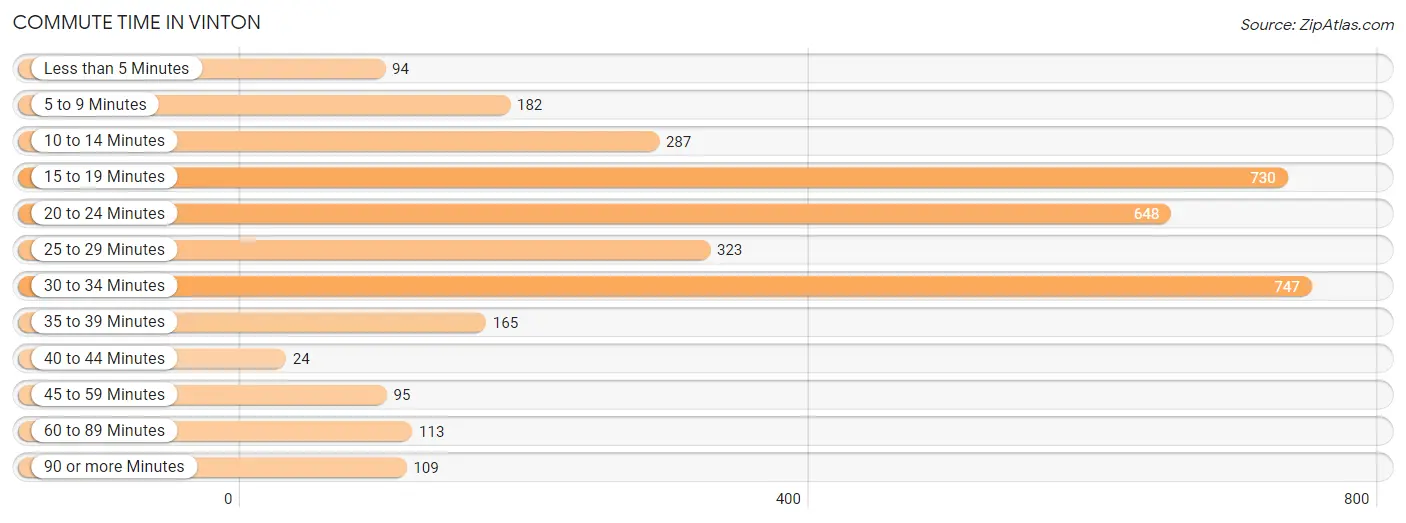
| Commute Time | # Commuters | % Commuters |
| Less than 5 Minutes | 94 | 2.7% |
| 5 to 9 Minutes | 182 | 5.2% |
| 10 to 14 Minutes | 287 | 8.2% |
| 15 to 19 Minutes | 730 | 20.8% |
| 20 to 24 Minutes | 648 | 18.4% |
| 25 to 29 Minutes | 323 | 9.2% |
| 30 to 34 Minutes | 747 | 21.2% |
| 35 to 39 Minutes | 165 | 4.7% |
| 40 to 44 Minutes | 24 | 0.7% |
| 45 to 59 Minutes | 95 | 2.7% |
| 60 to 89 Minutes | 113 | 3.2% |
| 90 or more Minutes | 109 | 3.1% |
Commute Time by Sex in Vinton
The most common commute times in Vinton are 15 to 19 minutes (498 commuters, 26.0%) for males and 30 to 34 minutes (381 commuters, 23.8%) for females.
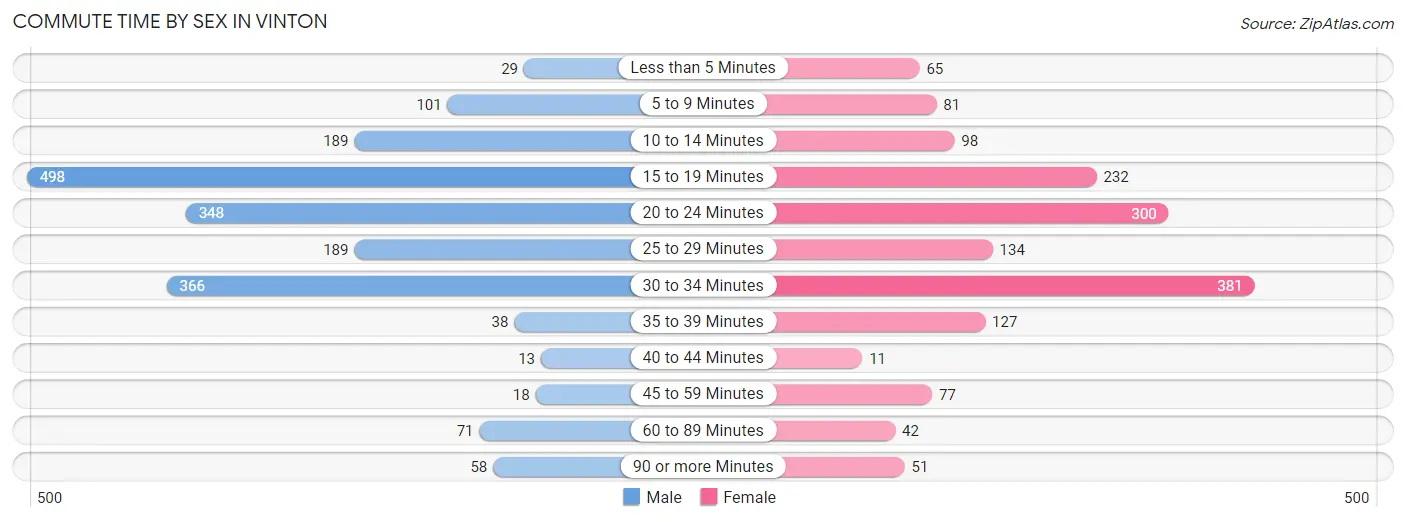
| Commute Time | Male | Female |
| Less than 5 Minutes | 29 (1.5%) | 65 (4.1%) |
| 5 to 9 Minutes | 101 (5.3%) | 81 (5.1%) |
| 10 to 14 Minutes | 189 (9.9%) | 98 (6.1%) |
| 15 to 19 Minutes | 498 (26.0%) | 232 (14.5%) |
| 20 to 24 Minutes | 348 (18.1%) | 300 (18.8%) |
| 25 to 29 Minutes | 189 (9.9%) | 134 (8.4%) |
| 30 to 34 Minutes | 366 (19.1%) | 381 (23.8%) |
| 35 to 39 Minutes | 38 (2.0%) | 127 (7.9%) |
| 40 to 44 Minutes | 13 (0.7%) | 11 (0.7%) |
| 45 to 59 Minutes | 18 (0.9%) | 77 (4.8%) |
| 60 to 89 Minutes | 71 (3.7%) | 42 (2.6%) |
| 90 or more Minutes | 58 (3.0%) | 51 (3.2%) |
Time of Departure to Work by Sex in Vinton
The most frequent times of departure to work in Vinton are 5:30 AM to 5:59 AM (329, 17.2%) for males and 7:00 AM to 7:29 AM (379, 23.7%) for females.
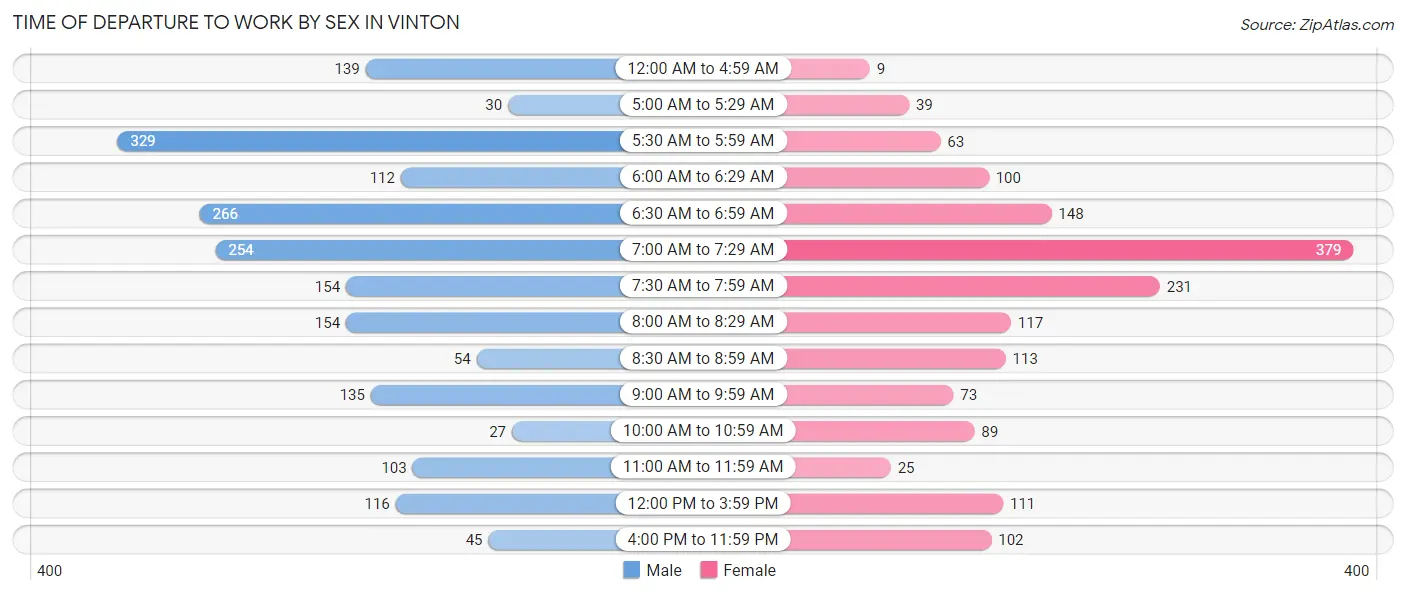
| Time of Departure | Male | Female |
| 12:00 AM to 4:59 AM | 139 (7.2%) | 9 (0.6%) |
| 5:00 AM to 5:29 AM | 30 (1.6%) | 39 (2.4%) |
| 5:30 AM to 5:59 AM | 329 (17.2%) | 63 (3.9%) |
| 6:00 AM to 6:29 AM | 112 (5.8%) | 100 (6.2%) |
| 6:30 AM to 6:59 AM | 266 (13.9%) | 148 (9.3%) |
| 7:00 AM to 7:29 AM | 254 (13.2%) | 379 (23.7%) |
| 7:30 AM to 7:59 AM | 154 (8.0%) | 231 (14.4%) |
| 8:00 AM to 8:29 AM | 154 (8.0%) | 117 (7.3%) |
| 8:30 AM to 8:59 AM | 54 (2.8%) | 113 (7.1%) |
| 9:00 AM to 9:59 AM | 135 (7.0%) | 73 (4.6%) |
| 10:00 AM to 10:59 AM | 27 (1.4%) | 89 (5.6%) |
| 11:00 AM to 11:59 AM | 103 (5.4%) | 25 (1.6%) |
| 12:00 PM to 3:59 PM | 116 (6.0%) | 111 (6.9%) |
| 4:00 PM to 11:59 PM | 45 (2.4%) | 102 (6.4%) |
| Total | 1,918 (100.0%) | 1,599 (100.0%) |
Housing Occupancy in Vinton
Occupancy by Ownership in Vinton
Of the total 3,686 dwellings in Vinton, owner-occupied units account for 2,081 (56.5%), while renter-occupied units make up 1,605 (43.5%).
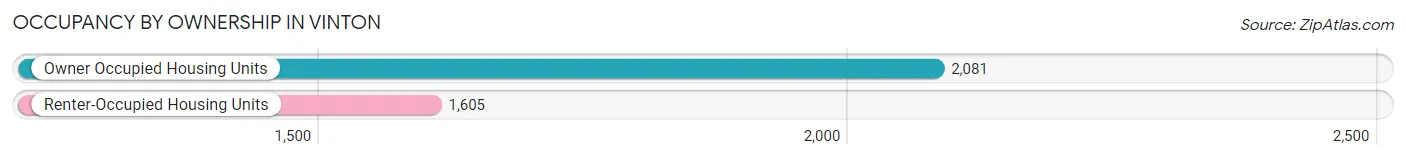
| Occupancy | # Housing Units | % Housing Units |
| Owner Occupied Housing Units | 2,081 | 56.5% |
| Renter-Occupied Housing Units | 1,605 | 43.5% |
| Total Occupied Housing Units | 3,686 | 100.0% |
Occupancy by Household Size in Vinton
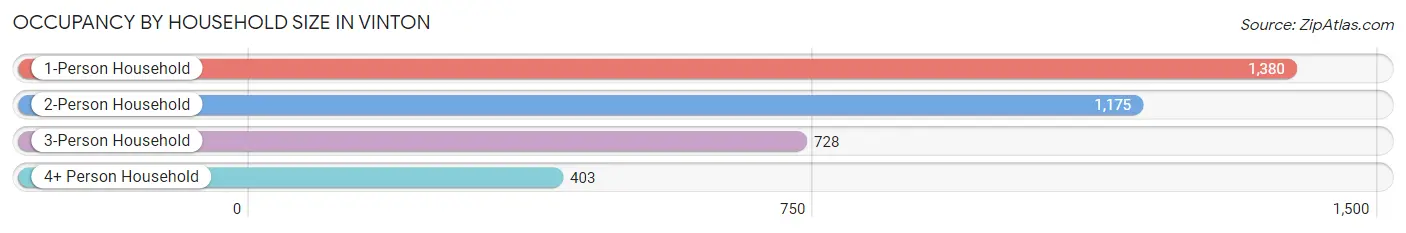
| Household Size | # Housing Units | % Housing Units |
| 1-Person Household | 1,380 | 37.4% |
| 2-Person Household | 1,175 | 31.9% |
| 3-Person Household | 728 | 19.8% |
| 4+ Person Household | 403 | 10.9% |
| Total Housing Units | 3,686 | 100.0% |
Occupancy by Ownership by Household Size in Vinton
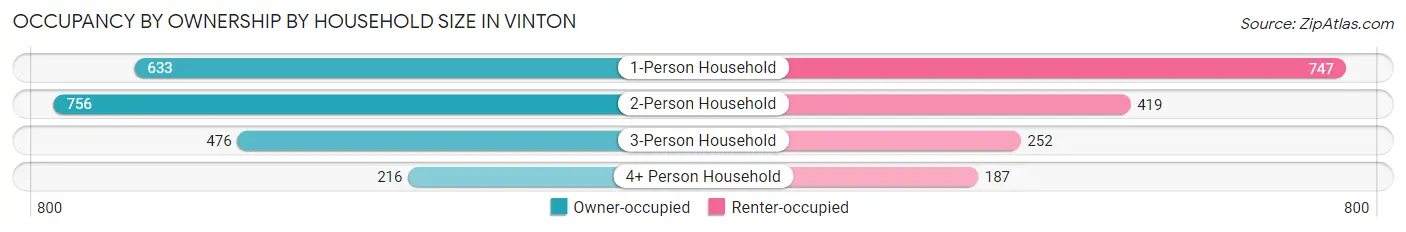
| Household Size | Owner-occupied | Renter-occupied |
| 1-Person Household | 633 (45.9%) | 747 (54.1%) |
| 2-Person Household | 756 (64.3%) | 419 (35.7%) |
| 3-Person Household | 476 (65.4%) | 252 (34.6%) |
| 4+ Person Household | 216 (53.6%) | 187 (46.4%) |
| Total Housing Units | 2,081 (56.5%) | 1,605 (43.5%) |
Occupancy by Educational Attainment in Vinton
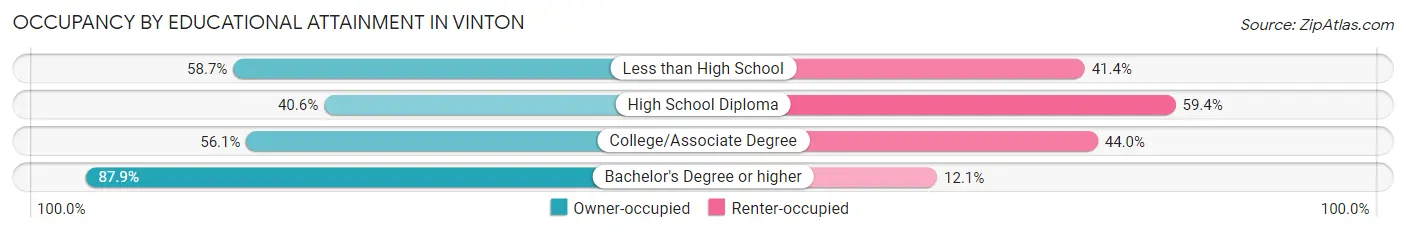
| Household Size | Owner-occupied | Renter-occupied |
| Less than High School | 312 (58.7%) | 220 (41.3%) |
| High School Diploma | 519 (40.6%) | 758 (59.4%) |
| College/Associate Degree | 704 (56.0%) | 552 (44.0%) |
| Bachelor's Degree or higher | 546 (87.9%) | 75 (12.1%) |
Occupancy by Age of Householder in Vinton
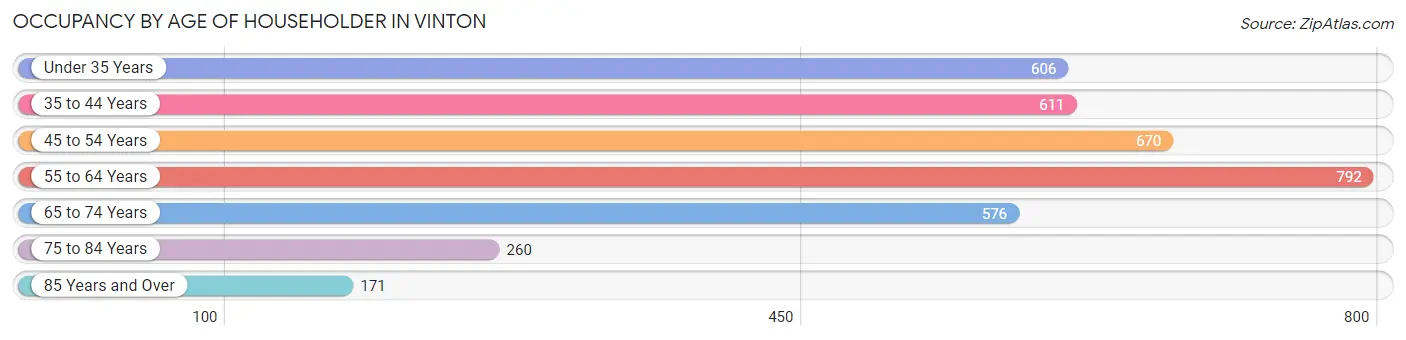
| Age Bracket | # Households | % Households |
| Under 35 Years | 606 | 16.4% |
| 35 to 44 Years | 611 | 16.6% |
| 45 to 54 Years | 670 | 18.2% |
| 55 to 64 Years | 792 | 21.5% |
| 65 to 74 Years | 576 | 15.6% |
| 75 to 84 Years | 260 | 7.0% |
| 85 Years and Over | 171 | 4.6% |
| Total | 3,686 | 100.0% |
Housing Finances in Vinton
Median Income by Occupancy in Vinton
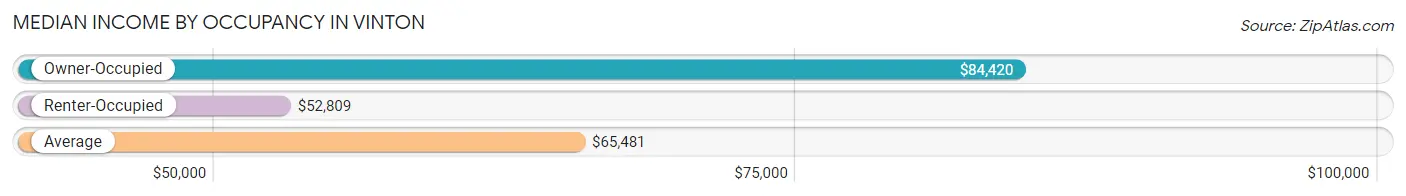
| Occupancy Type | # Households | Median Income |
| Owner-Occupied | 2,081 (56.5%) | $84,420 |
| Renter-Occupied | 1,605 (43.5%) | $52,809 |
| Average | 3,686 (100.0%) | $65,481 |
Occupancy by Householder Income Bracket in Vinton
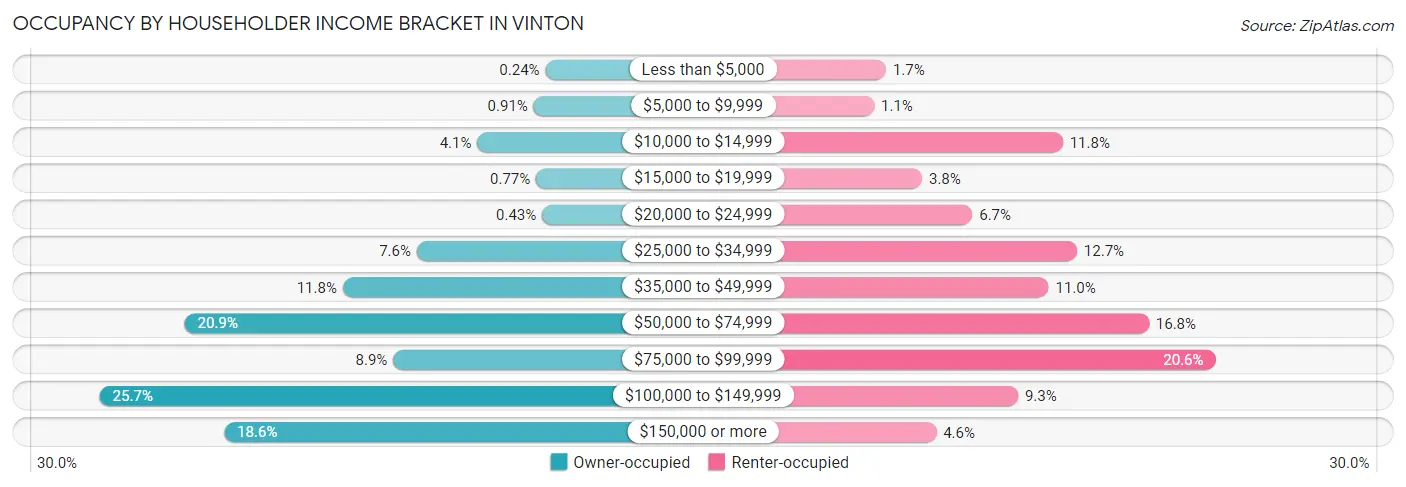
| Income Bracket | Owner-occupied | Renter-occupied |
| Less than $5,000 | 5 (0.2%) | 28 (1.7%) |
| $5,000 to $9,999 | 19 (0.9%) | 17 (1.1%) |
| $10,000 to $14,999 | 86 (4.1%) | 190 (11.8%) |
| $15,000 to $19,999 | 16 (0.8%) | 61 (3.8%) |
| $20,000 to $24,999 | 9 (0.4%) | 107 (6.7%) |
| $25,000 to $34,999 | 158 (7.6%) | 203 (12.7%) |
| $35,000 to $49,999 | 246 (11.8%) | 177 (11.0%) |
| $50,000 to $74,999 | 434 (20.9%) | 269 (16.8%) |
| $75,000 to $99,999 | 186 (8.9%) | 330 (20.6%) |
| $100,000 to $149,999 | 535 (25.7%) | 149 (9.3%) |
| $150,000 or more | 387 (18.6%) | 74 (4.6%) |
| Total | 2,081 (100.0%) | 1,605 (100.0%) |
Monthly Housing Cost Tiers in Vinton
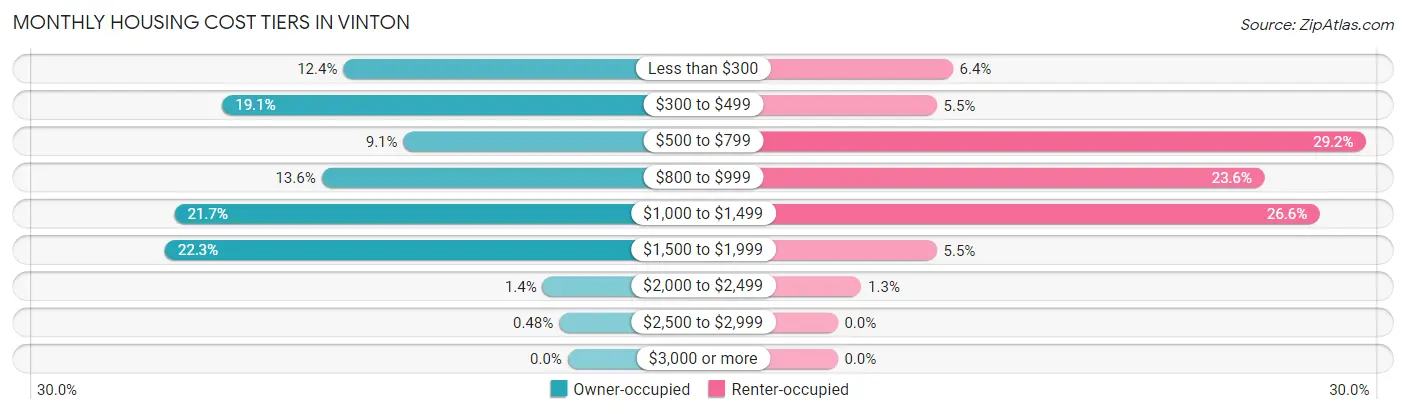
| Monthly Cost | Owner-occupied | Renter-occupied |
| Less than $300 | 258 (12.4%) | 102 (6.4%) |
| $300 to $499 | 397 (19.1%) | 88 (5.5%) |
| $500 to $799 | 189 (9.1%) | 468 (29.2%) |
| $800 to $999 | 283 (13.6%) | 378 (23.5%) |
| $1,000 to $1,499 | 452 (21.7%) | 427 (26.6%) |
| $1,500 to $1,999 | 463 (22.3%) | 88 (5.5%) |
| $2,000 to $2,499 | 29 (1.4%) | 21 (1.3%) |
| $2,500 to $2,999 | 10 (0.5%) | 0 (0.0%) |
| $3,000 or more | 0 (0.0%) | 0 (0.0%) |
| Total | 2,081 (100.0%) | 1,605 (100.0%) |
Physical Housing Characteristics in Vinton
Housing Structures in Vinton
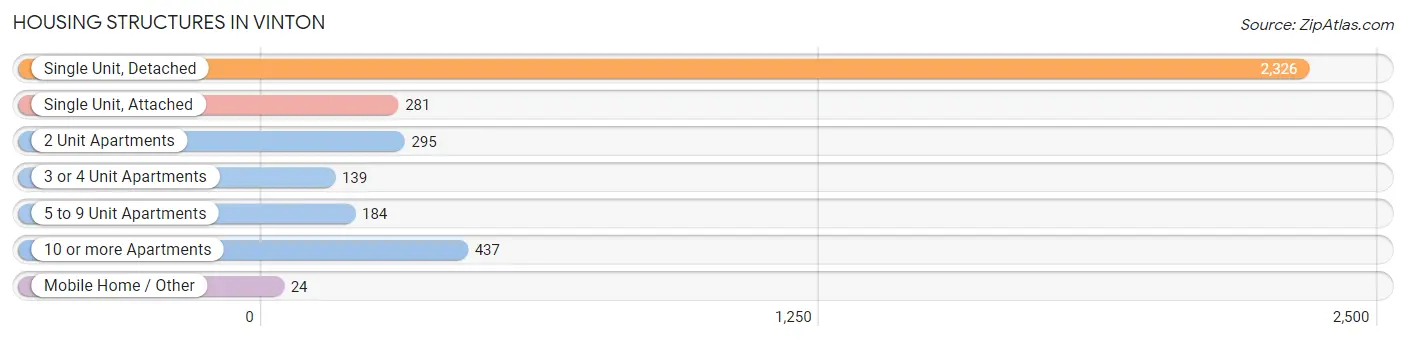
| Structure Type | # Housing Units | % Housing Units |
| Single Unit, Detached | 2,326 | 63.1% |
| Single Unit, Attached | 281 | 7.6% |
| 2 Unit Apartments | 295 | 8.0% |
| 3 or 4 Unit Apartments | 139 | 3.8% |
| 5 to 9 Unit Apartments | 184 | 5.0% |
| 10 or more Apartments | 437 | 11.9% |
| Mobile Home / Other | 24 | 0.6% |
| Total | 3,686 | 100.0% |
Housing Structures by Occupancy in Vinton
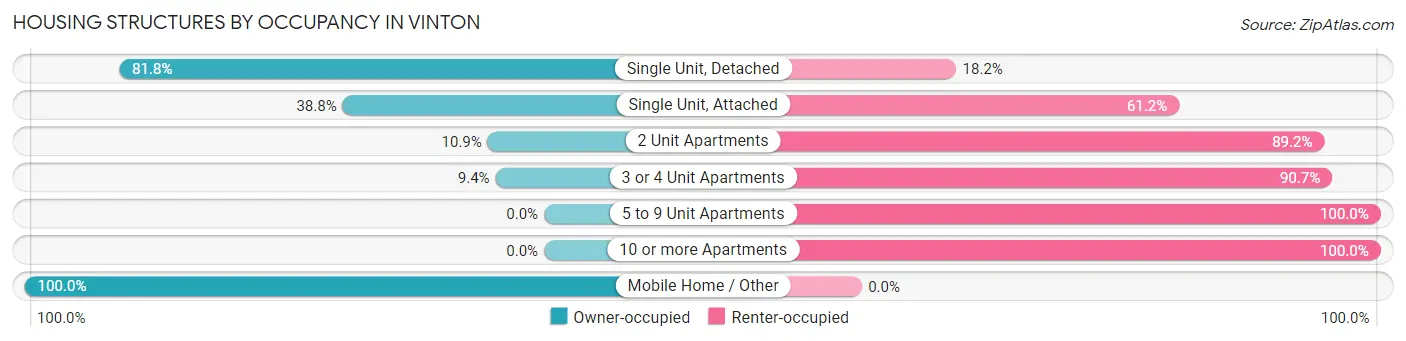
| Structure Type | Owner-occupied | Renter-occupied |
| Single Unit, Detached | 1,903 (81.8%) | 423 (18.2%) |
| Single Unit, Attached | 109 (38.8%) | 172 (61.2%) |
| 2 Unit Apartments | 32 (10.8%) | 263 (89.1%) |
| 3 or 4 Unit Apartments | 13 (9.3%) | 126 (90.6%) |
| 5 to 9 Unit Apartments | 0 (0.0%) | 184 (100.0%) |
| 10 or more Apartments | 0 (0.0%) | 437 (100.0%) |
| Mobile Home / Other | 24 (100.0%) | 0 (0.0%) |
| Total | 2,081 (56.5%) | 1,605 (43.5%) |
Housing Structures by Number of Rooms in Vinton
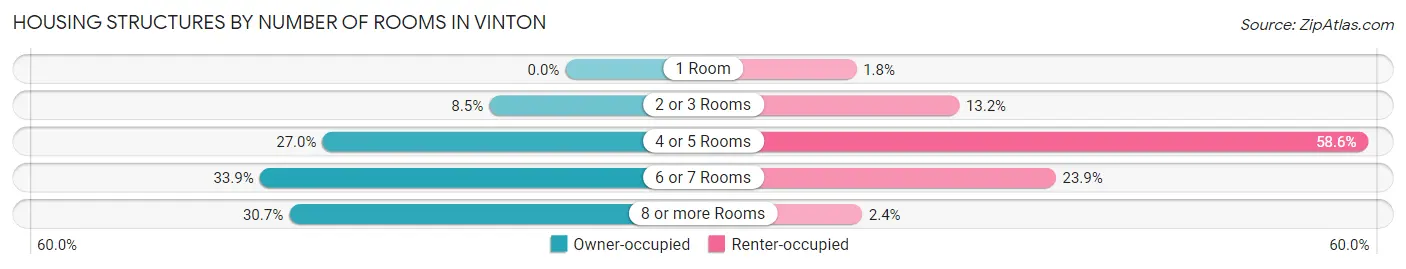
| Number of Rooms | Owner-occupied | Renter-occupied |
| 1 Room | 0 (0.0%) | 29 (1.8%) |
| 2 or 3 Rooms | 176 (8.5%) | 212 (13.2%) |
| 4 or 5 Rooms | 561 (27.0%) | 941 (58.6%) |
| 6 or 7 Rooms | 706 (33.9%) | 384 (23.9%) |
| 8 or more Rooms | 638 (30.7%) | 39 (2.4%) |
| Total | 2,081 (100.0%) | 1,605 (100.0%) |
Housing Structure by Heating Type in Vinton
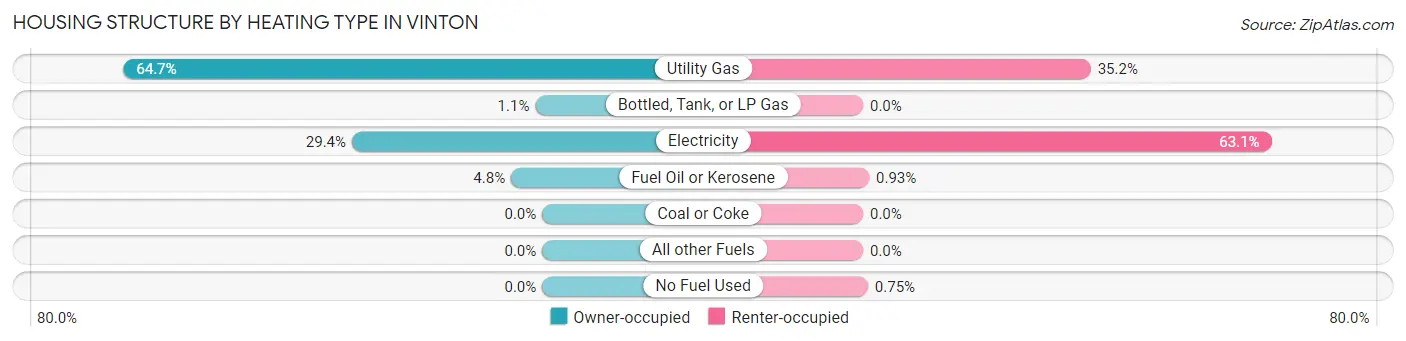
| Heating Type | Owner-occupied | Renter-occupied |
| Utility Gas | 1,347 (64.7%) | 565 (35.2%) |
| Bottled, Tank, or LP Gas | 22 (1.1%) | 0 (0.0%) |
| Electricity | 612 (29.4%) | 1,013 (63.1%) |
| Fuel Oil or Kerosene | 100 (4.8%) | 15 (0.9%) |
| Coal or Coke | 0 (0.0%) | 0 (0.0%) |
| All other Fuels | 0 (0.0%) | 0 (0.0%) |
| No Fuel Used | 0 (0.0%) | 12 (0.7%) |
| Total | 2,081 (100.0%) | 1,605 (100.0%) |
Household Vehicle Usage in Vinton
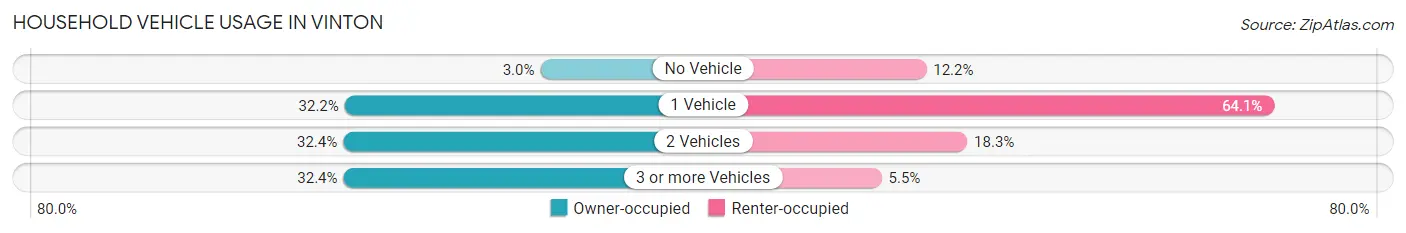
| Vehicles per Household | Owner-occupied | Renter-occupied |
| No Vehicle | 62 (3.0%) | 195 (12.1%) |
| 1 Vehicle | 670 (32.2%) | 1,029 (64.1%) |
| 2 Vehicles | 675 (32.4%) | 293 (18.3%) |
| 3 or more Vehicles | 674 (32.4%) | 88 (5.5%) |
| Total | 2,081 (100.0%) | 1,605 (100.0%) |
Real Estate & Mortgages in Vinton
Real Estate and Mortgage Overview in Vinton
| Characteristic | Without Mortgage | With Mortgage |
| Housing Units | 685 | 1,396 |
| Median Property Value | $157,400 | $185,400 |
| Median Household Income | $49,375 | $374 |
| Monthly Housing Costs | $352 | $0 |
| Real Estate Taxes | $1,297 | $4 |
Property Value by Mortgage Status in Vinton
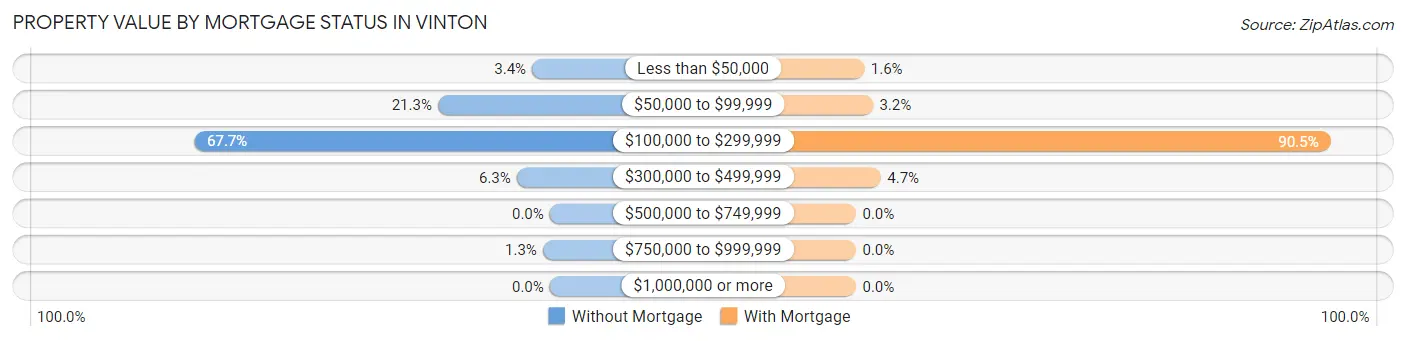
| Property Value | Without Mortgage | With Mortgage |
| Less than $50,000 | 23 (3.4%) | 22 (1.6%) |
| $50,000 to $99,999 | 146 (21.3%) | 45 (3.2%) |
| $100,000 to $299,999 | 464 (67.7%) | 1,263 (90.5%) |
| $300,000 to $499,999 | 43 (6.3%) | 66 (4.7%) |
| $500,000 to $749,999 | 0 (0.0%) | 0 (0.0%) |
| $750,000 to $999,999 | 9 (1.3%) | 0 (0.0%) |
| $1,000,000 or more | 0 (0.0%) | 0 (0.0%) |
| Total | 685 (100.0%) | 1,396 (100.0%) |
Household Income by Mortgage Status in Vinton
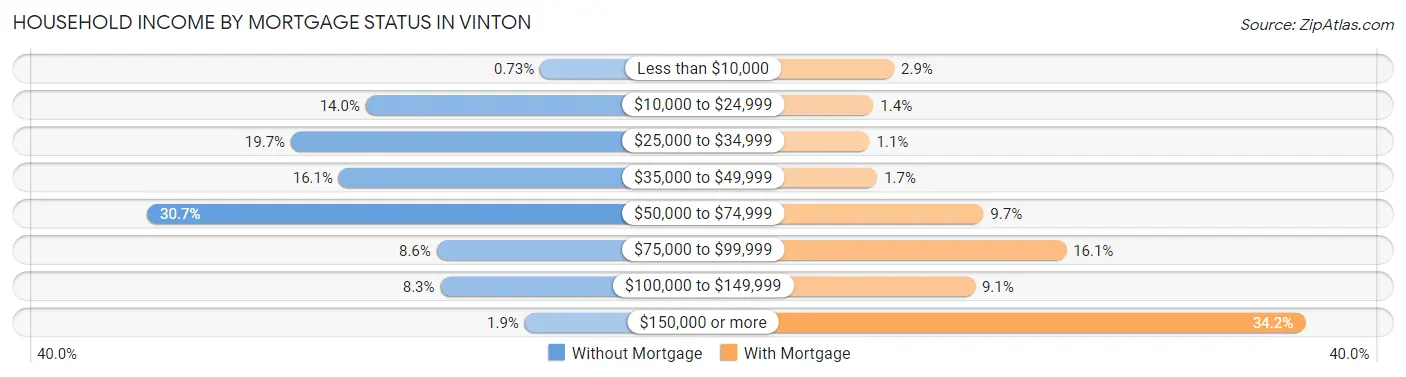
| Household Income | Without Mortgage | With Mortgage |
| Less than $10,000 | 5 (0.7%) | 41 (2.9%) |
| $10,000 to $24,999 | 96 (14.0%) | 19 (1.4%) |
| $25,000 to $34,999 | 135 (19.7%) | 15 (1.1%) |
| $35,000 to $49,999 | 110 (16.1%) | 23 (1.7%) |
| $50,000 to $74,999 | 210 (30.7%) | 136 (9.7%) |
| $75,000 to $99,999 | 59 (8.6%) | 224 (16.1%) |
| $100,000 to $149,999 | 57 (8.3%) | 127 (9.1%) |
| $150,000 or more | 13 (1.9%) | 478 (34.2%) |
| Total | 685 (100.0%) | 1,396 (100.0%) |
Property Value to Household Income Ratio in Vinton
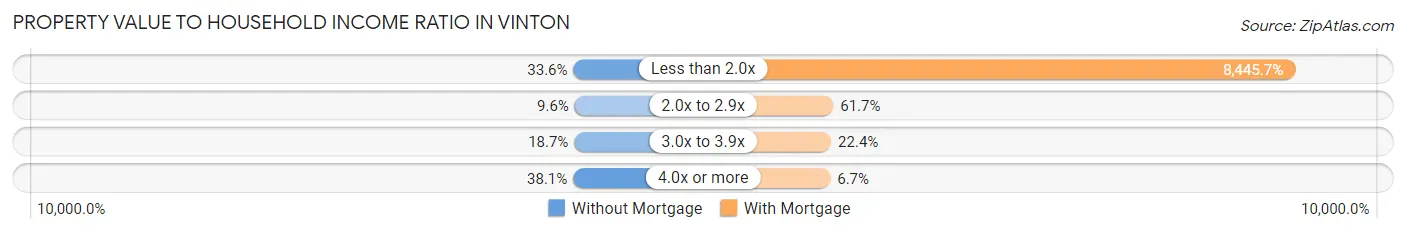
| Value-to-Income Ratio | Without Mortgage | With Mortgage |
| Less than 2.0x | 230 (33.6%) | 117,902 (8,445.7%) |
| 2.0x to 2.9x | 66 (9.6%) | 861 (61.7%) |
| 3.0x to 3.9x | 128 (18.7%) | 313 (22.4%) |
| 4.0x or more | 261 (38.1%) | 93 (6.7%) |
| Total | 685 (100.0%) | 1,396 (100.0%) |
Real Estate Taxes by Mortgage Status in Vinton
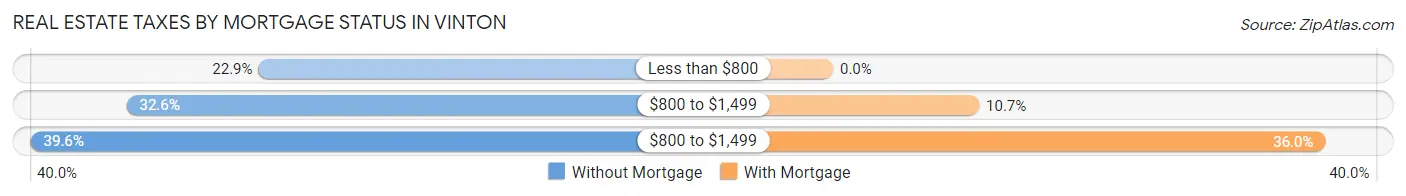
| Property Taxes | Without Mortgage | With Mortgage |
| Less than $800 | 157 (22.9%) | 0 (0.0%) |
| $800 to $1,499 | 223 (32.6%) | 149 (10.7%) |
| $800 to $1,499 | 271 (39.6%) | 502 (36.0%) |
| Total | 685 (100.0%) | 1,396 (100.0%) |
Health & Disability in Vinton
Health Insurance Coverage by Age in Vinton
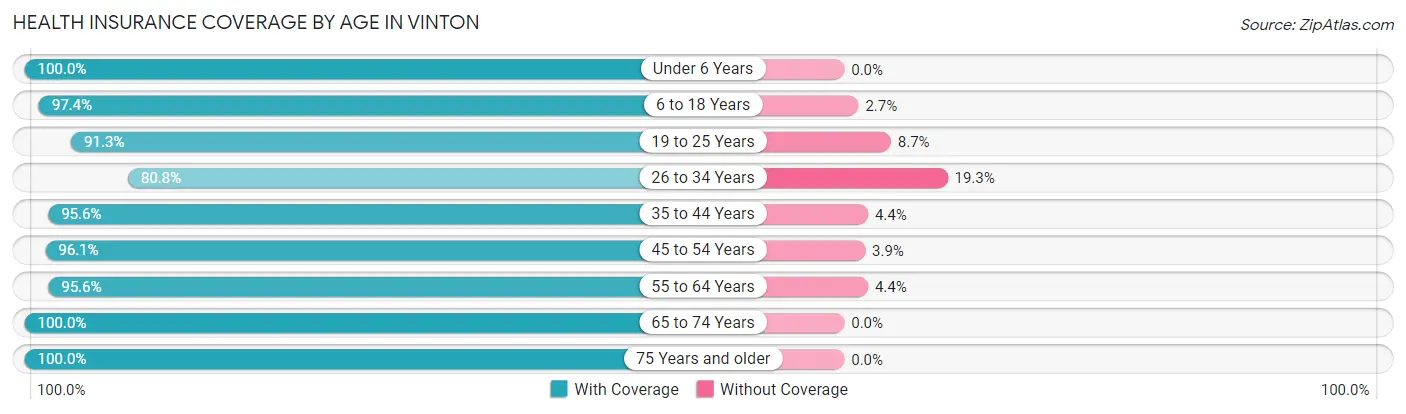
| Age Bracket | With Coverage | Without Coverage |
| Under 6 Years | 506 (100.0%) | 0 (0.0%) |
| 6 to 18 Years | 1,213 (97.4%) | 33 (2.6%) |
| 19 to 25 Years | 610 (91.3%) | 58 (8.7%) |
| 26 to 34 Years | 839 (80.7%) | 200 (19.3%) |
| 35 to 44 Years | 845 (95.6%) | 39 (4.4%) |
| 45 to 54 Years | 893 (96.1%) | 36 (3.9%) |
| 55 to 64 Years | 1,147 (95.6%) | 53 (4.4%) |
| 65 to 74 Years | 828 (100.0%) | 0 (0.0%) |
| 75 Years and older | 546 (100.0%) | 0 (0.0%) |
| Total | 7,427 (94.7%) | 419 (5.3%) |
Health Insurance Coverage by Citizenship Status in Vinton
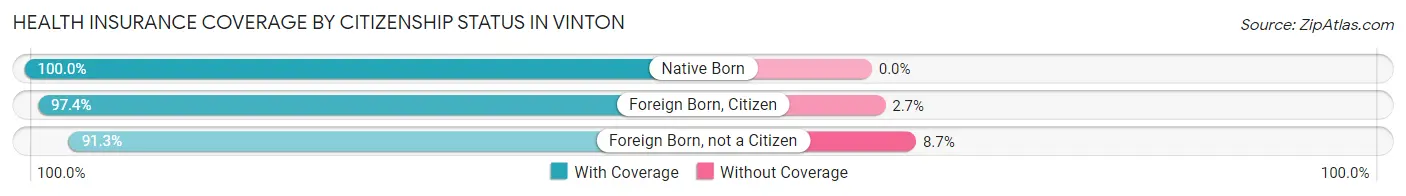
| Citizenship Status | With Coverage | Without Coverage |
| Native Born | 506 (100.0%) | 0 (0.0%) |
| Foreign Born, Citizen | 1,213 (97.4%) | 33 (2.6%) |
| Foreign Born, not a Citizen | 610 (91.3%) | 58 (8.7%) |
Health Insurance Coverage by Household Income in Vinton
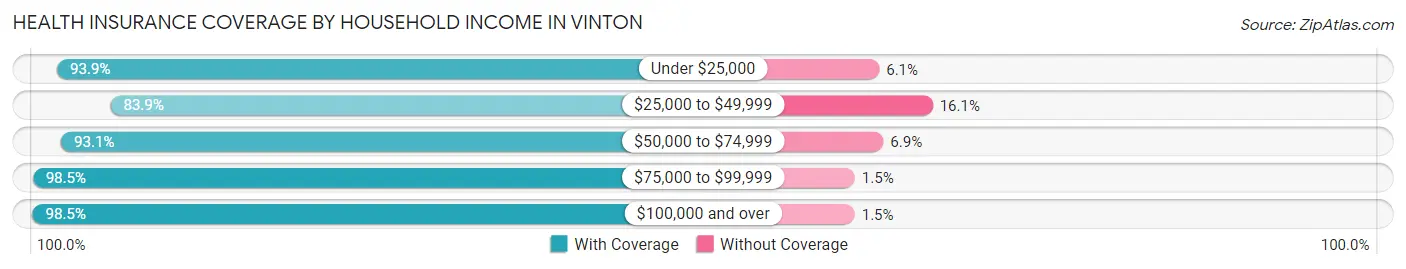
| Household Income | With Coverage | Without Coverage |
| Under $25,000 | 709 (93.9%) | 46 (6.1%) |
| $25,000 to $49,999 | 1,110 (83.9%) | 213 (16.1%) |
| $50,000 to $74,999 | 1,277 (93.1%) | 94 (6.9%) |
| $75,000 to $99,999 | 1,105 (98.5%) | 17 (1.5%) |
| $100,000 and over | 3,226 (98.5%) | 49 (1.5%) |
Public vs Private Health Insurance Coverage by Age in Vinton
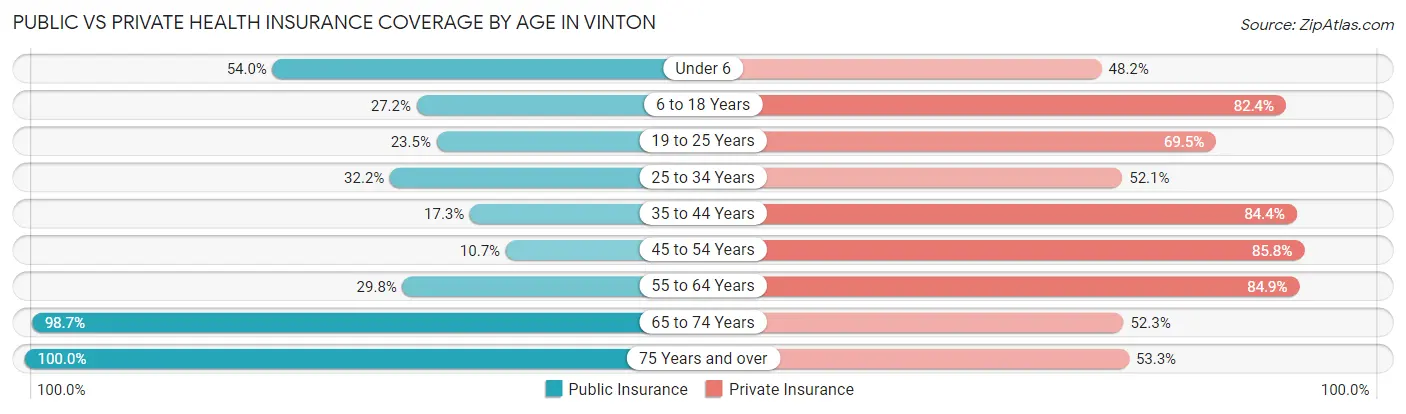
| Age Bracket | Public Insurance | Private Insurance |
| Under 6 | 273 (53.9%) | 244 (48.2%) |
| 6 to 18 Years | 339 (27.2%) | 1,027 (82.4%) |
| 19 to 25 Years | 157 (23.5%) | 464 (69.5%) |
| 25 to 34 Years | 334 (32.2%) | 541 (52.1%) |
| 35 to 44 Years | 153 (17.3%) | 746 (84.4%) |
| 45 to 54 Years | 99 (10.7%) | 797 (85.8%) |
| 55 to 64 Years | 358 (29.8%) | 1,019 (84.9%) |
| 65 to 74 Years | 817 (98.7%) | 433 (52.3%) |
| 75 Years and over | 546 (100.0%) | 291 (53.3%) |
| Total | 3,076 (39.2%) | 5,562 (70.9%) |
Disability Status by Sex by Age in Vinton
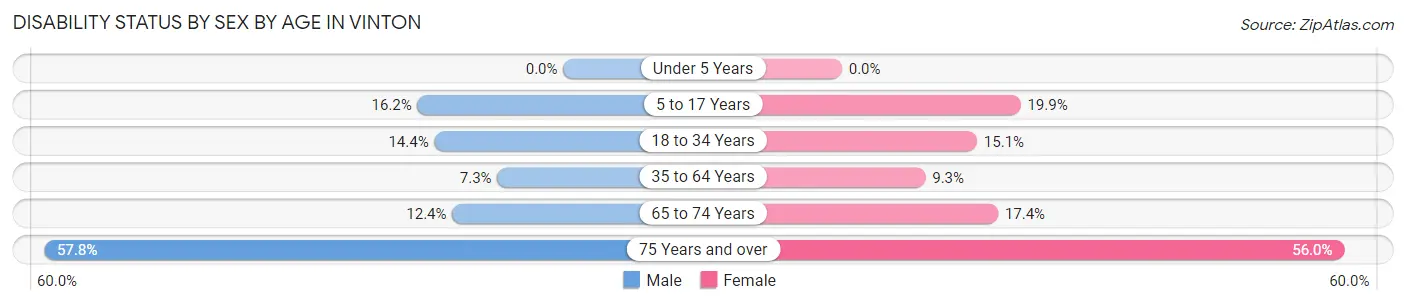
| Age Bracket | Male | Female |
| Under 5 Years | 0 (0.0%) | 0 (0.0%) |
| 5 to 17 Years | 87 (16.2%) | 155 (19.9%) |
| 18 to 34 Years | 161 (14.3%) | 98 (15.0%) |
| 35 to 64 Years | 91 (7.3%) | 165 (9.3%) |
| 65 to 74 Years | 54 (12.4%) | 68 (17.4%) |
| 75 Years and over | 107 (57.8%) | 202 (56.0%) |
Disability Class by Sex by Age in Vinton
Disability Class: Hearing Difficulty
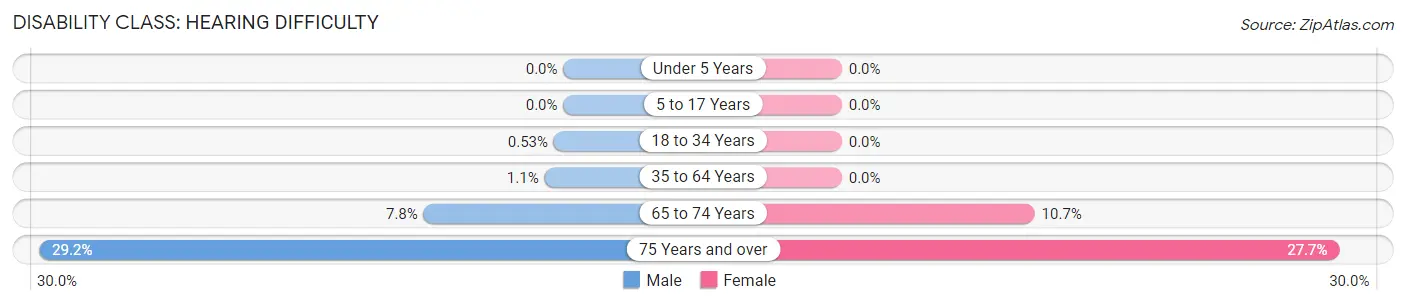
| Age Bracket | Male | Female |
| Under 5 Years | 0 (0.0%) | 0 (0.0%) |
| 5 to 17 Years | 0 (0.0%) | 0 (0.0%) |
| 18 to 34 Years | 6 (0.5%) | 0 (0.0%) |
| 35 to 64 Years | 13 (1.1%) | 0 (0.0%) |
| 65 to 74 Years | 34 (7.8%) | 42 (10.7%) |
| 75 Years and over | 54 (29.2%) | 100 (27.7%) |
Disability Class: Vision Difficulty
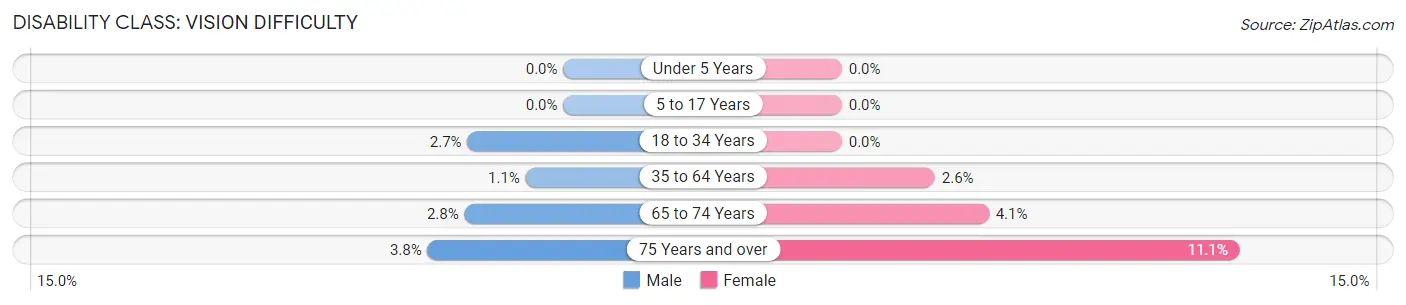
| Age Bracket | Male | Female |
| Under 5 Years | 0 (0.0%) | 0 (0.0%) |
| 5 to 17 Years | 0 (0.0%) | 0 (0.0%) |
| 18 to 34 Years | 30 (2.7%) | 0 (0.0%) |
| 35 to 64 Years | 13 (1.1%) | 46 (2.6%) |
| 65 to 74 Years | 12 (2.8%) | 16 (4.1%) |
| 75 Years and over | 7 (3.8%) | 40 (11.1%) |
Disability Class: Cognitive Difficulty
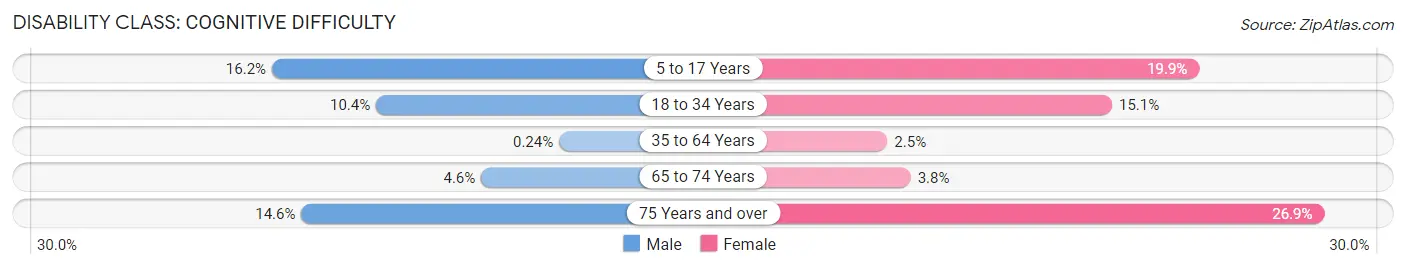
| Age Bracket | Male | Female |
| 5 to 17 Years | 87 (16.2%) | 155 (19.9%) |
| 18 to 34 Years | 117 (10.4%) | 98 (15.0%) |
| 35 to 64 Years | 3 (0.2%) | 45 (2.5%) |
| 65 to 74 Years | 20 (4.6%) | 15 (3.8%) |
| 75 Years and over | 27 (14.6%) | 97 (26.9%) |
Disability Class: Ambulatory Difficulty
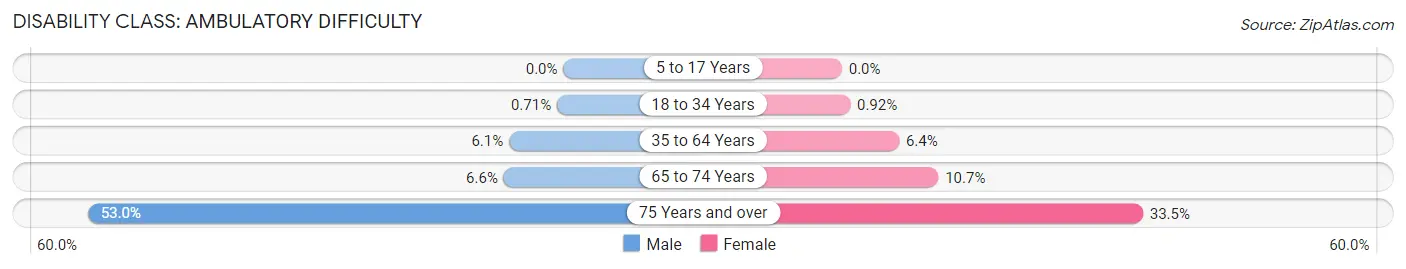
| Age Bracket | Male | Female |
| 5 to 17 Years | 0 (0.0%) | 0 (0.0%) |
| 18 to 34 Years | 8 (0.7%) | 6 (0.9%) |
| 35 to 64 Years | 75 (6.0%) | 113 (6.4%) |
| 65 to 74 Years | 29 (6.6%) | 42 (10.7%) |
| 75 Years and over | 98 (53.0%) | 121 (33.5%) |
Disability Class: Self-Care Difficulty
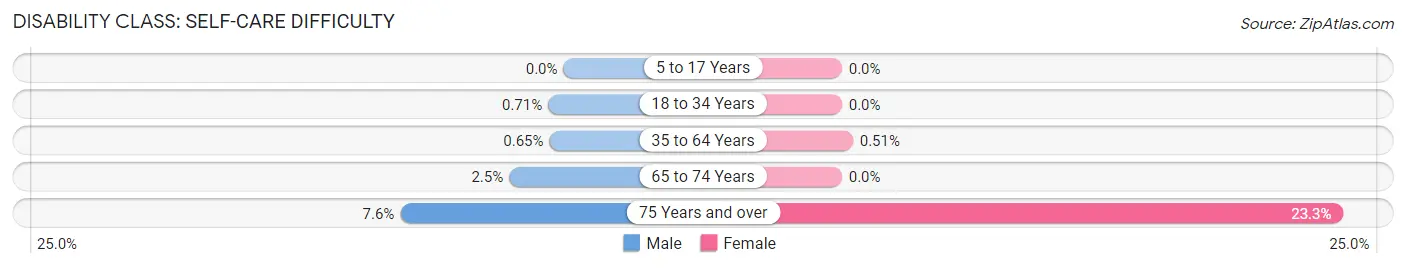
| Age Bracket | Male | Female |
| 5 to 17 Years | 0 (0.0%) | 0 (0.0%) |
| 18 to 34 Years | 8 (0.7%) | 0 (0.0%) |
| 35 to 64 Years | 8 (0.6%) | 9 (0.5%) |
| 65 to 74 Years | 11 (2.5%) | 0 (0.0%) |
| 75 Years and over | 14 (7.6%) | 84 (23.3%) |
Technology Access in Vinton
Computing Device Access in Vinton
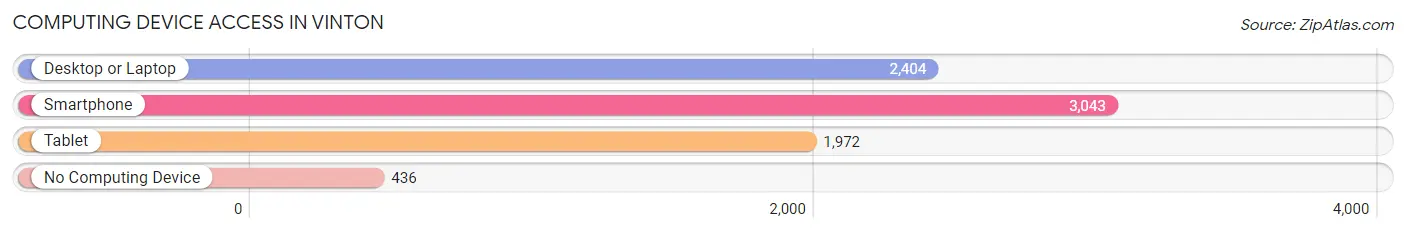
| Device Type | # Households | % Households |
| Desktop or Laptop | 2,404 | 65.2% |
| Smartphone | 3,043 | 82.6% |
| Tablet | 1,972 | 53.5% |
| No Computing Device | 436 | 11.8% |
| Total | 3,686 | 100.0% |
Internet Access in Vinton
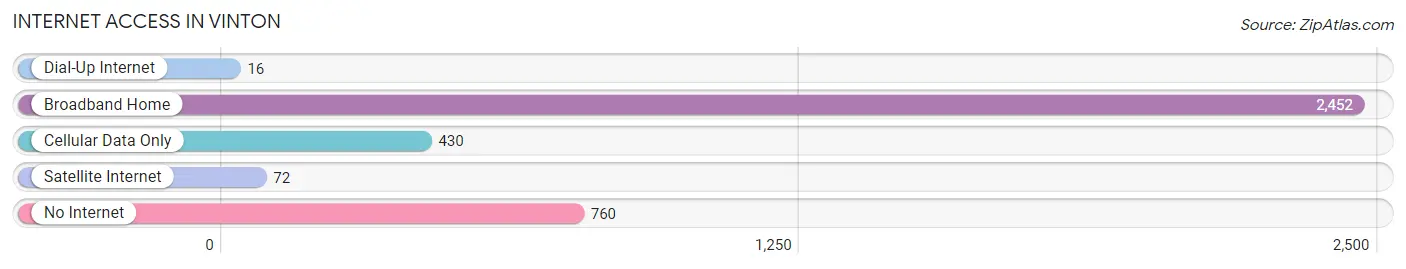
| Internet Type | # Households | % Households |
| Dial-Up Internet | 16 | 0.4% |
| Broadband Home | 2,452 | 66.5% |
| Cellular Data Only | 430 | 11.7% |
| Satellite Internet | 72 | 1.9% |
| No Internet | 760 | 20.6% |
| Total | 3,686 | 100.0% |
Vinton Summary
Vinton, Virginia is a small town located in Roanoke County, Virginia. It is situated in the Roanoke Valley, which is part of the larger Roanoke Region. The town is located at the intersection of US Route 460 and US Route 24, and is approximately 10 miles west of Roanoke. The town has a population of 8,098 as of the 2010 census.
Geography
Vinton is located in the Roanoke Valley, which is part of the larger Roanoke Region. The town is situated at the intersection of US Route 460 and US Route 24, and is approximately 10 miles west of Roanoke. The town is located in the Blue Ridge Mountains, and is surrounded by the Blue Ridge Parkway, the Appalachian Trail, and the George Washington and Jefferson National Forests. The town is located at an elevation of 1,845 feet above sea level.
The town is located in a humid subtropical climate zone, with hot, humid summers and mild winters. The average annual temperature is 57.2 degrees Fahrenheit, with an average high of 79.2 degrees Fahrenheit in July and an average low of 35.2 degrees Fahrenheit in January. The average annual precipitation is 43.2 inches, with an average of 4.2 inches of snowfall per year.
History
Vinton was founded in 1882 by the Vinton family, who had moved to the area from Pennsylvania. The town was originally known as Vintonville, and was incorporated in 1884. The town was named after the Vinton family, who were prominent in the area.
The town grew rapidly in the late 19th and early 20th centuries, and was home to several industries, including a cotton mill, a furniture factory, and a brickyard. The town was also home to several churches, schools, and a library.
The town was home to several notable people, including the first African-American mayor of Roanoke County, William E. Vinton, who served from 1966 to 1970.
Economy
The economy of Vinton is largely based on the service industry, with many businesses providing services to the surrounding area. The town is home to several restaurants, retail stores, and other businesses. The town is also home to several manufacturing companies, including a furniture factory and a brickyard.
The town is also home to several educational institutions, including the Roanoke County Public Schools, the Roanoke Valley Community College, and the Virginia Western Community College.
Demographics
As of the 2010 census, the population of Vinton was 8,098. The racial makeup of the town was 87.3% White, 8.2% African American, 0.5% Native American, 0.7% Asian, 0.1% Pacific Islander, 1.2% from other races, and 2.1% from two or more races. Hispanic or Latino of any race were 3.2% of the population.
The median household income in Vinton was $41,945, and the median family income was $50,945. The per capita income was $20,945. About 11.2% of the population was below the poverty line.
Conclusion
Vinton, Virginia is a small town located in Roanoke County, Virginia. It is situated in the Roanoke Valley, which is part of the larger Roanoke Region. The town is located at the intersection of US Route 460 and US Route 24, and is approximately 10 miles west of Roanoke. The town has a population of 8,098 as of the 2010 census. The economy of Vinton is largely based on the service industry, with many businesses providing services to the surrounding area. The racial makeup of the town was 87.3% White, 8.2% African American, 0.5% Native American, 0.7% Asian, 0.1% Pacific Islander, 1.2% from other races, and 2.1% from two or more races. The median household income in Vinton was $41,945, and the median family income was $50,945. The per capita income was $20,945. About 11.2% of the population was below the poverty line. Vinton is a small town with a rich history and a diverse population.
Common Questions
What is Per Capita Income in Vinton?
Per Capita income in Vinton is $39,914.
What is the Median Family Income in Vinton?
Median Family Income in Vinton is $89,599.
What is the Median Household income in Vinton?
Median Household Income in Vinton is $65,481.
What is Income or Wage Gap in Vinton?
Income or Wage Gap in Vinton is 9.8%.
Women in Vinton earn 90.2 cents for every dollar earned by a man.
What is Inequality or Gini Index in Vinton?
Inequality or Gini Index in Vinton is 0.41.
What is the Total Population of Vinton?
Total Population of Vinton is 8,045.
What is the Total Male Population of Vinton?
Total Male Population of Vinton is 3,813.
What is the Total Female Population of Vinton?
Total Female Population of Vinton is 4,232.
What is the Ratio of Males per 100 Females in Vinton?
There are 90.10 Males per 100 Females in Vinton.
What is the Ratio of Females per 100 Males in Vinton?
There are 110.99 Females per 100 Males in Vinton.
What is the Median Population Age in Vinton?
Median Population Age in Vinton is 41.1 Years.
What is the Average Family Size in Vinton
Average Family Size in Vinton is 2.7 People.
What is the Average Household Size in Vinton
Average Household Size in Vinton is 2.1 People.
How Large is the Labor Force in Vinton?
There are 4,276 People in the Labor Forcein in Vinton.
What is the Percentage of People in the Labor Force in Vinton?
65.3% of People are in the Labor Force in Vinton.
What is the Unemployment Rate in Vinton?
Unemployment Rate in Vinton is 2.0%.