Lakeside, VA Map & Demographics
Lakeside Map
Lakeside Overview
$36,158
PER CAPITA INCOME
$76,314
AVG FAMILY INCOME
$64,912
AVG HOUSEHOLD INCOME
12.2%
WAGE / INCOME GAP [ % ]
87.8¢/ $1
WAGE / INCOME GAP [ $ ]
0.39
INEQUALITY / GINI INDEX
12,124
TOTAL POPULATION
5,895
MALE POPULATION
6,229
FEMALE POPULATION
94.64
MALES / 100 FEMALES
105.67
FEMALES / 100 MALES
37.7
MEDIAN AGE
2.9
AVG FAMILY SIZE
2.3
AVG HOUSEHOLD SIZE
6,953
LABOR FORCE [ PEOPLE ]
70.4%
PERCENT IN LABOR FORCE
2.1%
UNEMPLOYMENT RATE
Income in Lakeside
Income Overview in Lakeside
Per Capita Income in Lakeside is $36,158, while median incomes of families and households are $76,314 and $64,912 respectively.
| Characteristic | Number | Measure |
| Per Capita Income | 12,124 | $36,158 |
| Median Family Income | 3,091 | $76,314 |
| Mean Family Income | 3,091 | $89,883 |
| Median Household Income | 5,345 | $64,912 |
| Mean Household Income | 5,345 | $79,184 |
| Income Deficit | 3,091 | $0 |
| Wage / Income Gap (%) | 12,124 | 12.18% |
| Wage / Income Gap ($) | 12,124 | 87.82¢ per $1 |
| Gini / Inequality Index | 12,124 | 0.39 |
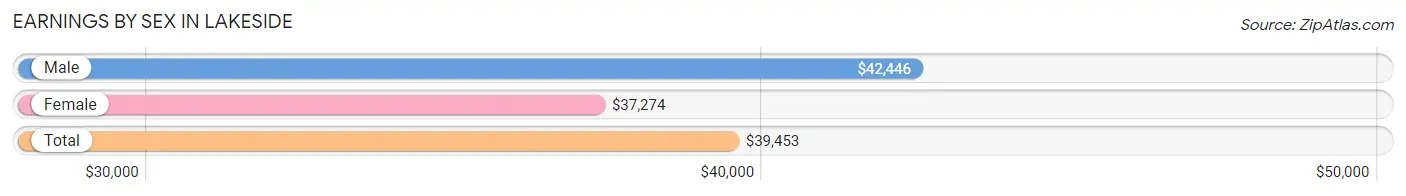
Earnings by Sex in Lakeside
Average Earnings in Lakeside are $39,453, $42,446 for men and $37,274 for women, a difference of 12.2%.
| Sex | Number | Average Earnings |
| Male | 3,479 (48.0%) | $42,446 |
| Female | 3,771 (52.0%) | $37,274 |
| Total | 7,250 (100.0%) | $39,453 |
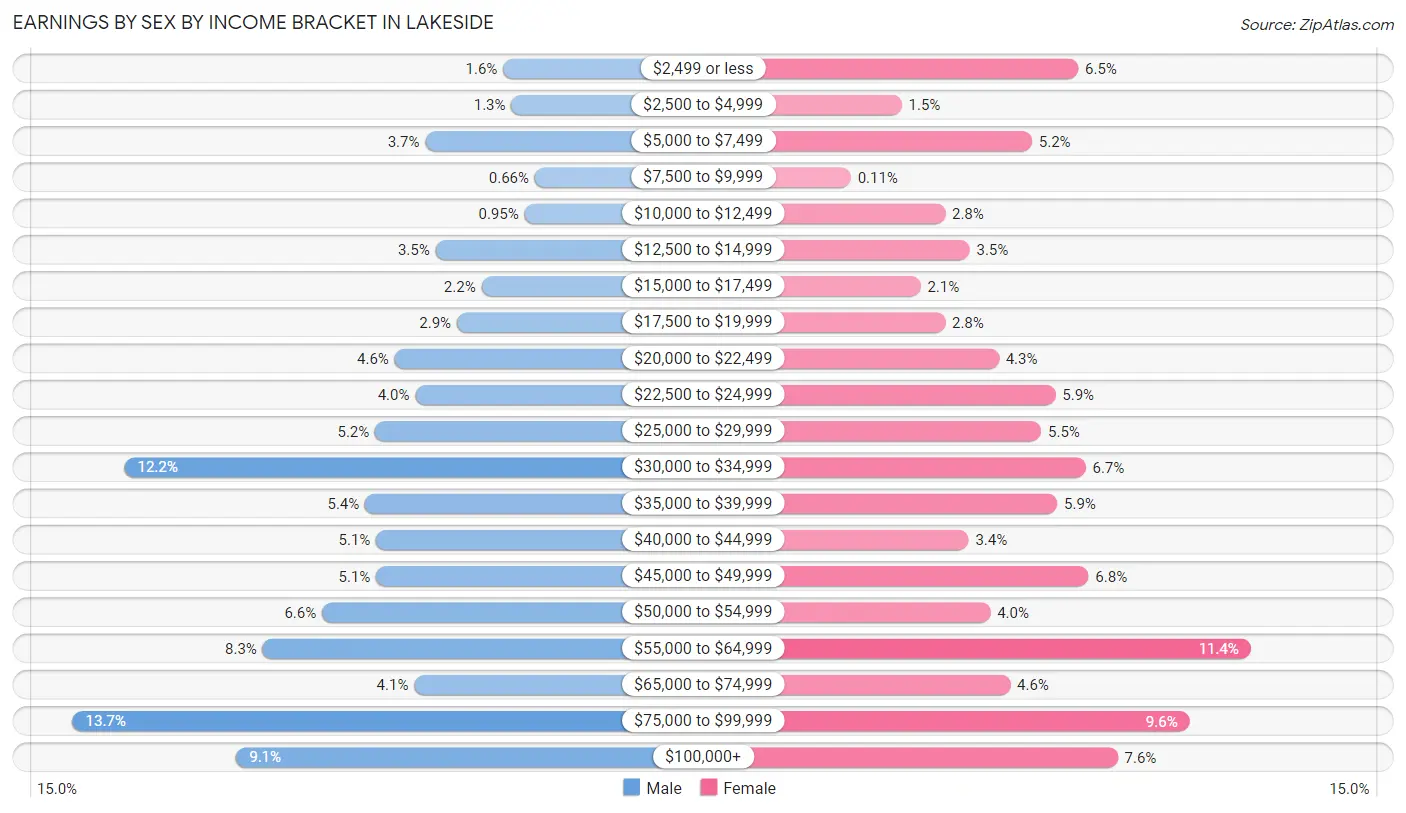
Earnings by Sex by Income Bracket in Lakeside
The most common earnings brackets in Lakeside are $75,000 to $99,999 for men (475 | 13.7%) and $55,000 to $64,999 for women (428 | 11.4%).
| Income | Male | Female |
| $2,499 or less | 54 (1.5%) | 245 (6.5%) |
| $2,500 to $4,999 | 46 (1.3%) | 58 (1.5%) |
| $5,000 to $7,499 | 130 (3.7%) | 196 (5.2%) |
| $7,500 to $9,999 | 23 (0.7%) | 4 (0.1%) |
| $10,000 to $12,499 | 33 (0.9%) | 104 (2.8%) |
| $12,500 to $14,999 | 120 (3.5%) | 130 (3.5%) |
| $15,000 to $17,499 | 75 (2.2%) | 78 (2.1%) |
| $17,500 to $19,999 | 99 (2.9%) | 104 (2.8%) |
| $20,000 to $22,499 | 160 (4.6%) | 161 (4.3%) |
| $22,500 to $24,999 | 140 (4.0%) | 221 (5.9%) |
| $25,000 to $29,999 | 179 (5.1%) | 206 (5.5%) |
| $30,000 to $34,999 | 424 (12.2%) | 253 (6.7%) |
| $35,000 to $39,999 | 189 (5.4%) | 223 (5.9%) |
| $40,000 to $44,999 | 178 (5.1%) | 129 (3.4%) |
| $45,000 to $49,999 | 178 (5.1%) | 256 (6.8%) |
| $50,000 to $54,999 | 231 (6.6%) | 152 (4.0%) |
| $55,000 to $64,999 | 289 (8.3%) | 428 (11.4%) |
| $65,000 to $74,999 | 141 (4.1%) | 173 (4.6%) |
| $75,000 to $99,999 | 475 (13.7%) | 363 (9.6%) |
| $100,000+ | 315 (9.0%) | 287 (7.6%) |
| Total | 3,479 (100.0%) | 3,771 (100.0%) |
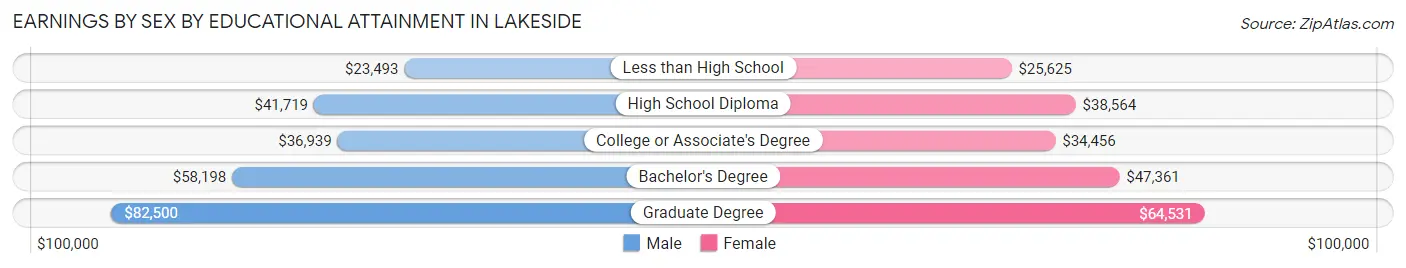
Earnings by Sex by Educational Attainment in Lakeside
Average earnings in Lakeside are $44,633 for men and $45,074 for women, a difference of 1.0%. Men with an educational attainment of graduate degree enjoy the highest average annual earnings of $82,500, while those with less than high school education earn the least with $23,493. Women with an educational attainment of graduate degree earn the most with the average annual earnings of $64,531, while those with less than high school education have the smallest earnings of $25,625.
| Educational Attainment | Male Income | Female Income |
| Less than High School | $23,493 | $25,625 |
| High School Diploma | $41,719 | $38,564 |
| College or Associate's Degree | $36,939 | $34,456 |
| Bachelor's Degree | $58,198 | $47,361 |
| Graduate Degree | $82,500 | $64,531 |
| Total | $44,633 | $45,074 |
Family Income in Lakeside
Family Income Brackets in Lakeside
According to the Lakeside family income data, there are 699 families falling into the $100,000 to $149,999 income range, which is the most common income bracket and makes up 22.6% of all families. Conversely, the less than $10,000 income bracket is the least frequent group with only 43 families (1.4%) belonging to this category.
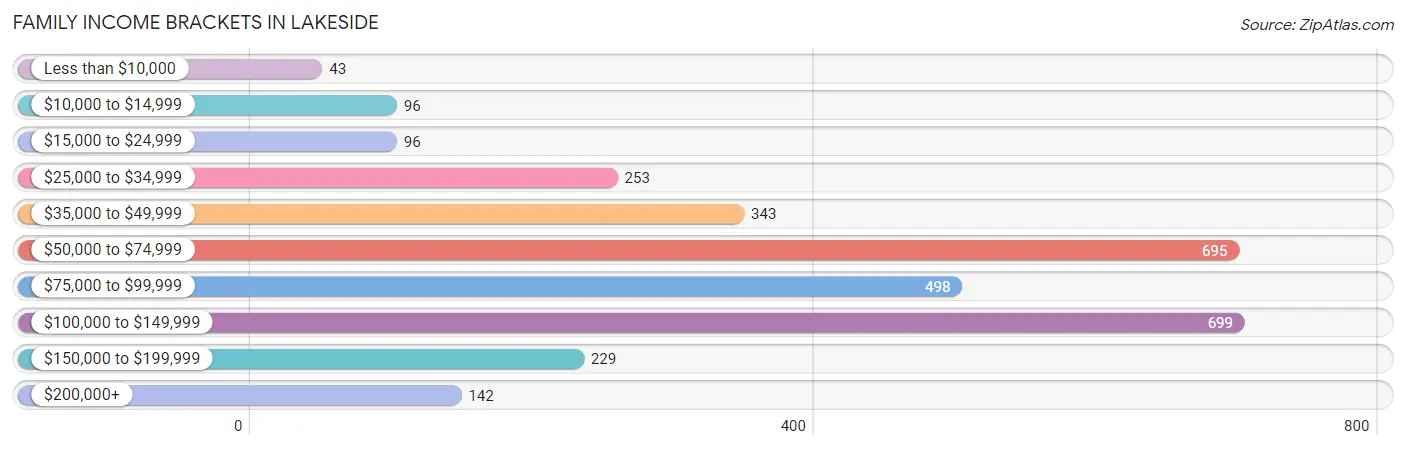
| Income Bracket | # Families | % Families |
| Less than $10,000 | 43 | 1.4% |
| $10,000 to $14,999 | 96 | 3.1% |
| $15,000 to $24,999 | 96 | 3.1% |
| $25,000 to $34,999 | 253 | 8.2% |
| $35,000 to $49,999 | 343 | 11.1% |
| $50,000 to $74,999 | 695 | 22.5% |
| $75,000 to $99,999 | 498 | 16.1% |
| $100,000 to $149,999 | 699 | 22.6% |
| $150,000 to $199,999 | 229 | 7.4% |
| $200,000+ | 142 | 4.6% |
Family Income by Famaliy Size in Lakeside
5-person families (128 | 4.1%) account for the highest median family income in Lakeside with $110,455 per family, while 2-person families (1,630 | 52.7%) have the highest median income of $34,896 per family member.
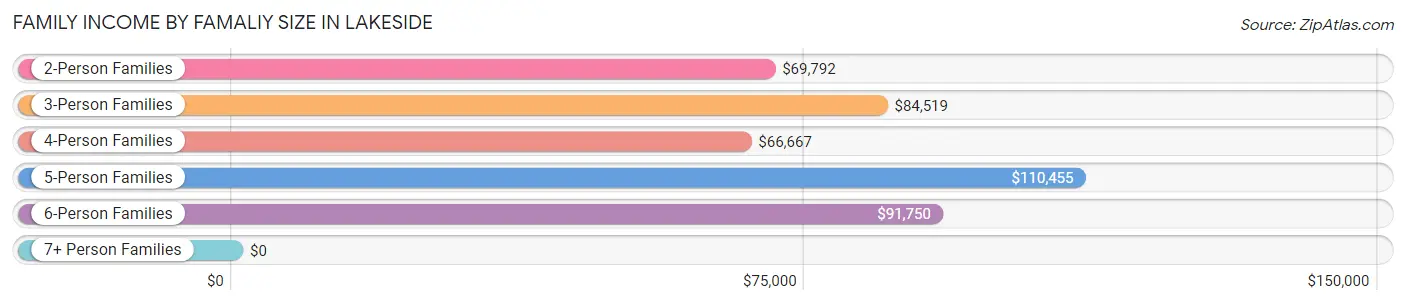
| Income Bracket | # Families | Median Income |
| 2-Person Families | 1,630 (52.7%) | $69,792 |
| 3-Person Families | 901 (29.1%) | $84,519 |
| 4-Person Families | 354 (11.5%) | $66,667 |
| 5-Person Families | 128 (4.1%) | $110,455 |
| 6-Person Families | 55 (1.8%) | $91,750 |
| 7+ Person Families | 23 (0.7%) | $0 |
| Total | 3,091 (100.0%) | $76,314 |
Family Income by Number of Earners in Lakeside
The median family income in Lakeside is $76,314, with families comprising 3+ earners (265) having the highest median family income of $128,393, while families with 1 earner (1,003) have the lowest median family income of $54,424, accounting for 8.6% and 32.5% of families, respectively.
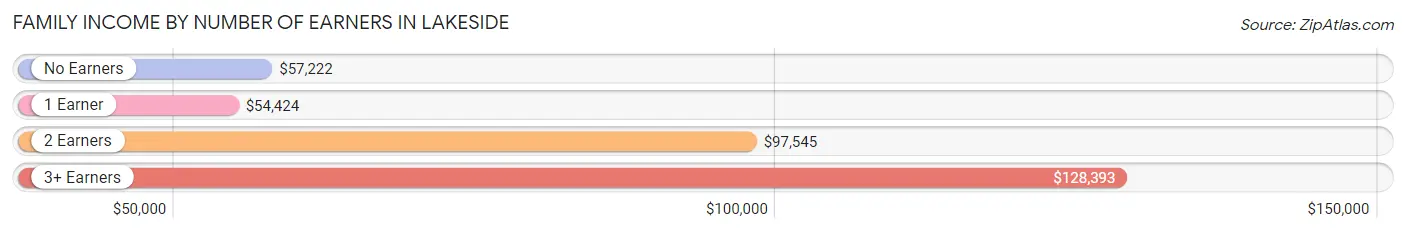
| Number of Earners | # Families | Median Income |
| No Earners | 394 (12.8%) | $57,222 |
| 1 Earner | 1,003 (32.5%) | $54,424 |
| 2 Earners | 1,429 (46.2%) | $97,545 |
| 3+ Earners | 265 (8.6%) | $128,393 |
| Total | 3,091 (100.0%) | $76,314 |
Household Income in Lakeside
Household Income Brackets in Lakeside
With 1,128 households falling in the category, the $50,000 to $74,999 income range is the most frequent in Lakeside, accounting for 21.1% of all households. In contrast, only 214 households (4.0%) fall into the less than $10,000 income bracket, making it the least populous group.
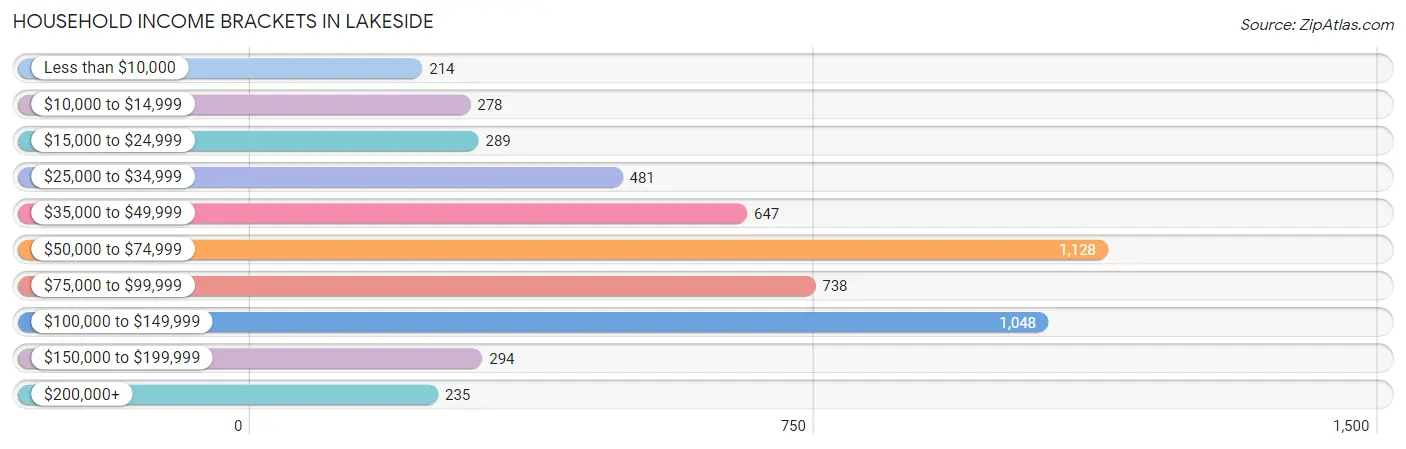
| Income Bracket | # Households | % Households |
| Less than $10,000 | 214 | 4.0% |
| $10,000 to $14,999 | 278 | 5.2% |
| $15,000 to $24,999 | 289 | 5.4% |
| $25,000 to $34,999 | 481 | 9.0% |
| $35,000 to $49,999 | 647 | 12.1% |
| $50,000 to $74,999 | 1,128 | 21.1% |
| $75,000 to $99,999 | 738 | 13.8% |
| $100,000 to $149,999 | 1,048 | 19.6% |
| $150,000 to $199,999 | 294 | 5.5% |
| $200,000+ | 235 | 4.4% |
Household Income by Householder Age in Lakeside
The median household income in Lakeside is $64,912, with the highest median household income of $79,667 found in the 45 to 64 years age bracket for the primary householder. A total of 1,754 households (32.8%) fall into this category. Meanwhile, the 65+ years age bracket for the primary householder has the lowest median household income of $42,833, with 1,242 households (23.2%) in this group.
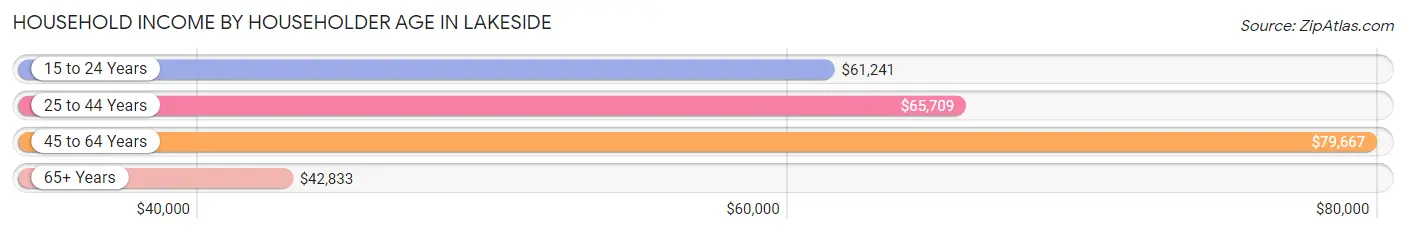
| Income Bracket | # Households | Median Income |
| 15 to 24 Years | 239 (4.5%) | $61,241 |
| 25 to 44 Years | 2,110 (39.5%) | $65,709 |
| 45 to 64 Years | 1,754 (32.8%) | $79,667 |
| 65+ Years | 1,242 (23.2%) | $42,833 |
| Total | 5,345 (100.0%) | $64,912 |
Poverty in Lakeside
Income Below Poverty by Sex and Age in Lakeside
With 11.0% poverty level for males and 8.8% for females among the residents of Lakeside, 5 year old males and 6 to 11 year old females are the most vulnerable to poverty, with 43 males (37.4%) and 60 females (23.2%) in their respective age groups living below the poverty level.
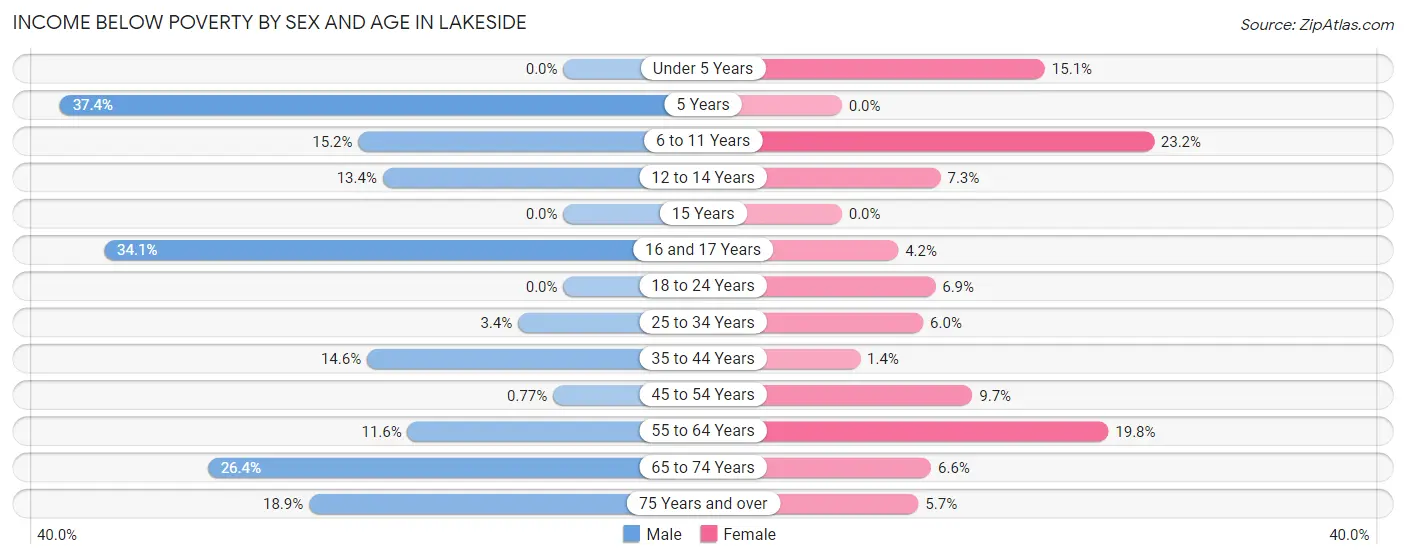
| Age Bracket | Male | Female |
| Under 5 Years | 0 (0.0%) | 30 (15.1%) |
| 5 Years | 43 (37.4%) | 0 (0.0%) |
| 6 to 11 Years | 86 (15.2%) | 60 (23.2%) |
| 12 to 14 Years | 44 (13.4%) | 28 (7.3%) |
| 15 Years | 0 (0.0%) | 0 (0.0%) |
| 16 and 17 Years | 15 (34.1%) | 8 (4.2%) |
| 18 to 24 Years | 0 (0.0%) | 24 (6.9%) |
| 25 to 34 Years | 29 (3.4%) | 86 (6.0%) |
| 35 to 44 Years | 126 (14.6%) | 11 (1.4%) |
| 45 to 54 Years | 5 (0.8%) | 66 (9.7%) |
| 55 to 64 Years | 89 (11.6%) | 166 (19.8%) |
| 65 to 74 Years | 165 (26.4%) | 41 (6.6%) |
| 75 Years and over | 37 (18.9%) | 24 (5.7%) |
| Total | 639 (11.0%) | 544 (8.8%) |
Income Above Poverty by Sex and Age in Lakeside
According to the poverty statistics in Lakeside, males aged under 5 years and females aged 5 years are the age groups that are most secure financially, with 100.0% of males and 100.0% of females in these age groups living above the poverty line.
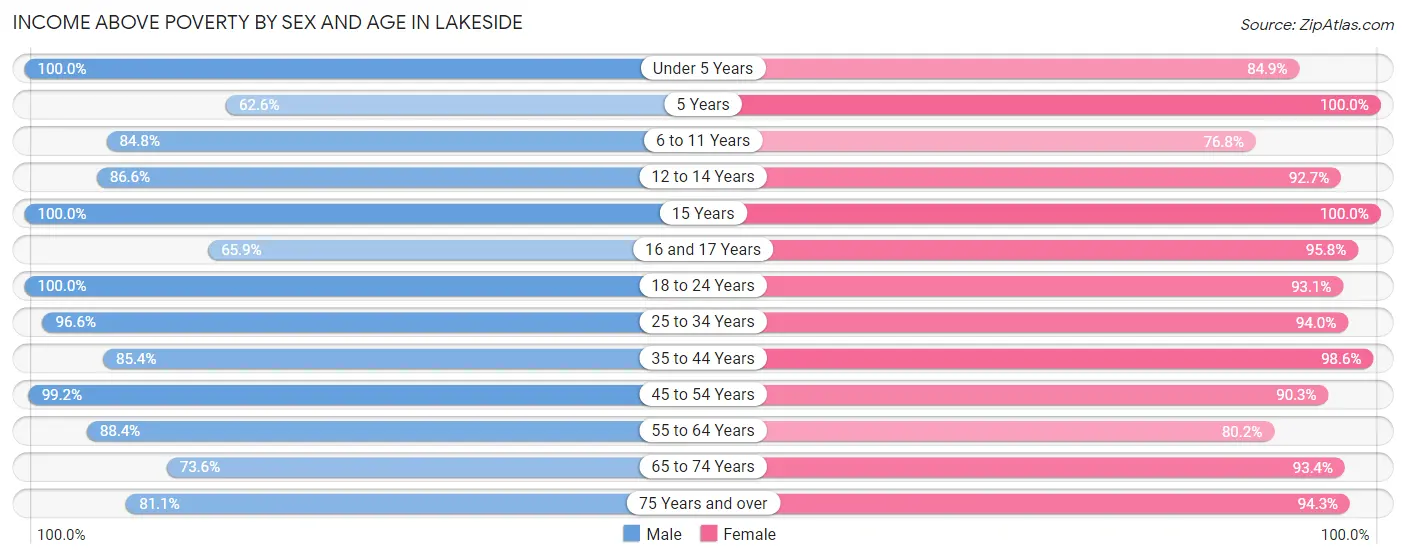
| Age Bracket | Male | Female |
| Under 5 Years | 300 (100.0%) | 169 (84.9%) |
| 5 Years | 72 (62.6%) | 14 (100.0%) |
| 6 to 11 Years | 479 (84.8%) | 199 (76.8%) |
| 12 to 14 Years | 284 (86.6%) | 354 (92.7%) |
| 15 Years | 39 (100.0%) | 12 (100.0%) |
| 16 and 17 Years | 29 (65.9%) | 183 (95.8%) |
| 18 to 24 Years | 475 (100.0%) | 322 (93.1%) |
| 25 to 34 Years | 835 (96.6%) | 1,338 (94.0%) |
| 35 to 44 Years | 738 (85.4%) | 796 (98.6%) |
| 45 to 54 Years | 648 (99.2%) | 615 (90.3%) |
| 55 to 64 Years | 680 (88.4%) | 673 (80.2%) |
| 65 to 74 Years | 460 (73.6%) | 577 (93.4%) |
| 75 Years and over | 159 (81.1%) | 398 (94.3%) |
| Total | 5,198 (89.0%) | 5,650 (91.2%) |
Income Below Poverty Among Married-Couple Families in Lakeside
The poverty statistics for married-couple families in Lakeside show that 3.7% or 75 of the total 2,009 families live below the poverty line. Families with 3 or 4 children have the highest poverty rate of 21.3%, comprising of 20 families. On the other hand, families with 1 or 2 children have the lowest poverty rate of 0.0%, which includes 0 families.
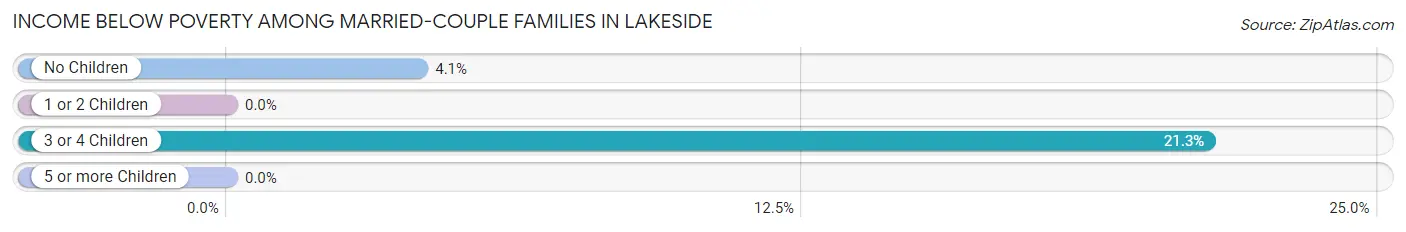
| Children | Above Poverty | Below Poverty |
| No Children | 1,275 (95.9%) | 55 (4.1%) |
| 1 or 2 Children | 585 (100.0%) | 0 (0.0%) |
| 3 or 4 Children | 74 (78.7%) | 20 (21.3%) |
| 5 or more Children | 0 (0.0%) | 0 (0.0%) |
| Total | 1,934 (96.3%) | 75 (3.7%) |
Income Below Poverty Among Single-Parent Households in Lakeside
According to the poverty data in Lakeside, 20.5% or 33 single-father households and 10.1% or 93 single-mother households are living below the poverty line. Among single-father households, those with 3 or 4 children have the highest poverty rate, with 17 households (100.0%) experiencing poverty. Likewise, among single-mother households, those with 3 or 4 children have the highest poverty rate, with 23 households (27.4%) falling below the poverty line.
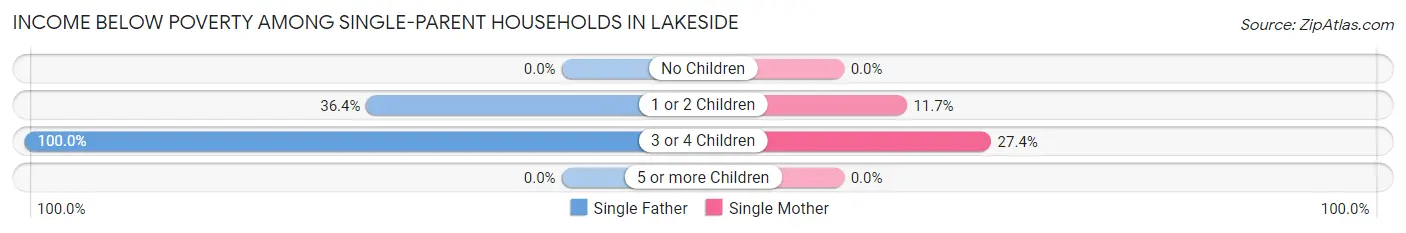
| Children | Single Father | Single Mother |
| No Children | 0 (0.0%) | 0 (0.0%) |
| 1 or 2 Children | 16 (36.4%) | 70 (11.7%) |
| 3 or 4 Children | 17 (100.0%) | 23 (27.4%) |
| 5 or more Children | 0 (0.0%) | 0 (0.0%) |
| Total | 33 (20.5%) | 93 (10.1%) |
Income Below Poverty Among Married-Couple vs Single-Parent Households in Lakeside
The poverty data for Lakeside shows that 75 of the married-couple family households (3.7%) and 126 of the single-parent households (11.7%) are living below the poverty level. Within the married-couple family households, those with 3 or 4 children have the highest poverty rate, with 20 households (21.3%) falling below the poverty line. Among the single-parent households, those with 3 or 4 children have the highest poverty rate, with 40 household (39.6%) living below poverty.
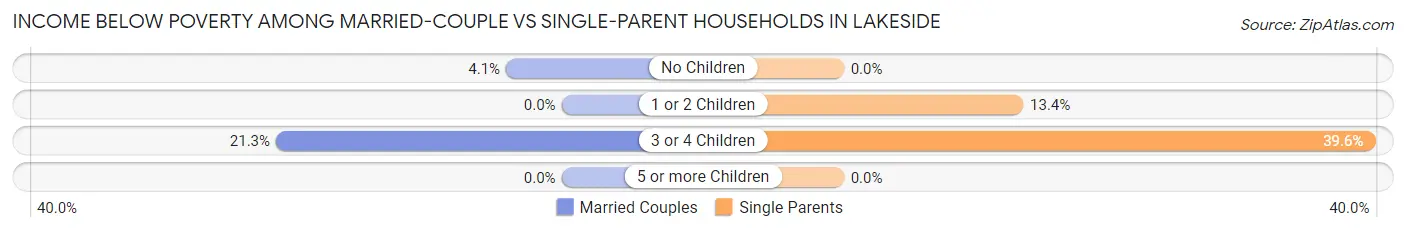
| Children | Married-Couple Families | Single-Parent Households |
| No Children | 55 (4.1%) | 0 (0.0%) |
| 1 or 2 Children | 0 (0.0%) | 86 (13.4%) |
| 3 or 4 Children | 20 (21.3%) | 40 (39.6%) |
| 5 or more Children | 0 (0.0%) | 0 (0.0%) |
| Total | 75 (3.7%) | 126 (11.7%) |
Race in Lakeside
The most populous races in Lakeside are White / Caucasian (7,986 | 65.9%), Black / African American (2,352 | 19.4%), and Hispanic or Latino (1,417 | 11.7%).
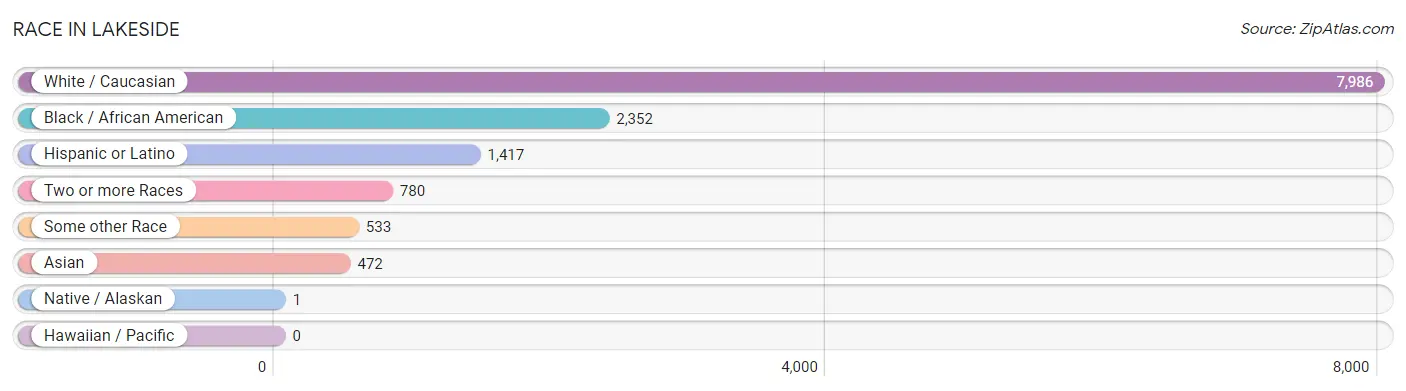
| Race | # Population | % Population |
| Asian | 472 | 3.9% |
| Black / African American | 2,352 | 19.4% |
| Hawaiian / Pacific | 0 | 0.0% |
| Hispanic or Latino | 1,417 | 11.7% |
| Native / Alaskan | 1 | 0.0% |
| White / Caucasian | 7,986 | 65.9% |
| Two or more Races | 780 | 6.4% |
| Some other Race | 533 | 4.4% |
| Total | 12,124 | 100.0% |
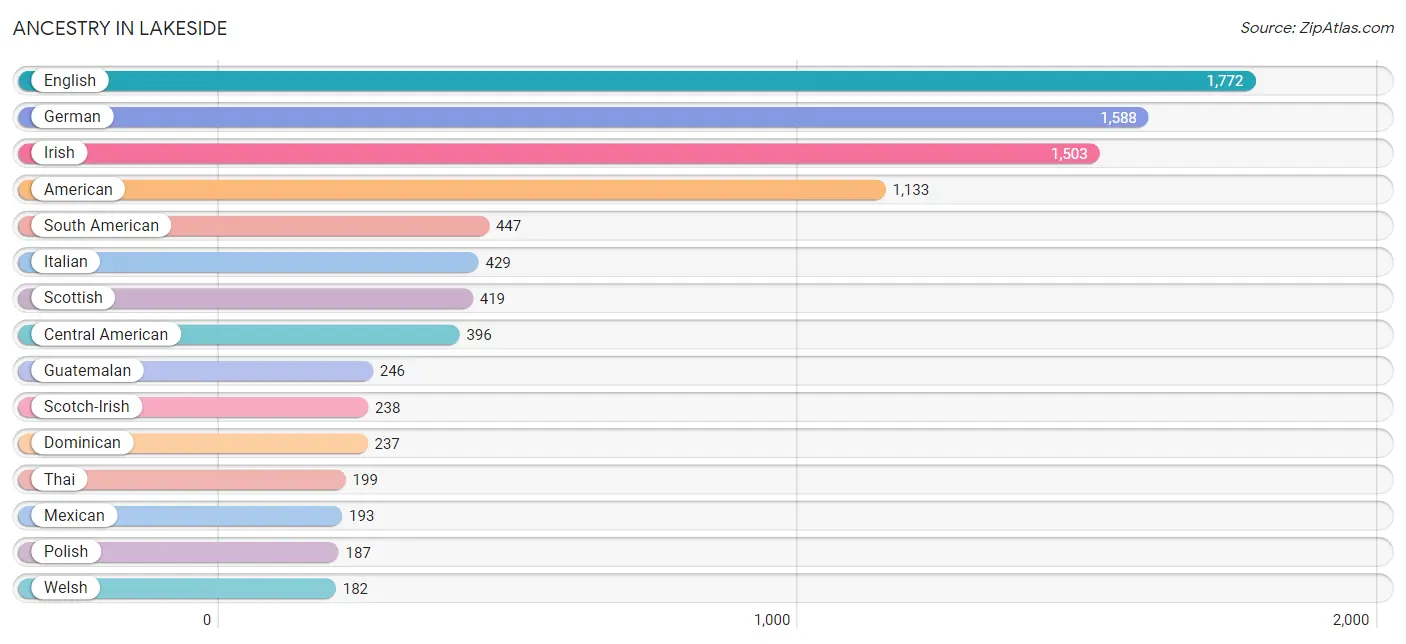
Ancestry in Lakeside
The most populous ancestries reported in Lakeside are English (1,772 | 14.6%), German (1,588 | 13.1%), Irish (1,503 | 12.4%), American (1,133 | 9.3%), and South American (447 | 3.7%), together accounting for 53.2% of all Lakeside residents.
| Ancestry | # Population | % Population |
| American | 1,133 | 9.3% |
| Arab | 78 | 0.6% |
| Argentinean | 32 | 0.3% |
| Austrian | 30 | 0.3% |
| Belgian | 13 | 0.1% |
| Bhutanese | 91 | 0.7% |
| Bolivian | 91 | 0.7% |
| British | 65 | 0.5% |
| Burmese | 33 | 0.3% |
| Canadian | 3 | 0.0% |
| Central American | 396 | 3.3% |
| Cherokee | 8 | 0.1% |
| Chilean | 98 | 0.8% |
| Colombian | 78 | 0.6% |
| Croatian | 9 | 0.1% |
| Cuban | 52 | 0.4% |
| Czech | 2 | 0.0% |
| Danish | 15 | 0.1% |
| Dominican | 237 | 1.9% |
| Dutch | 74 | 0.6% |
| Eastern European | 30 | 0.3% |
| English | 1,772 | 14.6% |
| European | 144 | 1.2% |
| Finnish | 34 | 0.3% |
| French | 181 | 1.5% |
| French Canadian | 59 | 0.5% |
| German | 1,588 | 13.1% |
| Ghanaian | 16 | 0.1% |
| Greek | 40 | 0.3% |
| Guamanian / Chamorro | 11 | 0.1% |
| Guatemalan | 246 | 2.0% |
| Haitian | 8 | 0.1% |
| Honduran | 18 | 0.2% |
| Hungarian | 9 | 0.1% |
| Indian (Asian) | 49 | 0.4% |
| Iranian | 30 | 0.3% |
| Irish | 1,503 | 12.4% |
| Italian | 429 | 3.5% |
| Jamaican | 29 | 0.2% |
| Japanese | 30 | 0.3% |
| Korean | 23 | 0.2% |
| Lebanese | 4 | 0.0% |
| Lithuanian | 20 | 0.2% |
| Lumbee | 1 | 0.0% |
| Malaysian | 7 | 0.1% |
| Mexican | 193 | 1.6% |
| Moroccan | 73 | 0.6% |
| Native Hawaiian | 11 | 0.1% |
| Nigerian | 16 | 0.1% |
| Northern European | 19 | 0.2% |
| Norwegian | 68 | 0.6% |
| Panamanian | 23 | 0.2% |
| Pennsylvania German | 6 | 0.1% |
| Peruvian | 2 | 0.0% |
| Polish | 187 | 1.5% |
| Portuguese | 95 | 0.8% |
| Puerto Rican | 45 | 0.4% |
| Romanian | 55 | 0.4% |
| Russian | 22 | 0.2% |
| Salvadoran | 109 | 0.9% |
| Scandinavian | 4 | 0.0% |
| Scotch-Irish | 238 | 2.0% |
| Scottish | 419 | 3.5% |
| Seminole | 8 | 0.1% |
| Sioux | 31 | 0.3% |
| Slovak | 11 | 0.1% |
| South American | 447 | 3.7% |
| Spaniard | 23 | 0.2% |
| Sri Lankan | 168 | 1.4% |
| Subsaharan African | 44 | 0.4% |
| Swedish | 60 | 0.5% |
| Swiss | 4 | 0.0% |
| Thai | 199 | 1.6% |
| Ukrainian | 126 | 1.0% |
| Venezuelan | 146 | 1.2% |
| Welsh | 182 | 1.5% |
| Yugoslavian | 97 | 0.8% | View All 77 Rows |
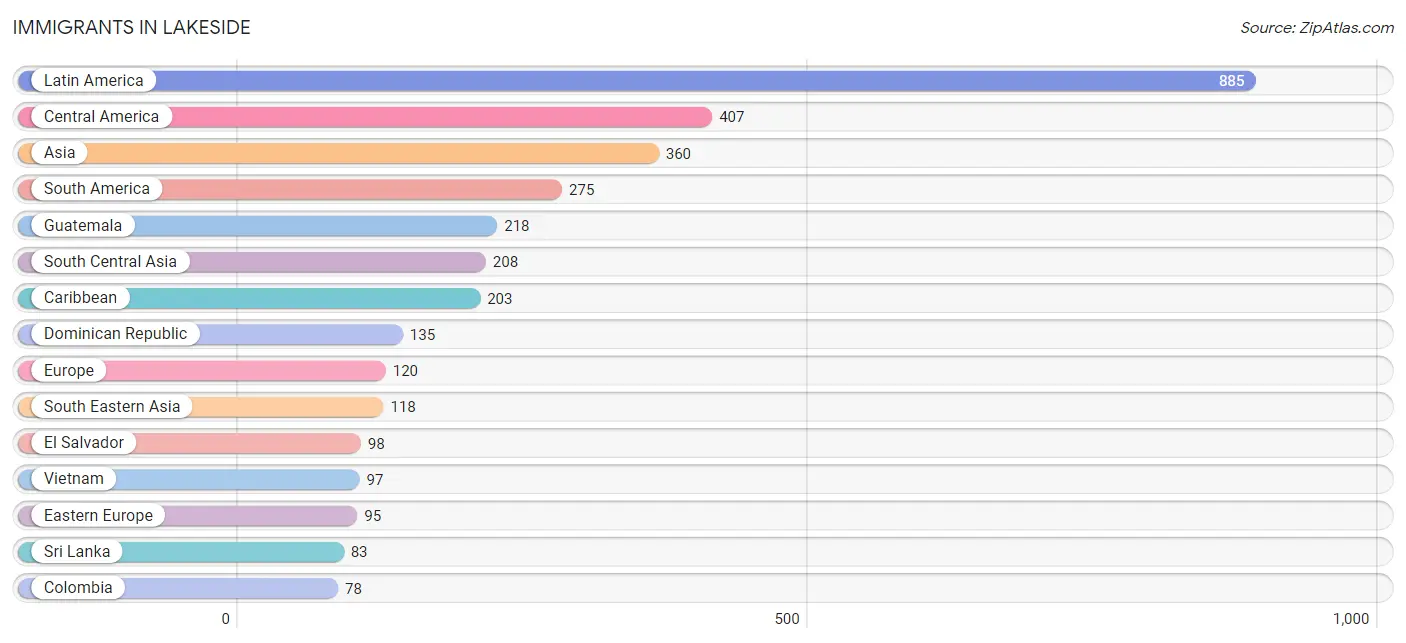
Immigrants in Lakeside
The most numerous immigrant groups reported in Lakeside came from Latin America (885 | 7.3%), Central America (407 | 3.4%), Asia (360 | 3.0%), South America (275 | 2.3%), and Guatemala (218 | 1.8%), together accounting for 17.7% of all Lakeside residents.
| Immigration Origin | # Population | % Population |
| Africa | 54 | 0.4% |
| Argentina | 32 | 0.3% |
| Asia | 360 | 3.0% |
| Bangladesh | 76 | 0.6% |
| Bolivia | 59 | 0.5% |
| Bosnia and Herzegovina | 55 | 0.4% |
| Brazil | 18 | 0.2% |
| Cambodia | 10 | 0.1% |
| Canada | 6 | 0.1% |
| Caribbean | 203 | 1.7% |
| Central America | 407 | 3.4% |
| Chile | 23 | 0.2% |
| China | 19 | 0.2% |
| Colombia | 78 | 0.6% |
| Cuba | 31 | 0.3% |
| Dominican Republic | 135 | 1.1% |
| Eastern Asia | 34 | 0.3% |
| Eastern Europe | 95 | 0.8% |
| El Salvador | 98 | 0.8% |
| Europe | 120 | 1.0% |
| Germany | 11 | 0.1% |
| Guatemala | 218 | 1.8% |
| Haiti | 8 | 0.1% |
| India | 19 | 0.2% |
| Iran | 30 | 0.3% |
| Jamaica | 29 | 0.2% |
| Korea | 15 | 0.1% |
| Latin America | 885 | 7.3% |
| Mexico | 68 | 0.6% |
| Morocco | 42 | 0.4% |
| Northern Africa | 43 | 0.4% |
| Northern Europe | 6 | 0.1% |
| Panama | 23 | 0.2% |
| Peru | 2 | 0.0% |
| Philippines | 11 | 0.1% |
| Portugal | 8 | 0.1% |
| Romania | 40 | 0.3% |
| Scotland | 6 | 0.1% |
| South America | 275 | 2.3% |
| South Central Asia | 208 | 1.7% |
| South Eastern Asia | 118 | 1.0% |
| Southern Europe | 8 | 0.1% |
| Sri Lanka | 83 | 0.7% |
| Venezuela | 63 | 0.5% |
| Vietnam | 97 | 0.8% |
| Western Africa | 11 | 0.1% |
| Western Europe | 11 | 0.1% | View All 47 Rows |
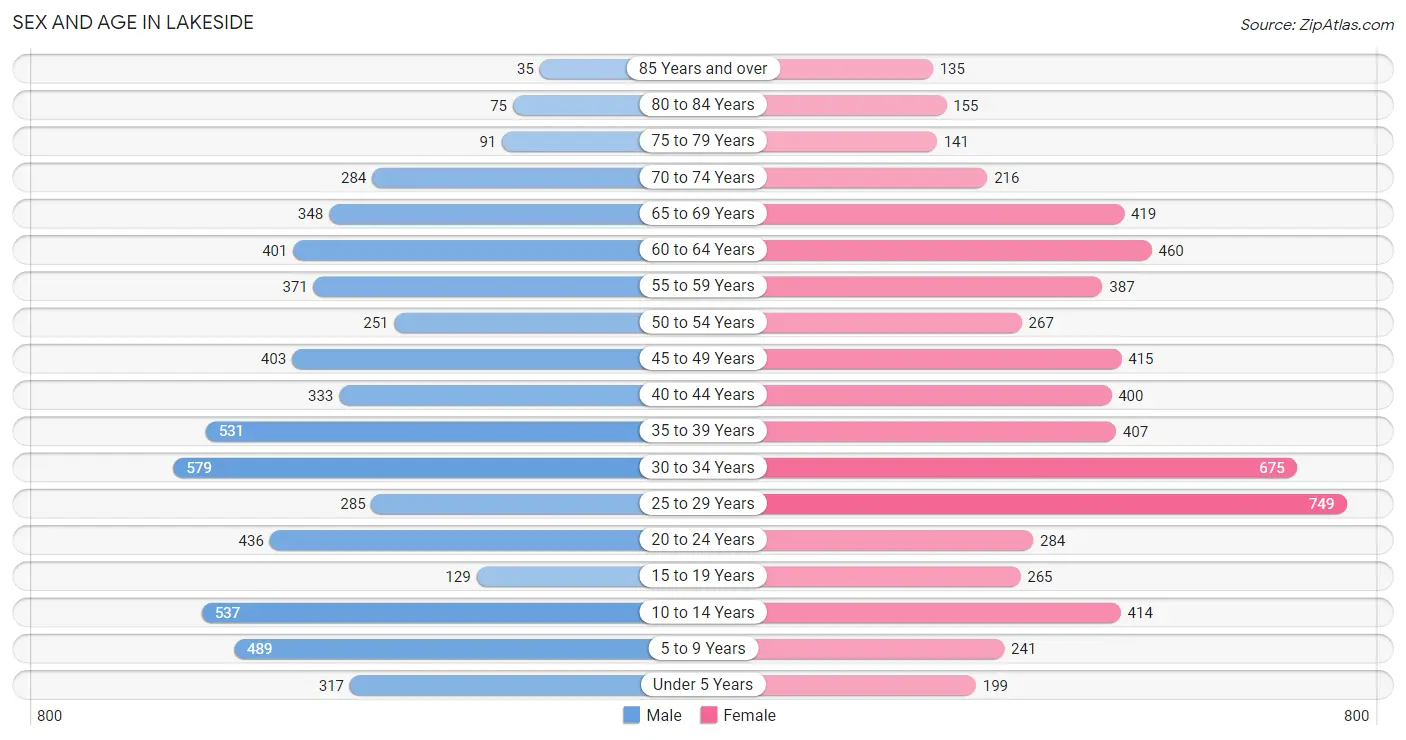
Sex and Age in Lakeside
Sex and Age in Lakeside
The most populous age groups in Lakeside are 30 to 34 Years (579 | 9.8%) for men and 25 to 29 Years (749 | 12.0%) for women.
| Age Bracket | Male | Female |
| Under 5 Years | 317 (5.4%) | 199 (3.2%) |
| 5 to 9 Years | 489 (8.3%) | 241 (3.9%) |
| 10 to 14 Years | 537 (9.1%) | 414 (6.7%) |
| 15 to 19 Years | 129 (2.2%) | 265 (4.3%) |
| 20 to 24 Years | 436 (7.4%) | 284 (4.6%) |
| 25 to 29 Years | 285 (4.8%) | 749 (12.0%) |
| 30 to 34 Years | 579 (9.8%) | 675 (10.8%) |
| 35 to 39 Years | 531 (9.0%) | 407 (6.5%) |
| 40 to 44 Years | 333 (5.7%) | 400 (6.4%) |
| 45 to 49 Years | 403 (6.8%) | 415 (6.7%) |
| 50 to 54 Years | 251 (4.3%) | 267 (4.3%) |
| 55 to 59 Years | 371 (6.3%) | 387 (6.2%) |
| 60 to 64 Years | 401 (6.8%) | 460 (7.4%) |
| 65 to 69 Years | 348 (5.9%) | 419 (6.7%) |
| 70 to 74 Years | 284 (4.8%) | 216 (3.5%) |
| 75 to 79 Years | 91 (1.5%) | 141 (2.3%) |
| 80 to 84 Years | 75 (1.3%) | 155 (2.5%) |
| 85 Years and over | 35 (0.6%) | 135 (2.2%) |
| Total | 5,895 (100.0%) | 6,229 (100.0%) |
Families and Households in Lakeside
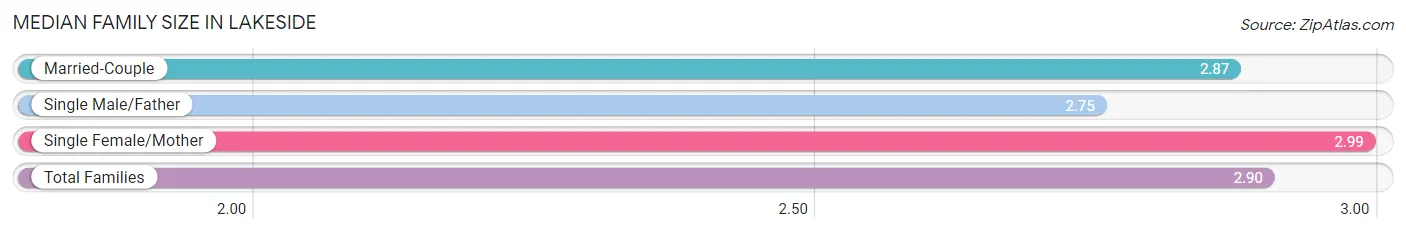
Median Family Size in Lakeside
The median family size in Lakeside is 2.90 persons per family, with single female/mother families (921 | 29.8%) accounting for the largest median family size of 2.99 persons per family. On the other hand, single male/father families (161 | 5.2%) represent the smallest median family size with 2.75 persons per family.
| Family Type | # Families | Family Size |
| Married-Couple | 2,009 (65.0%) | 2.87 |
| Single Male/Father | 161 (5.2%) | 2.75 |
| Single Female/Mother | 921 (29.8%) | 2.99 |
| Total Families | 3,091 (100.0%) | 2.90 |
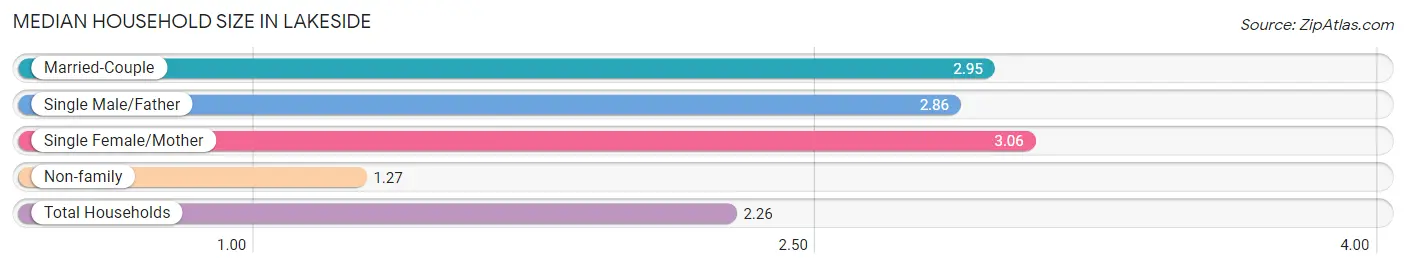
Median Household Size in Lakeside
The median household size in Lakeside is 2.26 persons per household, with single female/mother households (921 | 17.2%) accounting for the largest median household size of 3.06 persons per household. non-family households (2,254 | 42.2%) represent the smallest median household size with 1.27 persons per household.
| Household Type | # Households | Household Size |
| Married-Couple | 2,009 (37.6%) | 2.95 |
| Single Male/Father | 161 (3.0%) | 2.86 |
| Single Female/Mother | 921 (17.2%) | 3.06 |
| Non-family | 2,254 (42.2%) | 1.27 |
| Total Households | 5,345 (100.0%) | 2.26 |
Household Size by Marriage Status in Lakeside
Out of a total of 5,345 households in Lakeside, 3,091 (57.8%) are family households, while 2,254 (42.2%) are nonfamily households. The most numerous type of family households are 2-person households, comprising 1,573, and the most common type of nonfamily households are 1-person households, comprising 1,826.
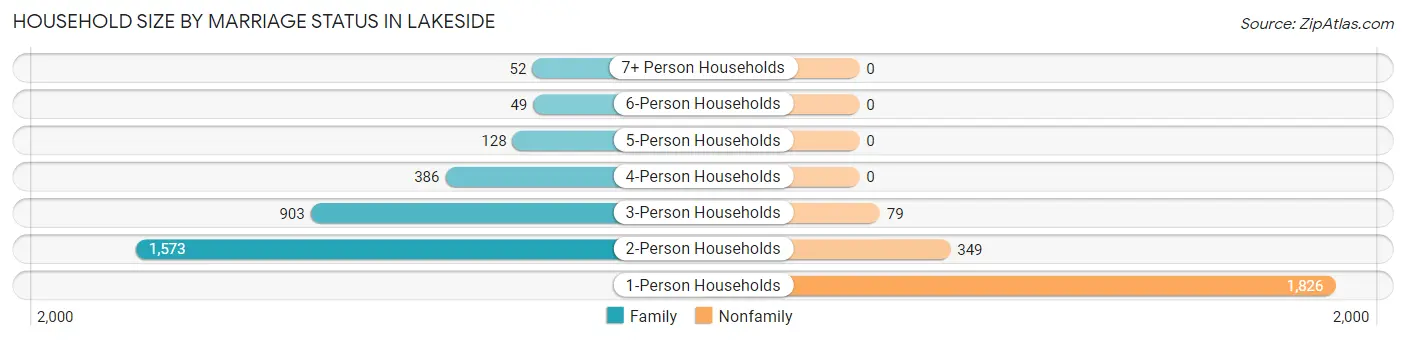
| Household Size | Family Households | Nonfamily Households |
| 1-Person Households | - | 1,826 (34.2%) |
| 2-Person Households | 1,573 (29.4%) | 349 (6.5%) |
| 3-Person Households | 903 (16.9%) | 79 (1.5%) |
| 4-Person Households | 386 (7.2%) | 0 (0.0%) |
| 5-Person Households | 128 (2.4%) | 0 (0.0%) |
| 6-Person Households | 49 (0.9%) | 0 (0.0%) |
| 7+ Person Households | 52 (1.0%) | 0 (0.0%) |
| Total | 3,091 (57.8%) | 2,254 (42.2%) |
Female Fertility in Lakeside
Fertility by Age in Lakeside
Average fertility rate in Lakeside is 48.0 births per 1,000 women. Women in the age bracket of 20 to 34 years have the highest fertility rate with 82.0 births per 1,000 women. Women in the age bracket of 20 to 34 years acount for 89.2% of all women with births.
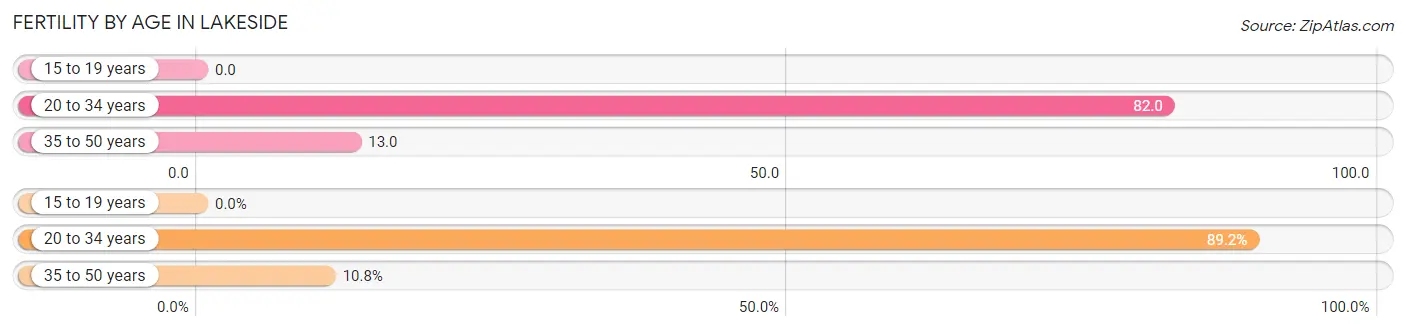
| Age Bracket | Women with Births | Births / 1,000 Women |
| 15 to 19 years | 0 (0.0%) | 0.0 |
| 20 to 34 years | 140 (89.2%) | 82.0 |
| 35 to 50 years | 17 (10.8%) | 13.0 |
| Total | 157 (100.0%) | 48.0 |
Fertility by Age by Marriage Status in Lakeside
93.0% of women with births (157) in Lakeside are married. The highest percentage of unmarried women with births falls into 35 to 50 years age bracket with 64.7% of them unmarried at the time of birth, while the lowest percentage of unmarried women with births belong to 20 to 34 years age bracket with 0.0% of them unmarried.
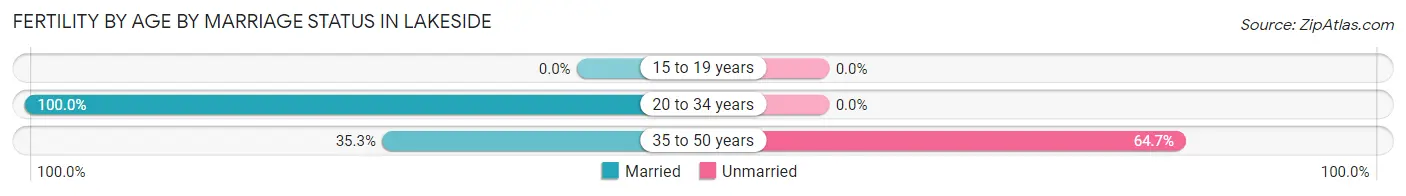
| Age Bracket | Married | Unmarried |
| 15 to 19 years | 0 (0.0%) | 0 (0.0%) |
| 20 to 34 years | 140 (100.0%) | 0 (0.0%) |
| 35 to 50 years | 6 (35.3%) | 11 (64.7%) |
| Total | 146 (93.0%) | 11 (7.0%) |
Fertility by Education in Lakeside
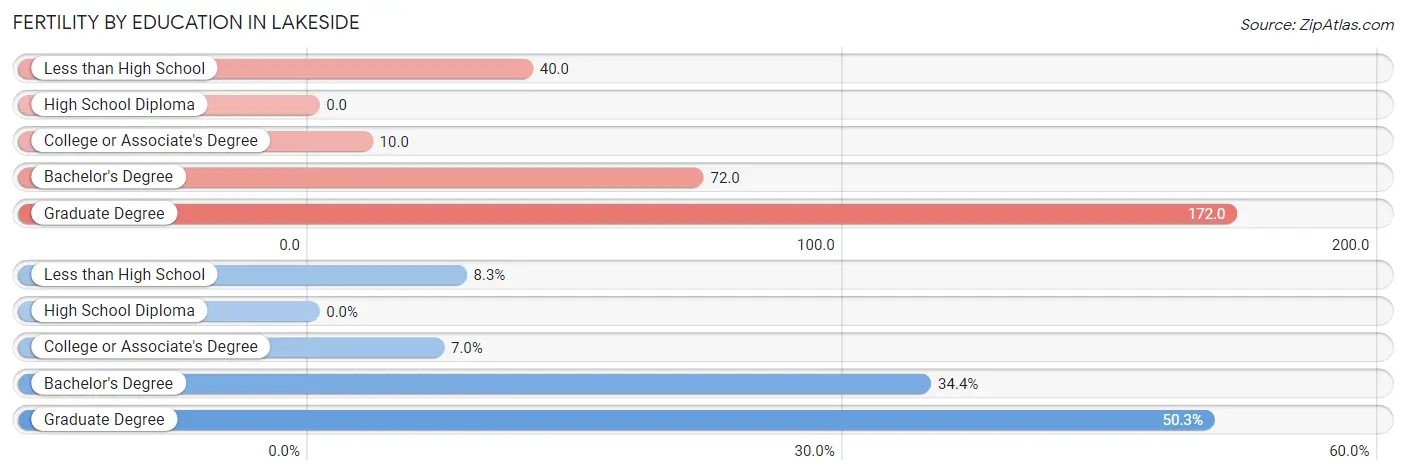
| Educational Attainment | Women with Births | Births / 1,000 Women |
| Less than High School | 13 (8.3%) | 40.0 |
| High School Diploma | 0 (0.0%) | 0.0 |
| College or Associate's Degree | 11 (7.0%) | 10.0 |
| Bachelor's Degree | 54 (34.4%) | 72.0 |
| Graduate Degree | 79 (50.3%) | 172.0 |
| Total | 157 (100.0%) | 48.0 |
Fertility by Education by Marriage Status in Lakeside
7.0% of women with births in Lakeside are unmarried. Women with the educational attainment of less than high school are most likely to be married with 100.0% of them married at childbirth, while women with the educational attainment of college or associate's degree are least likely to be married with 100.0% of them unmarried at childbirth.
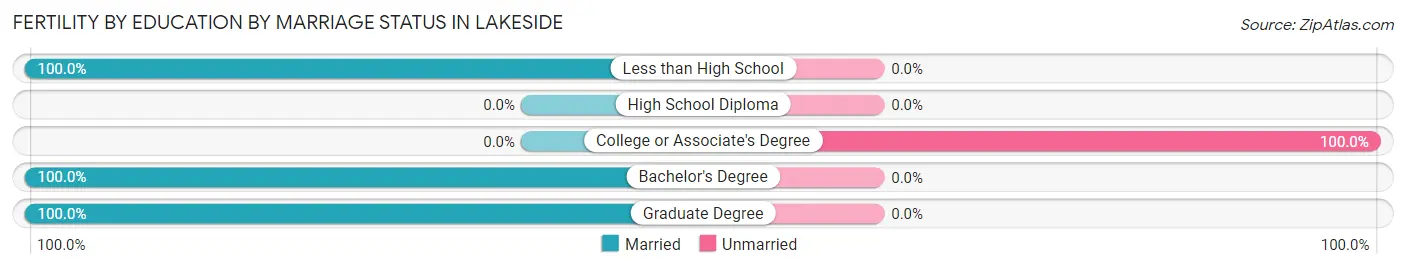
| Educational Attainment | Married | Unmarried |
| Less than High School | 13 (100.0%) | 0 (0.0%) |
| High School Diploma | 0 (0.0%) | 0 (0.0%) |
| College or Associate's Degree | 0 (0.0%) | 11 (100.0%) |
| Bachelor's Degree | 54 (100.0%) | 0 (0.0%) |
| Graduate Degree | 79 (100.0%) | 0 (0.0%) |
| Total | 146 (93.0%) | 11 (7.0%) |
Employment Characteristics in Lakeside
Employment by Class of Employer in Lakeside
Among the 6,621 employed individuals in Lakeside, private company employees (4,154 | 62.7%), self-employed (not incorporated) (654 | 9.9%), and not-for-profit organizations (459 | 6.9%) make up the most common classes of employment.
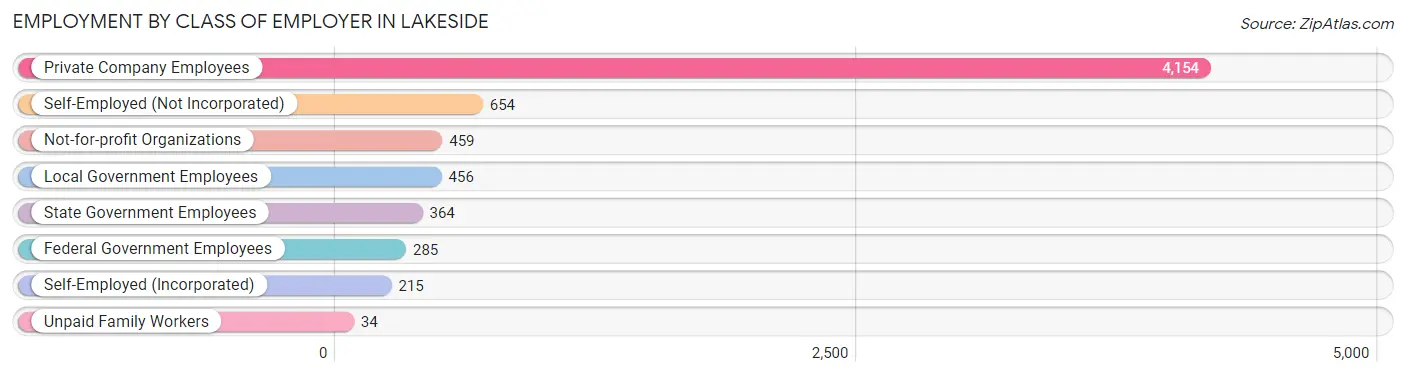
| Employer Class | # Employees | % Employees |
| Private Company Employees | 4,154 | 62.7% |
| Self-Employed (Incorporated) | 215 | 3.3% |
| Self-Employed (Not Incorporated) | 654 | 9.9% |
| Not-for-profit Organizations | 459 | 6.9% |
| Local Government Employees | 456 | 6.9% |
| State Government Employees | 364 | 5.5% |
| Federal Government Employees | 285 | 4.3% |
| Unpaid Family Workers | 34 | 0.5% |
| Total | 6,621 | 100.0% |
Employment Status by Age in Lakeside
According to the labor force statistics for Lakeside, out of the total population over 16 years of age (9,876), 70.4% or 6,953 individuals are in the labor force, with 2.1% or 146 of them unemployed. The age group with the highest labor force participation rate is 35 to 44 years, with 91.6% or 1,531 individuals in the labor force. Within the labor force, the 55 to 59 years age range has the highest percentage of unemployed individuals, with 11.7% or 78 of them being unemployed.
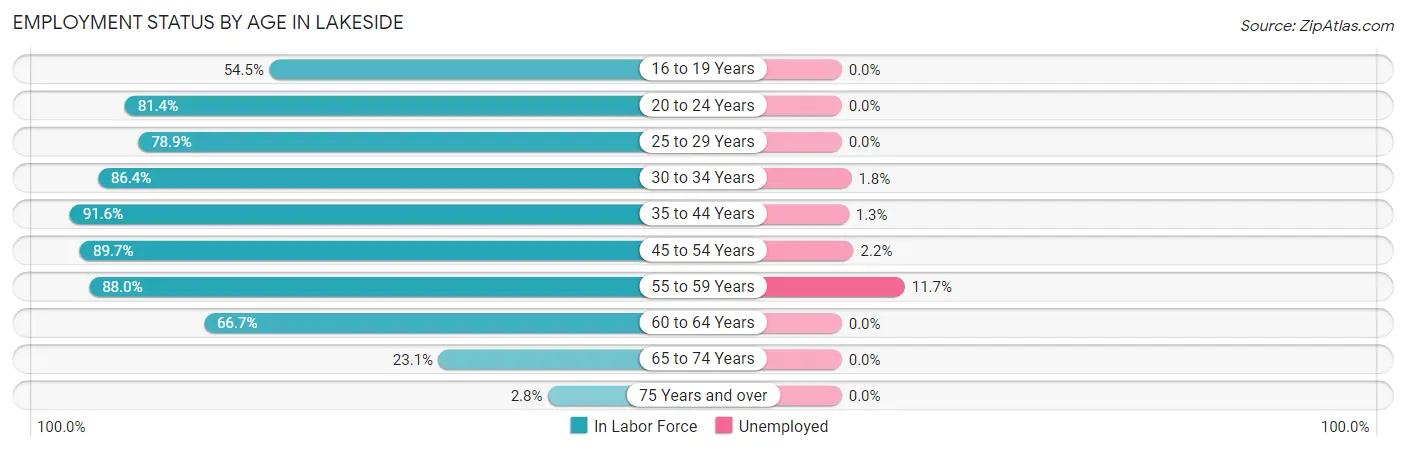
| Age Bracket | In Labor Force | Unemployed |
| 16 to 19 Years | 187 (54.5%) | 0 (0.0%) |
| 20 to 24 Years | 586 (81.4%) | 0 (0.0%) |
| 25 to 29 Years | 816 (78.9%) | 0 (0.0%) |
| 30 to 34 Years | 1,083 (86.4%) | 19 (1.8%) |
| 35 to 44 Years | 1,531 (91.6%) | 20 (1.3%) |
| 45 to 54 Years | 1,198 (89.7%) | 26 (2.2%) |
| 55 to 59 Years | 667 (88.0%) | 78 (11.7%) |
| 60 to 64 Years | 574 (66.7%) | 0 (0.0%) |
| 65 to 74 Years | 293 (23.1%) | 0 (0.0%) |
| 75 Years and over | 18 (2.8%) | 0 (0.0%) |
| Total | 6,953 (70.4%) | 146 (2.1%) |
Employment Status by Educational Attainment in Lakeside
According to labor force statistics for Lakeside, 84.9% of individuals (5,870) out of the total population between 25 and 64 years of age (6,914) are in the labor force, with 2.5% or 147 of them being unemployed. The group with the highest labor force participation rate are those with the educational attainment of bachelor's degree or higher, with 94.3% or 2,436 individuals in the labor force. Within the labor force, individuals with less than high school education have the highest percentage of unemployment, with 4.6% or 23 of them being unemployed.
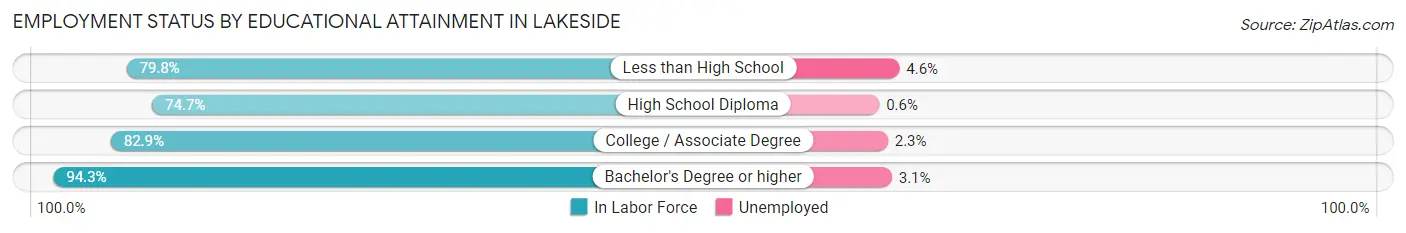
| Educational Attainment | In Labor Force | Unemployed |
| Less than High School | 499 (79.8%) | 29 (4.6%) |
| High School Diploma | 1,238 (74.7%) | 10 (0.6%) |
| College / Associate Degree | 1,699 (82.9%) | 47 (2.3%) |
| Bachelor's Degree or higher | 2,436 (94.3%) | 80 (3.1%) |
| Total | 5,870 (84.9%) | 173 (2.5%) |
Employment Occupations by Sex in Lakeside
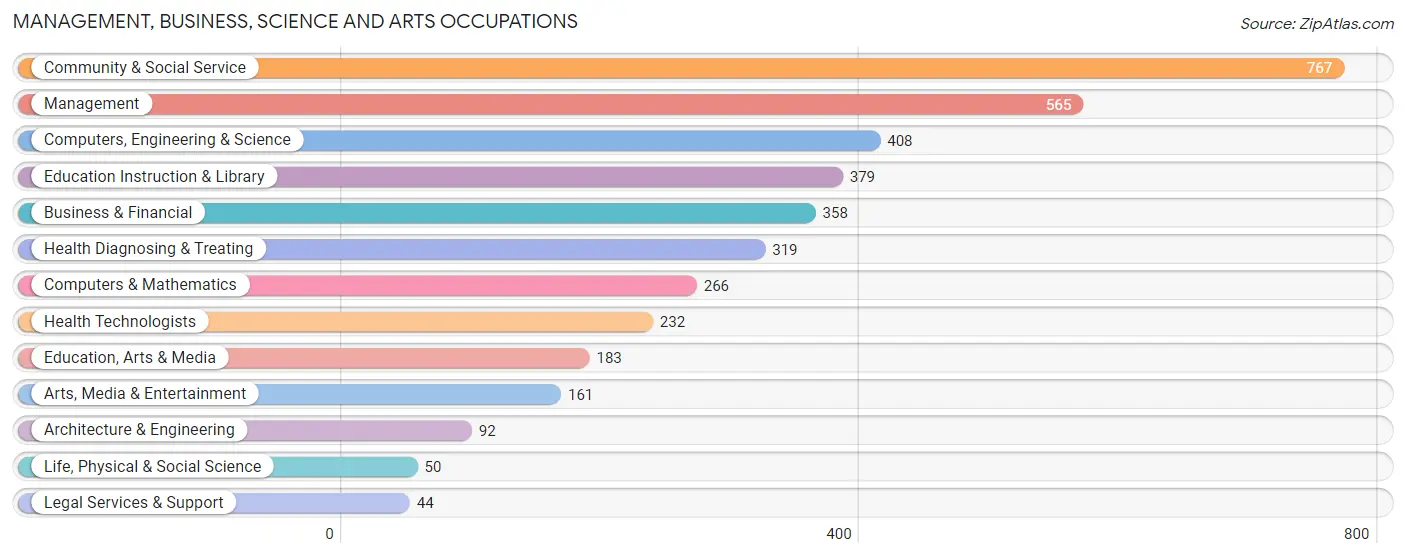
Management, Business, Science and Arts Occupations
The most common Management, Business, Science and Arts occupations in Lakeside are Community & Social Service (767 | 11.6%), Management (565 | 8.5%), Computers, Engineering & Science (408 | 6.2%), Education Instruction & Library (379 | 5.7%), and Business & Financial (358 | 5.4%).
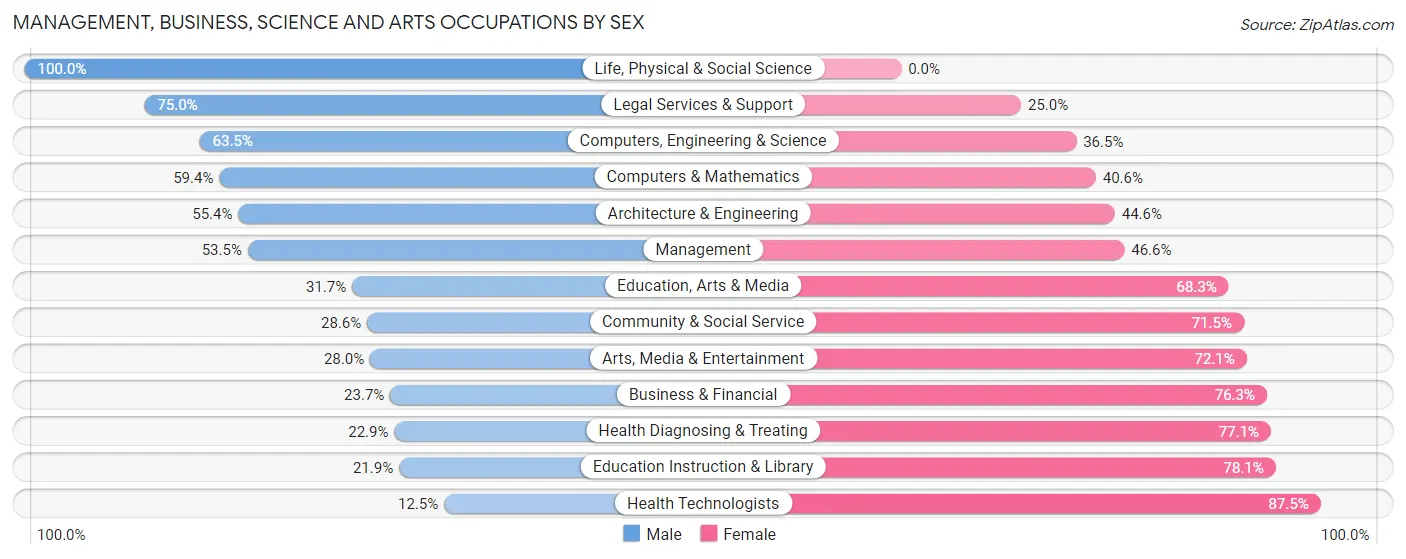
Management, Business, Science and Arts Occupations by Sex
Within the Management, Business, Science and Arts occupations in Lakeside, the most male-oriented occupations are Life, Physical & Social Science (100.0%), Legal Services & Support (75.0%), and Computers, Engineering & Science (63.5%), while the most female-oriented occupations are Health Technologists (87.5%), Education Instruction & Library (78.1%), and Health Diagnosing & Treating (77.1%).
| Occupation | Male | Female |
| Management | 302 (53.4%) | 263 (46.6%) |
| Business & Financial | 85 (23.7%) | 273 (76.3%) |
| Computers, Engineering & Science | 259 (63.5%) | 149 (36.5%) |
| Computers & Mathematics | 158 (59.4%) | 108 (40.6%) |
| Architecture & Engineering | 51 (55.4%) | 41 (44.6%) |
| Life, Physical & Social Science | 50 (100.0%) | 0 (0.0%) |
| Community & Social Service | 219 (28.5%) | 548 (71.5%) |
| Education, Arts & Media | 58 (31.7%) | 125 (68.3%) |
| Legal Services & Support | 33 (75.0%) | 11 (25.0%) |
| Education Instruction & Library | 83 (21.9%) | 296 (78.1%) |
| Arts, Media & Entertainment | 45 (28.0%) | 116 (72.1%) |
| Health Diagnosing & Treating | 73 (22.9%) | 246 (77.1%) |
| Health Technologists | 29 (12.5%) | 203 (87.5%) |
| Total (Category) | 938 (38.8%) | 1,479 (61.2%) |
| Total (Overall) | 3,142 (47.5%) | 3,474 (52.5%) |
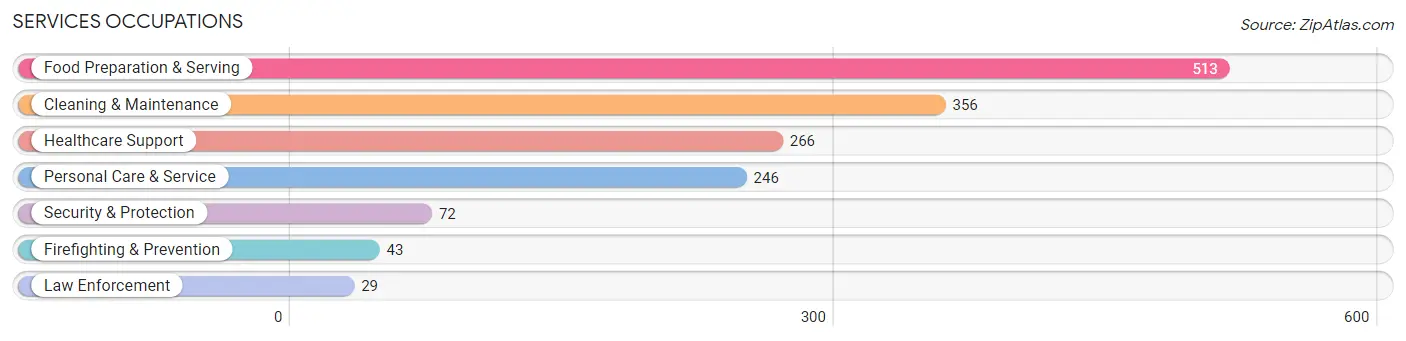
Services Occupations
The most common Services occupations in Lakeside are Food Preparation & Serving (513 | 7.7%), Cleaning & Maintenance (356 | 5.4%), Healthcare Support (266 | 4.0%), Personal Care & Service (246 | 3.7%), and Security & Protection (72 | 1.1%).
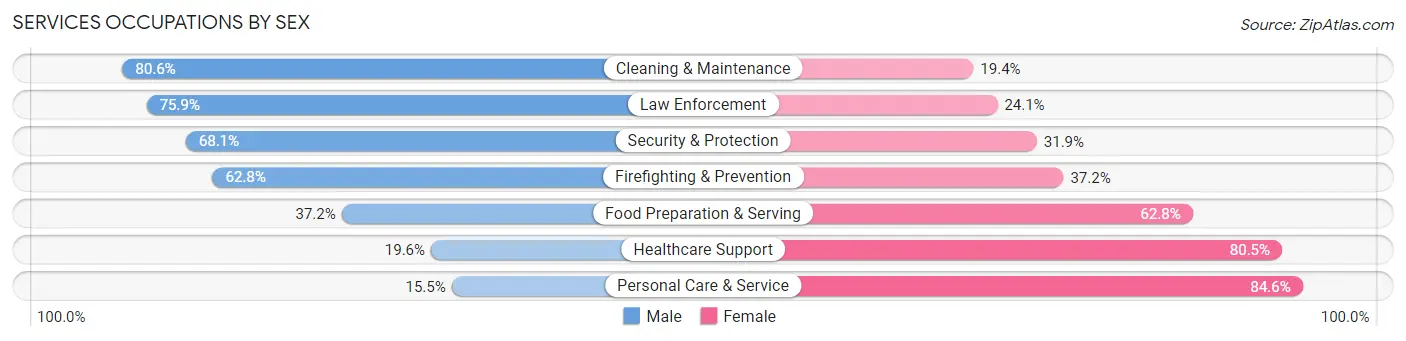
Services Occupations by Sex
Within the Services occupations in Lakeside, the most male-oriented occupations are Cleaning & Maintenance (80.6%), Law Enforcement (75.9%), and Security & Protection (68.1%), while the most female-oriented occupations are Personal Care & Service (84.6%), Healthcare Support (80.4%), and Food Preparation & Serving (62.8%).
| Occupation | Male | Female |
| Healthcare Support | 52 (19.6%) | 214 (80.4%) |
| Security & Protection | 49 (68.1%) | 23 (31.9%) |
| Firefighting & Prevention | 27 (62.8%) | 16 (37.2%) |
| Law Enforcement | 22 (75.9%) | 7 (24.1%) |
| Food Preparation & Serving | 191 (37.2%) | 322 (62.8%) |
| Cleaning & Maintenance | 287 (80.6%) | 69 (19.4%) |
| Personal Care & Service | 38 (15.4%) | 208 (84.6%) |
| Total (Category) | 617 (42.5%) | 836 (57.5%) |
| Total (Overall) | 3,142 (47.5%) | 3,474 (52.5%) |
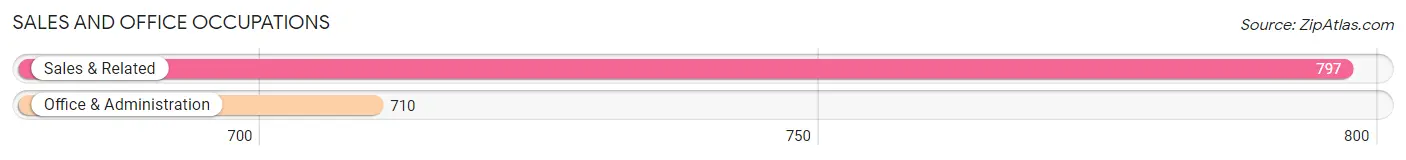
Sales and Office Occupations
The most common Sales and Office occupations in Lakeside are Sales & Related (797 | 12.0%), and Office & Administration (710 | 10.7%).
Sales and Office Occupations by Sex
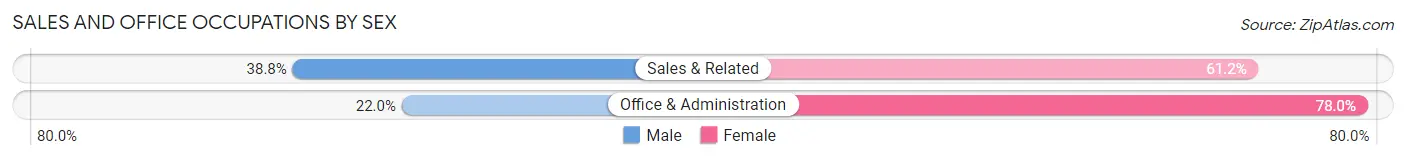
| Occupation | Male | Female |
| Sales & Related | 309 (38.8%) | 488 (61.2%) |
| Office & Administration | 156 (22.0%) | 554 (78.0%) |
| Total (Category) | 465 (30.9%) | 1,042 (69.1%) |
| Total (Overall) | 3,142 (47.5%) | 3,474 (52.5%) |
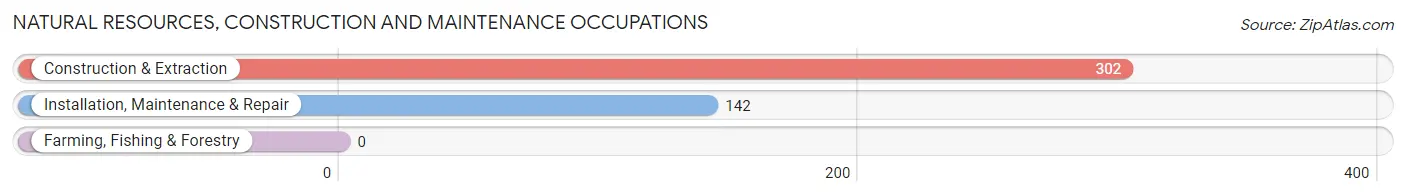
Natural Resources, Construction and Maintenance Occupations
The most common Natural Resources, Construction and Maintenance occupations in Lakeside are Construction & Extraction (302 | 4.6%), and Installation, Maintenance & Repair (142 | 2.1%).
Natural Resources, Construction and Maintenance Occupations by Sex
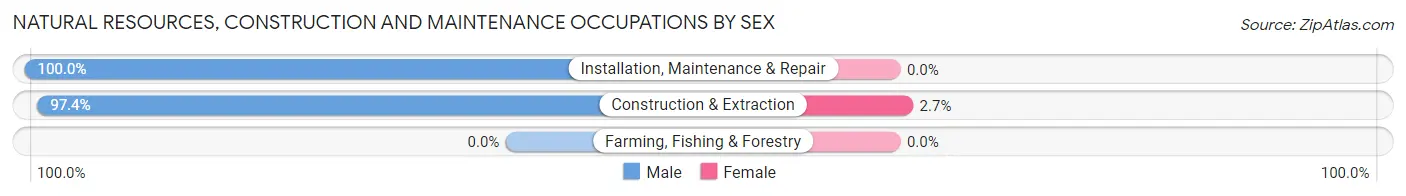
| Occupation | Male | Female |
| Farming, Fishing & Forestry | 0 (0.0%) | 0 (0.0%) |
| Construction & Extraction | 294 (97.4%) | 8 (2.6%) |
| Installation, Maintenance & Repair | 142 (100.0%) | 0 (0.0%) |
| Total (Category) | 436 (98.2%) | 8 (1.8%) |
| Total (Overall) | 3,142 (47.5%) | 3,474 (52.5%) |
Production, Transportation and Moving Occupations
The most common Production, Transportation and Moving occupations in Lakeside are Transportation (504 | 7.6%), Production (165 | 2.5%), and Material Moving (126 | 1.9%).
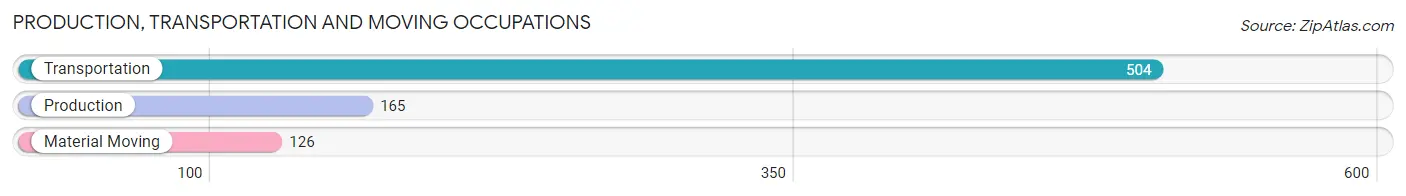
Production, Transportation and Moving Occupations by Sex
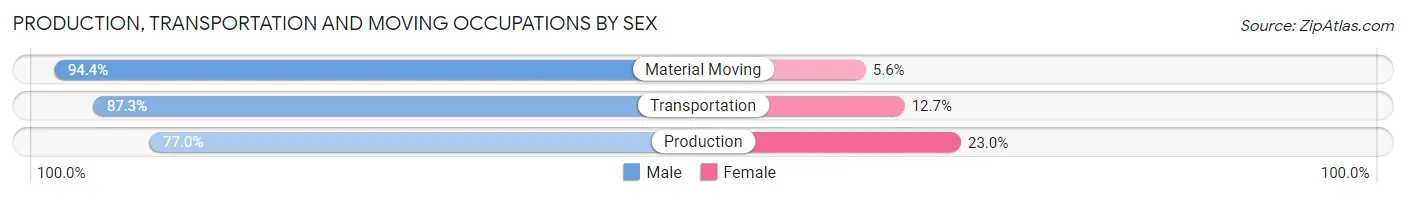
| Occupation | Male | Female |
| Production | 127 (77.0%) | 38 (23.0%) |
| Transportation | 440 (87.3%) | 64 (12.7%) |
| Material Moving | 119 (94.4%) | 7 (5.6%) |
| Total (Category) | 686 (86.3%) | 109 (13.7%) |
| Total (Overall) | 3,142 (47.5%) | 3,474 (52.5%) |
Employment Industries by Sex in Lakeside
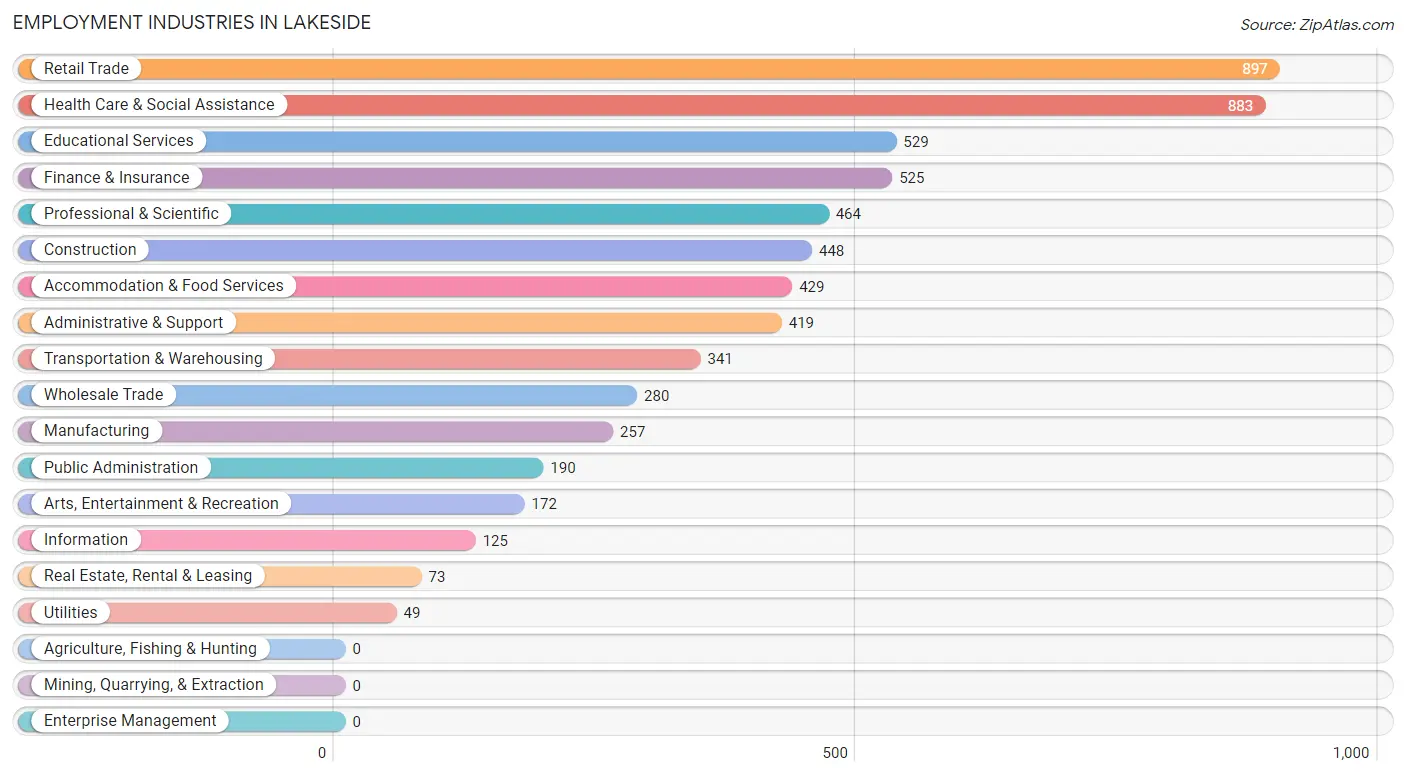
Employment Industries in Lakeside
The major employment industries in Lakeside include Retail Trade (897 | 13.6%), Health Care & Social Assistance (883 | 13.4%), Educational Services (529 | 8.0%), Finance & Insurance (525 | 7.9%), and Professional & Scientific (464 | 7.0%).
Employment Industries by Sex in Lakeside
The Lakeside industries that see more men than women are Construction (91.7%), Real Estate, Rental & Leasing (84.9%), and Transportation & Warehousing (84.2%), whereas the industries that tend to have a higher number of women are Educational Services (74.9%), Professional & Scientific (71.3%), and Health Care & Social Assistance (70.4%).
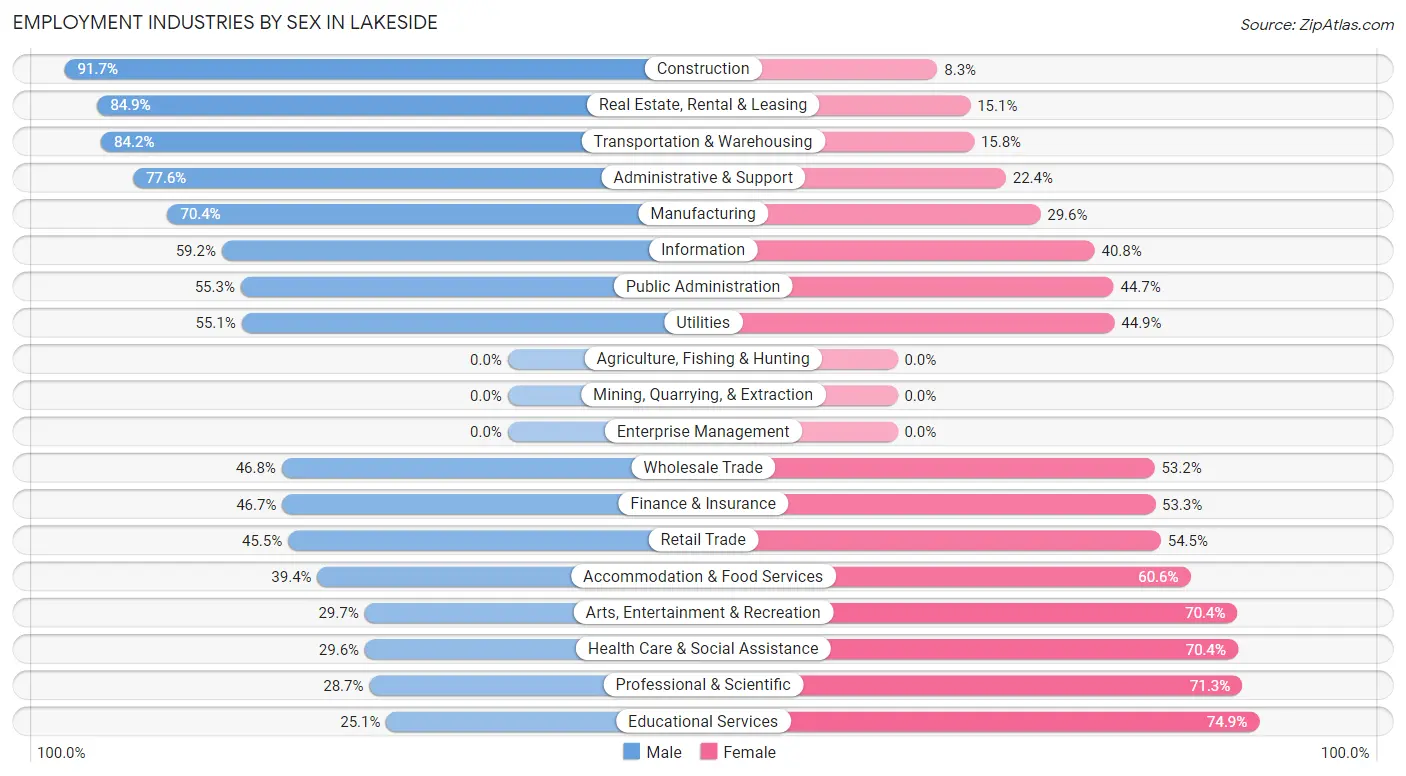
| Industry | Male | Female |
| Agriculture, Fishing & Hunting | 0 (0.0%) | 0 (0.0%) |
| Mining, Quarrying, & Extraction | 0 (0.0%) | 0 (0.0%) |
| Construction | 411 (91.7%) | 37 (8.3%) |
| Manufacturing | 181 (70.4%) | 76 (29.6%) |
| Wholesale Trade | 131 (46.8%) | 149 (53.2%) |
| Retail Trade | 408 (45.5%) | 489 (54.5%) |
| Transportation & Warehousing | 287 (84.2%) | 54 (15.8%) |
| Utilities | 27 (55.1%) | 22 (44.9%) |
| Information | 74 (59.2%) | 51 (40.8%) |
| Finance & Insurance | 245 (46.7%) | 280 (53.3%) |
| Real Estate, Rental & Leasing | 62 (84.9%) | 11 (15.1%) |
| Professional & Scientific | 133 (28.7%) | 331 (71.3%) |
| Enterprise Management | 0 (0.0%) | 0 (0.0%) |
| Administrative & Support | 325 (77.6%) | 94 (22.4%) |
| Educational Services | 133 (25.1%) | 396 (74.9%) |
| Health Care & Social Assistance | 261 (29.6%) | 622 (70.4%) |
| Arts, Entertainment & Recreation | 51 (29.6%) | 121 (70.4%) |
| Accommodation & Food Services | 169 (39.4%) | 260 (60.6%) |
| Public Administration | 105 (55.3%) | 85 (44.7%) |
| Total | 3,142 (47.5%) | 3,474 (52.5%) |
Education in Lakeside
School Enrollment in Lakeside
The most common levels of schooling among the 2,610 students in Lakeside are elementary school (642 | 24.6%), high school (588 | 22.5%), and middle school (537 | 20.6%).
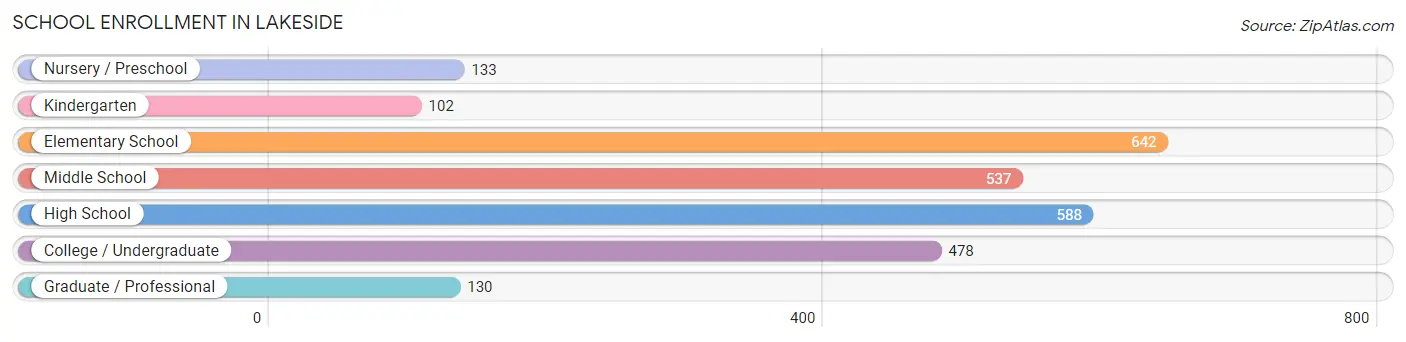
| School Level | # Students | % Students |
| Nursery / Preschool | 133 | 5.1% |
| Kindergarten | 102 | 3.9% |
| Elementary School | 642 | 24.6% |
| Middle School | 537 | 20.6% |
| High School | 588 | 22.5% |
| College / Undergraduate | 478 | 18.3% |
| Graduate / Professional | 130 | 5.0% |
| Total | 2,610 | 100.0% |
School Enrollment by Age by Funding Source in Lakeside
Out of a total of 2,610 students who are enrolled in schools in Lakeside, 253 (9.7%) attend a private institution, while the remaining 2,357 (90.3%) are enrolled in public schools. The age group of 3 to 4 year olds has the highest likelihood of being enrolled in private schools, with 42 (55.3% in the age bracket) enrolled. Conversely, the age group of 20 to 24 year olds has the lowest likelihood of being enrolled in a private school, with 212 (100.0% in the age bracket) attending a public institution.
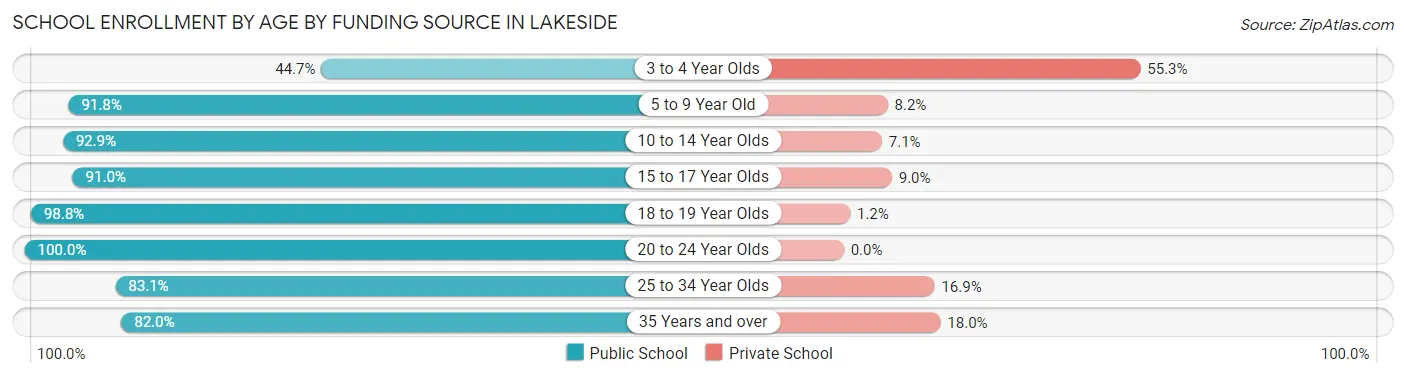
| Age Bracket | Public School | Private School |
| 3 to 4 Year Olds | 34 (44.7%) | 42 (55.3%) |
| 5 to 9 Year Old | 651 (91.8%) | 58 (8.2%) |
| 10 to 14 Year Olds | 810 (92.9%) | 62 (7.1%) |
| 15 to 17 Year Olds | 254 (91.0%) | 25 (9.0%) |
| 18 to 19 Year Olds | 84 (98.8%) | 1 (1.2%) |
| 20 to 24 Year Olds | 212 (100.0%) | 0 (0.0%) |
| 25 to 34 Year Olds | 221 (83.1%) | 45 (16.9%) |
| 35 Years and over | 91 (82.0%) | 20 (18.0%) |
| Total | 2,357 (90.3%) | 253 (9.7%) |
Educational Attainment by Field of Study in Lakeside
Business (487 | 14.6%), science & technology (353 | 10.6%), education (287 | 8.6%), bio, nature & agricultural (281 | 8.4%), and arts & humanities (250 | 7.5%) are the most common fields of study among 3,341 individuals in Lakeside who have obtained a bachelor's degree or higher.
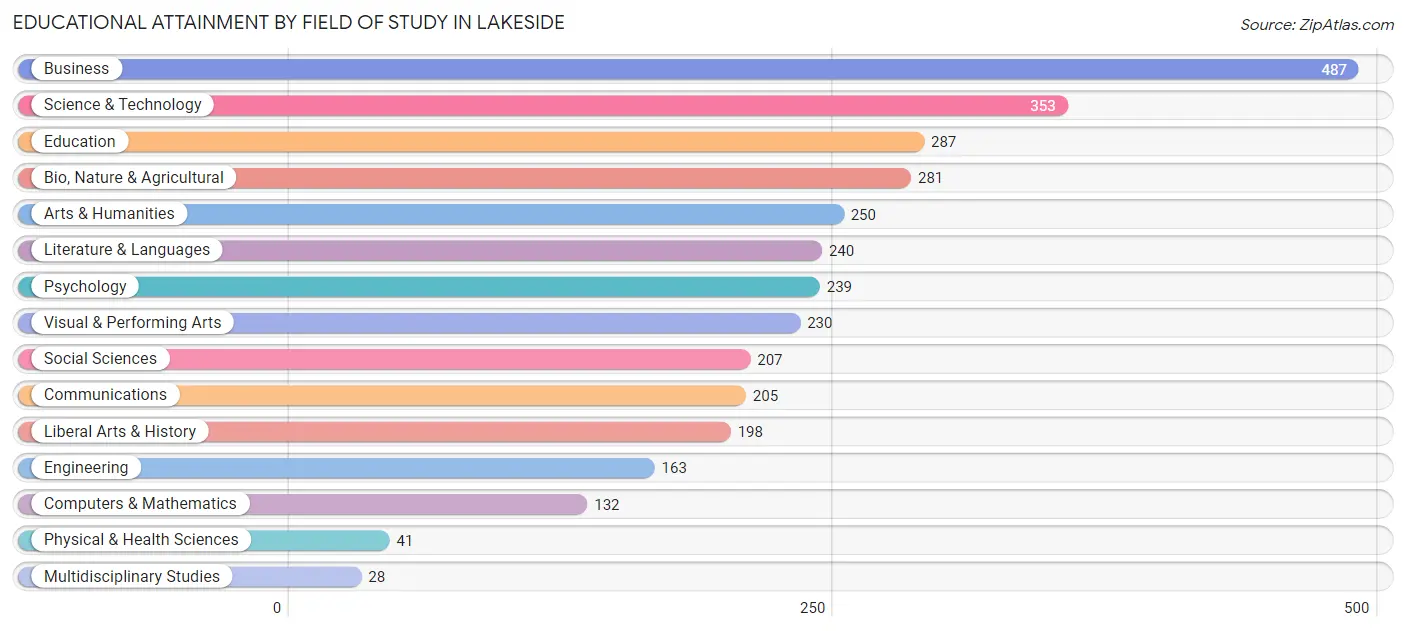
| Field of Study | # Graduates | % Graduates |
| Computers & Mathematics | 132 | 4.0% |
| Bio, Nature & Agricultural | 281 | 8.4% |
| Physical & Health Sciences | 41 | 1.2% |
| Psychology | 239 | 7.1% |
| Social Sciences | 207 | 6.2% |
| Engineering | 163 | 4.9% |
| Multidisciplinary Studies | 28 | 0.8% |
| Science & Technology | 353 | 10.6% |
| Business | 487 | 14.6% |
| Education | 287 | 8.6% |
| Literature & Languages | 240 | 7.2% |
| Liberal Arts & History | 198 | 5.9% |
| Visual & Performing Arts | 230 | 6.9% |
| Communications | 205 | 6.1% |
| Arts & Humanities | 250 | 7.5% |
| Total | 3,341 | 100.0% |
Transportation & Commute in Lakeside
Vehicle Availability by Sex in Lakeside
The most prevalent vehicle ownership categories in Lakeside are males with 2 vehicles (1,801, accounting for 55.5%) and females with 2 vehicles (1,352, making up 53.3%).
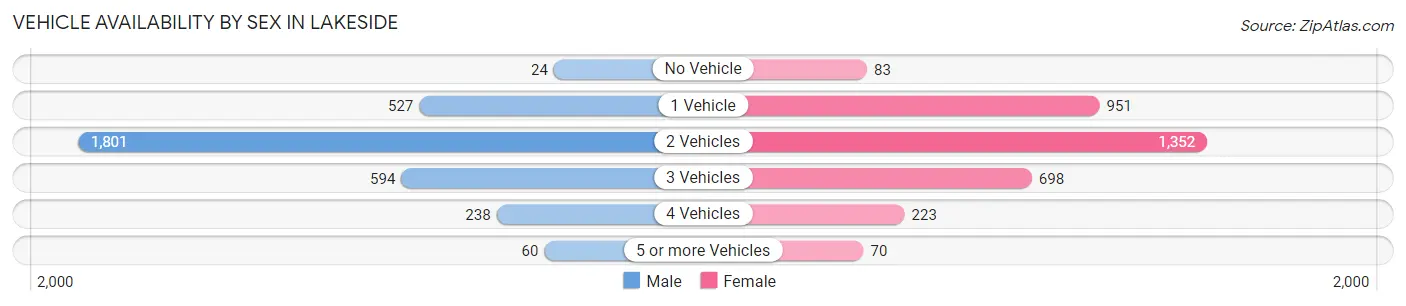
| Vehicles Available | Male | Female |
| No Vehicle | 24 (0.7%) | 83 (2.5%) |
| 1 Vehicle | 527 (16.3%) | 951 (28.2%) |
| 2 Vehicles | 1,801 (55.5%) | 1,352 (40.0%) |
| 3 Vehicles | 594 (18.3%) | 698 (20.7%) |
| 4 Vehicles | 238 (7.3%) | 223 (6.6%) |
| 5 or more Vehicles | 60 (1.8%) | 70 (2.1%) |
| Total | 3,244 (100.0%) | 3,377 (100.0%) |
Commute Time in Lakeside
The most frequently occuring commute durations in Lakeside are 20 to 24 minutes (1,300 commuters, 24.4%), 15 to 19 minutes (1,206 commuters, 22.7%), and 10 to 14 minutes (737 commuters, 13.8%).
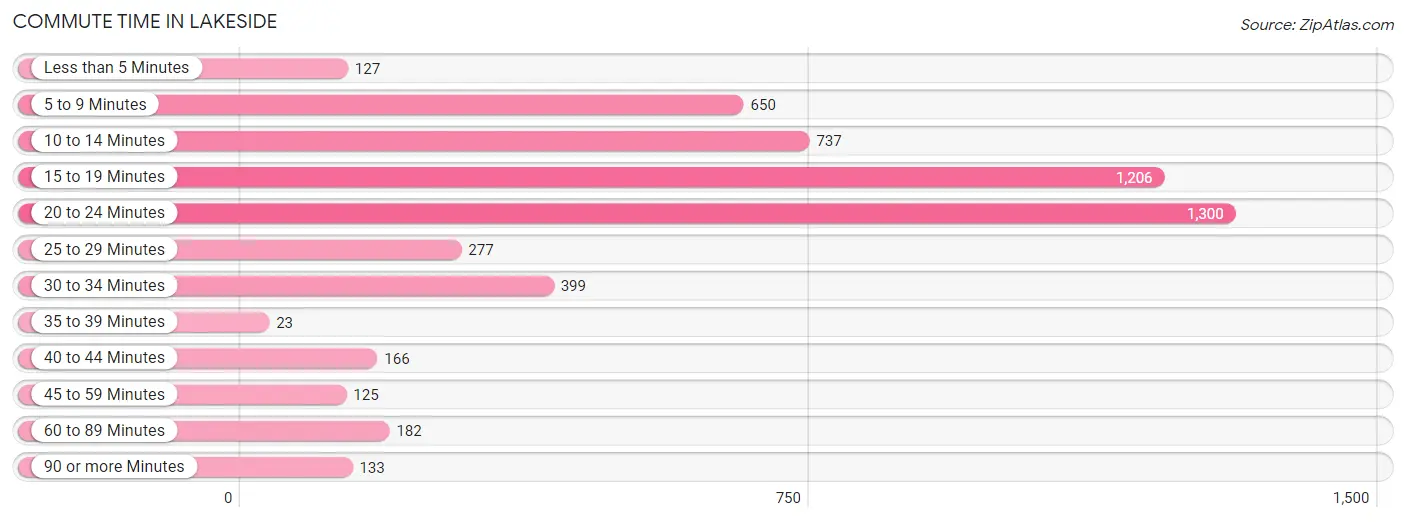
| Commute Time | # Commuters | % Commuters |
| Less than 5 Minutes | 127 | 2.4% |
| 5 to 9 Minutes | 650 | 12.2% |
| 10 to 14 Minutes | 737 | 13.8% |
| 15 to 19 Minutes | 1,206 | 22.7% |
| 20 to 24 Minutes | 1,300 | 24.4% |
| 25 to 29 Minutes | 277 | 5.2% |
| 30 to 34 Minutes | 399 | 7.5% |
| 35 to 39 Minutes | 23 | 0.4% |
| 40 to 44 Minutes | 166 | 3.1% |
| 45 to 59 Minutes | 125 | 2.4% |
| 60 to 89 Minutes | 182 | 3.4% |
| 90 or more Minutes | 133 | 2.5% |
Commute Time by Sex in Lakeside
The most common commute times in Lakeside are 20 to 24 minutes (597 commuters, 23.1%) for males and 15 to 19 minutes (775 commuters, 28.2%) for females.
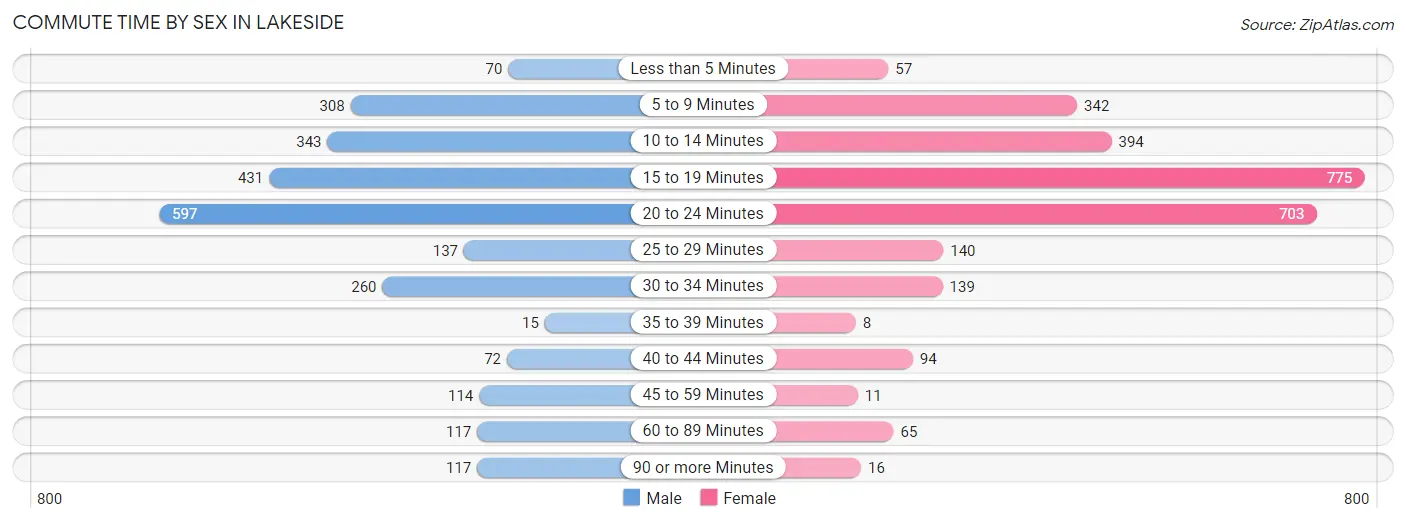
| Commute Time | Male | Female |
| Less than 5 Minutes | 70 (2.7%) | 57 (2.1%) |
| 5 to 9 Minutes | 308 (11.9%) | 342 (12.5%) |
| 10 to 14 Minutes | 343 (13.3%) | 394 (14.4%) |
| 15 to 19 Minutes | 431 (16.7%) | 775 (28.2%) |
| 20 to 24 Minutes | 597 (23.1%) | 703 (25.6%) |
| 25 to 29 Minutes | 137 (5.3%) | 140 (5.1%) |
| 30 to 34 Minutes | 260 (10.1%) | 139 (5.1%) |
| 35 to 39 Minutes | 15 (0.6%) | 8 (0.3%) |
| 40 to 44 Minutes | 72 (2.8%) | 94 (3.4%) |
| 45 to 59 Minutes | 114 (4.4%) | 11 (0.4%) |
| 60 to 89 Minutes | 117 (4.5%) | 65 (2.4%) |
| 90 or more Minutes | 117 (4.5%) | 16 (0.6%) |
Time of Departure to Work by Sex in Lakeside
The most frequent times of departure to work in Lakeside are 7:00 AM to 7:29 AM (503, 19.5%) for males and 8:00 AM to 8:29 AM (538, 19.6%) for females.
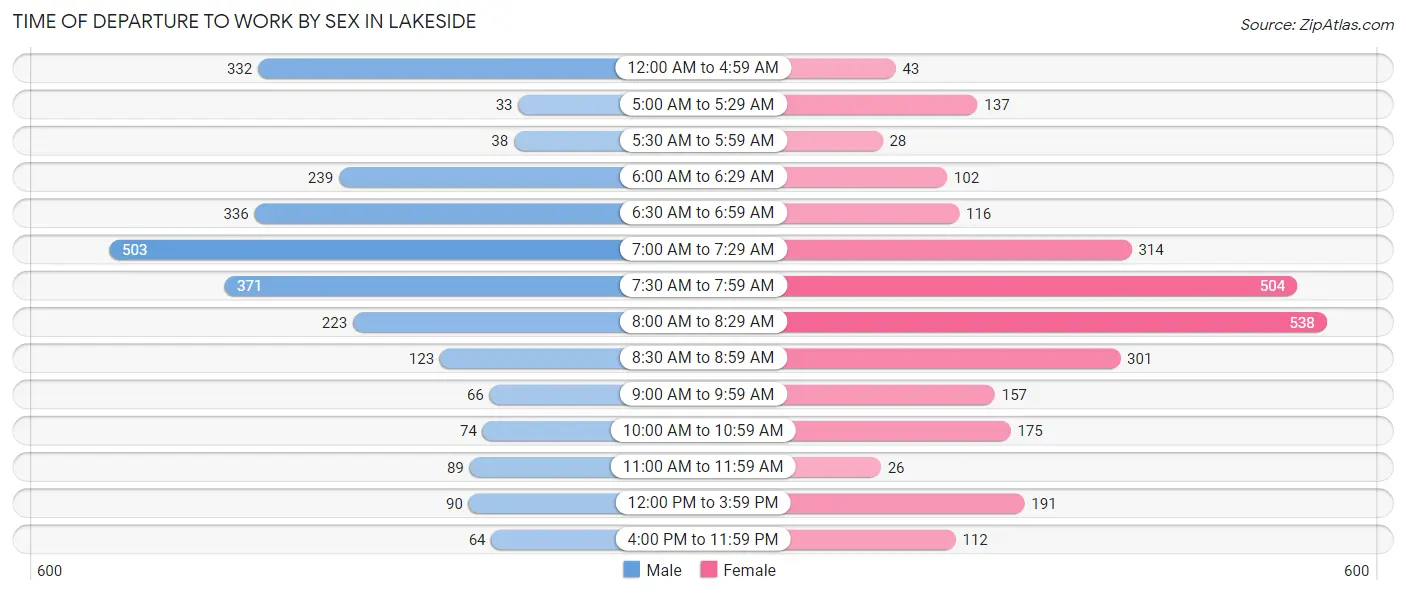
| Time of Departure | Male | Female |
| 12:00 AM to 4:59 AM | 332 (12.9%) | 43 (1.6%) |
| 5:00 AM to 5:29 AM | 33 (1.3%) | 137 (5.0%) |
| 5:30 AM to 5:59 AM | 38 (1.5%) | 28 (1.0%) |
| 6:00 AM to 6:29 AM | 239 (9.3%) | 102 (3.7%) |
| 6:30 AM to 6:59 AM | 336 (13.0%) | 116 (4.2%) |
| 7:00 AM to 7:29 AM | 503 (19.5%) | 314 (11.4%) |
| 7:30 AM to 7:59 AM | 371 (14.4%) | 504 (18.4%) |
| 8:00 AM to 8:29 AM | 223 (8.6%) | 538 (19.6%) |
| 8:30 AM to 8:59 AM | 123 (4.8%) | 301 (11.0%) |
| 9:00 AM to 9:59 AM | 66 (2.6%) | 157 (5.7%) |
| 10:00 AM to 10:59 AM | 74 (2.9%) | 175 (6.4%) |
| 11:00 AM to 11:59 AM | 89 (3.5%) | 26 (0.9%) |
| 12:00 PM to 3:59 PM | 90 (3.5%) | 191 (7.0%) |
| 4:00 PM to 11:59 PM | 64 (2.5%) | 112 (4.1%) |
| Total | 2,581 (100.0%) | 2,744 (100.0%) |
Housing Occupancy in Lakeside
Occupancy by Ownership in Lakeside
Of the total 5,345 dwellings in Lakeside, owner-occupied units account for 3,346 (62.6%), while renter-occupied units make up 1,999 (37.4%).
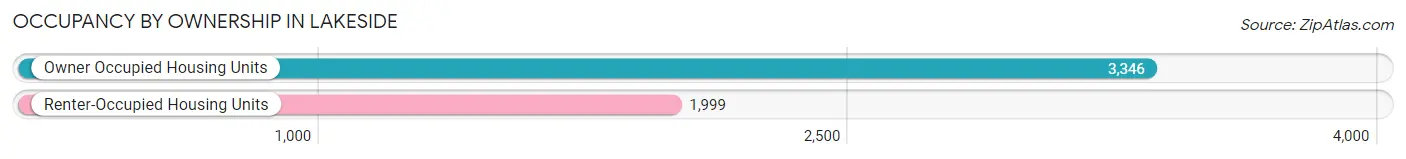
| Occupancy | # Housing Units | % Housing Units |
| Owner Occupied Housing Units | 3,346 | 62.6% |
| Renter-Occupied Housing Units | 1,999 | 37.4% |
| Total Occupied Housing Units | 5,345 | 100.0% |
Occupancy by Household Size in Lakeside
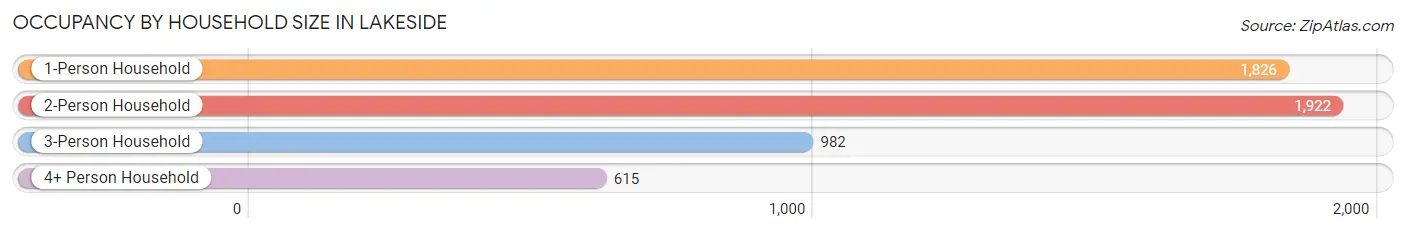
| Household Size | # Housing Units | % Housing Units |
| 1-Person Household | 1,826 | 34.2% |
| 2-Person Household | 1,922 | 36.0% |
| 3-Person Household | 982 | 18.4% |
| 4+ Person Household | 615 | 11.5% |
| Total Housing Units | 5,345 | 100.0% |
Occupancy by Ownership by Household Size in Lakeside
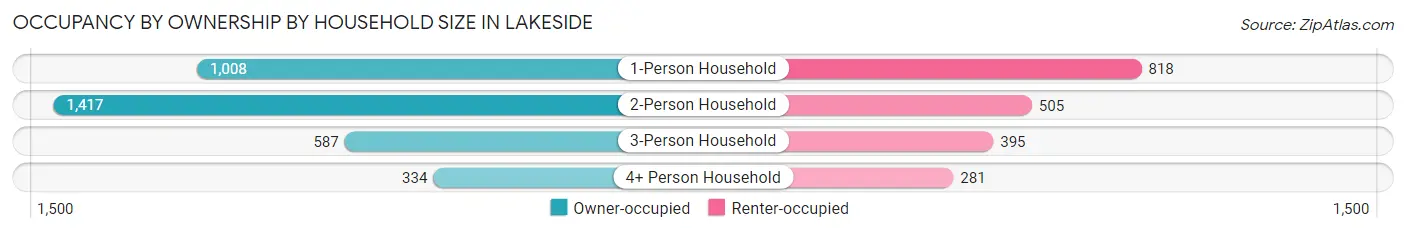
| Household Size | Owner-occupied | Renter-occupied |
| 1-Person Household | 1,008 (55.2%) | 818 (44.8%) |
| 2-Person Household | 1,417 (73.7%) | 505 (26.3%) |
| 3-Person Household | 587 (59.8%) | 395 (40.2%) |
| 4+ Person Household | 334 (54.3%) | 281 (45.7%) |
| Total Housing Units | 3,346 (62.6%) | 1,999 (37.4%) |
Occupancy by Educational Attainment in Lakeside
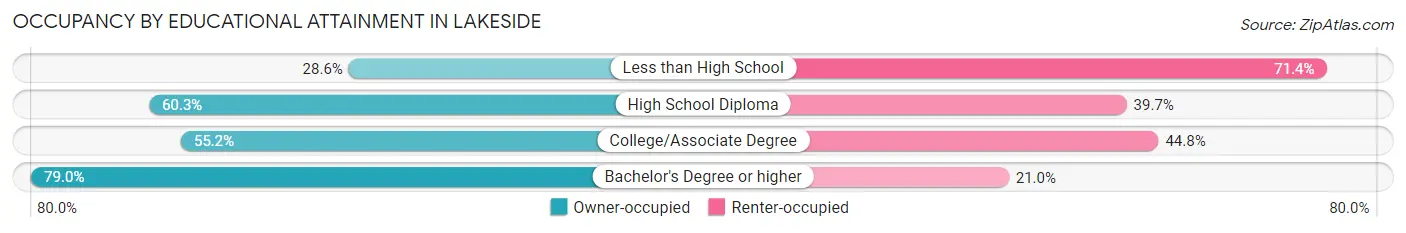
| Household Size | Owner-occupied | Renter-occupied |
| Less than High School | 145 (28.6%) | 362 (71.4%) |
| High School Diploma | 713 (60.3%) | 470 (39.7%) |
| College/Associate Degree | 926 (55.2%) | 751 (44.8%) |
| Bachelor's Degree or higher | 1,562 (79.0%) | 416 (21.0%) |
Occupancy by Age of Householder in Lakeside
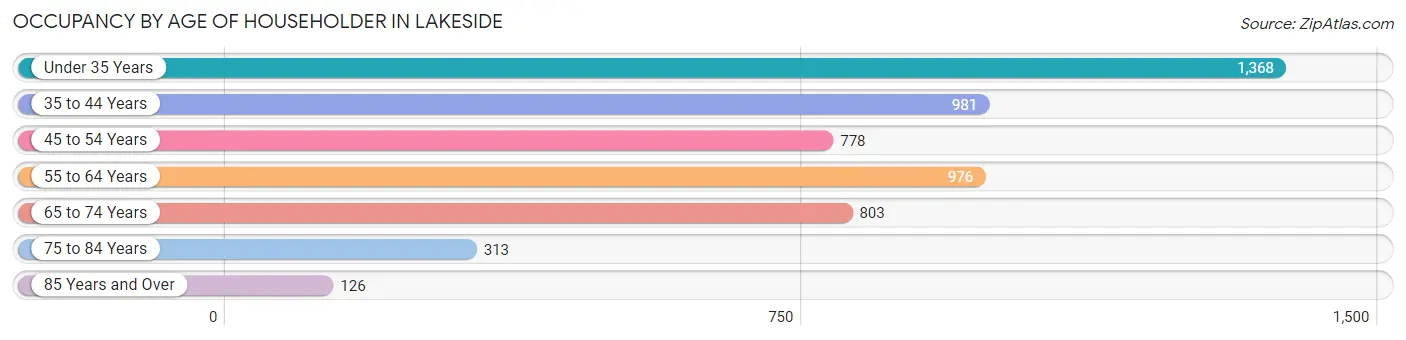
| Age Bracket | # Households | % Households |
| Under 35 Years | 1,368 | 25.6% |
| 35 to 44 Years | 981 | 18.3% |
| 45 to 54 Years | 778 | 14.6% |
| 55 to 64 Years | 976 | 18.3% |
| 65 to 74 Years | 803 | 15.0% |
| 75 to 84 Years | 313 | 5.9% |
| 85 Years and Over | 126 | 2.4% |
| Total | 5,345 | 100.0% |
Housing Finances in Lakeside
Median Income by Occupancy in Lakeside
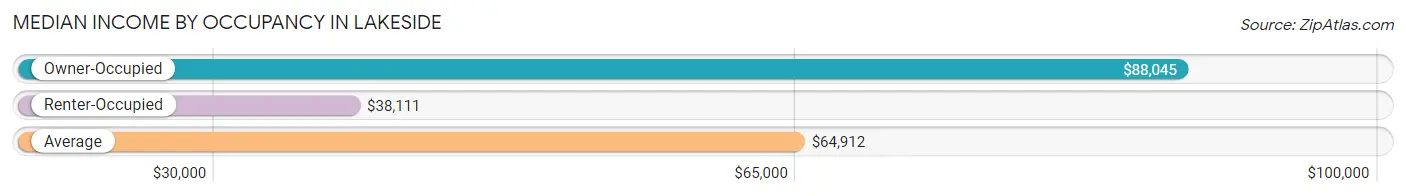
| Occupancy Type | # Households | Median Income |
| Owner-Occupied | 3,346 (62.6%) | $88,045 |
| Renter-Occupied | 1,999 (37.4%) | $38,111 |
| Average | 5,345 (100.0%) | $64,912 |
Occupancy by Householder Income Bracket in Lakeside
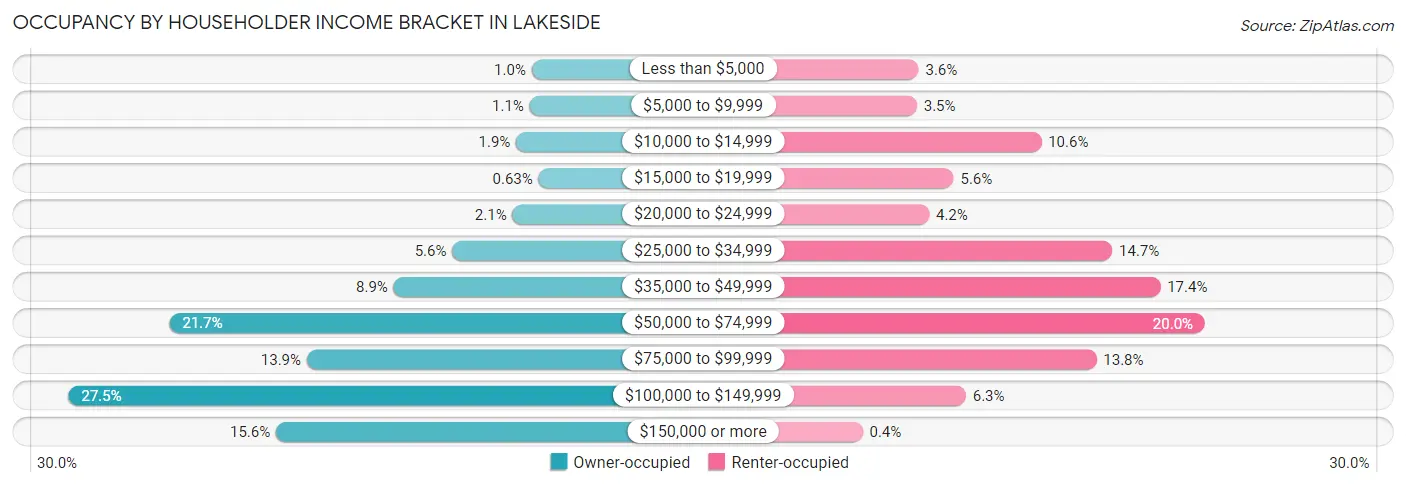
| Income Bracket | Owner-occupied | Renter-occupied |
| Less than $5,000 | 34 (1.0%) | 72 (3.6%) |
| $5,000 to $9,999 | 38 (1.1%) | 70 (3.5%) |
| $10,000 to $14,999 | 64 (1.9%) | 212 (10.6%) |
| $15,000 to $19,999 | 21 (0.6%) | 112 (5.6%) |
| $20,000 to $24,999 | 71 (2.1%) | 84 (4.2%) |
| $25,000 to $34,999 | 186 (5.6%) | 293 (14.7%) |
| $35,000 to $49,999 | 298 (8.9%) | 348 (17.4%) |
| $50,000 to $74,999 | 727 (21.7%) | 399 (20.0%) |
| $75,000 to $99,999 | 464 (13.9%) | 275 (13.8%) |
| $100,000 to $149,999 | 920 (27.5%) | 126 (6.3%) |
| $150,000 or more | 523 (15.6%) | 8 (0.4%) |
| Total | 3,346 (100.0%) | 1,999 (100.0%) |
Monthly Housing Cost Tiers in Lakeside
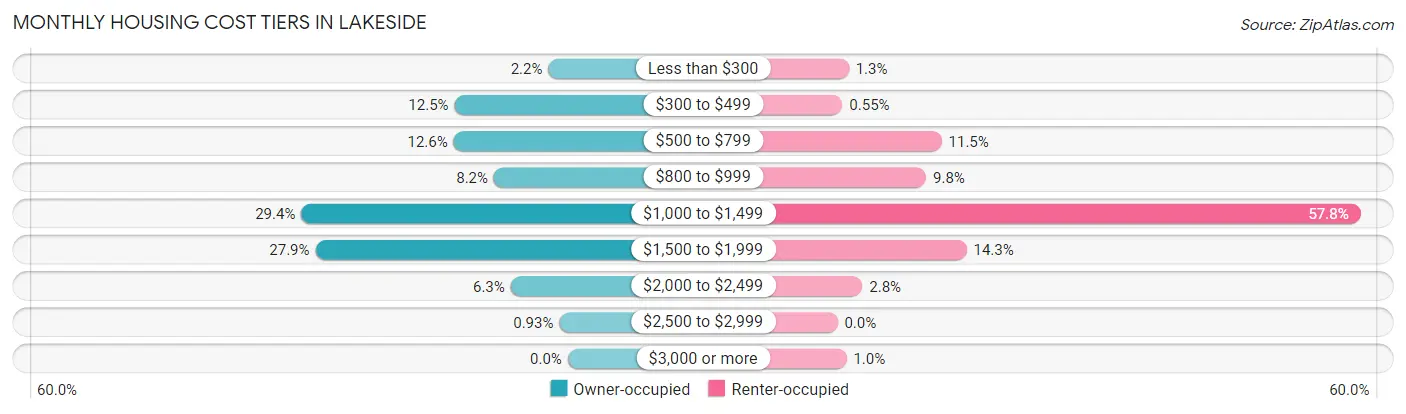
| Monthly Cost | Owner-occupied | Renter-occupied |
| Less than $300 | 72 (2.1%) | 25 (1.3%) |
| $300 to $499 | 419 (12.5%) | 11 (0.5%) |
| $500 to $799 | 422 (12.6%) | 230 (11.5%) |
| $800 to $999 | 273 (8.2%) | 196 (9.8%) |
| $1,000 to $1,499 | 985 (29.4%) | 1,155 (57.8%) |
| $1,500 to $1,999 | 933 (27.9%) | 285 (14.3%) |
| $2,000 to $2,499 | 211 (6.3%) | 55 (2.8%) |
| $2,500 to $2,999 | 31 (0.9%) | 0 (0.0%) |
| $3,000 or more | 0 (0.0%) | 20 (1.0%) |
| Total | 3,346 (100.0%) | 1,999 (100.0%) |
Physical Housing Characteristics in Lakeside
Housing Structures in Lakeside
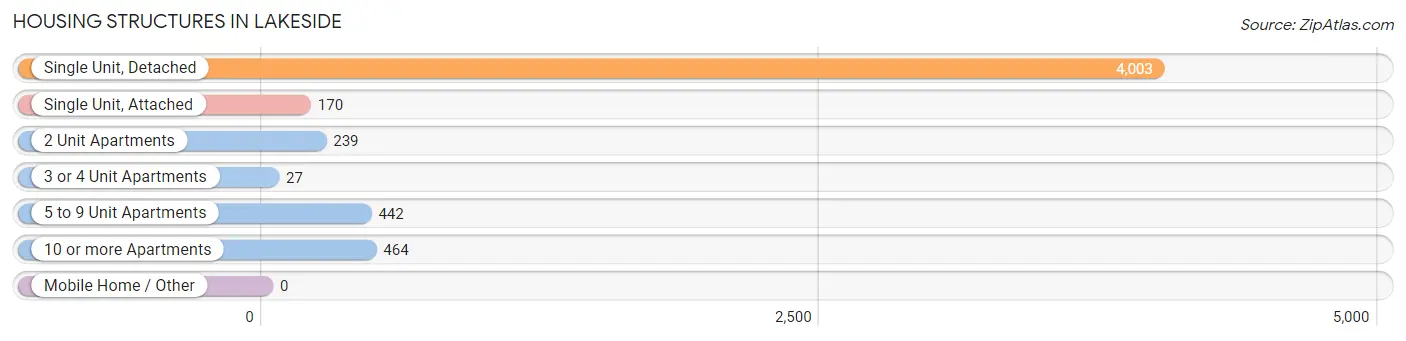
| Structure Type | # Housing Units | % Housing Units |
| Single Unit, Detached | 4,003 | 74.9% |
| Single Unit, Attached | 170 | 3.2% |
| 2 Unit Apartments | 239 | 4.5% |
| 3 or 4 Unit Apartments | 27 | 0.5% |
| 5 to 9 Unit Apartments | 442 | 8.3% |
| 10 or more Apartments | 464 | 8.7% |
| Mobile Home / Other | 0 | 0.0% |
| Total | 5,345 | 100.0% |
Housing Structures by Occupancy in Lakeside
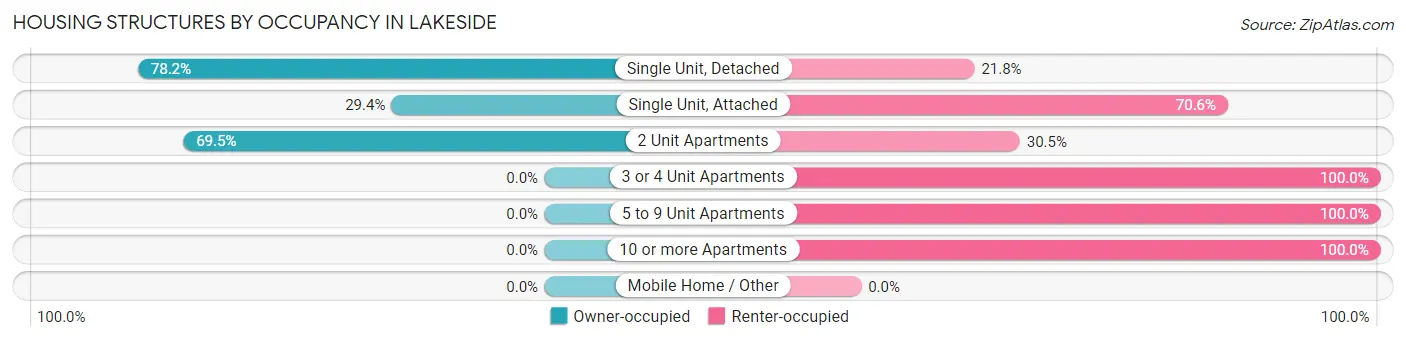
| Structure Type | Owner-occupied | Renter-occupied |
| Single Unit, Detached | 3,130 (78.2%) | 873 (21.8%) |
| Single Unit, Attached | 50 (29.4%) | 120 (70.6%) |
| 2 Unit Apartments | 166 (69.5%) | 73 (30.5%) |
| 3 or 4 Unit Apartments | 0 (0.0%) | 27 (100.0%) |
| 5 to 9 Unit Apartments | 0 (0.0%) | 442 (100.0%) |
| 10 or more Apartments | 0 (0.0%) | 464 (100.0%) |
| Mobile Home / Other | 0 (0.0%) | 0 (0.0%) |
| Total | 3,346 (62.6%) | 1,999 (37.4%) |
Housing Structures by Number of Rooms in Lakeside
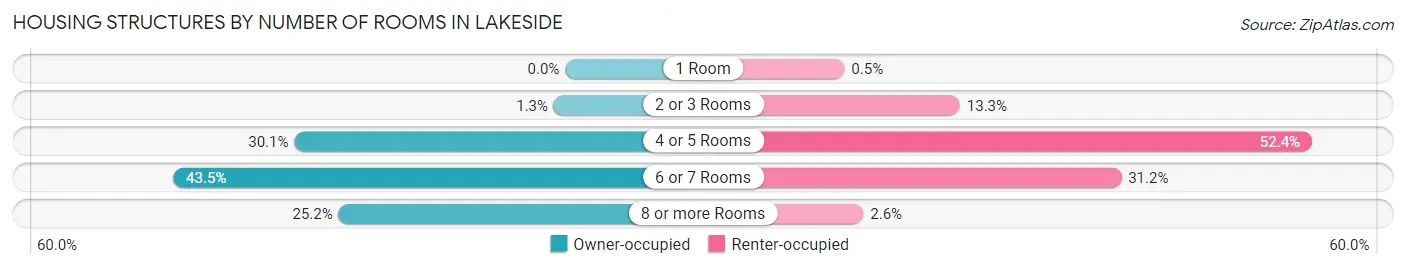
| Number of Rooms | Owner-occupied | Renter-occupied |
| 1 Room | 0 (0.0%) | 10 (0.5%) |
| 2 or 3 Rooms | 42 (1.3%) | 266 (13.3%) |
| 4 or 5 Rooms | 1,006 (30.1%) | 1,047 (52.4%) |
| 6 or 7 Rooms | 1,456 (43.5%) | 624 (31.2%) |
| 8 or more Rooms | 842 (25.2%) | 52 (2.6%) |
| Total | 3,346 (100.0%) | 1,999 (100.0%) |
Housing Structure by Heating Type in Lakeside
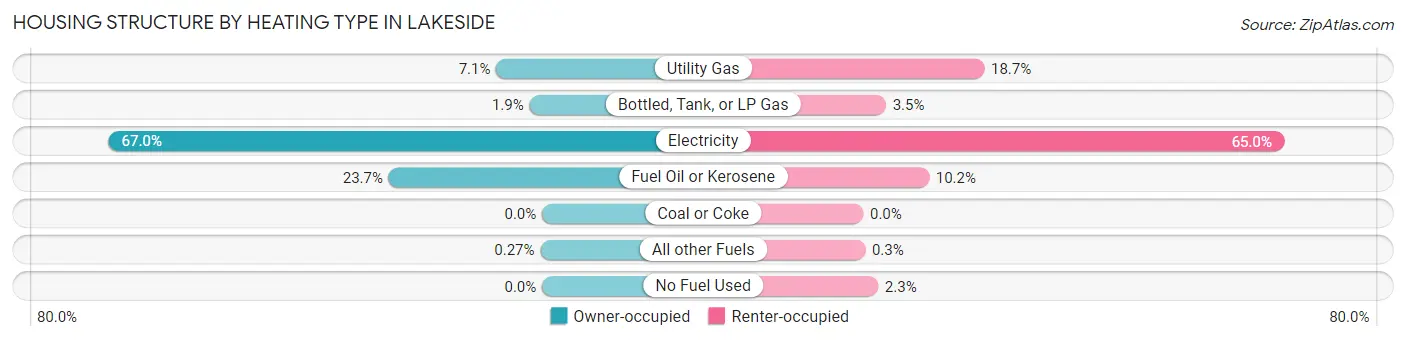
| Heating Type | Owner-occupied | Renter-occupied |
| Utility Gas | 237 (7.1%) | 374 (18.7%) |
| Bottled, Tank, or LP Gas | 65 (1.9%) | 70 (3.5%) |
| Electricity | 2,242 (67.0%) | 1,300 (65.0%) |
| Fuel Oil or Kerosene | 793 (23.7%) | 203 (10.2%) |
| Coal or Coke | 0 (0.0%) | 0 (0.0%) |
| All other Fuels | 9 (0.3%) | 6 (0.3%) |
| No Fuel Used | 0 (0.0%) | 46 (2.3%) |
| Total | 3,346 (100.0%) | 1,999 (100.0%) |
Household Vehicle Usage in Lakeside
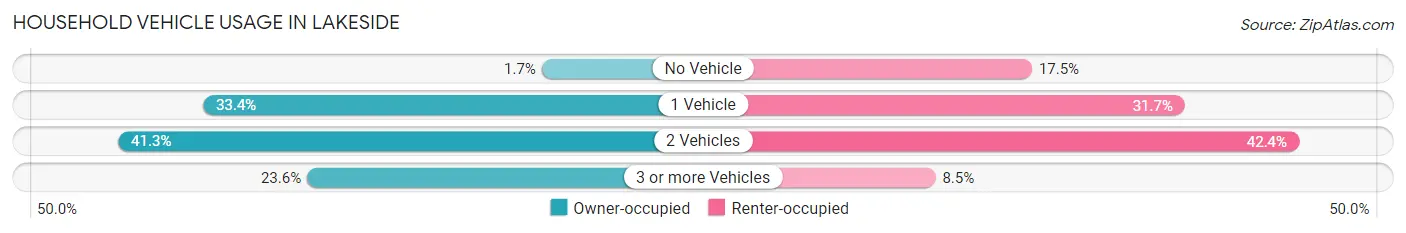
| Vehicles per Household | Owner-occupied | Renter-occupied |
| No Vehicle | 58 (1.7%) | 349 (17.5%) |
| 1 Vehicle | 1,116 (33.4%) | 634 (31.7%) |
| 2 Vehicles | 1,381 (41.3%) | 847 (42.4%) |
| 3 or more Vehicles | 791 (23.6%) | 169 (8.5%) |
| Total | 3,346 (100.0%) | 1,999 (100.0%) |
Real Estate & Mortgages in Lakeside
Real Estate and Mortgage Overview in Lakeside
| Characteristic | Without Mortgage | With Mortgage |
| Housing Units | 826 | 2,520 |
| Median Property Value | $238,100 | $257,000 |
| Median Household Income | $81,000 | $394 |
| Monthly Housing Costs | $486 | $0 |
| Real Estate Taxes | $1,717 | $187 |
Property Value by Mortgage Status in Lakeside
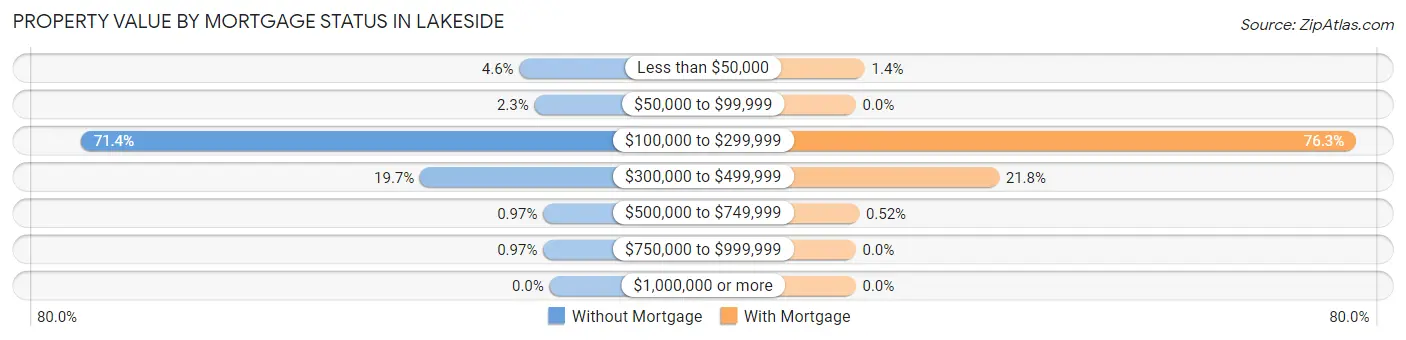
| Property Value | Without Mortgage | With Mortgage |
| Less than $50,000 | 38 (4.6%) | 35 (1.4%) |
| $50,000 to $99,999 | 19 (2.3%) | 0 (0.0%) |
| $100,000 to $299,999 | 590 (71.4%) | 1,922 (76.3%) |
| $300,000 to $499,999 | 163 (19.7%) | 550 (21.8%) |
| $500,000 to $749,999 | 8 (1.0%) | 13 (0.5%) |
| $750,000 to $999,999 | 8 (1.0%) | 0 (0.0%) |
| $1,000,000 or more | 0 (0.0%) | 0 (0.0%) |
| Total | 826 (100.0%) | 2,520 (100.0%) |
Household Income by Mortgage Status in Lakeside
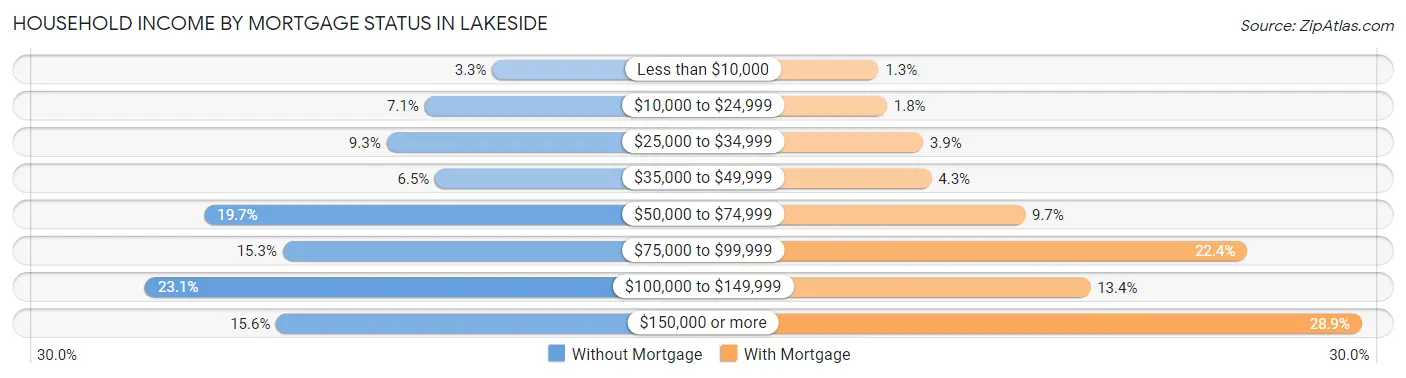
| Household Income | Without Mortgage | With Mortgage |
| Less than $10,000 | 27 (3.3%) | 33 (1.3%) |
| $10,000 to $24,999 | 59 (7.1%) | 45 (1.8%) |
| $25,000 to $34,999 | 77 (9.3%) | 97 (3.8%) |
| $35,000 to $49,999 | 54 (6.5%) | 109 (4.3%) |
| $50,000 to $74,999 | 163 (19.7%) | 244 (9.7%) |
| $75,000 to $99,999 | 126 (15.2%) | 564 (22.4%) |
| $100,000 to $149,999 | 191 (23.1%) | 338 (13.4%) |
| $150,000 or more | 129 (15.6%) | 729 (28.9%) |
| Total | 826 (100.0%) | 2,520 (100.0%) |
Property Value to Household Income Ratio in Lakeside
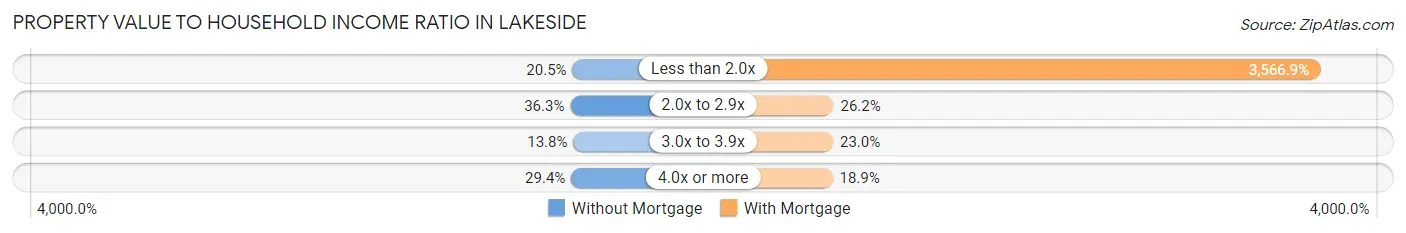
| Value-to-Income Ratio | Without Mortgage | With Mortgage |
| Less than 2.0x | 169 (20.5%) | 89,886 (3,566.9%) |
| 2.0x to 2.9x | 300 (36.3%) | 659 (26.2%) |
| 3.0x to 3.9x | 114 (13.8%) | 579 (23.0%) |
| 4.0x or more | 243 (29.4%) | 477 (18.9%) |
| Total | 826 (100.0%) | 2,520 (100.0%) |
Real Estate Taxes by Mortgage Status in Lakeside
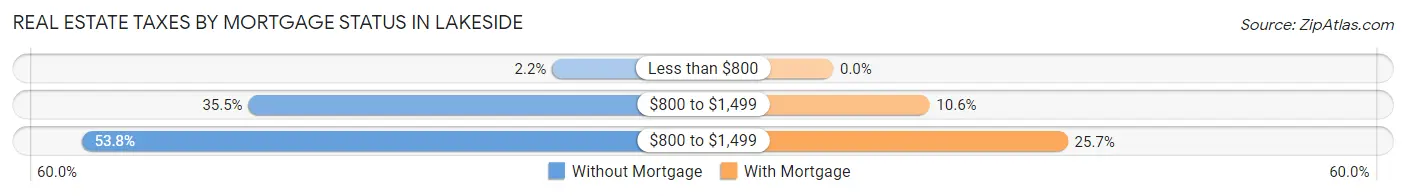
| Property Taxes | Without Mortgage | With Mortgage |
| Less than $800 | 18 (2.2%) | 0 (0.0%) |
| $800 to $1,499 | 293 (35.5%) | 266 (10.6%) |
| $800 to $1,499 | 444 (53.7%) | 648 (25.7%) |
| Total | 826 (100.0%) | 2,520 (100.0%) |
Health & Disability in Lakeside
Health Insurance Coverage by Age in Lakeside
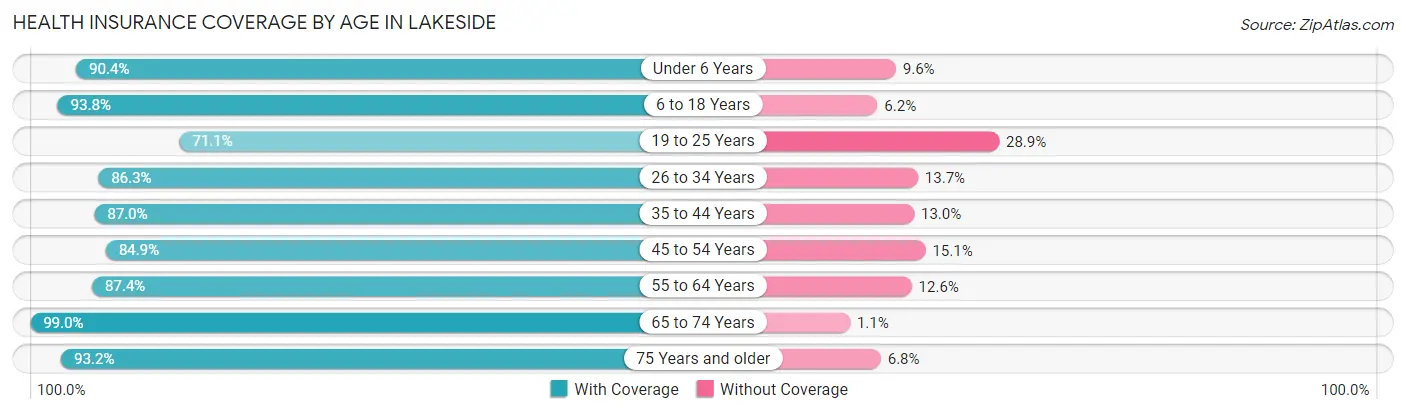
| Age Bracket | With Coverage | Without Coverage |
| Under 6 Years | 583 (90.4%) | 62 (9.6%) |
| 6 to 18 Years | 1,734 (93.8%) | 114 (6.2%) |
| 19 to 25 Years | 678 (71.1%) | 275 (28.9%) |
| 26 to 34 Years | 1,721 (86.3%) | 274 (13.7%) |
| 35 to 44 Years | 1,411 (87.0%) | 211 (13.0%) |
| 45 to 54 Years | 1,132 (84.9%) | 202 (15.1%) |
| 55 to 64 Years | 1,406 (87.4%) | 202 (12.6%) |
| 65 to 74 Years | 1,230 (99.0%) | 13 (1.1%) |
| 75 Years and older | 576 (93.2%) | 42 (6.8%) |
| Total | 10,471 (88.2%) | 1,395 (11.8%) |
Health Insurance Coverage by Citizenship Status in Lakeside
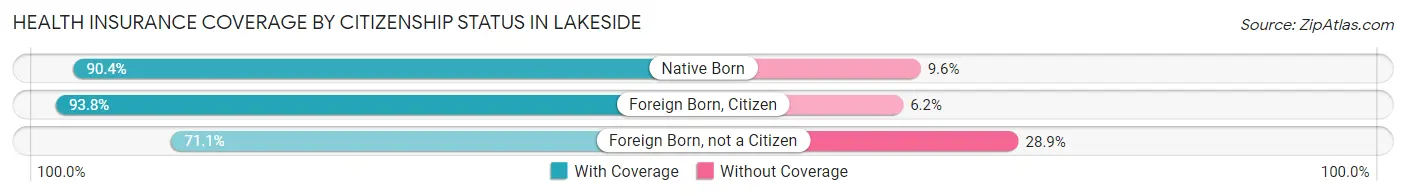
| Citizenship Status | With Coverage | Without Coverage |
| Native Born | 583 (90.4%) | 62 (9.6%) |
| Foreign Born, Citizen | 1,734 (93.8%) | 114 (6.2%) |
| Foreign Born, not a Citizen | 678 (71.1%) | 275 (28.9%) |
Health Insurance Coverage by Household Income in Lakeside
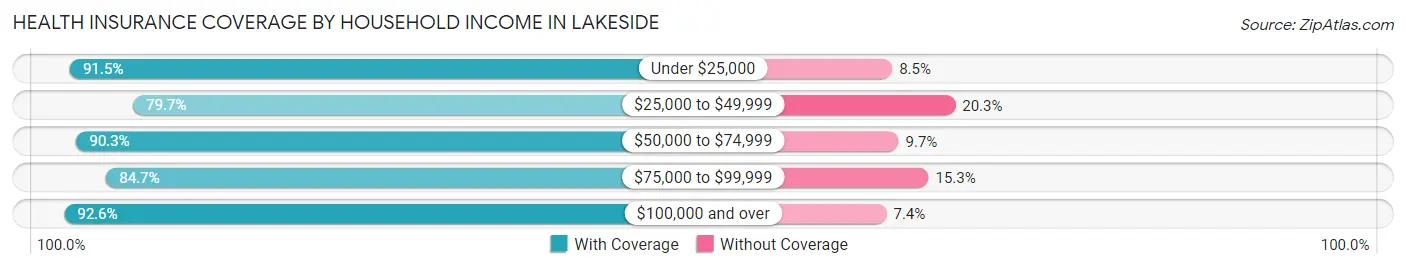
| Household Income | With Coverage | Without Coverage |
| Under $25,000 | 1,053 (91.5%) | 98 (8.5%) |
| $25,000 to $49,999 | 1,810 (79.7%) | 462 (20.3%) |
| $50,000 to $74,999 | 2,066 (90.3%) | 222 (9.7%) |
| $75,000 to $99,999 | 1,647 (84.7%) | 298 (15.3%) |
| $100,000 and over | 3,892 (92.6%) | 313 (7.4%) |
Public vs Private Health Insurance Coverage by Age in Lakeside
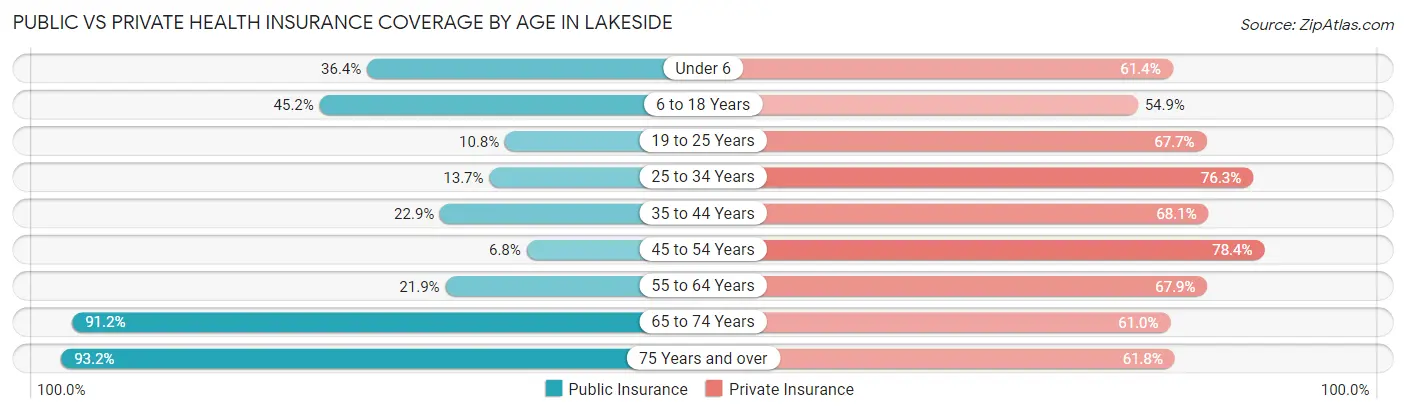
| Age Bracket | Public Insurance | Private Insurance |
| Under 6 | 235 (36.4%) | 396 (61.4%) |
| 6 to 18 Years | 836 (45.2%) | 1,015 (54.9%) |
| 19 to 25 Years | 103 (10.8%) | 645 (67.7%) |
| 25 to 34 Years | 274 (13.7%) | 1,523 (76.3%) |
| 35 to 44 Years | 371 (22.9%) | 1,104 (68.1%) |
| 45 to 54 Years | 91 (6.8%) | 1,046 (78.4%) |
| 55 to 64 Years | 352 (21.9%) | 1,091 (67.8%) |
| 65 to 74 Years | 1,133 (91.1%) | 758 (61.0%) |
| 75 Years and over | 576 (93.2%) | 382 (61.8%) |
| Total | 3,971 (33.5%) | 7,960 (67.1%) |
Disability Status by Sex by Age in Lakeside
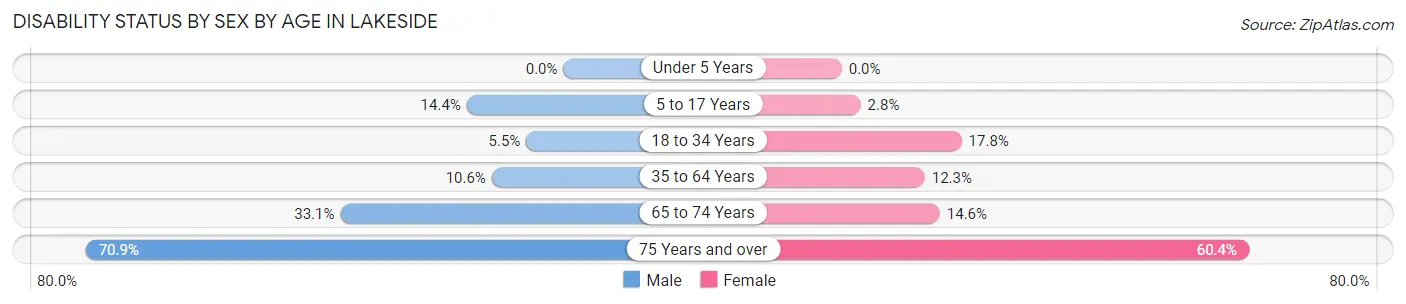
| Age Bracket | Male | Female |
| Under 5 Years | 0 (0.0%) | 0 (0.0%) |
| 5 to 17 Years | 159 (14.4%) | 24 (2.8%) |
| 18 to 34 Years | 66 (5.5%) | 314 (17.8%) |
| 35 to 64 Years | 238 (10.6%) | 287 (12.3%) |
| 65 to 74 Years | 207 (33.1%) | 90 (14.6%) |
| 75 Years and over | 139 (70.9%) | 255 (60.4%) |
Disability Class by Sex by Age in Lakeside
Disability Class: Hearing Difficulty
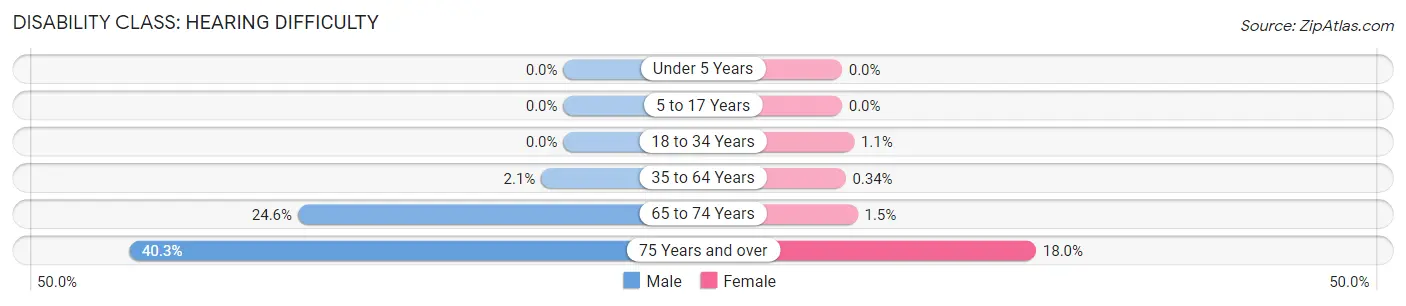
| Age Bracket | Male | Female |
| Under 5 Years | 0 (0.0%) | 0 (0.0%) |
| 5 to 17 Years | 0 (0.0%) | 0 (0.0%) |
| 18 to 34 Years | 0 (0.0%) | 20 (1.1%) |
| 35 to 64 Years | 46 (2.1%) | 8 (0.3%) |
| 65 to 74 Years | 154 (24.6%) | 9 (1.5%) |
| 75 Years and over | 79 (40.3%) | 76 (18.0%) |
Disability Class: Vision Difficulty
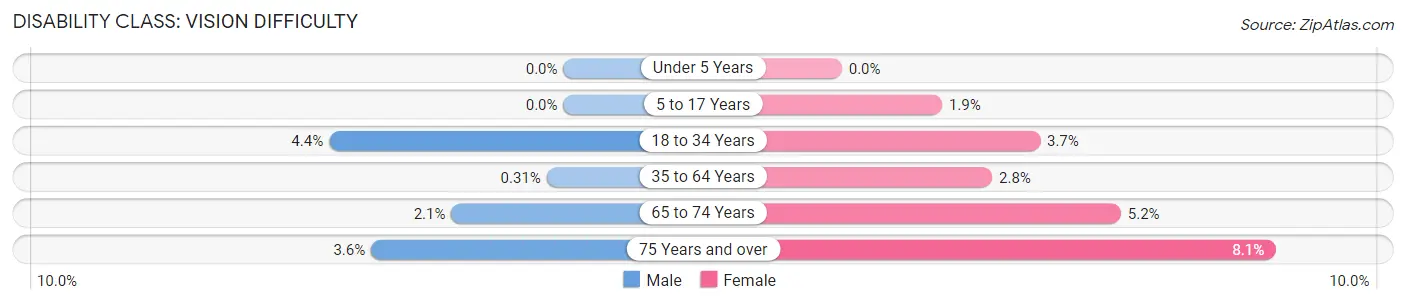
| Age Bracket | Male | Female |
| Under 5 Years | 0 (0.0%) | 0 (0.0%) |
| 5 to 17 Years | 0 (0.0%) | 16 (1.9%) |
| 18 to 34 Years | 52 (4.3%) | 65 (3.7%) |
| 35 to 64 Years | 7 (0.3%) | 65 (2.8%) |
| 65 to 74 Years | 13 (2.1%) | 32 (5.2%) |
| 75 Years and over | 7 (3.6%) | 34 (8.1%) |
Disability Class: Cognitive Difficulty
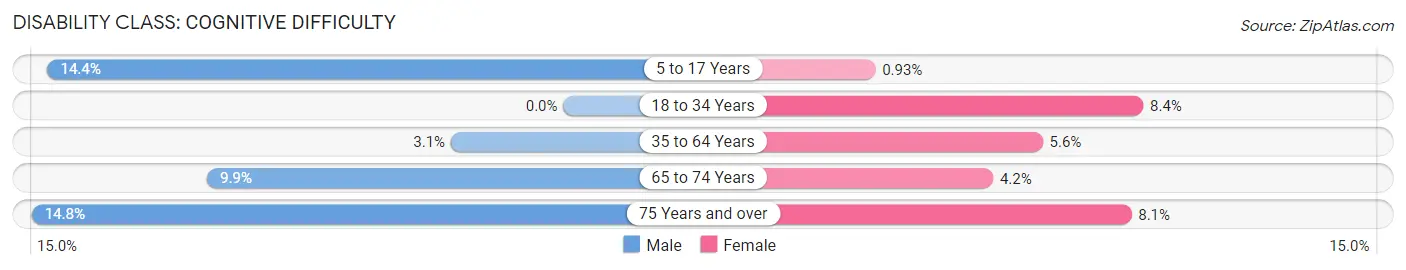
| Age Bracket | Male | Female |
| 5 to 17 Years | 159 (14.4%) | 8 (0.9%) |
| 18 to 34 Years | 0 (0.0%) | 148 (8.4%) |
| 35 to 64 Years | 70 (3.1%) | 130 (5.6%) |
| 65 to 74 Years | 62 (9.9%) | 26 (4.2%) |
| 75 Years and over | 29 (14.8%) | 34 (8.1%) |
Disability Class: Ambulatory Difficulty
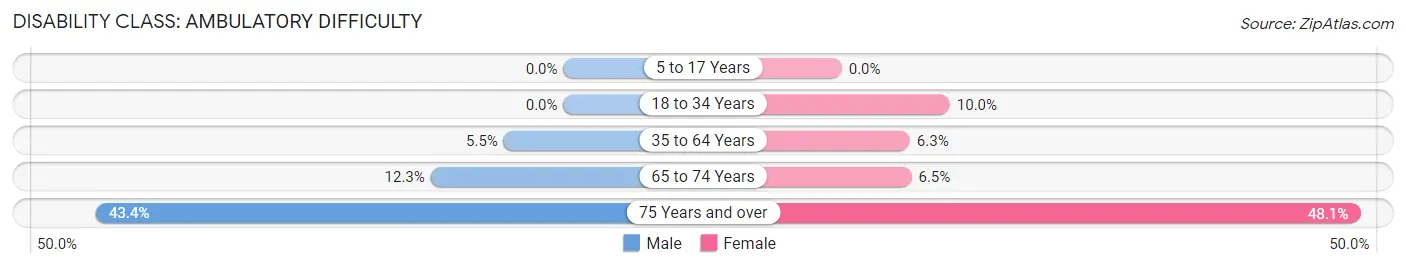
| Age Bracket | Male | Female |
| 5 to 17 Years | 0 (0.0%) | 0 (0.0%) |
| 18 to 34 Years | 0 (0.0%) | 177 (10.0%) |
| 35 to 64 Years | 124 (5.5%) | 147 (6.3%) |
| 65 to 74 Years | 77 (12.3%) | 40 (6.5%) |
| 75 Years and over | 85 (43.4%) | 203 (48.1%) |
Disability Class: Self-Care Difficulty
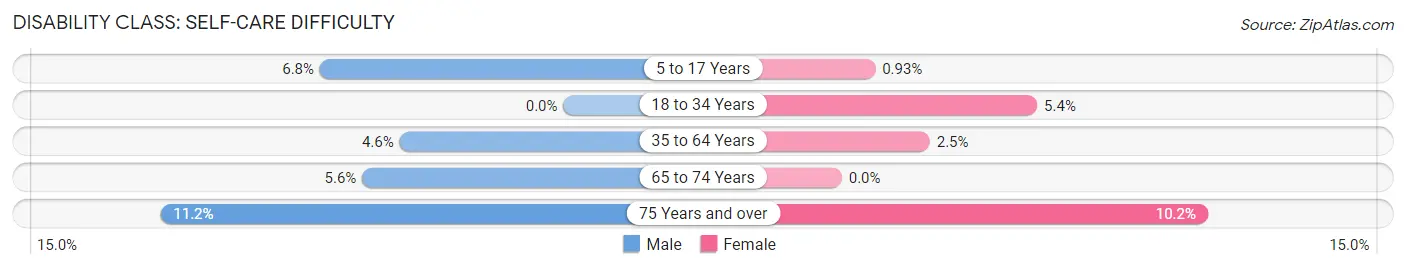
| Age Bracket | Male | Female |
| 5 to 17 Years | 75 (6.8%) | 8 (0.9%) |
| 18 to 34 Years | 0 (0.0%) | 96 (5.4%) |
| 35 to 64 Years | 102 (4.6%) | 57 (2.5%) |
| 65 to 74 Years | 35 (5.6%) | 0 (0.0%) |
| 75 Years and over | 22 (11.2%) | 43 (10.2%) |
Technology Access in Lakeside
Computing Device Access in Lakeside
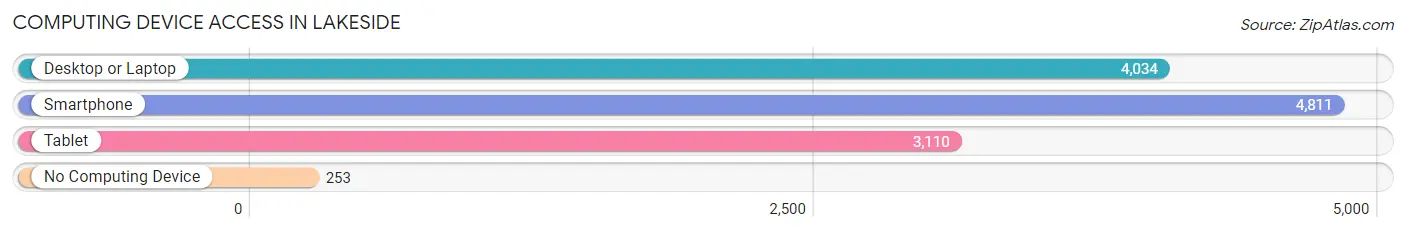
| Device Type | # Households | % Households |
| Desktop or Laptop | 4,034 | 75.5% |
| Smartphone | 4,811 | 90.0% |
| Tablet | 3,110 | 58.2% |
| No Computing Device | 253 | 4.7% |
| Total | 5,345 | 100.0% |
Internet Access in Lakeside
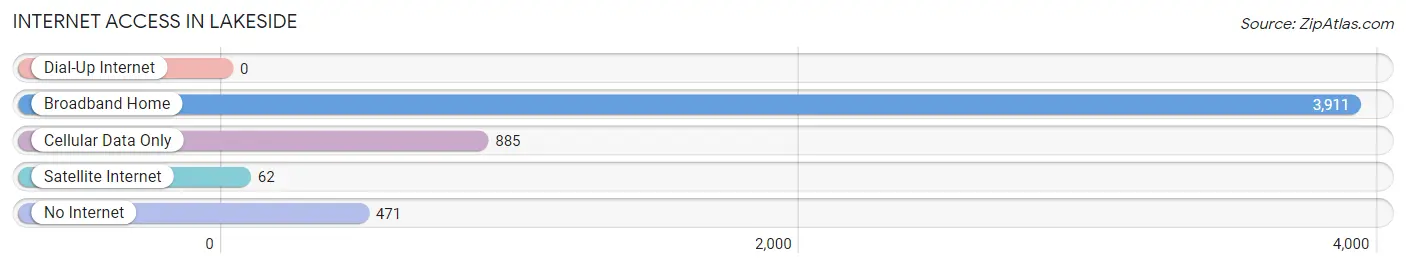
| Internet Type | # Households | % Households |
| Dial-Up Internet | 0 | 0.0% |
| Broadband Home | 3,911 | 73.2% |
| Cellular Data Only | 885 | 16.6% |
| Satellite Internet | 62 | 1.2% |
| No Internet | 471 | 8.8% |
| Total | 5,345 | 100.0% |
Lakeside Summary
Lakeside is a census-designated place (CDP) located in the state of Virginia in the United States. It is located in the western part of the state, in the county of Chesterfield. The population of Lakeside was 8,845 at the 2010 census.
Geography
Lakeside is located at 37°25'17" North, 77°37'45" West (37.4214, -77.6294). It is situated in the western part of the state, in the county of Chesterfield. The CDP has a total area of 4.3 square miles, all of which is land.
The terrain of Lakeside is mostly flat, with some rolling hills. The area is mostly wooded, with some open fields. The area is also home to several small lakes, which give the area its name.
Climate
Lakeside has a humid subtropical climate, with hot, humid summers and mild winters. The average annual temperature is around 60°F (15°C). The average annual precipitation is around 43 inches (109 cm).
Demographics
As of the 2010 census, there were 8,845 people, 3,717 households, and 2,541 families residing in the CDP. The population density was 2,062.2 people per square mile (797.2/km2). There were 3,945 housing units at an average density of 912.2 per square mile (352.3/km2). The racial makeup of the CDP was 79.2% White, 14.2% African American, 0.3% Native American, 2.2% Asian, 0.1% Pacific Islander, 1.7% from other races, and 2.3% from two or more races. Hispanic or Latino of any race were 4.2% of the population.
Economy
The economy of Lakeside is largely based on the service industry. The area is home to several restaurants, retail stores, and other businesses. The area is also home to several large employers, including the University of Richmond, Bon Secours Richmond Health System, and Capital One Financial Corporation.
Education
Lakeside is served by the Chesterfield County Public Schools system. The area is home to several elementary schools, middle schools, and high schools. The area is also home to the University of Richmond, which is located just outside of the CDP.
Transportation
Lakeside is served by several major highways, including Interstate 95, Interstate 64, and US Route 1. The area is also served by several bus routes operated by the Greater Richmond Transit Company.
Conclusion
Lakeside is a census-designated place located in the western part of the state of Virginia. The area is mostly flat, with some rolling hills, and is mostly wooded, with some open fields. The area is also home to several small lakes, which give the area its name. The population of Lakeside was 8,845 at the 2010 census. The economy of Lakeside is largely based on the service industry, and the area is served by several major highways and bus routes. The area is also home to several schools, including the University of Richmond.
Common Questions
What is Per Capita Income in Lakeside?
Per Capita income in Lakeside is $36,158.
What is the Median Family Income in Lakeside?
Median Family Income in Lakeside is $76,314.
What is the Median Household income in Lakeside?
Median Household Income in Lakeside is $64,912.
What is Income or Wage Gap in Lakeside?
Income or Wage Gap in Lakeside is 12.2%.
Women in Lakeside earn 87.8 cents for every dollar earned by a man.
What is Inequality or Gini Index in Lakeside?
Inequality or Gini Index in Lakeside is 0.39.
What is the Total Population of Lakeside?
Total Population of Lakeside is 12,124.
What is the Total Male Population of Lakeside?
Total Male Population of Lakeside is 5,895.
What is the Total Female Population of Lakeside?
Total Female Population of Lakeside is 6,229.
What is the Ratio of Males per 100 Females in Lakeside?
There are 94.64 Males per 100 Females in Lakeside.
What is the Ratio of Females per 100 Males in Lakeside?
There are 105.67 Females per 100 Males in Lakeside.
What is the Median Population Age in Lakeside?
Median Population Age in Lakeside is 37.7 Years.
What is the Average Family Size in Lakeside
Average Family Size in Lakeside is 2.9 People.
What is the Average Household Size in Lakeside
Average Household Size in Lakeside is 2.3 People.
How Large is the Labor Force in Lakeside?
There are 6,953 People in the Labor Forcein in Lakeside.
What is the Percentage of People in the Labor Force in Lakeside?
70.4% of People are in the Labor Force in Lakeside.
What is the Unemployment Rate in Lakeside?
Unemployment Rate in Lakeside is 2.1%.