Port Clinton, OH Map & Demographics
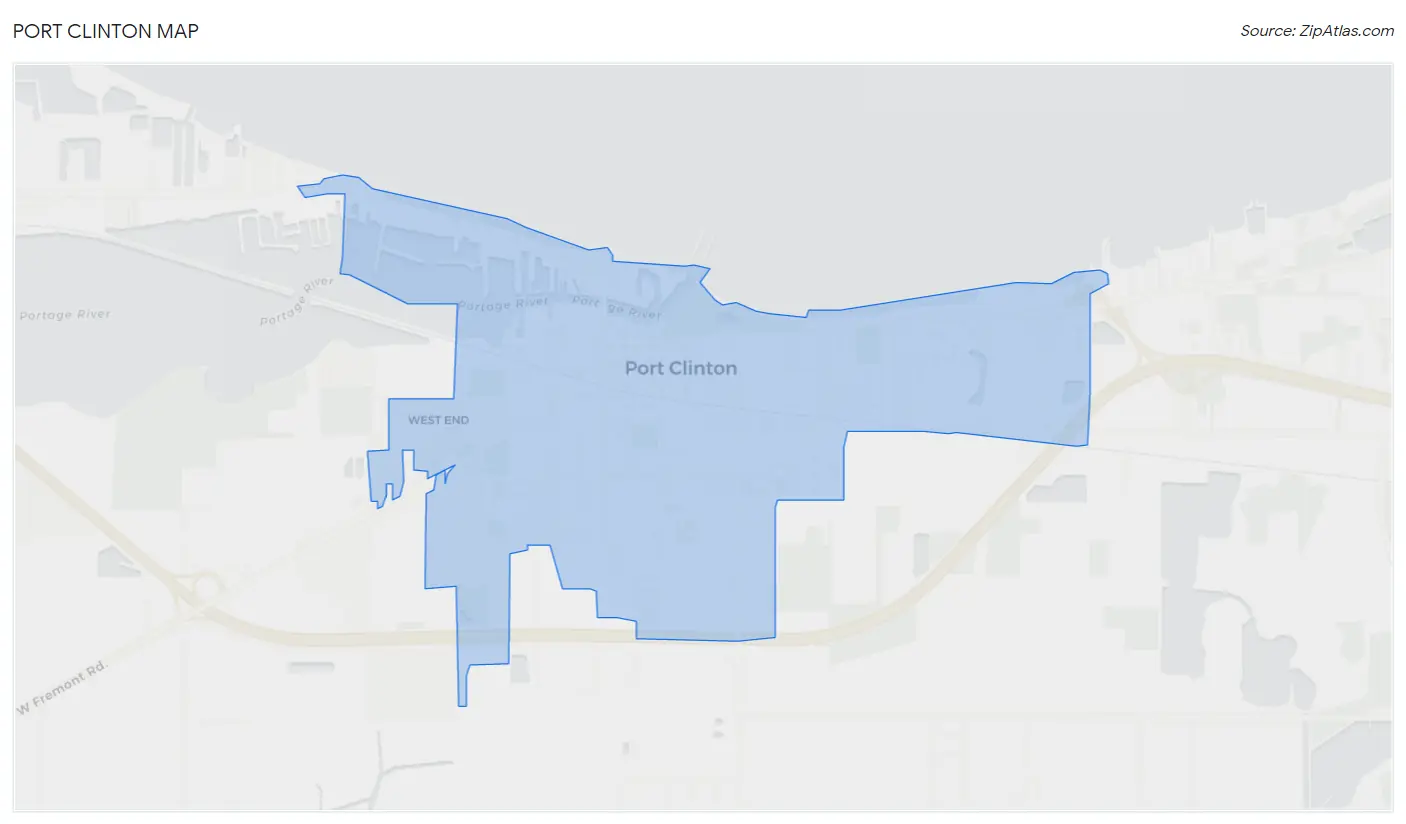
Port Clinton Map
Port Clinton Overview
$35,900
PER CAPITA INCOME
$60,331
AVG FAMILY INCOME
$55,534
AVG HOUSEHOLD INCOME
42.4%
WAGE / INCOME GAP [ % ]
57.6¢/ $1
WAGE / INCOME GAP [ $ ]
$9,780
FAMILY INCOME DEFICIT
0.49
INEQUALITY / GINI INDEX
6,024
TOTAL POPULATION
2,807
MALE POPULATION
3,217
FEMALE POPULATION
87.26
MALES / 100 FEMALES
114.61
FEMALES / 100 MALES
44.9
MEDIAN AGE
2.7
AVG FAMILY SIZE
2.0
AVG HOUSEHOLD SIZE
2,942
LABOR FORCE [ PEOPLE ]
57.9%
PERCENT IN LABOR FORCE
5.3%
UNEMPLOYMENT RATE
Port Clinton Zip Codes
Income in Port Clinton
Income Overview in Port Clinton
Per Capita Income in Port Clinton is $35,900, while median incomes of families and households are $60,331 and $55,534 respectively.
| Characteristic | Number | Measure |
| Per Capita Income | 6,024 | $35,900 |
| Median Family Income | 1,493 | $60,331 |
| Mean Family Income | 1,493 | $75,529 |
| Median Household Income | 2,942 | $55,534 |
| Mean Household Income | 2,942 | $72,586 |
| Income Deficit | 1,493 | $9,780 |
| Wage / Income Gap (%) | 6,024 | 42.38% |
| Wage / Income Gap ($) | 6,024 | 57.62¢ per $1 |
| Gini / Inequality Index | 6,024 | 0.49 |
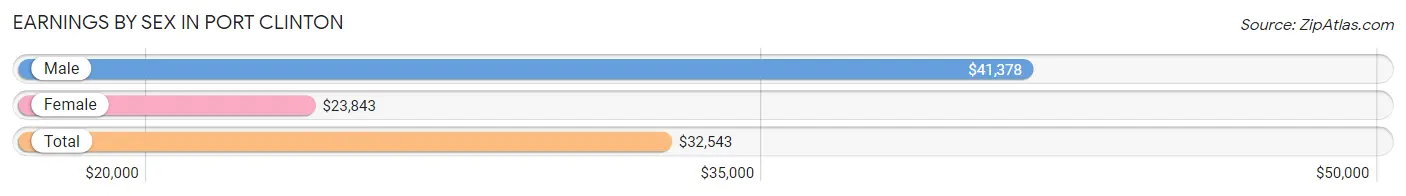
Earnings by Sex in Port Clinton
Average Earnings in Port Clinton are $32,543, $41,378 for men and $23,843 for women, a difference of 42.4%.
| Sex | Number | Average Earnings |
| Male | 1,443 (46.6%) | $41,378 |
| Female | 1,656 (53.4%) | $23,843 |
| Total | 3,099 (100.0%) | $32,543 |
Earnings by Sex by Income Bracket in Port Clinton
The most common earnings brackets in Port Clinton are $55,000 to $64,999 for men (165 | 11.4%) and $2,500 to $4,999 for women (175 | 10.6%).
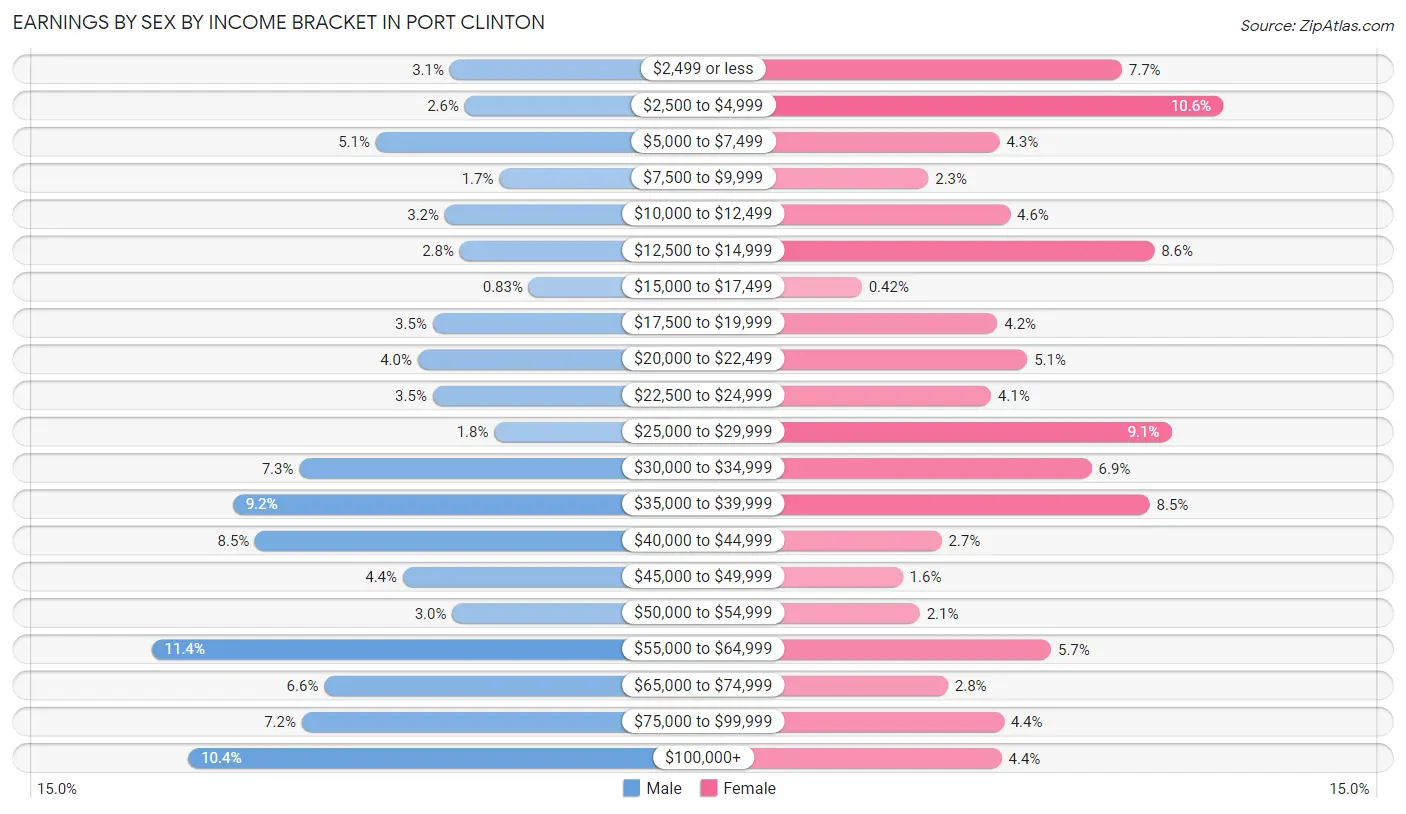
| Income | Male | Female |
| $2,499 or less | 44 (3.0%) | 128 (7.7%) |
| $2,500 to $4,999 | 38 (2.6%) | 175 (10.6%) |
| $5,000 to $7,499 | 74 (5.1%) | 71 (4.3%) |
| $7,500 to $9,999 | 24 (1.7%) | 38 (2.3%) |
| $10,000 to $12,499 | 46 (3.2%) | 76 (4.6%) |
| $12,500 to $14,999 | 40 (2.8%) | 143 (8.6%) |
| $15,000 to $17,499 | 12 (0.8%) | 7 (0.4%) |
| $17,500 to $19,999 | 51 (3.5%) | 70 (4.2%) |
| $20,000 to $22,499 | 57 (4.0%) | 84 (5.1%) |
| $22,500 to $24,999 | 51 (3.5%) | 67 (4.1%) |
| $25,000 to $29,999 | 26 (1.8%) | 151 (9.1%) |
| $30,000 to $34,999 | 105 (7.3%) | 114 (6.9%) |
| $35,000 to $39,999 | 132 (9.1%) | 141 (8.5%) |
| $40,000 to $44,999 | 123 (8.5%) | 44 (2.7%) |
| $45,000 to $49,999 | 63 (4.4%) | 26 (1.6%) |
| $50,000 to $54,999 | 43 (3.0%) | 34 (2.1%) |
| $55,000 to $64,999 | 165 (11.4%) | 95 (5.7%) |
| $65,000 to $74,999 | 95 (6.6%) | 47 (2.8%) |
| $75,000 to $99,999 | 104 (7.2%) | 73 (4.4%) |
| $100,000+ | 150 (10.4%) | 72 (4.3%) |
| Total | 1,443 (100.0%) | 1,656 (100.0%) |
Earnings by Sex by Educational Attainment in Port Clinton
Average earnings in Port Clinton are $43,497 for men and $28,917 for women, a difference of 33.5%. Men with an educational attainment of college or associate's degree enjoy the highest average annual earnings of $53,750, while those with high school diploma education earn the least with $44,148. Women with an educational attainment of graduate degree earn the most with the average annual earnings of $82,344, while those with less than high school education have the smallest earnings of $11,576.
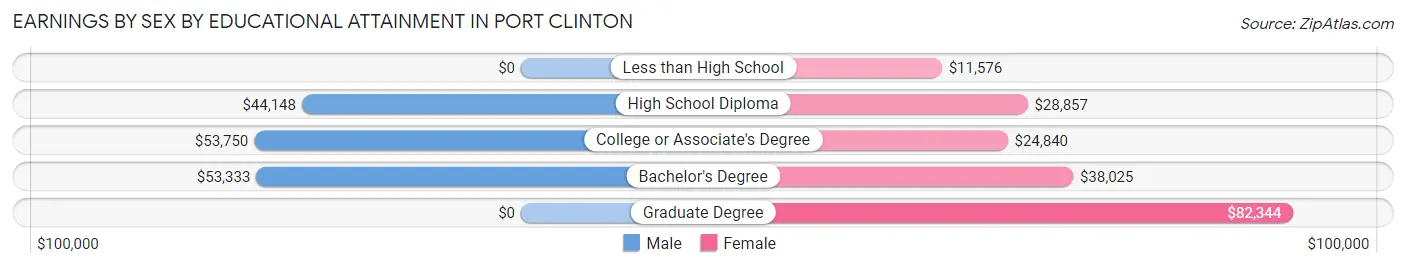
| Educational Attainment | Male Income | Female Income |
| Less than High School | - | - |
| High School Diploma | $44,148 | $28,857 |
| College or Associate's Degree | $53,750 | $24,840 |
| Bachelor's Degree | $53,333 | $38,025 |
| Graduate Degree | - | - |
| Total | $43,497 | $28,917 |
Family Income in Port Clinton
Family Income Brackets in Port Clinton
According to the Port Clinton family income data, there are 357 families falling into the $50,000 to $74,999 income range, which is the most common income bracket and makes up 23.9% of all families. Conversely, the $15,000 to $24,999 income bracket is the least frequent group with only 37 families (2.5%) belonging to this category.
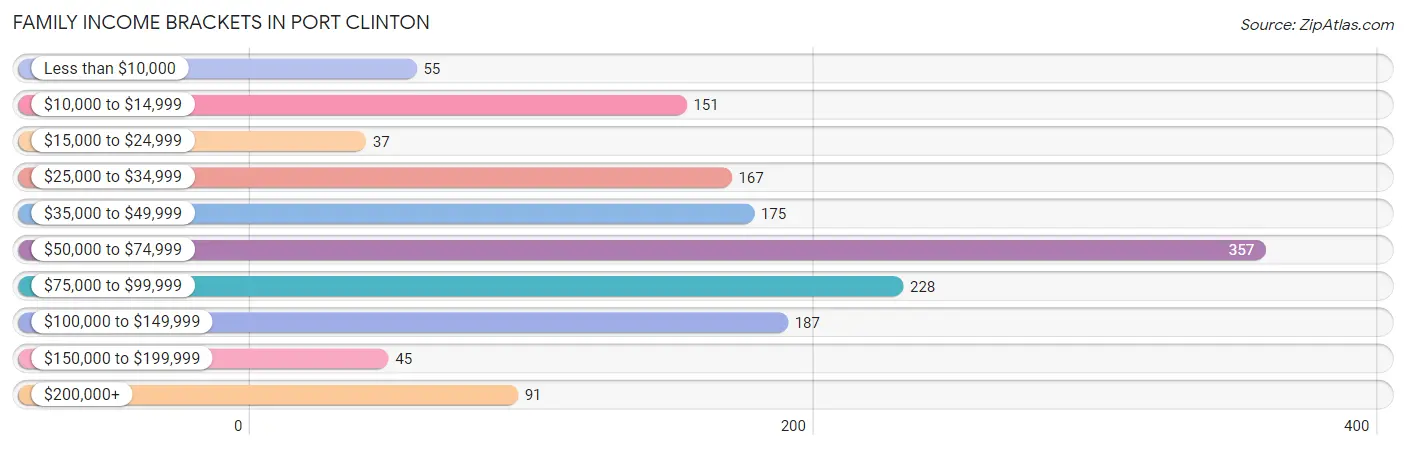
| Income Bracket | # Families | % Families |
| Less than $10,000 | 55 | 3.7% |
| $10,000 to $14,999 | 151 | 10.1% |
| $15,000 to $24,999 | 37 | 2.5% |
| $25,000 to $34,999 | 167 | 11.2% |
| $35,000 to $49,999 | 175 | 11.7% |
| $50,000 to $74,999 | 357 | 23.9% |
| $75,000 to $99,999 | 228 | 15.3% |
| $100,000 to $149,999 | 187 | 12.5% |
| $150,000 to $199,999 | 45 | 3.0% |
| $200,000+ | 91 | 6.1% |
Family Income by Famaliy Size in Port Clinton
5-person families (143 | 9.6%) account for the highest median family income in Port Clinton with $95,156 per family, while 2-person families (911 | 61.0%) have the highest median income of $28,242 per family member.
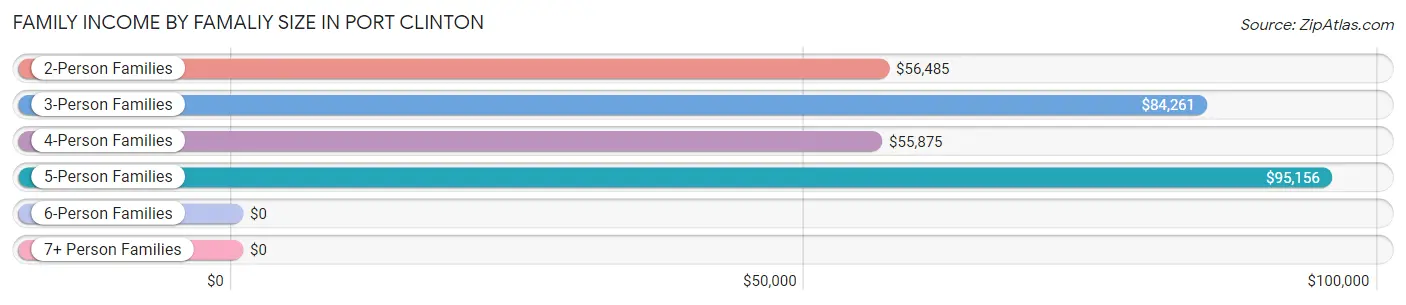
| Income Bracket | # Families | Median Income |
| 2-Person Families | 911 (61.0%) | $56,485 |
| 3-Person Families | 181 (12.1%) | $84,261 |
| 4-Person Families | 258 (17.3%) | $55,875 |
| 5-Person Families | 143 (9.6%) | $95,156 |
| 6-Person Families | 0 (0.0%) | $0 |
| 7+ Person Families | 0 (0.0%) | $0 |
| Total | 1,493 (100.0%) | $60,331 |
Family Income by Number of Earners in Port Clinton
The median family income in Port Clinton is $60,331, with families comprising 3+ earners (160) having the highest median family income of $88,947, while families with no earners (274) have the lowest median family income of $32,308, accounting for 10.7% and 18.3% of families, respectively.
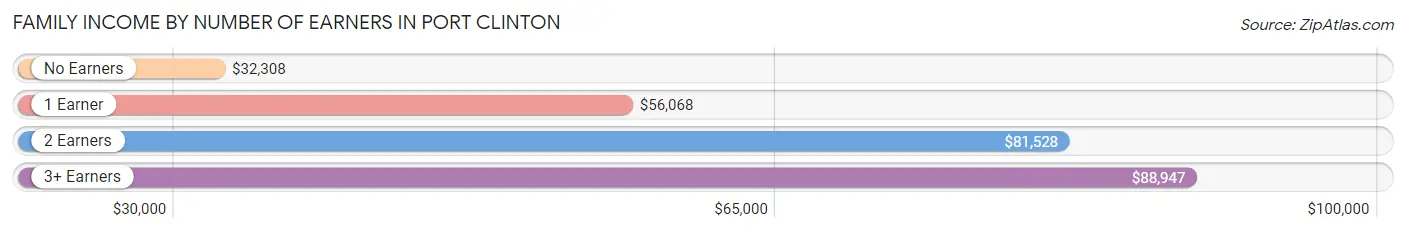
| Number of Earners | # Families | Median Income |
| No Earners | 274 (18.3%) | $32,308 |
| 1 Earner | 628 (42.1%) | $56,068 |
| 2 Earners | 431 (28.9%) | $81,528 |
| 3+ Earners | 160 (10.7%) | $88,947 |
| Total | 1,493 (100.0%) | $60,331 |
Household Income in Port Clinton
Household Income Brackets in Port Clinton
With 827 households falling in the category, the $50,000 to $74,999 income range is the most frequent in Port Clinton, accounting for 28.1% of all households. In contrast, only 74 households (2.5%) fall into the $150,000 to $199,999 income bracket, making it the least populous group.
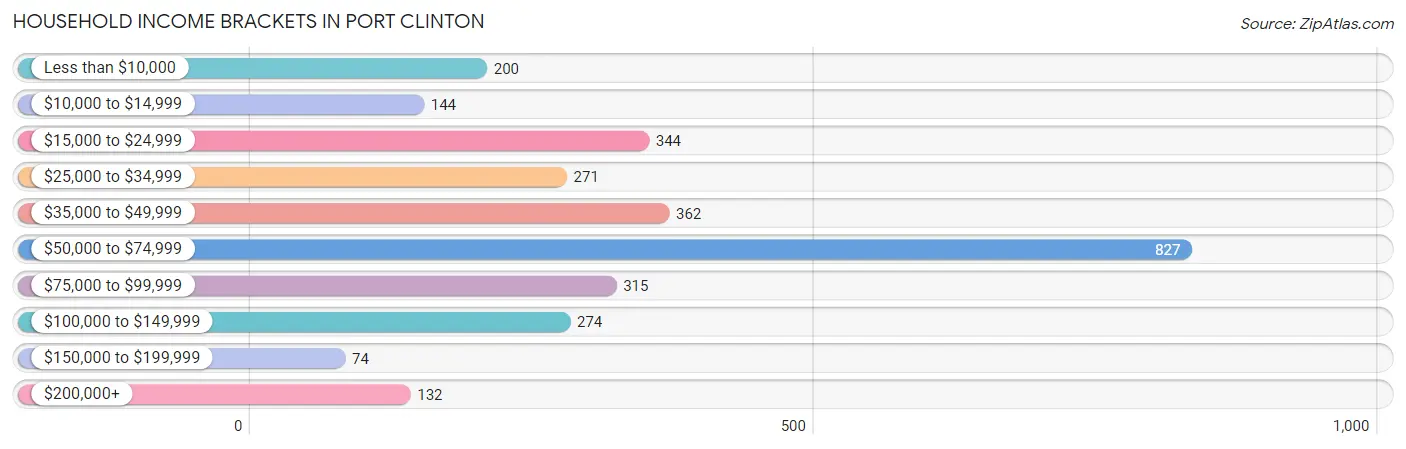
| Income Bracket | # Households | % Households |
| Less than $10,000 | 200 | 6.8% |
| $10,000 to $14,999 | 144 | 4.9% |
| $15,000 to $24,999 | 344 | 11.7% |
| $25,000 to $34,999 | 271 | 9.2% |
| $35,000 to $49,999 | 362 | 12.3% |
| $50,000 to $74,999 | 827 | 28.1% |
| $75,000 to $99,999 | 315 | 10.7% |
| $100,000 to $149,999 | 274 | 9.3% |
| $150,000 to $199,999 | 74 | 2.5% |
| $200,000+ | 132 | 4.5% |
Household Income by Householder Age in Port Clinton
The median household income in Port Clinton is $55,534, with the highest median household income of $57,252 found in the 25 to 44 years age bracket for the primary householder. A total of 991 households (33.7%) fall into this category. Meanwhile, the 15 to 24 years age bracket for the primary householder has the lowest median household income of $0, with 67 households (2.3%) in this group.
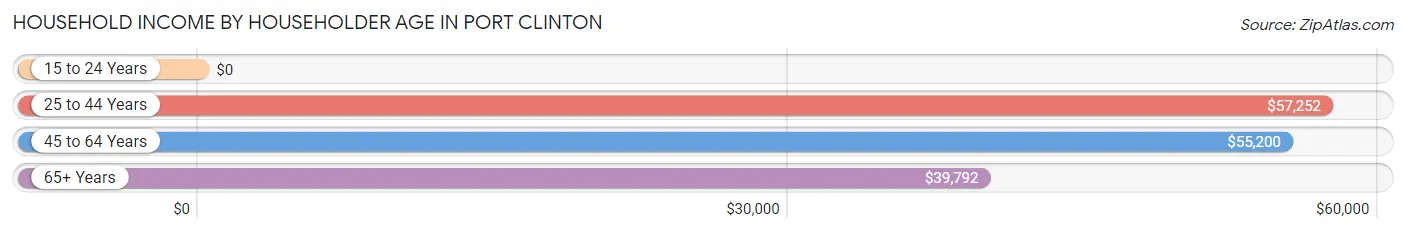
| Income Bracket | # Households | Median Income |
| 15 to 24 Years | 67 (2.3%) | $0 |
| 25 to 44 Years | 991 (33.7%) | $57,252 |
| 45 to 64 Years | 938 (31.9%) | $55,200 |
| 65+ Years | 946 (32.2%) | $39,792 |
| Total | 2,942 (100.0%) | $55,534 |
Poverty in Port Clinton
Income Below Poverty by Sex and Age in Port Clinton
With 19.6% poverty level for males and 21.8% for females among the residents of Port Clinton, 5 year old males and 6 to 11 year old females are the most vulnerable to poverty, with 29 males (100.0%) and 101 females (48.3%) in their respective age groups living below the poverty level.
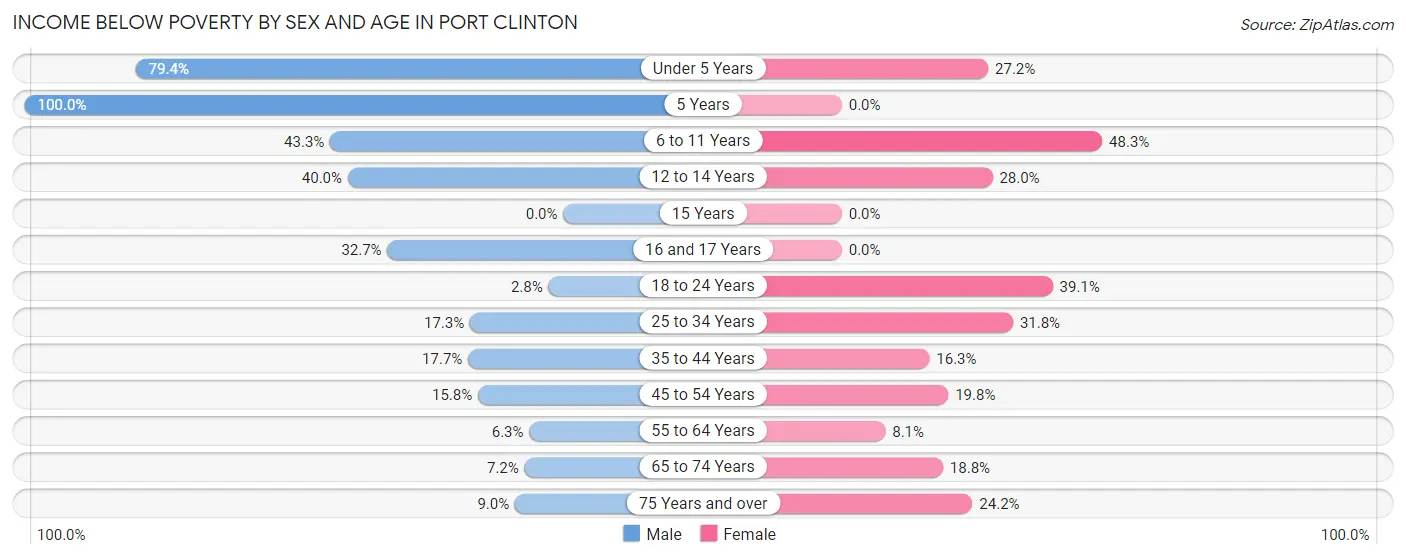
| Age Bracket | Male | Female |
| Under 5 Years | 77 (79.4%) | 22 (27.2%) |
| 5 Years | 29 (100.0%) | 0 (0.0%) |
| 6 to 11 Years | 58 (43.3%) | 101 (48.3%) |
| 12 to 14 Years | 74 (40.0%) | 26 (28.0%) |
| 15 Years | 0 (0.0%) | 0 (0.0%) |
| 16 and 17 Years | 16 (32.7%) | 0 (0.0%) |
| 18 to 24 Years | 3 (2.8%) | 72 (39.1%) |
| 25 to 34 Years | 62 (17.3%) | 122 (31.8%) |
| 35 to 44 Years | 100 (17.7%) | 39 (16.3%) |
| 45 to 54 Years | 63 (15.8%) | 82 (19.8%) |
| 55 to 64 Years | 21 (6.3%) | 33 (8.1%) |
| 65 to 74 Years | 20 (7.2%) | 104 (18.8%) |
| 75 Years and over | 18 (9.0%) | 80 (24.2%) |
| Total | 541 (19.6%) | 681 (21.8%) |
Income Above Poverty by Sex and Age in Port Clinton
According to the poverty statistics in Port Clinton, males aged 15 years and females aged 5 years are the age groups that are most secure financially, with 100.0% of males and 100.0% of females in these age groups living above the poverty line.
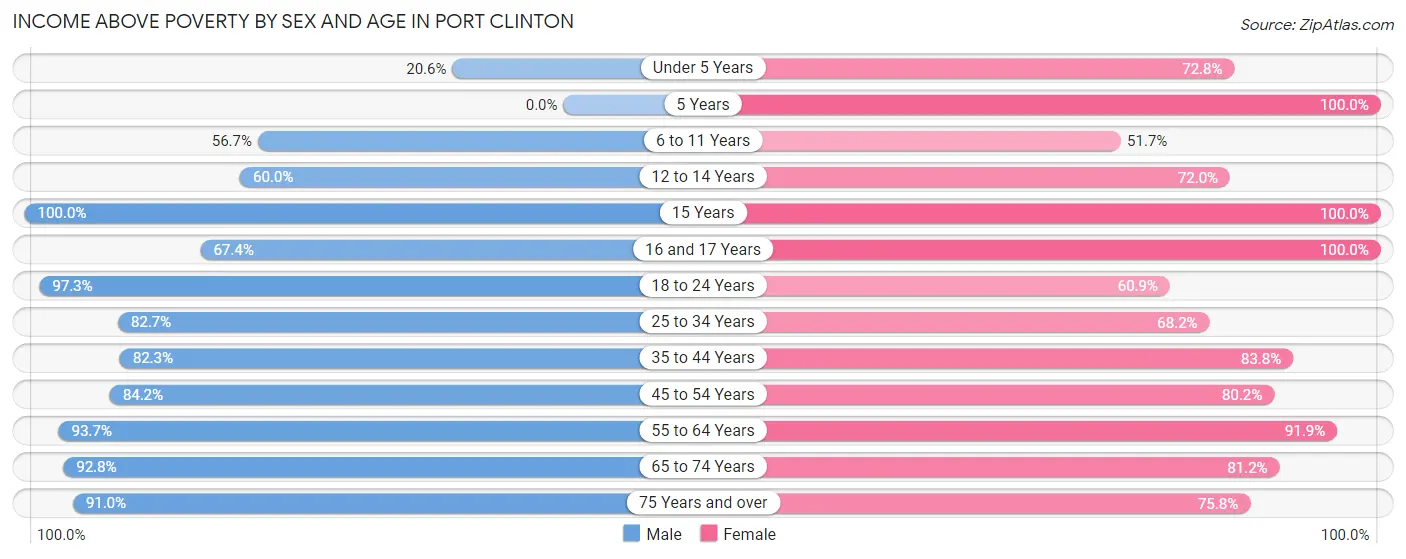
| Age Bracket | Male | Female |
| Under 5 Years | 20 (20.6%) | 59 (72.8%) |
| 5 Years | 0 (0.0%) | 62 (100.0%) |
| 6 to 11 Years | 76 (56.7%) | 108 (51.7%) |
| 12 to 14 Years | 111 (60.0%) | 67 (72.0%) |
| 15 Years | 25 (100.0%) | 27 (100.0%) |
| 16 and 17 Years | 33 (67.3%) | 140 (100.0%) |
| 18 to 24 Years | 106 (97.3%) | 112 (60.9%) |
| 25 to 34 Years | 296 (82.7%) | 262 (68.2%) |
| 35 to 44 Years | 466 (82.3%) | 201 (83.8%) |
| 45 to 54 Years | 335 (84.2%) | 333 (80.2%) |
| 55 to 64 Years | 312 (93.7%) | 376 (91.9%) |
| 65 to 74 Years | 258 (92.8%) | 450 (81.2%) |
| 75 Years and over | 183 (91.0%) | 250 (75.8%) |
| Total | 2,221 (80.4%) | 2,447 (78.2%) |
Income Below Poverty Among Married-Couple Families in Port Clinton
The poverty statistics for married-couple families in Port Clinton show that 8.8% or 80 of the total 905 families live below the poverty line. Families with 1 or 2 children have the highest poverty rate of 15.3%, comprising of 34 families. On the other hand, families with 3 or 4 children have the lowest poverty rate of 0.0%, which includes 0 families.
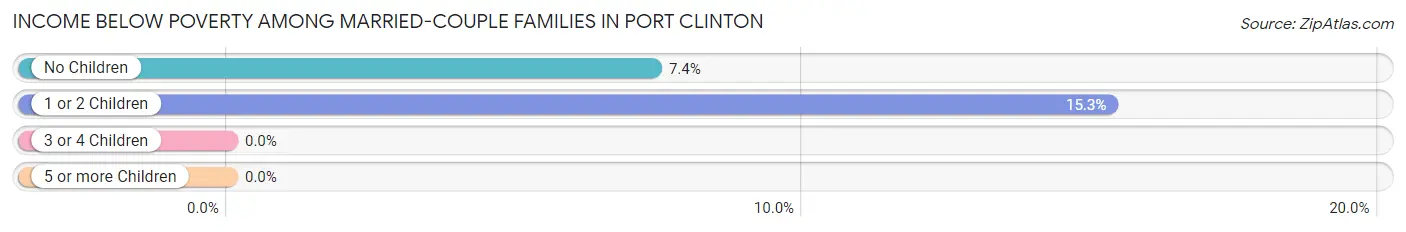
| Children | Above Poverty | Below Poverty |
| No Children | 577 (92.6%) | 46 (7.4%) |
| 1 or 2 Children | 188 (84.7%) | 34 (15.3%) |
| 3 or 4 Children | 60 (100.0%) | 0 (0.0%) |
| 5 or more Children | 0 (0.0%) | 0 (0.0%) |
| Total | 825 (91.2%) | 80 (8.8%) |
Income Below Poverty Among Single-Parent Households in Port Clinton
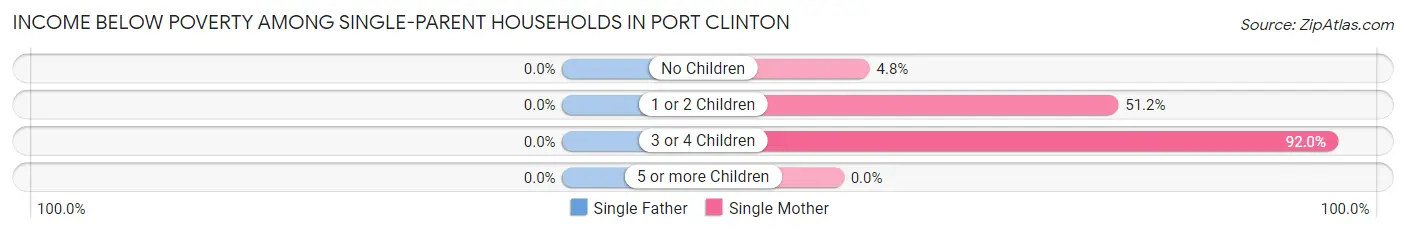
| Children | Single Father | Single Mother |
| No Children | 0 (0.0%) | 7 (4.8%) |
| 1 or 2 Children | 0 (0.0%) | 67 (51.1%) |
| 3 or 4 Children | 0 (0.0%) | 104 (92.0%) |
| 5 or more Children | 0 (0.0%) | 0 (0.0%) |
| Total | 0 (0.0%) | 178 (45.8%) |
Income Below Poverty Among Married-Couple vs Single-Parent Households in Port Clinton
The poverty data for Port Clinton shows that 80 of the married-couple family households (8.8%) and 178 of the single-parent households (30.3%) are living below the poverty level. Within the married-couple family households, those with 1 or 2 children have the highest poverty rate, with 34 households (15.3%) falling below the poverty line. Among the single-parent households, those with 3 or 4 children have the highest poverty rate, with 104 household (83.9%) living below poverty.
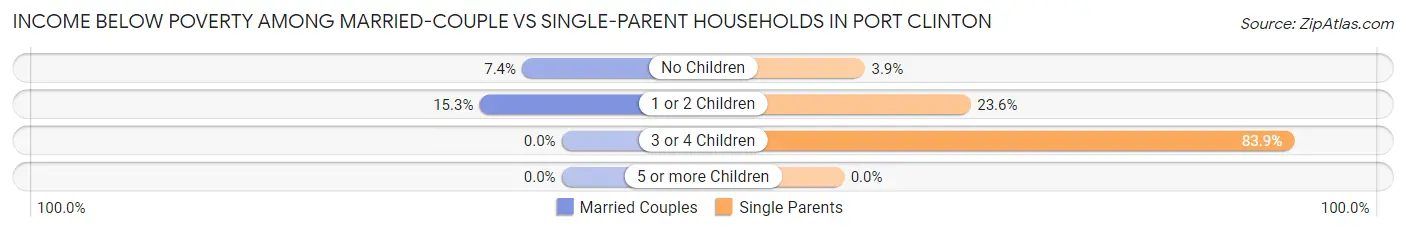
| Children | Married-Couple Families | Single-Parent Households |
| No Children | 46 (7.4%) | 7 (3.9%) |
| 1 or 2 Children | 34 (15.3%) | 67 (23.6%) |
| 3 or 4 Children | 0 (0.0%) | 104 (83.9%) |
| 5 or more Children | 0 (0.0%) | 0 (0.0%) |
| Total | 80 (8.8%) | 178 (30.3%) |
Race in Port Clinton
The most populous races in Port Clinton are White / Caucasian (5,296 | 87.9%), Two or more Races (460 | 7.6%), and Hispanic or Latino (447 | 7.4%).
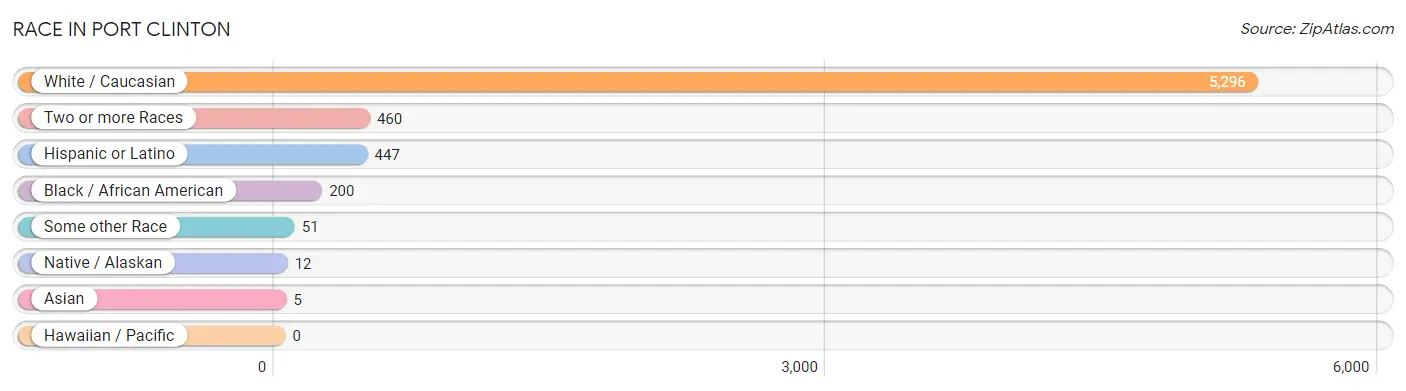
| Race | # Population | % Population |
| Asian | 5 | 0.1% |
| Black / African American | 200 | 3.3% |
| Hawaiian / Pacific | 0 | 0.0% |
| Hispanic or Latino | 447 | 7.4% |
| Native / Alaskan | 12 | 0.2% |
| White / Caucasian | 5,296 | 87.9% |
| Two or more Races | 460 | 7.6% |
| Some other Race | 51 | 0.9% |
| Total | 6,024 | 100.0% |
Ancestry in Port Clinton
The most populous ancestries reported in Port Clinton are German (2,075 | 34.4%), Irish (927 | 15.4%), English (919 | 15.3%), Mexican (434 | 7.2%), and Polish (306 | 5.1%), together accounting for 77.4% of all Port Clinton residents.
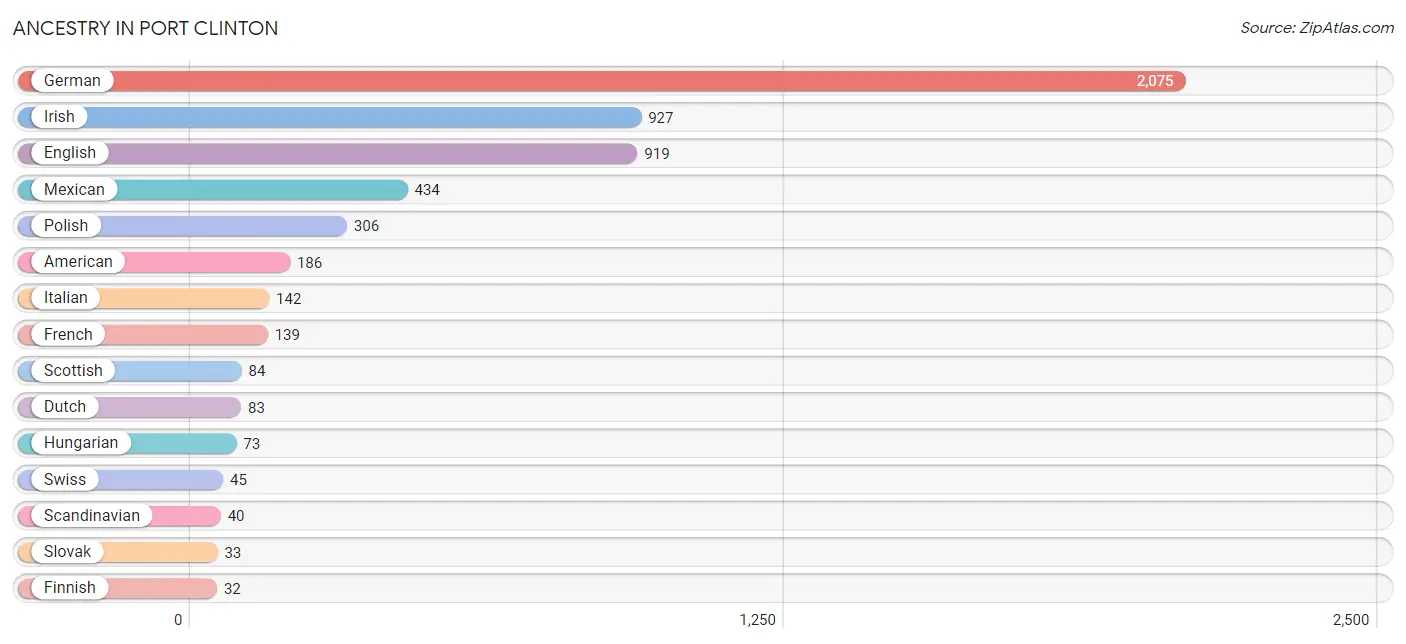
| Ancestry | # Population | % Population |
| American | 186 | 3.1% |
| Austrian | 10 | 0.2% |
| British | 13 | 0.2% |
| Central American Indian | 13 | 0.2% |
| Czech | 13 | 0.2% |
| Czechoslovakian | 22 | 0.4% |
| Danish | 7 | 0.1% |
| Dutch | 83 | 1.4% |
| English | 919 | 15.3% |
| European | 6 | 0.1% |
| Finnish | 32 | 0.5% |
| French | 139 | 2.3% |
| French Canadian | 14 | 0.2% |
| German | 2,075 | 34.4% |
| Hungarian | 73 | 1.2% |
| Irish | 927 | 15.4% |
| Italian | 142 | 2.4% |
| Korean | 5 | 0.1% |
| Mexican | 434 | 7.2% |
| Norwegian | 32 | 0.5% |
| Polish | 306 | 5.1% |
| Puerto Rican | 13 | 0.2% |
| Russian | 3 | 0.1% |
| Scandinavian | 40 | 0.7% |
| Scottish | 84 | 1.4% |
| Slovak | 33 | 0.5% |
| Slovene | 7 | 0.1% |
| Swedish | 26 | 0.4% |
| Swiss | 45 | 0.7% |
| Welsh | 32 | 0.5% |
| West Indian | 13 | 0.2% | View All 31 Rows |
Immigrants in Port Clinton
The most numerous immigrant groups reported in Port Clinton came from Central America (19 | 0.3%), Latin America (19 | 0.3%), Mexico (19 | 0.3%), Asia (5 | 0.1%), and South Eastern Asia (5 | 0.1%), together accounting for 1.1% of all Port Clinton residents.
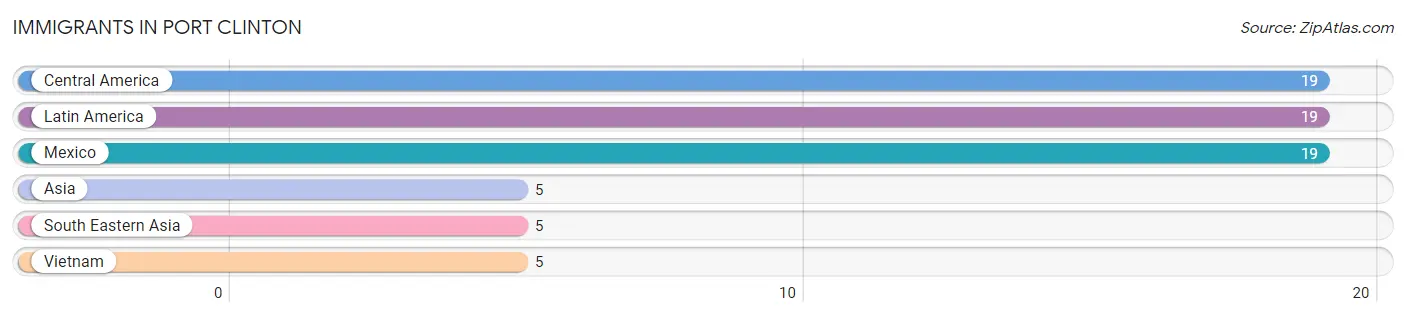
| Immigration Origin | # Population | % Population |
| Asia | 5 | 0.1% |
| Central America | 19 | 0.3% |
| Latin America | 19 | 0.3% |
| Mexico | 19 | 0.3% |
| South Eastern Asia | 5 | 0.1% |
| Vietnam | 5 | 0.1% | View All 6 Rows |
Sex and Age in Port Clinton
Sex and Age in Port Clinton
The most populous age groups in Port Clinton are 40 to 44 Years (351 | 12.5%) for men and 70 to 74 Years (310 | 9.6%) for women.
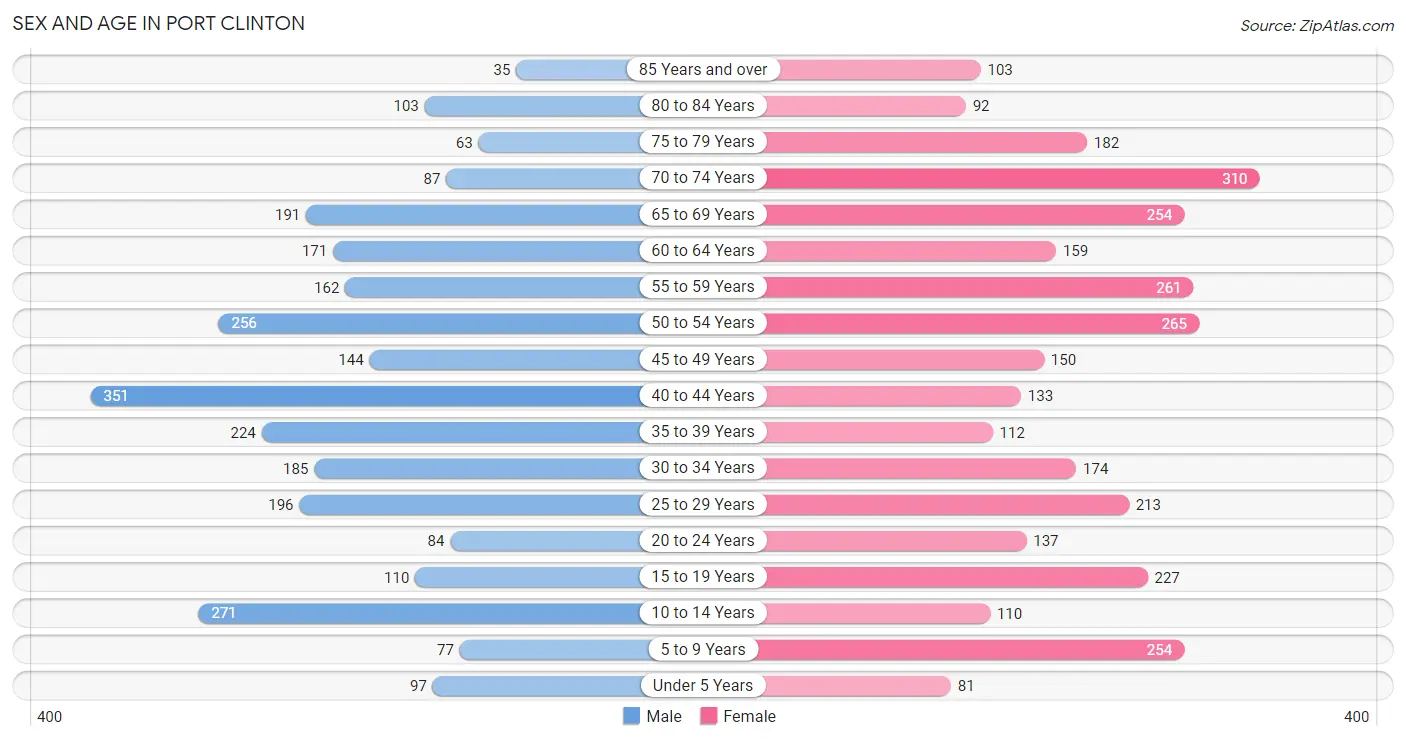
| Age Bracket | Male | Female |
| Under 5 Years | 97 (3.5%) | 81 (2.5%) |
| 5 to 9 Years | 77 (2.7%) | 254 (7.9%) |
| 10 to 14 Years | 271 (9.7%) | 110 (3.4%) |
| 15 to 19 Years | 110 (3.9%) | 227 (7.1%) |
| 20 to 24 Years | 84 (3.0%) | 137 (4.3%) |
| 25 to 29 Years | 196 (7.0%) | 213 (6.6%) |
| 30 to 34 Years | 185 (6.6%) | 174 (5.4%) |
| 35 to 39 Years | 224 (8.0%) | 112 (3.5%) |
| 40 to 44 Years | 351 (12.5%) | 133 (4.1%) |
| 45 to 49 Years | 144 (5.1%) | 150 (4.7%) |
| 50 to 54 Years | 256 (9.1%) | 265 (8.2%) |
| 55 to 59 Years | 162 (5.8%) | 261 (8.1%) |
| 60 to 64 Years | 171 (6.1%) | 159 (4.9%) |
| 65 to 69 Years | 191 (6.8%) | 254 (7.9%) |
| 70 to 74 Years | 87 (3.1%) | 310 (9.6%) |
| 75 to 79 Years | 63 (2.2%) | 182 (5.7%) |
| 80 to 84 Years | 103 (3.7%) | 92 (2.9%) |
| 85 Years and over | 35 (1.3%) | 103 (3.2%) |
| Total | 2,807 (100.0%) | 3,217 (100.0%) |
Families and Households in Port Clinton
Median Family Size in Port Clinton
The median family size in Port Clinton is 2.66 persons per family, with married-couple families (905 | 60.6%) accounting for the largest median family size of 2.76 persons per family. On the other hand, single male/father families (199 | 13.3%) represent the smallest median family size with 2.27 persons per family.
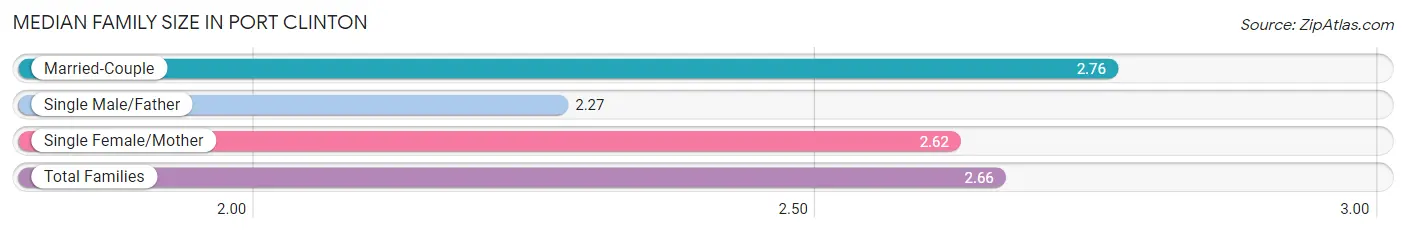
| Family Type | # Families | Family Size |
| Married-Couple | 905 (60.6%) | 2.76 |
| Single Male/Father | 199 (13.3%) | 2.27 |
| Single Female/Mother | 389 (26.1%) | 2.62 |
| Total Families | 1,493 (100.0%) | 2.66 |
Median Household Size in Port Clinton
The median household size in Port Clinton is 1.99 persons per household, with single female/mother households (389 | 13.2%) accounting for the largest median household size of 2.97 persons per household. non-family households (1,449 | 49.2%) represent the smallest median household size with 1.18 persons per household.
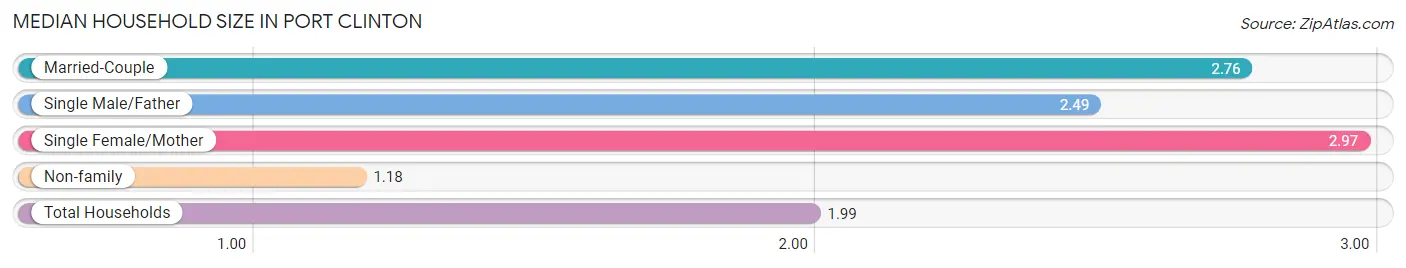
| Household Type | # Households | Household Size |
| Married-Couple | 905 (30.8%) | 2.76 |
| Single Male/Father | 199 (6.8%) | 2.49 |
| Single Female/Mother | 389 (13.2%) | 2.97 |
| Non-family | 1,449 (49.2%) | 1.18 |
| Total Households | 2,942 (100.0%) | 1.99 |
Household Size by Marriage Status in Port Clinton
Out of a total of 2,942 households in Port Clinton, 1,493 (50.7%) are family households, while 1,449 (49.2%) are nonfamily households. The most numerous type of family households are 2-person households, comprising 802, and the most common type of nonfamily households are 1-person households, comprising 1,235.
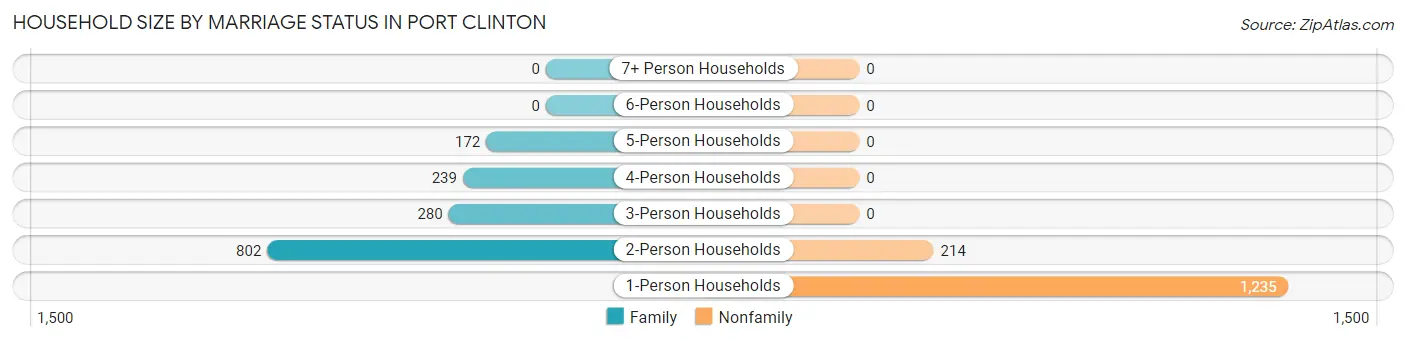
| Household Size | Family Households | Nonfamily Households |
| 1-Person Households | - | 1,235 (42.0%) |
| 2-Person Households | 802 (27.3%) | 214 (7.3%) |
| 3-Person Households | 280 (9.5%) | 0 (0.0%) |
| 4-Person Households | 239 (8.1%) | 0 (0.0%) |
| 5-Person Households | 172 (5.9%) | 0 (0.0%) |
| 6-Person Households | 0 (0.0%) | 0 (0.0%) |
| 7+ Person Households | 0 (0.0%) | 0 (0.0%) |
| Total | 1,493 (50.7%) | 1,449 (49.2%) |
Female Fertility in Port Clinton
Fertility by Age in Port Clinton
Average fertility rate in Port Clinton is 45.0 births per 1,000 women. Women in the age bracket of 20 to 34 years have the highest fertility rate with 99.0 births per 1,000 women. Women in the age bracket of 20 to 34 years acount for 100.0% of all women with births.
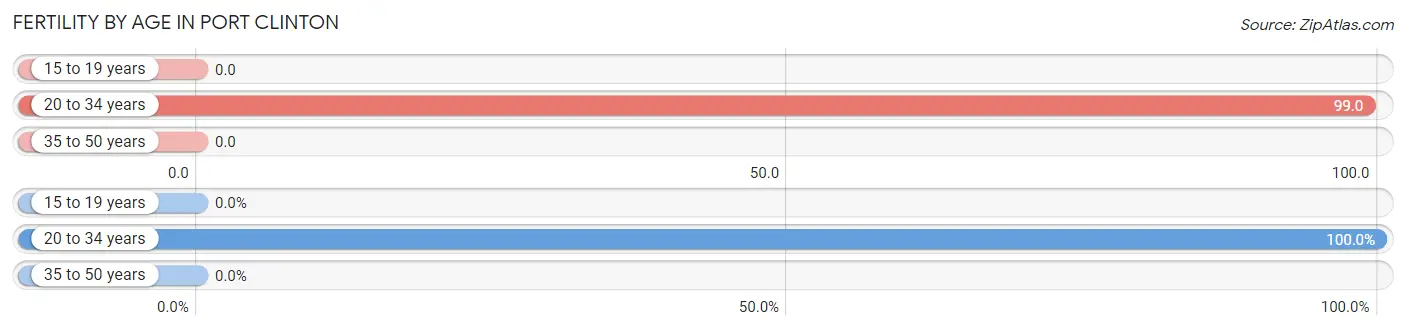
| Age Bracket | Women with Births | Births / 1,000 Women |
| 15 to 19 years | 0 (0.0%) | 0.0 |
| 20 to 34 years | 52 (100.0%) | 99.0 |
| 35 to 50 years | 0 (0.0%) | 0.0 |
| Total | 52 (100.0%) | 45.0 |
Fertility by Age by Marriage Status in Port Clinton
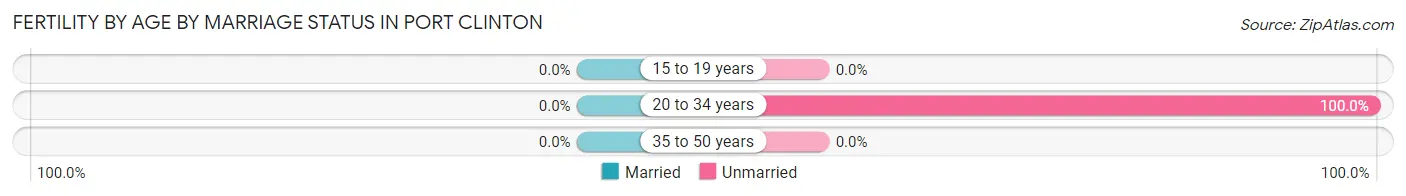
| Age Bracket | Married | Unmarried |
| 15 to 19 years | 0 (0.0%) | 0 (0.0%) |
| 20 to 34 years | 0 (0.0%) | 52 (100.0%) |
| 35 to 50 years | 0 (0.0%) | 0 (0.0%) |
| Total | 0 (0.0%) | 52 (100.0%) |
Fertility by Education in Port Clinton
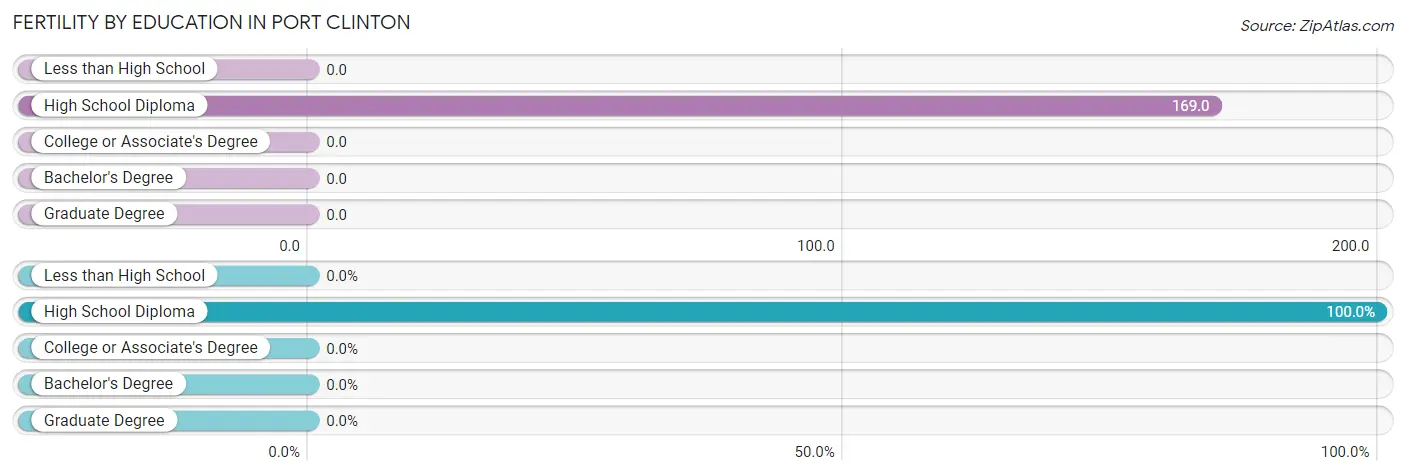
| Educational Attainment | Women with Births | Births / 1,000 Women |
| Less than High School | 0 (0.0%) | 0.0 |
| High School Diploma | 52 (100.0%) | 169.0 |
| College or Associate's Degree | 0 (0.0%) | 0.0 |
| Bachelor's Degree | 0 (0.0%) | 0.0 |
| Graduate Degree | 0 (0.0%) | 0.0 |
| Total | 52 (100.0%) | 45.0 |
Fertility by Education by Marriage Status in Port Clinton
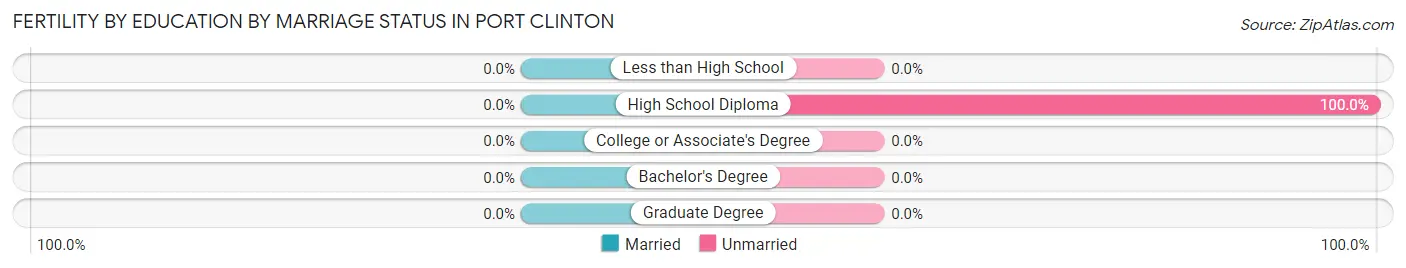
| Educational Attainment | Married | Unmarried |
| Less than High School | 0 (0.0%) | 0 (0.0%) |
| High School Diploma | 0 (0.0%) | 52 (100.0%) |
| College or Associate's Degree | 0 (0.0%) | 0 (0.0%) |
| Bachelor's Degree | 0 (0.0%) | 0 (0.0%) |
| Graduate Degree | 0 (0.0%) | 0 (0.0%) |
| Total | 0 (0.0%) | 52 (100.0%) |
Employment Characteristics in Port Clinton
Employment by Class of Employer in Port Clinton
Among the 2,719 employed individuals in Port Clinton, private company employees (1,948 | 71.6%), local government employees (319 | 11.7%), and not-for-profit organizations (205 | 7.5%) make up the most common classes of employment.
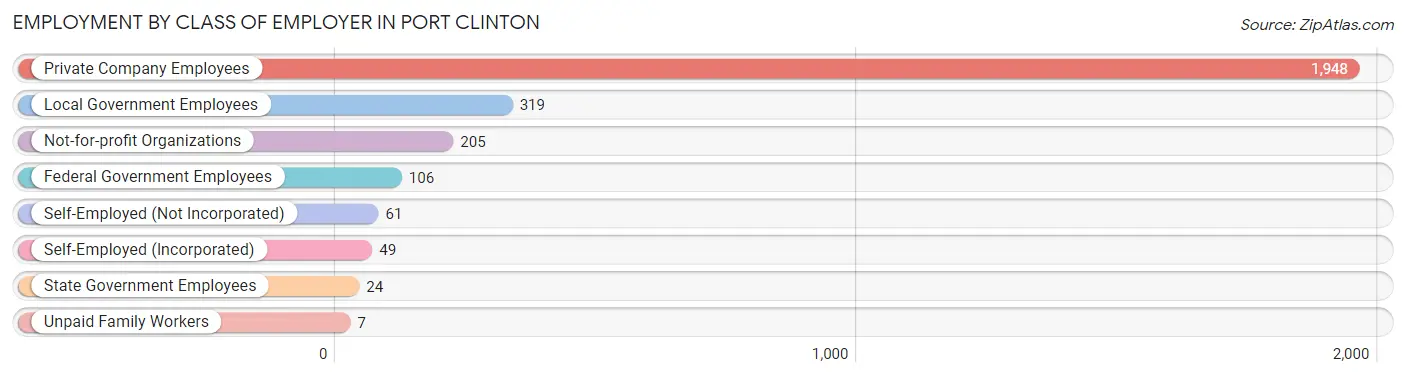
| Employer Class | # Employees | % Employees |
| Private Company Employees | 1,948 | 71.6% |
| Self-Employed (Incorporated) | 49 | 1.8% |
| Self-Employed (Not Incorporated) | 61 | 2.2% |
| Not-for-profit Organizations | 205 | 7.5% |
| Local Government Employees | 319 | 11.7% |
| State Government Employees | 24 | 0.9% |
| Federal Government Employees | 106 | 3.9% |
| Unpaid Family Workers | 7 | 0.3% |
| Total | 2,719 | 100.0% |
Employment Status by Age in Port Clinton
According to the labor force statistics for Port Clinton, out of the total population over 16 years of age (5,082), 57.9% or 2,942 individuals are in the labor force, with 5.3% or 156 of them unemployed. The age group with the highest labor force participation rate is 25 to 29 years, with 89.7% or 367 individuals in the labor force. Within the labor force, the 35 to 44 years age range has the highest percentage of unemployed individuals, with 16.0% or 94 of them being unemployed.
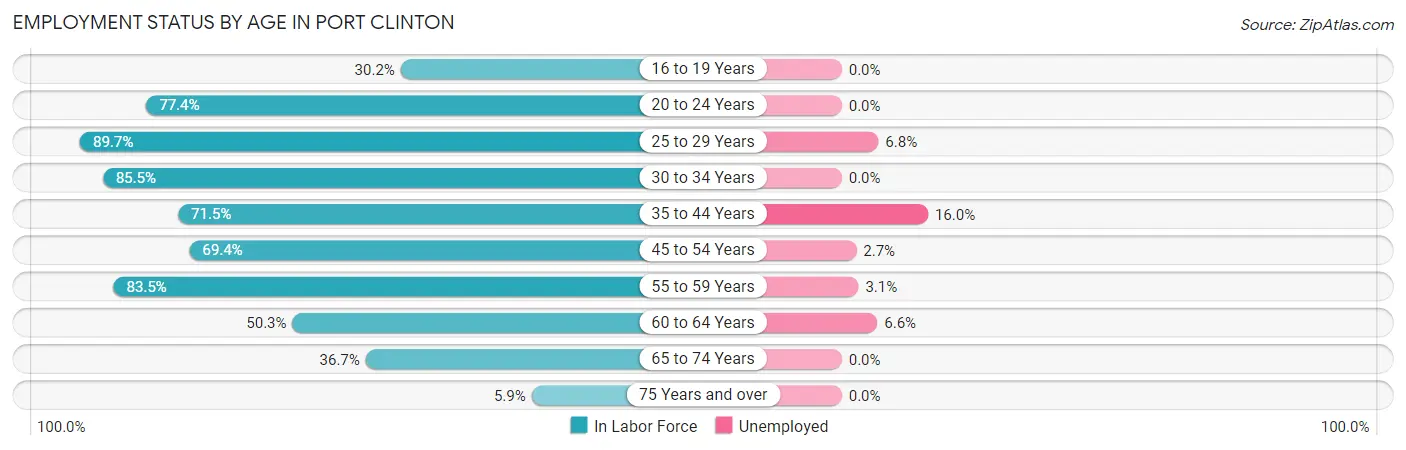
| Age Bracket | In Labor Force | Unemployed |
| 16 to 19 Years | 86 (30.2%) | 0 (0.0%) |
| 20 to 24 Years | 171 (77.4%) | 0 (0.0%) |
| 25 to 29 Years | 367 (89.7%) | 25 (6.8%) |
| 30 to 34 Years | 307 (85.5%) | 0 (0.0%) |
| 35 to 44 Years | 586 (71.5%) | 94 (16.0%) |
| 45 to 54 Years | 566 (69.4%) | 15 (2.7%) |
| 55 to 59 Years | 353 (83.5%) | 11 (3.1%) |
| 60 to 64 Years | 166 (50.3%) | 11 (6.6%) |
| 65 to 74 Years | 309 (36.7%) | 0 (0.0%) |
| 75 Years and over | 34 (5.9%) | 0 (0.0%) |
| Total | 2,942 (57.9%) | 156 (5.3%) |
Employment Status by Educational Attainment in Port Clinton
According to labor force statistics for Port Clinton, 74.3% of individuals (2,345) out of the total population between 25 and 64 years of age (3,156) are in the labor force, with 6.6% or 155 of them being unemployed. The group with the highest labor force participation rate are those with the educational attainment of bachelor's degree or higher, with 89.2% or 527 individuals in the labor force. Within the labor force, individuals with less than high school education have the highest percentage of unemployment, with 17.2% or 36 of them being unemployed.
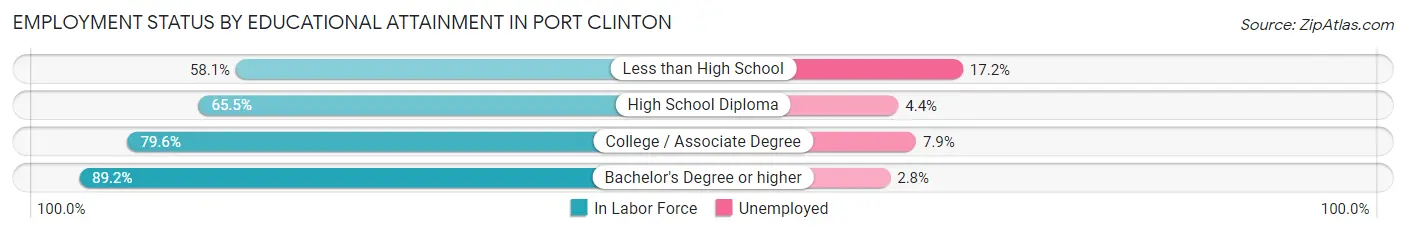
| Educational Attainment | In Labor Force | Unemployed |
| Less than High School | 209 (58.1%) | 62 (17.2%) |
| High School Diploma | 675 (65.5%) | 45 (4.4%) |
| College / Associate Degree | 935 (79.6%) | 93 (7.9%) |
| Bachelor's Degree or higher | 527 (89.2%) | 17 (2.8%) |
| Total | 2,345 (74.3%) | 208 (6.6%) |
Employment Occupations by Sex in Port Clinton
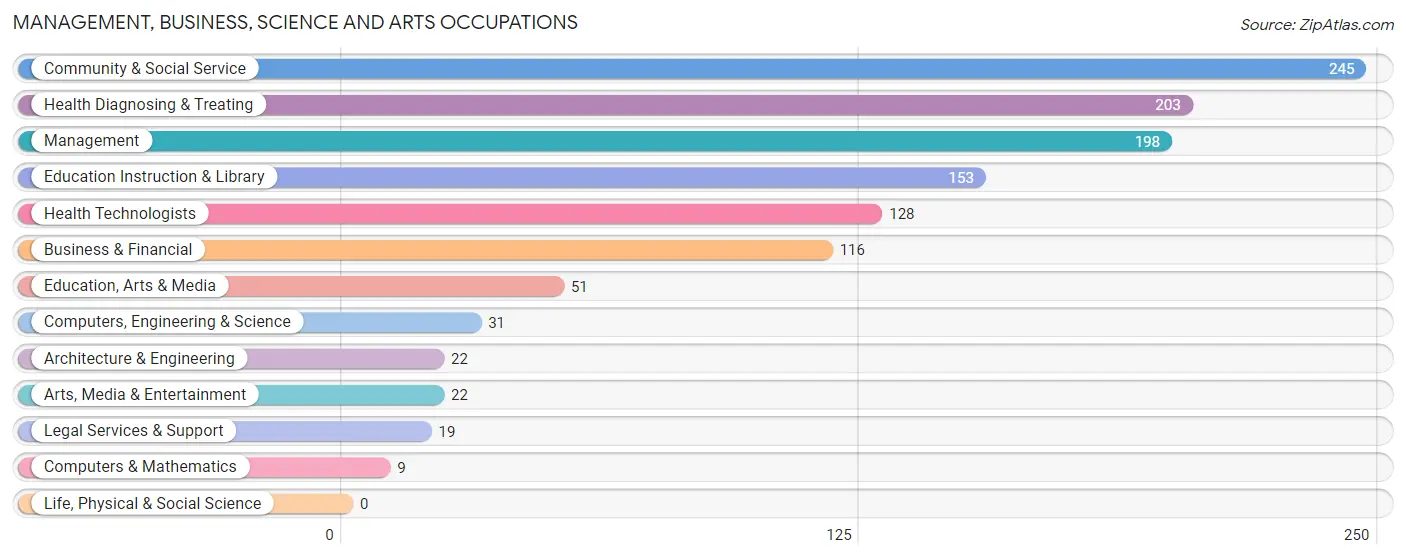
Management, Business, Science and Arts Occupations
The most common Management, Business, Science and Arts occupations in Port Clinton are Community & Social Service (245 | 8.8%), Health Diagnosing & Treating (203 | 7.3%), Management (198 | 7.1%), Education Instruction & Library (153 | 5.5%), and Health Technologists (128 | 4.6%).
Management, Business, Science and Arts Occupations by Sex
Within the Management, Business, Science and Arts occupations in Port Clinton, the most male-oriented occupations are Architecture & Engineering (100.0%), Arts, Media & Entertainment (100.0%), and Computers, Engineering & Science (71.0%), while the most female-oriented occupations are Computers & Mathematics (100.0%), Education, Arts & Media (100.0%), and Legal Services & Support (100.0%).
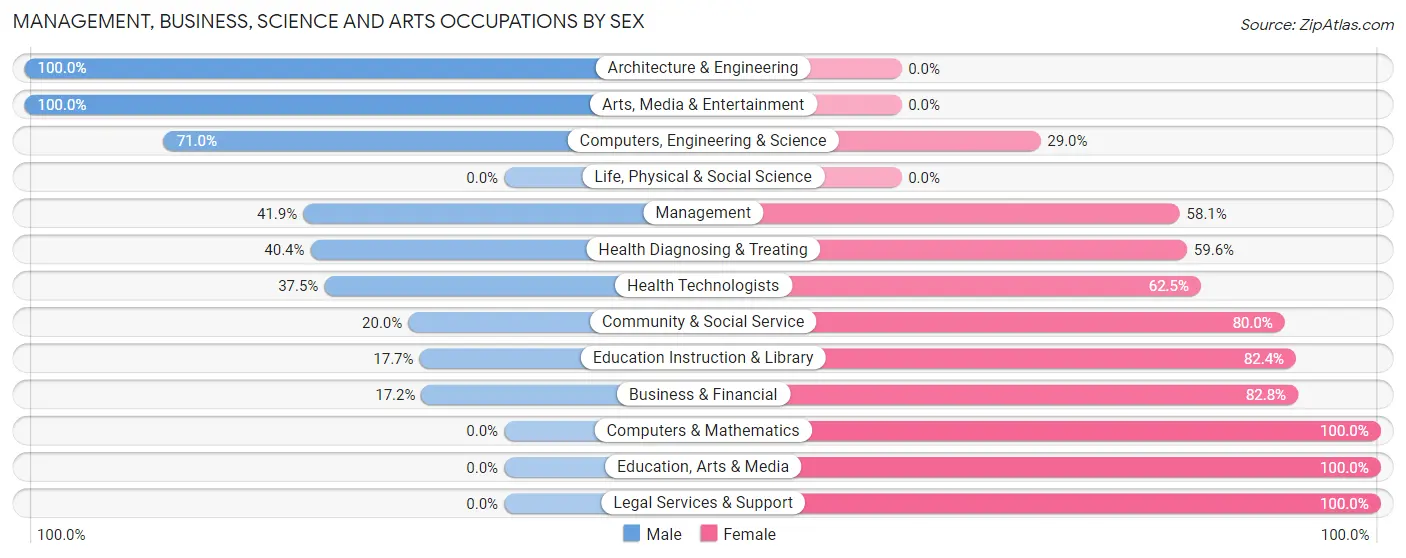
| Occupation | Male | Female |
| Management | 83 (41.9%) | 115 (58.1%) |
| Business & Financial | 20 (17.2%) | 96 (82.8%) |
| Computers, Engineering & Science | 22 (71.0%) | 9 (29.0%) |
| Computers & Mathematics | 0 (0.0%) | 9 (100.0%) |
| Architecture & Engineering | 22 (100.0%) | 0 (0.0%) |
| Life, Physical & Social Science | 0 (0.0%) | 0 (0.0%) |
| Community & Social Service | 49 (20.0%) | 196 (80.0%) |
| Education, Arts & Media | 0 (0.0%) | 51 (100.0%) |
| Legal Services & Support | 0 (0.0%) | 19 (100.0%) |
| Education Instruction & Library | 27 (17.6%) | 126 (82.4%) |
| Arts, Media & Entertainment | 22 (100.0%) | 0 (0.0%) |
| Health Diagnosing & Treating | 82 (40.4%) | 121 (59.6%) |
| Health Technologists | 48 (37.5%) | 80 (62.5%) |
| Total (Category) | 256 (32.3%) | 537 (67.7%) |
| Total (Overall) | 1,302 (46.9%) | 1,477 (53.1%) |
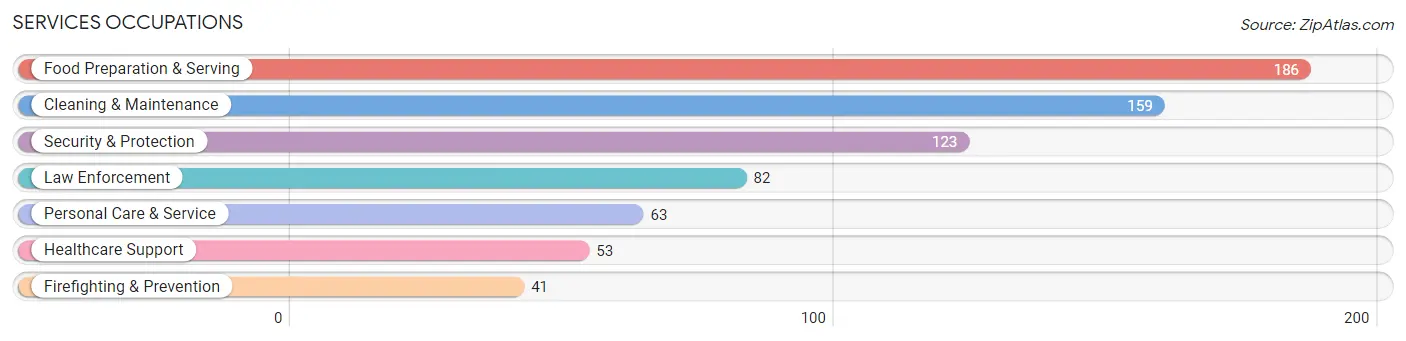
Services Occupations
The most common Services occupations in Port Clinton are Food Preparation & Serving (186 | 6.7%), Cleaning & Maintenance (159 | 5.7%), Security & Protection (123 | 4.4%), Law Enforcement (82 | 2.9%), and Personal Care & Service (63 | 2.3%).
Services Occupations by Sex
Within the Services occupations in Port Clinton, the most male-oriented occupations are Law Enforcement (100.0%), Security & Protection (79.7%), and Food Preparation & Serving (59.7%), while the most female-oriented occupations are Personal Care & Service (87.3%), Healthcare Support (79.2%), and Cleaning & Maintenance (70.4%).
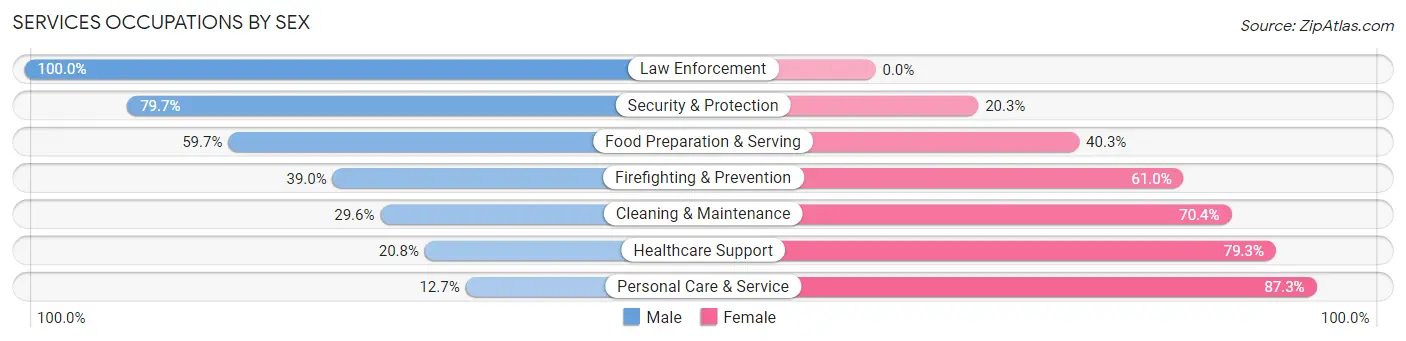
| Occupation | Male | Female |
| Healthcare Support | 11 (20.7%) | 42 (79.2%) |
| Security & Protection | 98 (79.7%) | 25 (20.3%) |
| Firefighting & Prevention | 16 (39.0%) | 25 (61.0%) |
| Law Enforcement | 82 (100.0%) | 0 (0.0%) |
| Food Preparation & Serving | 111 (59.7%) | 75 (40.3%) |
| Cleaning & Maintenance | 47 (29.6%) | 112 (70.4%) |
| Personal Care & Service | 8 (12.7%) | 55 (87.3%) |
| Total (Category) | 275 (47.1%) | 309 (52.9%) |
| Total (Overall) | 1,302 (46.9%) | 1,477 (53.1%) |
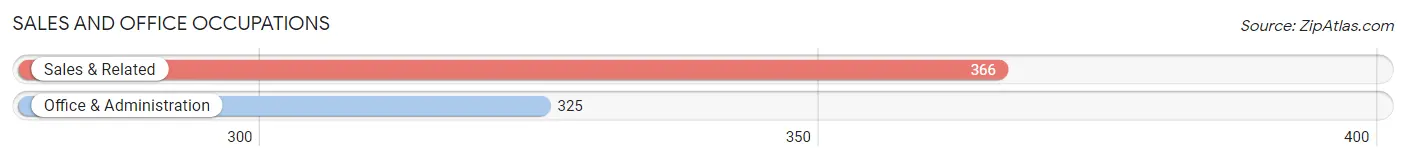
Sales and Office Occupations
The most common Sales and Office occupations in Port Clinton are Sales & Related (366 | 13.2%), and Office & Administration (325 | 11.7%).
Sales and Office Occupations by Sex
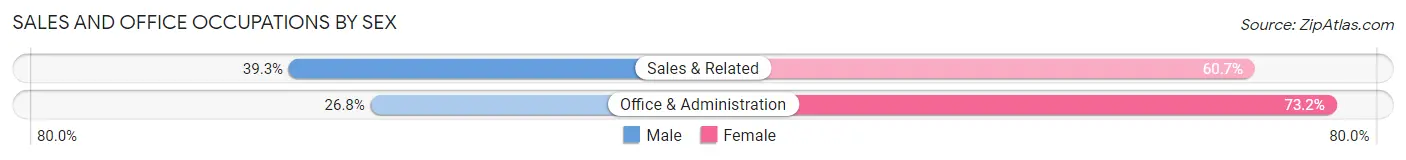
| Occupation | Male | Female |
| Sales & Related | 144 (39.3%) | 222 (60.7%) |
| Office & Administration | 87 (26.8%) | 238 (73.2%) |
| Total (Category) | 231 (33.4%) | 460 (66.6%) |
| Total (Overall) | 1,302 (46.9%) | 1,477 (53.1%) |
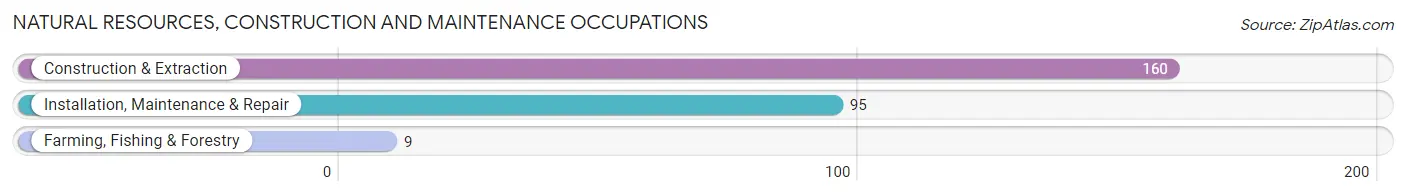
Natural Resources, Construction and Maintenance Occupations
The most common Natural Resources, Construction and Maintenance occupations in Port Clinton are Construction & Extraction (160 | 5.8%), Installation, Maintenance & Repair (95 | 3.4%), and Farming, Fishing & Forestry (9 | 0.3%).
Natural Resources, Construction and Maintenance Occupations by Sex
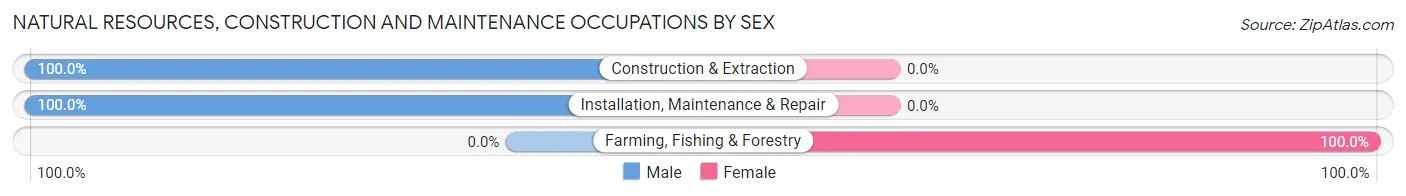
| Occupation | Male | Female |
| Farming, Fishing & Forestry | 0 (0.0%) | 9 (100.0%) |
| Construction & Extraction | 160 (100.0%) | 0 (0.0%) |
| Installation, Maintenance & Repair | 95 (100.0%) | 0 (0.0%) |
| Total (Category) | 255 (96.6%) | 9 (3.4%) |
| Total (Overall) | 1,302 (46.9%) | 1,477 (53.1%) |
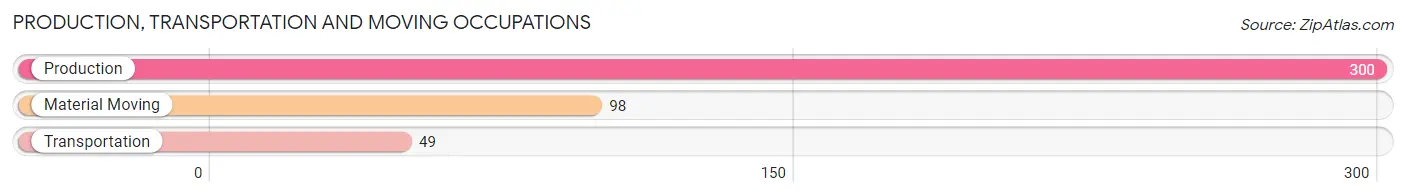
Production, Transportation and Moving Occupations
The most common Production, Transportation and Moving occupations in Port Clinton are Production (300 | 10.8%), Material Moving (98 | 3.5%), and Transportation (49 | 1.8%).
Production, Transportation and Moving Occupations by Sex
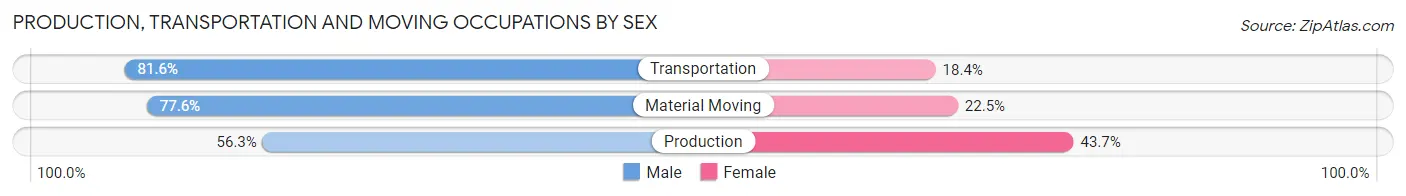
| Occupation | Male | Female |
| Production | 169 (56.3%) | 131 (43.7%) |
| Transportation | 40 (81.6%) | 9 (18.4%) |
| Material Moving | 76 (77.5%) | 22 (22.5%) |
| Total (Category) | 285 (63.8%) | 162 (36.2%) |
| Total (Overall) | 1,302 (46.9%) | 1,477 (53.1%) |
Employment Industries by Sex in Port Clinton
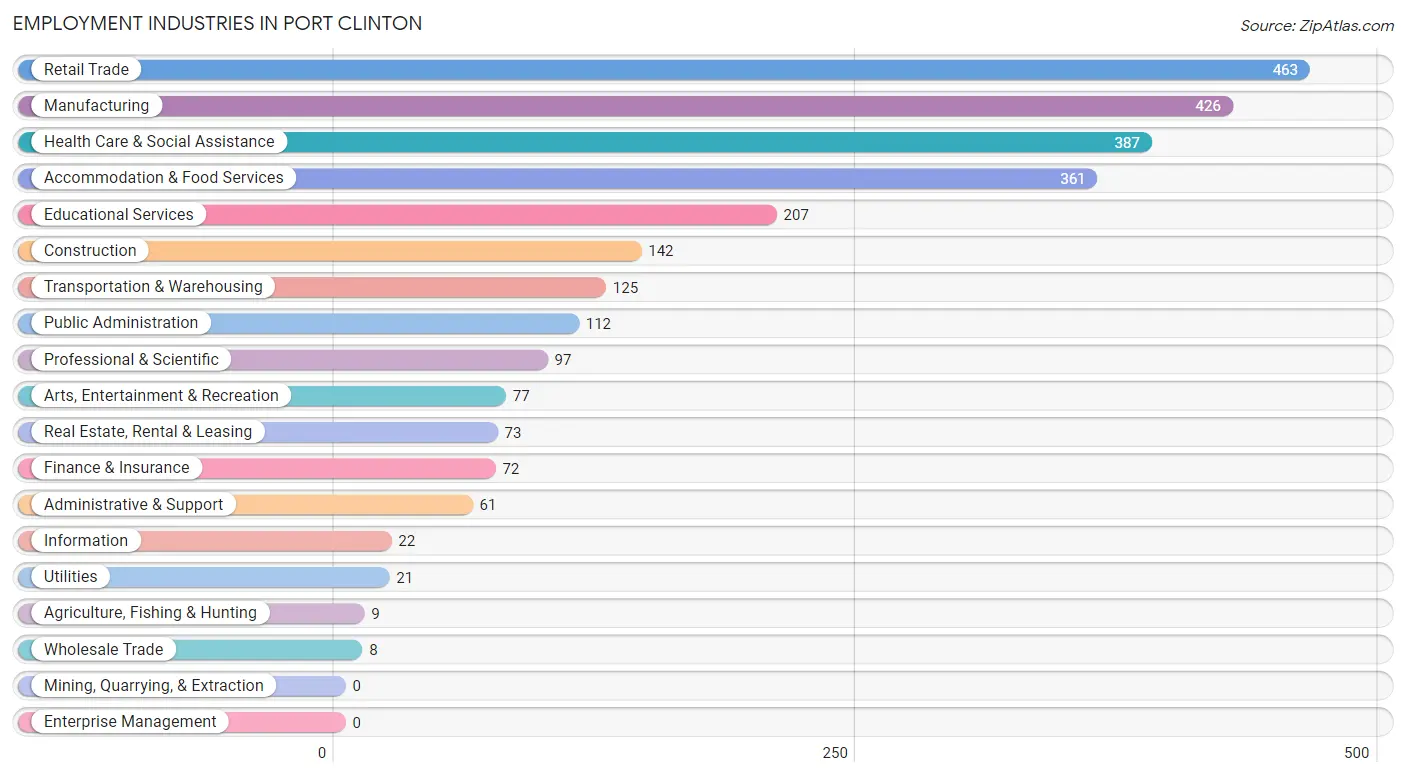
Employment Industries in Port Clinton
The major employment industries in Port Clinton include Retail Trade (463 | 16.7%), Manufacturing (426 | 15.3%), Health Care & Social Assistance (387 | 13.9%), Accommodation & Food Services (361 | 13.0%), and Educational Services (207 | 7.4%).
Employment Industries by Sex in Port Clinton
The Port Clinton industries that see more men than women are Construction (100.0%), Wholesale Trade (100.0%), and Transportation & Warehousing (83.2%), whereas the industries that tend to have a higher number of women are Agriculture, Fishing & Hunting (100.0%), Professional & Scientific (89.7%), and Educational Services (83.6%).
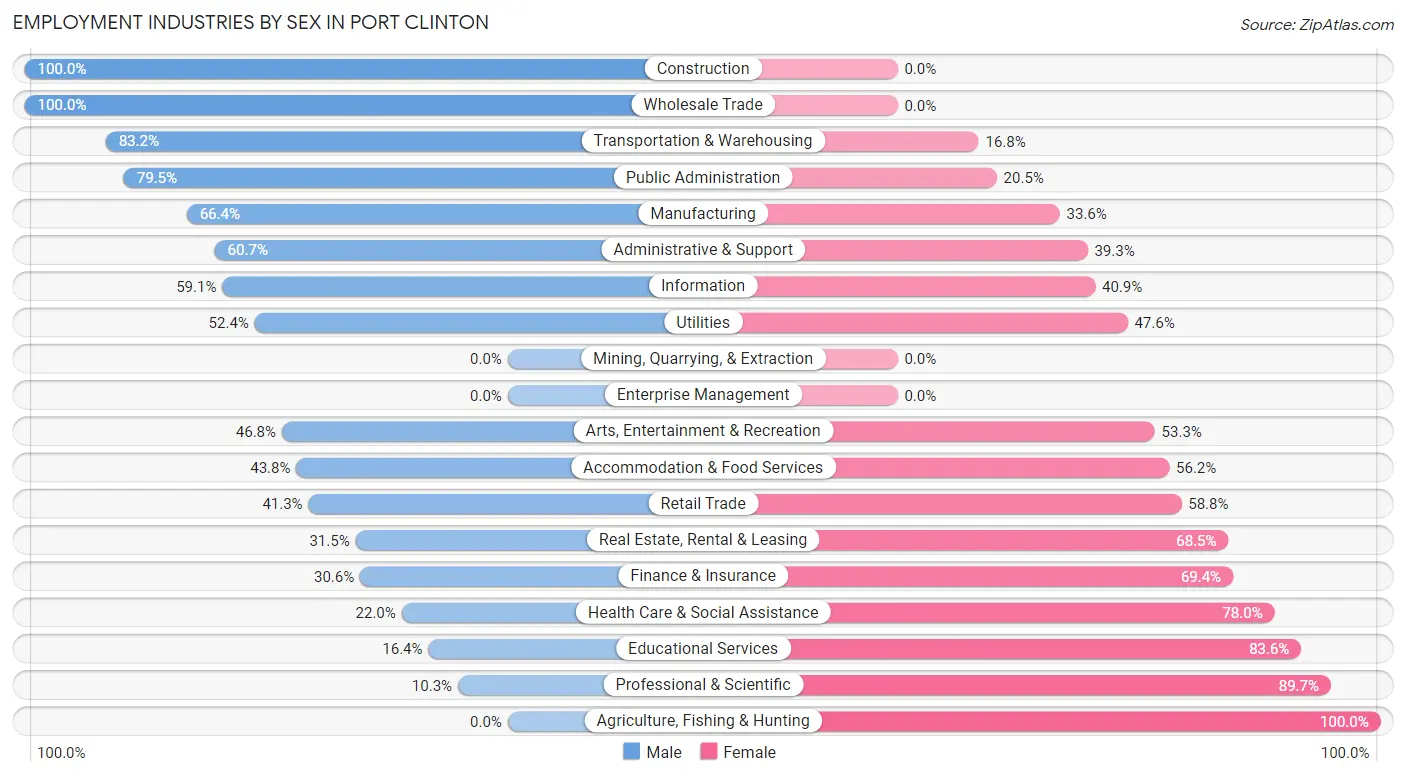
| Industry | Male | Female |
| Agriculture, Fishing & Hunting | 0 (0.0%) | 9 (100.0%) |
| Mining, Quarrying, & Extraction | 0 (0.0%) | 0 (0.0%) |
| Construction | 142 (100.0%) | 0 (0.0%) |
| Manufacturing | 283 (66.4%) | 143 (33.6%) |
| Wholesale Trade | 8 (100.0%) | 0 (0.0%) |
| Retail Trade | 191 (41.2%) | 272 (58.8%) |
| Transportation & Warehousing | 104 (83.2%) | 21 (16.8%) |
| Utilities | 11 (52.4%) | 10 (47.6%) |
| Information | 13 (59.1%) | 9 (40.9%) |
| Finance & Insurance | 22 (30.6%) | 50 (69.4%) |
| Real Estate, Rental & Leasing | 23 (31.5%) | 50 (68.5%) |
| Professional & Scientific | 10 (10.3%) | 87 (89.7%) |
| Enterprise Management | 0 (0.0%) | 0 (0.0%) |
| Administrative & Support | 37 (60.7%) | 24 (39.3%) |
| Educational Services | 34 (16.4%) | 173 (83.6%) |
| Health Care & Social Assistance | 85 (22.0%) | 302 (78.0%) |
| Arts, Entertainment & Recreation | 36 (46.8%) | 41 (53.2%) |
| Accommodation & Food Services | 158 (43.8%) | 203 (56.2%) |
| Public Administration | 89 (79.5%) | 23 (20.5%) |
| Total | 1,302 (46.9%) | 1,477 (53.1%) |
Education in Port Clinton
School Enrollment in Port Clinton
The most common levels of schooling among the 882 students in Port Clinton are high school (311 | 35.3%), middle school (246 | 27.9%), and elementary school (175 | 19.8%).
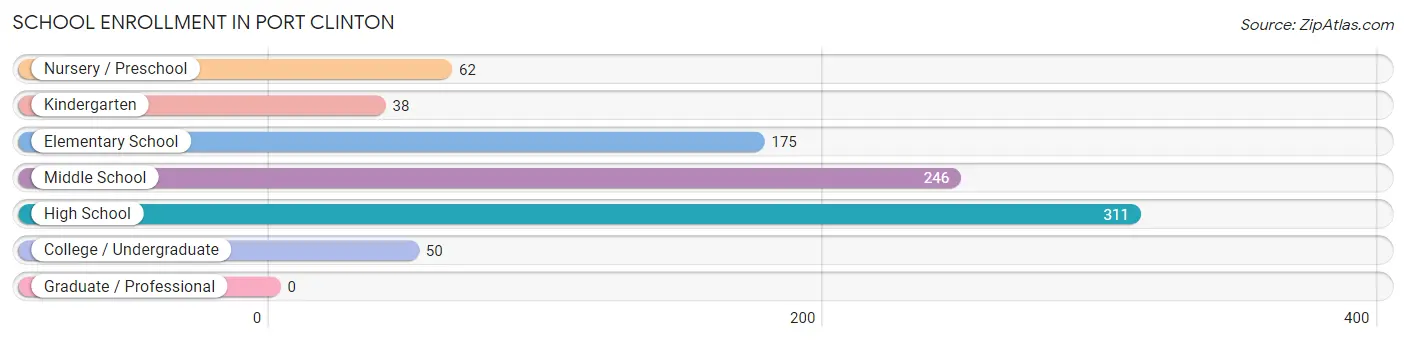
| School Level | # Students | % Students |
| Nursery / Preschool | 62 | 7.0% |
| Kindergarten | 38 | 4.3% |
| Elementary School | 175 | 19.8% |
| Middle School | 246 | 27.9% |
| High School | 311 | 35.3% |
| College / Undergraduate | 50 | 5.7% |
| Graduate / Professional | 0 | 0.0% |
| Total | 882 | 100.0% |
School Enrollment by Age by Funding Source in Port Clinton
Out of a total of 882 students who are enrolled in schools in Port Clinton, 74 (8.4%) attend a private institution, while the remaining 808 (91.6%) are enrolled in public schools. The age group of 20 to 24 year olds has the highest likelihood of being enrolled in private schools, with 20 (100.0% in the age bracket) enrolled. Conversely, the age group of 3 to 4 year olds has the lowest likelihood of being enrolled in a private school, with 15 (100.0% in the age bracket) attending a public institution.
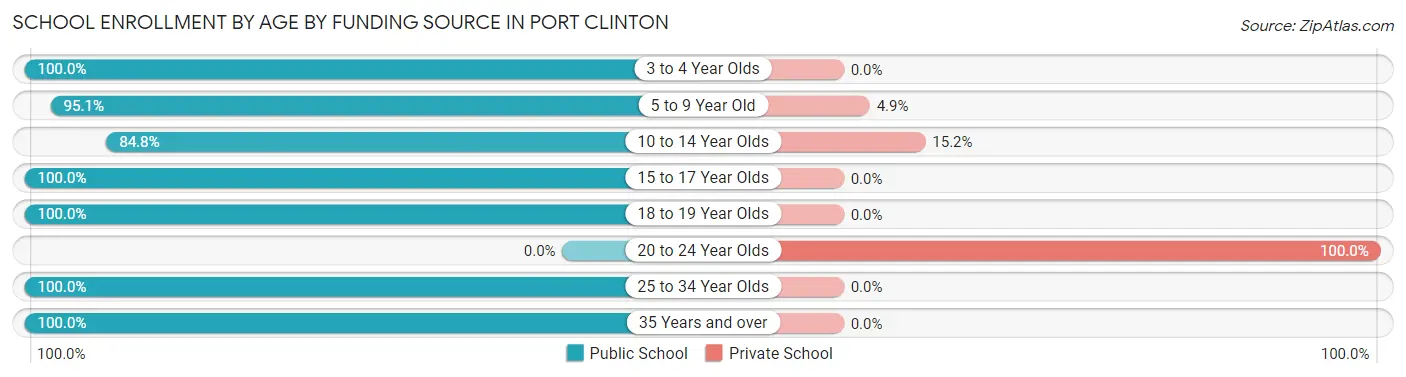
| Age Bracket | Public School | Private School |
| 3 to 4 Year Olds | 15 (100.0%) | 0 (0.0%) |
| 5 to 9 Year Old | 235 (95.1%) | 12 (4.9%) |
| 10 to 14 Year Olds | 234 (84.8%) | 42 (15.2%) |
| 15 to 17 Year Olds | 241 (100.0%) | 0 (0.0%) |
| 18 to 19 Year Olds | 53 (100.0%) | 0 (0.0%) |
| 20 to 24 Year Olds | 0 (0.0%) | 20 (100.0%) |
| 25 to 34 Year Olds | 12 (100.0%) | 0 (0.0%) |
| 35 Years and over | 18 (100.0%) | 0 (0.0%) |
| Total | 808 (91.6%) | 74 (8.4%) |
Educational Attainment by Field of Study in Port Clinton
Education (223 | 26.1%), business (137 | 16.0%), science & technology (132 | 15.4%), arts & humanities (75 | 8.8%), and liberal arts & history (58 | 6.8%) are the most common fields of study among 855 individuals in Port Clinton who have obtained a bachelor's degree or higher.
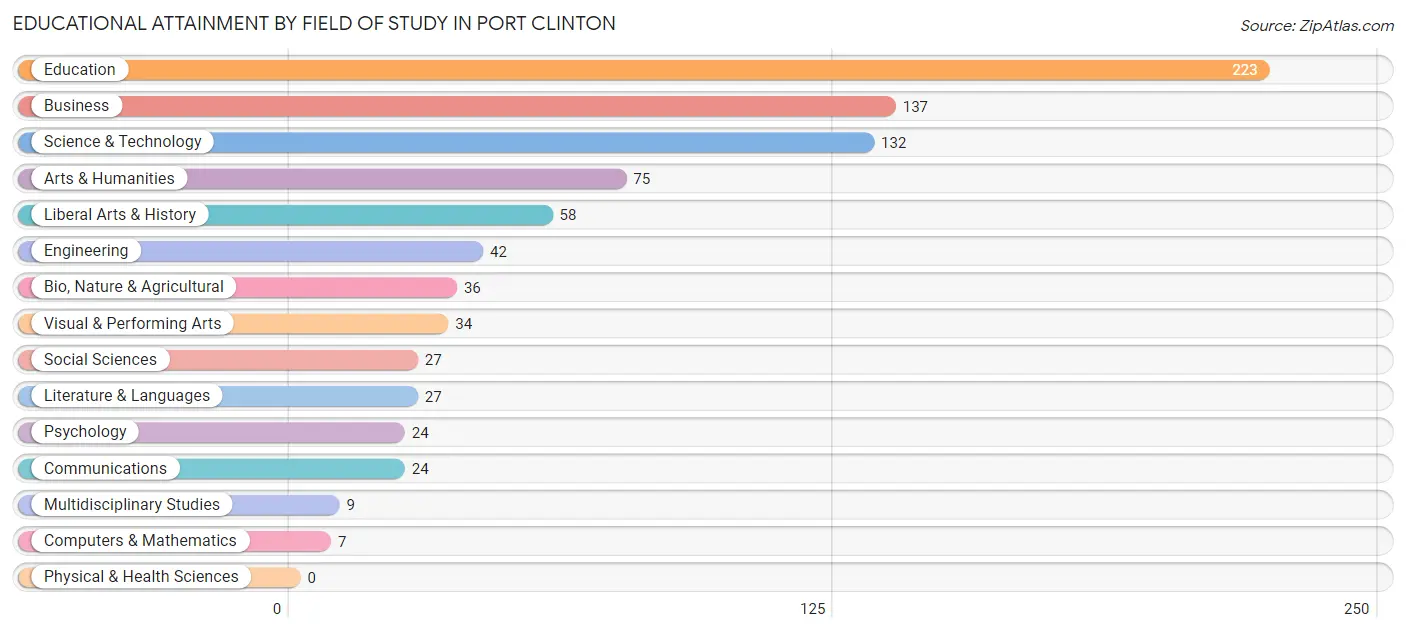
| Field of Study | # Graduates | % Graduates |
| Computers & Mathematics | 7 | 0.8% |
| Bio, Nature & Agricultural | 36 | 4.2% |
| Physical & Health Sciences | 0 | 0.0% |
| Psychology | 24 | 2.8% |
| Social Sciences | 27 | 3.2% |
| Engineering | 42 | 4.9% |
| Multidisciplinary Studies | 9 | 1.1% |
| Science & Technology | 132 | 15.4% |
| Business | 137 | 16.0% |
| Education | 223 | 26.1% |
| Literature & Languages | 27 | 3.2% |
| Liberal Arts & History | 58 | 6.8% |
| Visual & Performing Arts | 34 | 4.0% |
| Communications | 24 | 2.8% |
| Arts & Humanities | 75 | 8.8% |
| Total | 855 | 100.0% |
Transportation & Commute in Port Clinton
Vehicle Availability by Sex in Port Clinton
The most prevalent vehicle ownership categories in Port Clinton are males with 2 vehicles (519, accounting for 39.6%) and females with 2 vehicles (462, making up 36.9%).
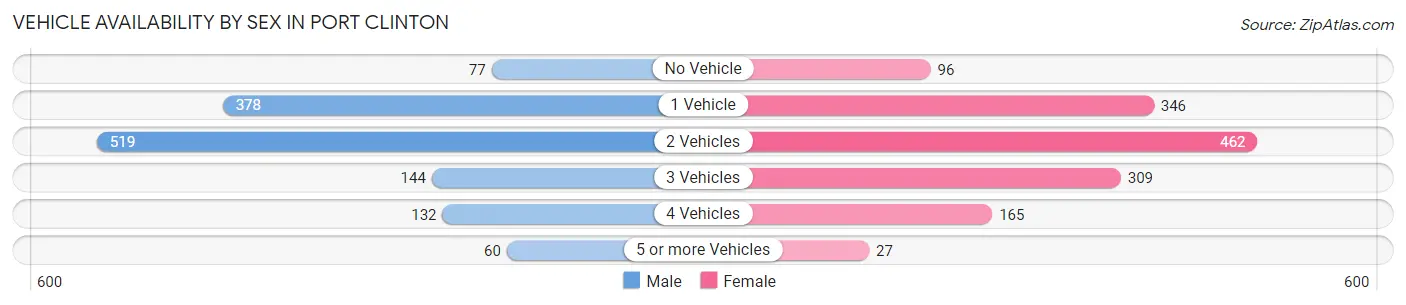
| Vehicles Available | Male | Female |
| No Vehicle | 77 (5.9%) | 96 (6.8%) |
| 1 Vehicle | 378 (28.8%) | 346 (24.6%) |
| 2 Vehicles | 519 (39.6%) | 462 (32.9%) |
| 3 Vehicles | 144 (11.0%) | 309 (22.0%) |
| 4 Vehicles | 132 (10.1%) | 165 (11.7%) |
| 5 or more Vehicles | 60 (4.6%) | 27 (1.9%) |
| Total | 1,310 (100.0%) | 1,405 (100.0%) |
Commute Time in Port Clinton
The most frequently occuring commute durations in Port Clinton are 5 to 9 minutes (675 commuters, 25.8%), 15 to 19 minutes (512 commuters, 19.6%), and 10 to 14 minutes (431 commuters, 16.5%).
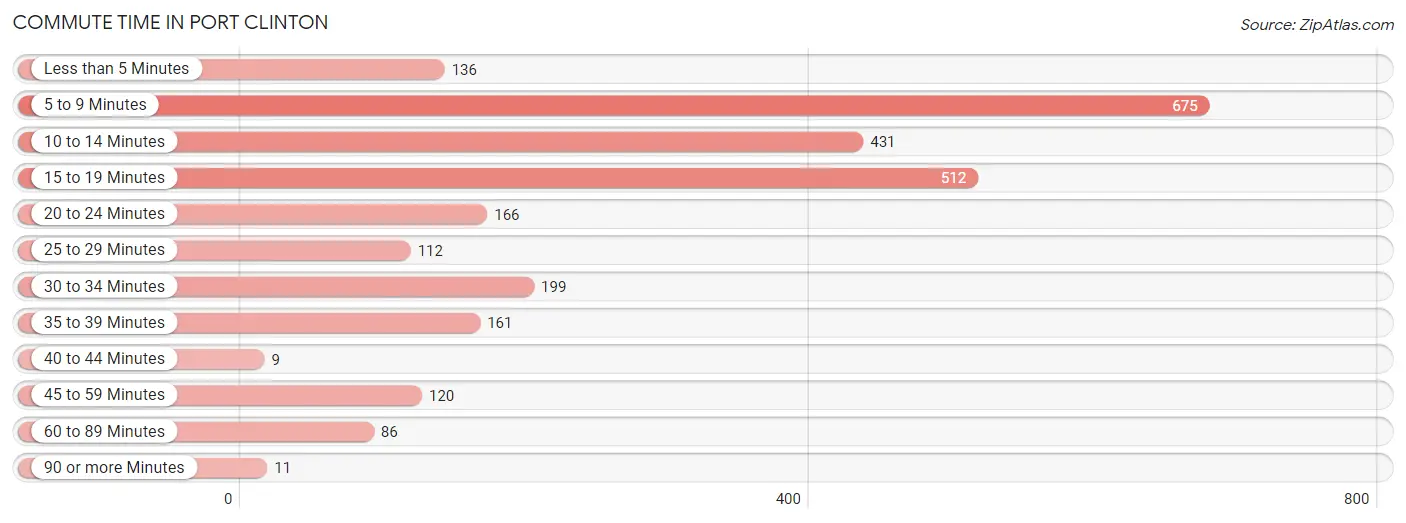
| Commute Time | # Commuters | % Commuters |
| Less than 5 Minutes | 136 | 5.2% |
| 5 to 9 Minutes | 675 | 25.8% |
| 10 to 14 Minutes | 431 | 16.5% |
| 15 to 19 Minutes | 512 | 19.6% |
| 20 to 24 Minutes | 166 | 6.3% |
| 25 to 29 Minutes | 112 | 4.3% |
| 30 to 34 Minutes | 199 | 7.6% |
| 35 to 39 Minutes | 161 | 6.1% |
| 40 to 44 Minutes | 9 | 0.3% |
| 45 to 59 Minutes | 120 | 4.6% |
| 60 to 89 Minutes | 86 | 3.3% |
| 90 or more Minutes | 11 | 0.4% |
Commute Time by Sex in Port Clinton
The most common commute times in Port Clinton are 15 to 19 minutes (320 commuters, 24.9%) for males and 5 to 9 minutes (503 commuters, 37.8%) for females.
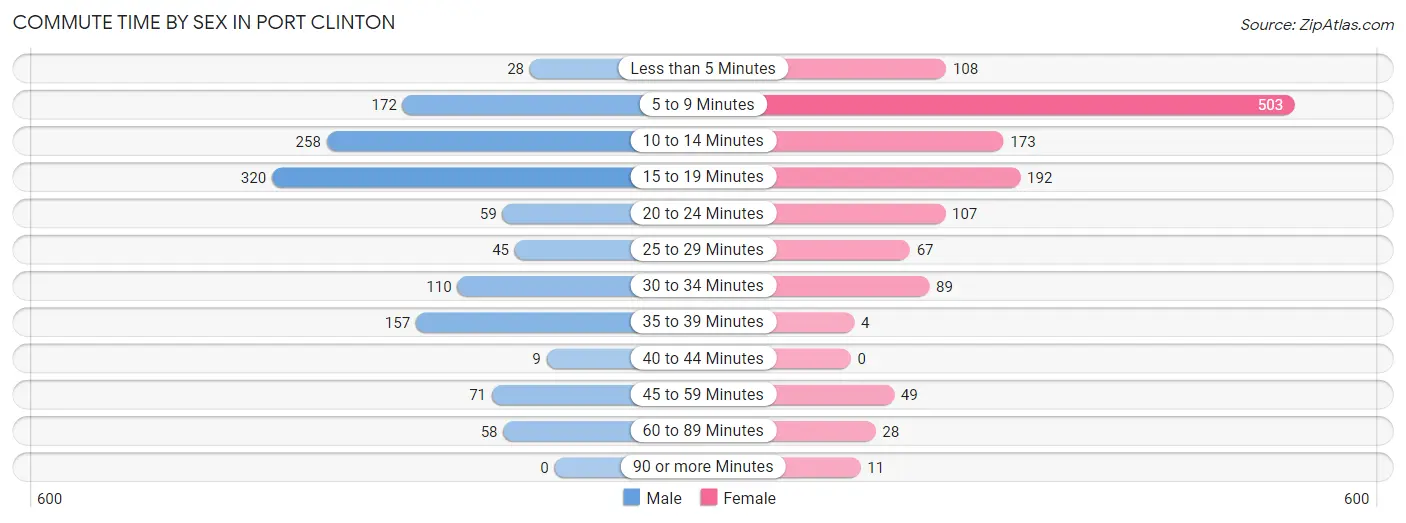
| Commute Time | Male | Female |
| Less than 5 Minutes | 28 (2.2%) | 108 (8.1%) |
| 5 to 9 Minutes | 172 (13.4%) | 503 (37.8%) |
| 10 to 14 Minutes | 258 (20.1%) | 173 (13.0%) |
| 15 to 19 Minutes | 320 (24.9%) | 192 (14.4%) |
| 20 to 24 Minutes | 59 (4.6%) | 107 (8.0%) |
| 25 to 29 Minutes | 45 (3.5%) | 67 (5.0%) |
| 30 to 34 Minutes | 110 (8.6%) | 89 (6.7%) |
| 35 to 39 Minutes | 157 (12.2%) | 4 (0.3%) |
| 40 to 44 Minutes | 9 (0.7%) | 0 (0.0%) |
| 45 to 59 Minutes | 71 (5.5%) | 49 (3.7%) |
| 60 to 89 Minutes | 58 (4.5%) | 28 (2.1%) |
| 90 or more Minutes | 0 (0.0%) | 11 (0.8%) |
Time of Departure to Work by Sex in Port Clinton
The most frequent times of departure to work in Port Clinton are 6:30 AM to 6:59 AM (201, 15.6%) for males and 7:00 AM to 7:29 AM (315, 23.7%) for females.
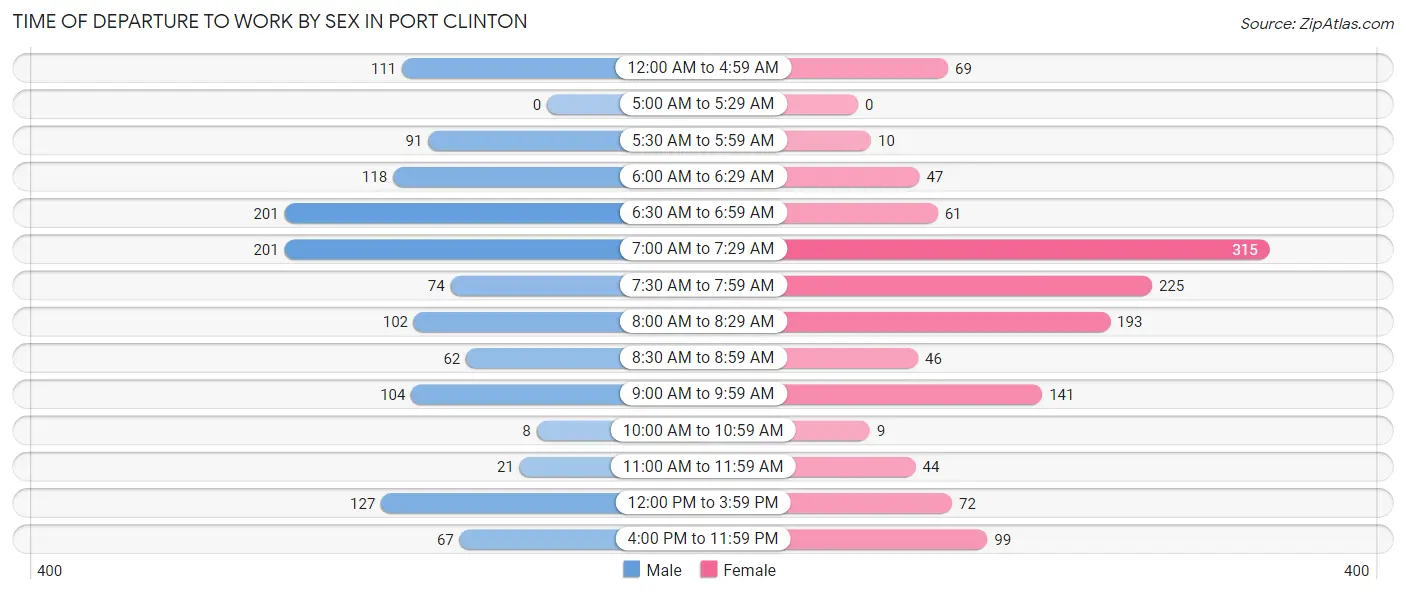
| Time of Departure | Male | Female |
| 12:00 AM to 4:59 AM | 111 (8.6%) | 69 (5.2%) |
| 5:00 AM to 5:29 AM | 0 (0.0%) | 0 (0.0%) |
| 5:30 AM to 5:59 AM | 91 (7.1%) | 10 (0.7%) |
| 6:00 AM to 6:29 AM | 118 (9.2%) | 47 (3.5%) |
| 6:30 AM to 6:59 AM | 201 (15.6%) | 61 (4.6%) |
| 7:00 AM to 7:29 AM | 201 (15.6%) | 315 (23.7%) |
| 7:30 AM to 7:59 AM | 74 (5.8%) | 225 (16.9%) |
| 8:00 AM to 8:29 AM | 102 (7.9%) | 193 (14.5%) |
| 8:30 AM to 8:59 AM | 62 (4.8%) | 46 (3.5%) |
| 9:00 AM to 9:59 AM | 104 (8.1%) | 141 (10.6%) |
| 10:00 AM to 10:59 AM | 8 (0.6%) | 9 (0.7%) |
| 11:00 AM to 11:59 AM | 21 (1.6%) | 44 (3.3%) |
| 12:00 PM to 3:59 PM | 127 (9.9%) | 72 (5.4%) |
| 4:00 PM to 11:59 PM | 67 (5.2%) | 99 (7.4%) |
| Total | 1,287 (100.0%) | 1,331 (100.0%) |
Housing Occupancy in Port Clinton
Occupancy by Ownership in Port Clinton
Of the total 2,942 dwellings in Port Clinton, owner-occupied units account for 2,111 (71.8%), while renter-occupied units make up 831 (28.2%).
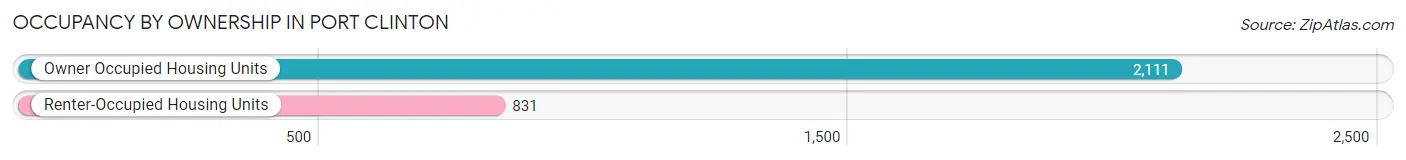
| Occupancy | # Housing Units | % Housing Units |
| Owner Occupied Housing Units | 2,111 | 71.8% |
| Renter-Occupied Housing Units | 831 | 28.2% |
| Total Occupied Housing Units | 2,942 | 100.0% |
Occupancy by Household Size in Port Clinton
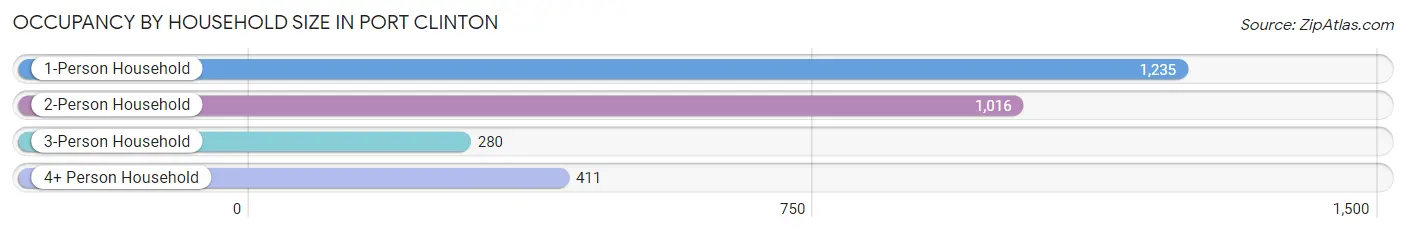
| Household Size | # Housing Units | % Housing Units |
| 1-Person Household | 1,235 | 42.0% |
| 2-Person Household | 1,016 | 34.5% |
| 3-Person Household | 280 | 9.5% |
| 4+ Person Household | 411 | 14.0% |
| Total Housing Units | 2,942 | 100.0% |
Occupancy by Ownership by Household Size in Port Clinton
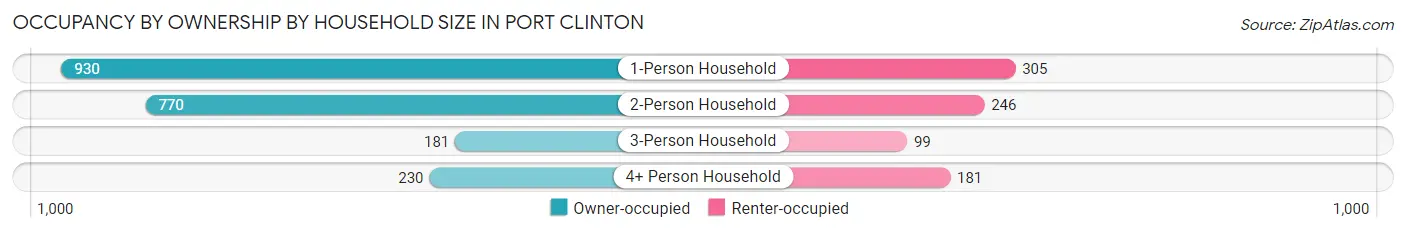
| Household Size | Owner-occupied | Renter-occupied |
| 1-Person Household | 930 (75.3%) | 305 (24.7%) |
| 2-Person Household | 770 (75.8%) | 246 (24.2%) |
| 3-Person Household | 181 (64.6%) | 99 (35.4%) |
| 4+ Person Household | 230 (56.0%) | 181 (44.0%) |
| Total Housing Units | 2,111 (71.8%) | 831 (28.2%) |
Occupancy by Educational Attainment in Port Clinton
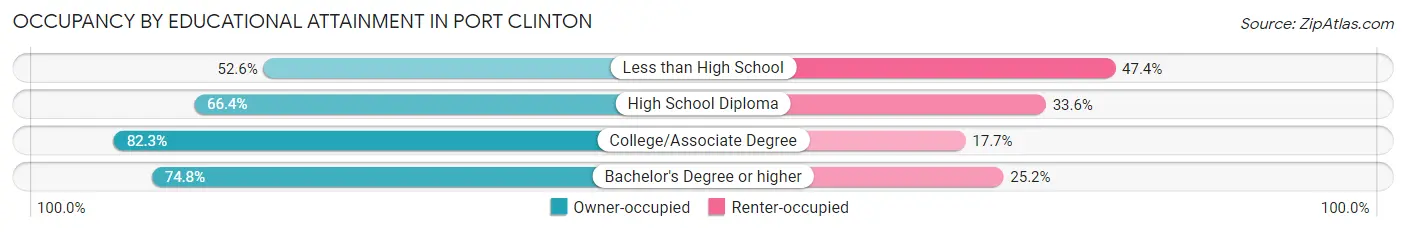
| Household Size | Owner-occupied | Renter-occupied |
| Less than High School | 180 (52.6%) | 162 (47.4%) |
| High School Diploma | 727 (66.4%) | 368 (33.6%) |
| College/Associate Degree | 857 (82.3%) | 184 (17.7%) |
| Bachelor's Degree or higher | 347 (74.8%) | 117 (25.2%) |
Occupancy by Age of Householder in Port Clinton
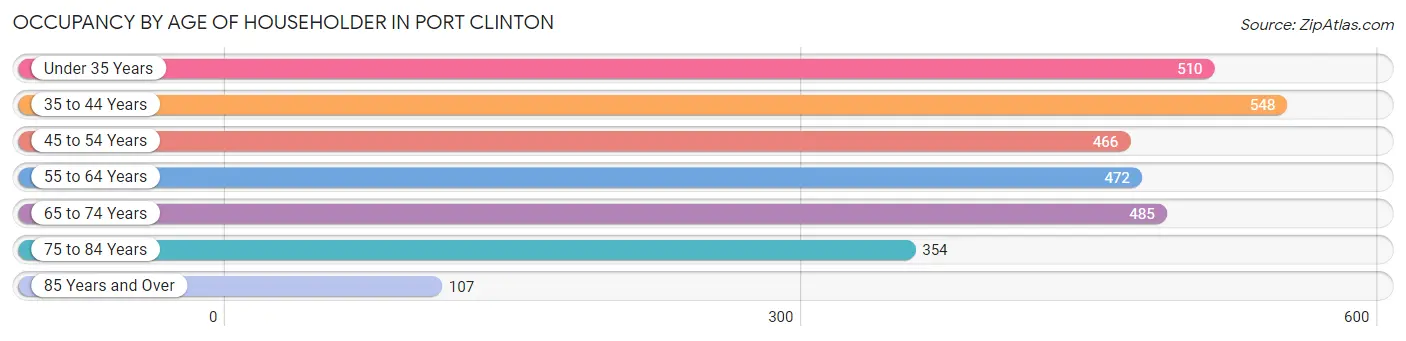
| Age Bracket | # Households | % Households |
| Under 35 Years | 510 | 17.3% |
| 35 to 44 Years | 548 | 18.6% |
| 45 to 54 Years | 466 | 15.8% |
| 55 to 64 Years | 472 | 16.0% |
| 65 to 74 Years | 485 | 16.5% |
| 75 to 84 Years | 354 | 12.0% |
| 85 Years and Over | 107 | 3.6% |
| Total | 2,942 | 100.0% |
Housing Finances in Port Clinton
Median Income by Occupancy in Port Clinton
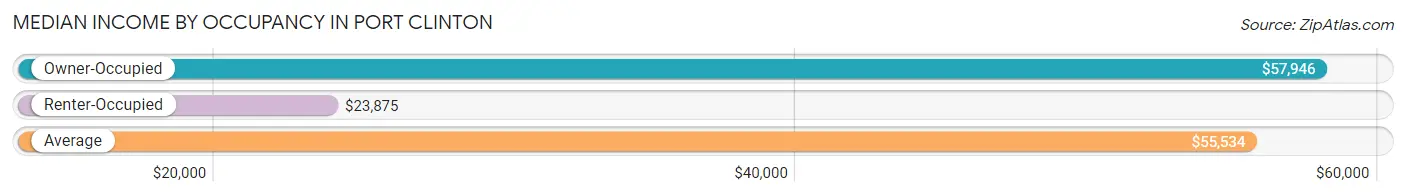
| Occupancy Type | # Households | Median Income |
| Owner-Occupied | 2,111 (71.8%) | $57,946 |
| Renter-Occupied | 831 (28.2%) | $23,875 |
| Average | 2,942 (100.0%) | $55,534 |
Occupancy by Householder Income Bracket in Port Clinton
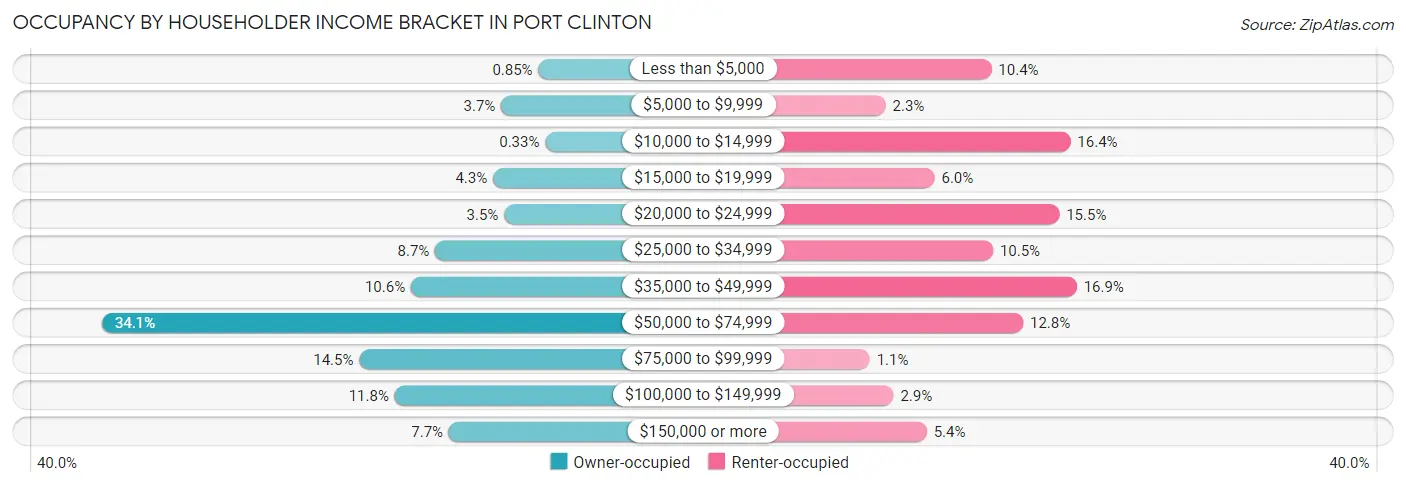
| Income Bracket | Owner-occupied | Renter-occupied |
| Less than $5,000 | 18 (0.9%) | 86 (10.3%) |
| $5,000 to $9,999 | 78 (3.7%) | 19 (2.3%) |
| $10,000 to $14,999 | 7 (0.3%) | 136 (16.4%) |
| $15,000 to $19,999 | 91 (4.3%) | 50 (6.0%) |
| $20,000 to $24,999 | 73 (3.5%) | 129 (15.5%) |
| $25,000 to $34,999 | 184 (8.7%) | 87 (10.5%) |
| $35,000 to $49,999 | 223 (10.6%) | 140 (16.9%) |
| $50,000 to $74,999 | 720 (34.1%) | 106 (12.8%) |
| $75,000 to $99,999 | 306 (14.5%) | 9 (1.1%) |
| $100,000 to $149,999 | 249 (11.8%) | 24 (2.9%) |
| $150,000 or more | 162 (7.7%) | 45 (5.4%) |
| Total | 2,111 (100.0%) | 831 (100.0%) |
Monthly Housing Cost Tiers in Port Clinton
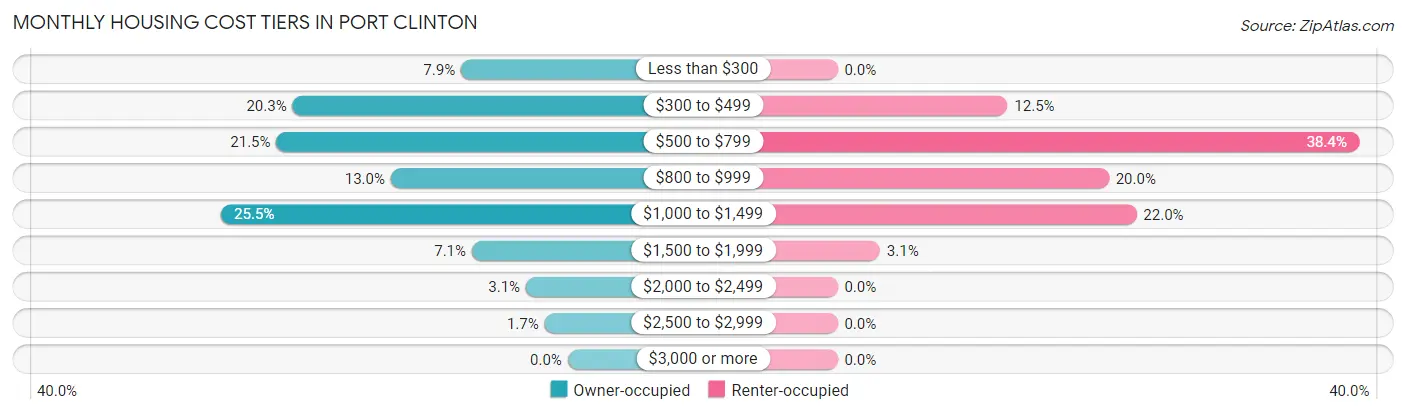
| Monthly Cost | Owner-occupied | Renter-occupied |
| Less than $300 | 166 (7.9%) | 0 (0.0%) |
| $300 to $499 | 428 (20.3%) | 104 (12.5%) |
| $500 to $799 | 453 (21.5%) | 319 (38.4%) |
| $800 to $999 | 275 (13.0%) | 166 (20.0%) |
| $1,000 to $1,499 | 539 (25.5%) | 183 (22.0%) |
| $1,500 to $1,999 | 149 (7.1%) | 26 (3.1%) |
| $2,000 to $2,499 | 65 (3.1%) | 0 (0.0%) |
| $2,500 to $2,999 | 36 (1.7%) | 0 (0.0%) |
| $3,000 or more | 0 (0.0%) | 0 (0.0%) |
| Total | 2,111 (100.0%) | 831 (100.0%) |
Physical Housing Characteristics in Port Clinton
Housing Structures in Port Clinton
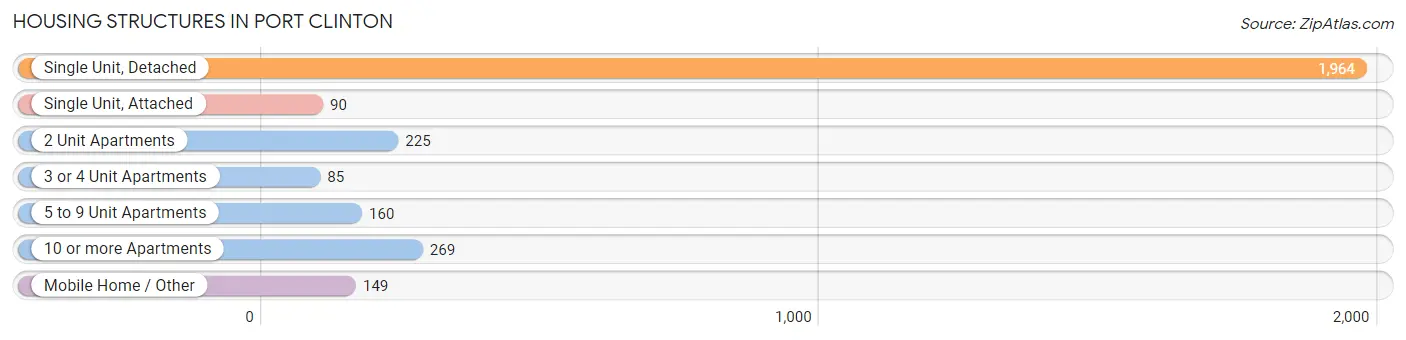
| Structure Type | # Housing Units | % Housing Units |
| Single Unit, Detached | 1,964 | 66.8% |
| Single Unit, Attached | 90 | 3.1% |
| 2 Unit Apartments | 225 | 7.6% |
| 3 or 4 Unit Apartments | 85 | 2.9% |
| 5 to 9 Unit Apartments | 160 | 5.4% |
| 10 or more Apartments | 269 | 9.1% |
| Mobile Home / Other | 149 | 5.1% |
| Total | 2,942 | 100.0% |
Housing Structures by Occupancy in Port Clinton
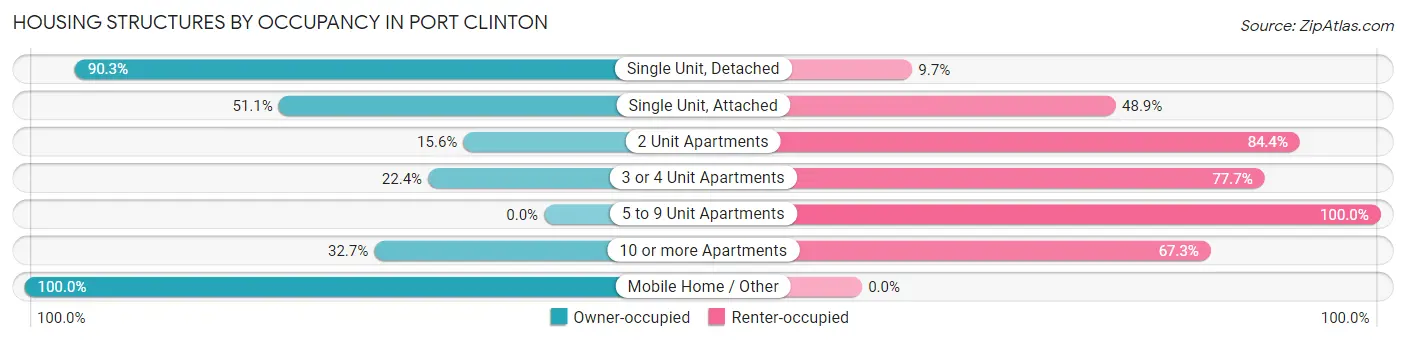
| Structure Type | Owner-occupied | Renter-occupied |
| Single Unit, Detached | 1,774 (90.3%) | 190 (9.7%) |
| Single Unit, Attached | 46 (51.1%) | 44 (48.9%) |
| 2 Unit Apartments | 35 (15.6%) | 190 (84.4%) |
| 3 or 4 Unit Apartments | 19 (22.4%) | 66 (77.6%) |
| 5 to 9 Unit Apartments | 0 (0.0%) | 160 (100.0%) |
| 10 or more Apartments | 88 (32.7%) | 181 (67.3%) |
| Mobile Home / Other | 149 (100.0%) | 0 (0.0%) |
| Total | 2,111 (71.8%) | 831 (28.2%) |
Housing Structures by Number of Rooms in Port Clinton
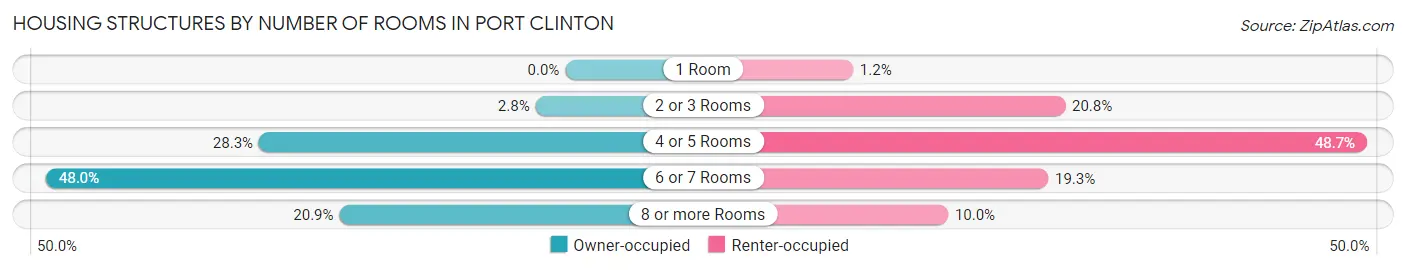
| Number of Rooms | Owner-occupied | Renter-occupied |
| 1 Room | 0 (0.0%) | 10 (1.2%) |
| 2 or 3 Rooms | 58 (2.8%) | 173 (20.8%) |
| 4 or 5 Rooms | 598 (28.3%) | 405 (48.7%) |
| 6 or 7 Rooms | 1,014 (48.0%) | 160 (19.3%) |
| 8 or more Rooms | 441 (20.9%) | 83 (10.0%) |
| Total | 2,111 (100.0%) | 831 (100.0%) |
Housing Structure by Heating Type in Port Clinton
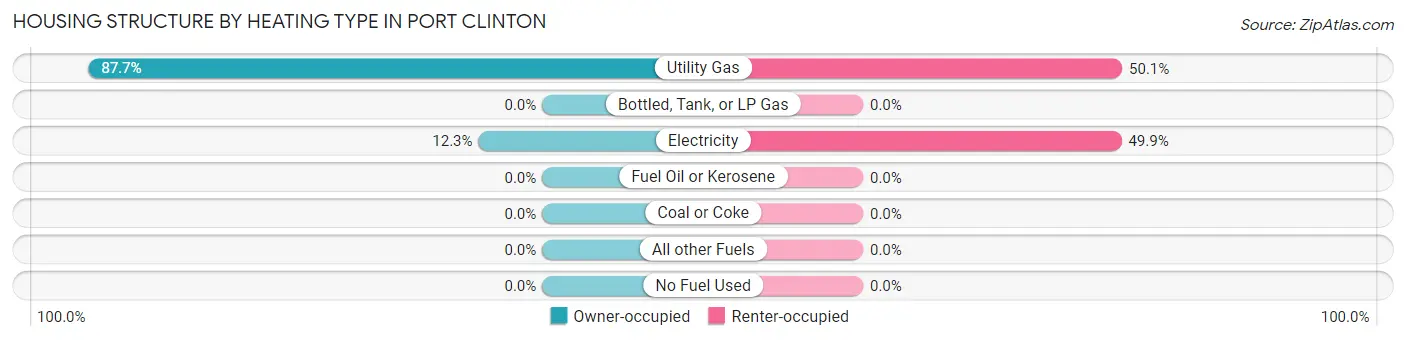
| Heating Type | Owner-occupied | Renter-occupied |
| Utility Gas | 1,851 (87.7%) | 416 (50.1%) |
| Bottled, Tank, or LP Gas | 0 (0.0%) | 0 (0.0%) |
| Electricity | 260 (12.3%) | 415 (49.9%) |
| Fuel Oil or Kerosene | 0 (0.0%) | 0 (0.0%) |
| Coal or Coke | 0 (0.0%) | 0 (0.0%) |
| All other Fuels | 0 (0.0%) | 0 (0.0%) |
| No Fuel Used | 0 (0.0%) | 0 (0.0%) |
| Total | 2,111 (100.0%) | 831 (100.0%) |
Household Vehicle Usage in Port Clinton
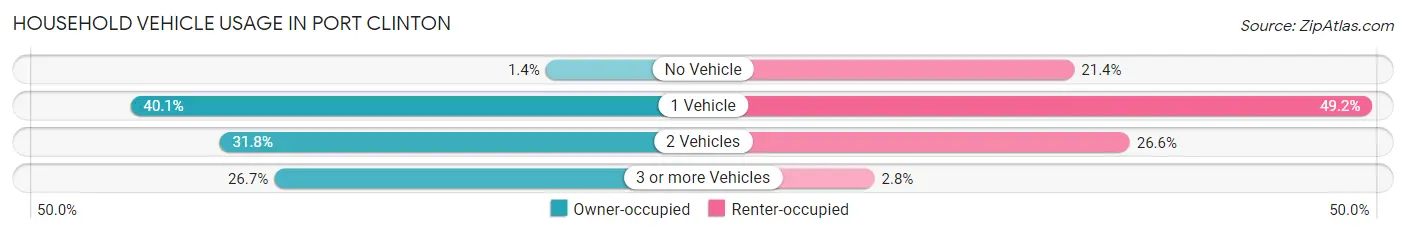
| Vehicles per Household | Owner-occupied | Renter-occupied |
| No Vehicle | 29 (1.4%) | 178 (21.4%) |
| 1 Vehicle | 847 (40.1%) | 409 (49.2%) |
| 2 Vehicles | 671 (31.8%) | 221 (26.6%) |
| 3 or more Vehicles | 564 (26.7%) | 23 (2.8%) |
| Total | 2,111 (100.0%) | 831 (100.0%) |
Real Estate & Mortgages in Port Clinton
Real Estate and Mortgage Overview in Port Clinton
| Characteristic | Without Mortgage | With Mortgage |
| Housing Units | 959 | 1,152 |
| Median Property Value | $117,700 | $136,600 |
| Median Household Income | $48,839 | $129 |
| Monthly Housing Costs | $454 | $0 |
| Real Estate Taxes | $1,144 | $0 |
Property Value by Mortgage Status in Port Clinton
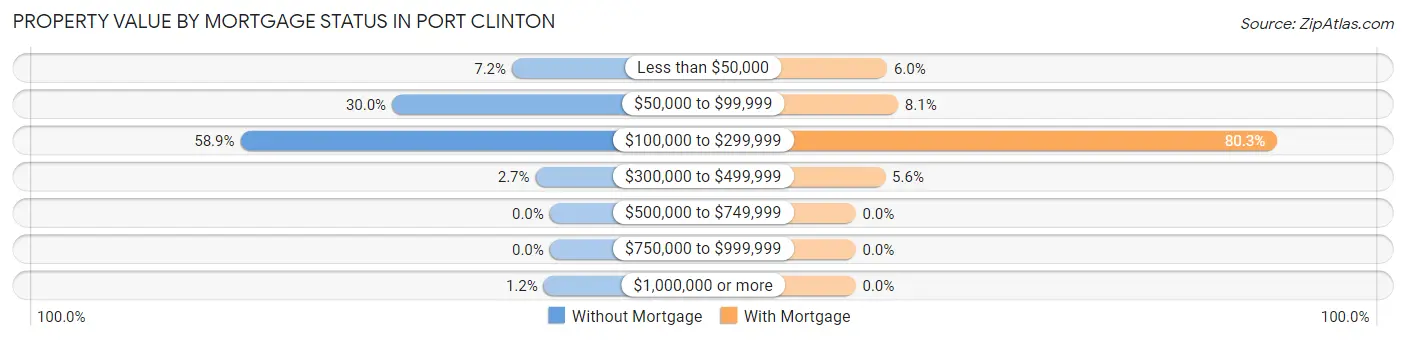
| Property Value | Without Mortgage | With Mortgage |
| Less than $50,000 | 69 (7.2%) | 69 (6.0%) |
| $50,000 to $99,999 | 288 (30.0%) | 93 (8.1%) |
| $100,000 to $299,999 | 565 (58.9%) | 925 (80.3%) |
| $300,000 to $499,999 | 26 (2.7%) | 65 (5.6%) |
| $500,000 to $749,999 | 0 (0.0%) | 0 (0.0%) |
| $750,000 to $999,999 | 0 (0.0%) | 0 (0.0%) |
| $1,000,000 or more | 11 (1.1%) | 0 (0.0%) |
| Total | 959 (100.0%) | 1,152 (100.0%) |
Household Income by Mortgage Status in Port Clinton
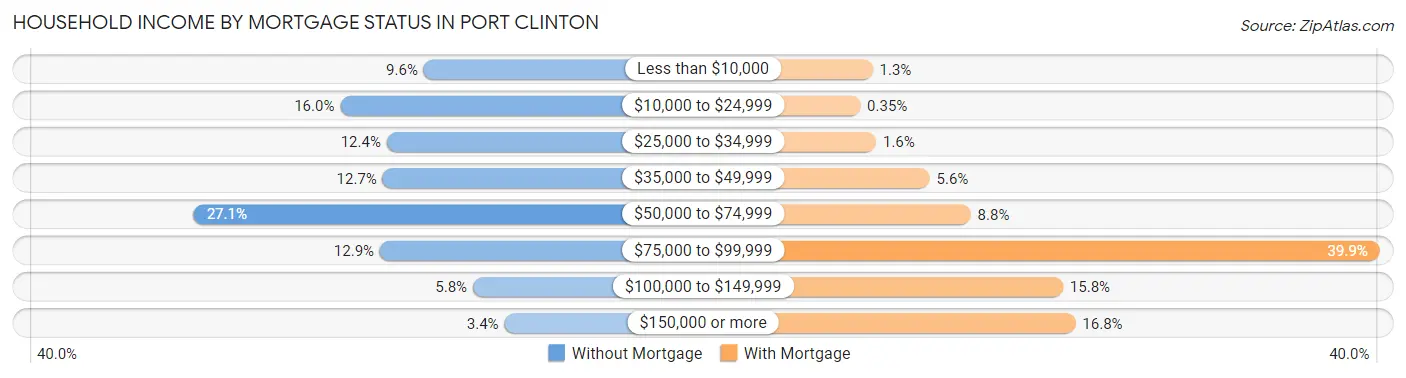
| Household Income | Without Mortgage | With Mortgage |
| Less than $10,000 | 92 (9.6%) | 15 (1.3%) |
| $10,000 to $24,999 | 153 (16.0%) | 4 (0.4%) |
| $25,000 to $34,999 | 119 (12.4%) | 18 (1.6%) |
| $35,000 to $49,999 | 122 (12.7%) | 65 (5.6%) |
| $50,000 to $74,999 | 260 (27.1%) | 101 (8.8%) |
| $75,000 to $99,999 | 124 (12.9%) | 460 (39.9%) |
| $100,000 to $149,999 | 56 (5.8%) | 182 (15.8%) |
| $150,000 or more | 33 (3.4%) | 193 (16.8%) |
| Total | 959 (100.0%) | 1,152 (100.0%) |
Property Value to Household Income Ratio in Port Clinton
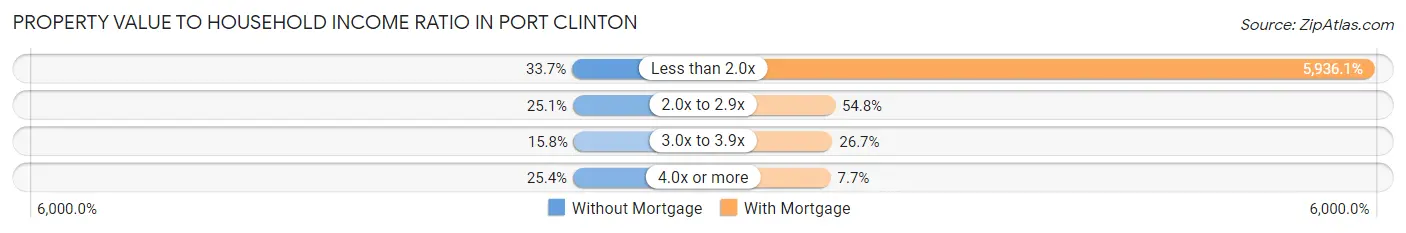
| Value-to-Income Ratio | Without Mortgage | With Mortgage |
| Less than 2.0x | 323 (33.7%) | 68,384 (5,936.1%) |
| 2.0x to 2.9x | 241 (25.1%) | 631 (54.8%) |
| 3.0x to 3.9x | 151 (15.8%) | 307 (26.7%) |
| 4.0x or more | 244 (25.4%) | 89 (7.7%) |
| Total | 959 (100.0%) | 1,152 (100.0%) |
Real Estate Taxes by Mortgage Status in Port Clinton
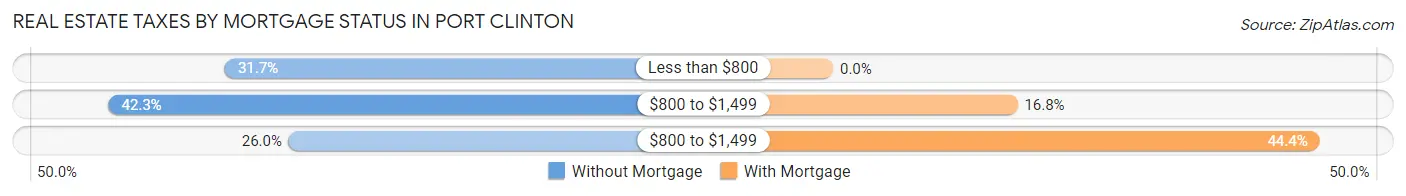
| Property Taxes | Without Mortgage | With Mortgage |
| Less than $800 | 304 (31.7%) | 0 (0.0%) |
| $800 to $1,499 | 406 (42.3%) | 194 (16.8%) |
| $800 to $1,499 | 249 (26.0%) | 512 (44.4%) |
| Total | 959 (100.0%) | 1,152 (100.0%) |
Health & Disability in Port Clinton
Health Insurance Coverage by Age in Port Clinton
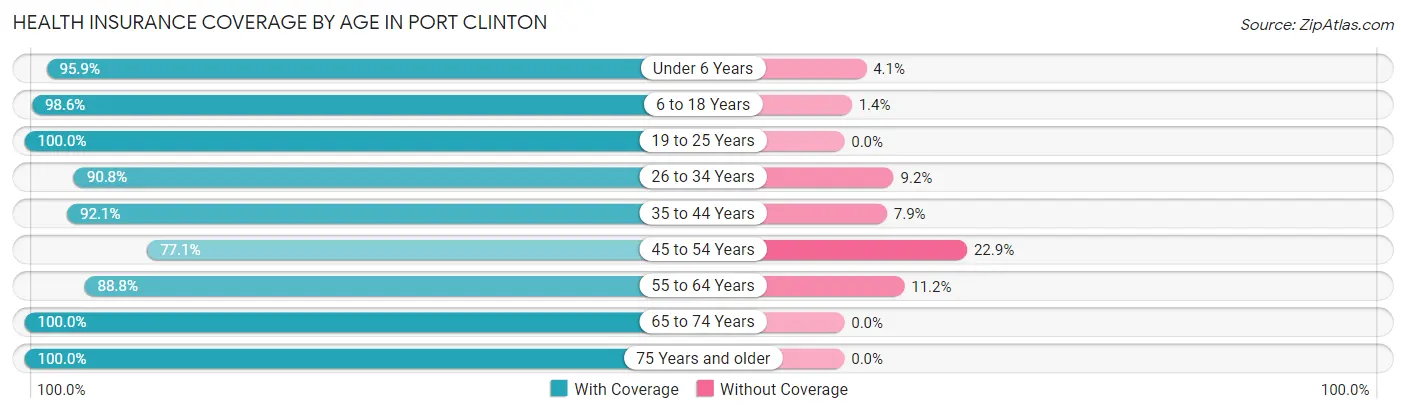
| Age Bracket | With Coverage | Without Coverage |
| Under 6 Years | 258 (95.9%) | 11 (4.1%) |
| 6 to 18 Years | 927 (98.6%) | 13 (1.4%) |
| 19 to 25 Years | 239 (100.0%) | 0 (0.0%) |
| 26 to 34 Years | 652 (90.8%) | 66 (9.2%) |
| 35 to 44 Years | 731 (92.1%) | 63 (7.9%) |
| 45 to 54 Years | 627 (77.1%) | 186 (22.9%) |
| 55 to 64 Years | 659 (88.8%) | 83 (11.2%) |
| 65 to 74 Years | 832 (100.0%) | 0 (0.0%) |
| 75 Years and older | 531 (100.0%) | 0 (0.0%) |
| Total | 5,456 (92.8%) | 422 (7.2%) |
Health Insurance Coverage by Citizenship Status in Port Clinton
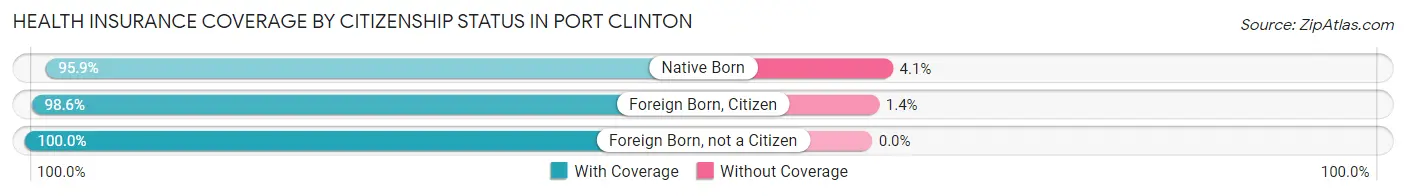
| Citizenship Status | With Coverage | Without Coverage |
| Native Born | 258 (95.9%) | 11 (4.1%) |
| Foreign Born, Citizen | 927 (98.6%) | 13 (1.4%) |
| Foreign Born, not a Citizen | 239 (100.0%) | 0 (0.0%) |
Health Insurance Coverage by Household Income in Port Clinton
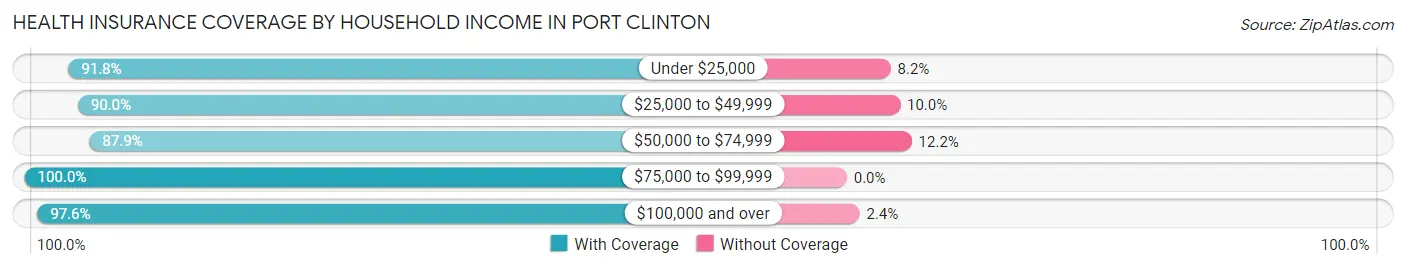
| Household Income | With Coverage | Without Coverage |
| Under $25,000 | 1,185 (91.8%) | 106 (8.2%) |
| $25,000 to $49,999 | 993 (90.0%) | 110 (10.0%) |
| $50,000 to $74,999 | 1,280 (87.8%) | 177 (12.1%) |
| $75,000 to $99,999 | 832 (100.0%) | 0 (0.0%) |
| $100,000 and over | 1,142 (97.6%) | 28 (2.4%) |
Public vs Private Health Insurance Coverage by Age in Port Clinton
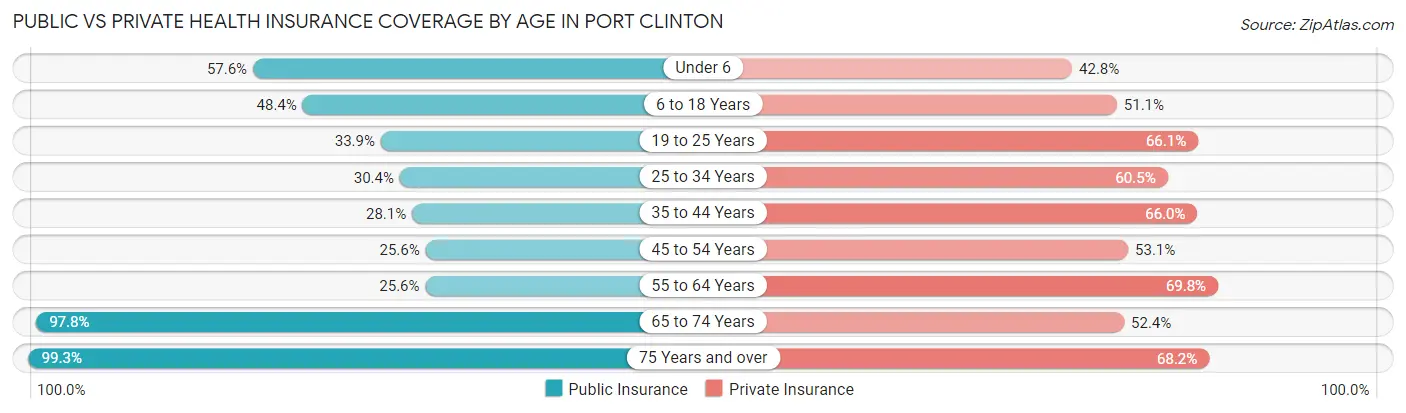
| Age Bracket | Public Insurance | Private Insurance |
| Under 6 | 155 (57.6%) | 115 (42.7%) |
| 6 to 18 Years | 455 (48.4%) | 480 (51.1%) |
| 19 to 25 Years | 81 (33.9%) | 158 (66.1%) |
| 25 to 34 Years | 218 (30.4%) | 434 (60.5%) |
| 35 to 44 Years | 223 (28.1%) | 524 (66.0%) |
| 45 to 54 Years | 208 (25.6%) | 432 (53.1%) |
| 55 to 64 Years | 190 (25.6%) | 518 (69.8%) |
| 65 to 74 Years | 814 (97.8%) | 436 (52.4%) |
| 75 Years and over | 527 (99.3%) | 362 (68.2%) |
| Total | 2,871 (48.8%) | 3,459 (58.9%) |
Disability Status by Sex by Age in Port Clinton
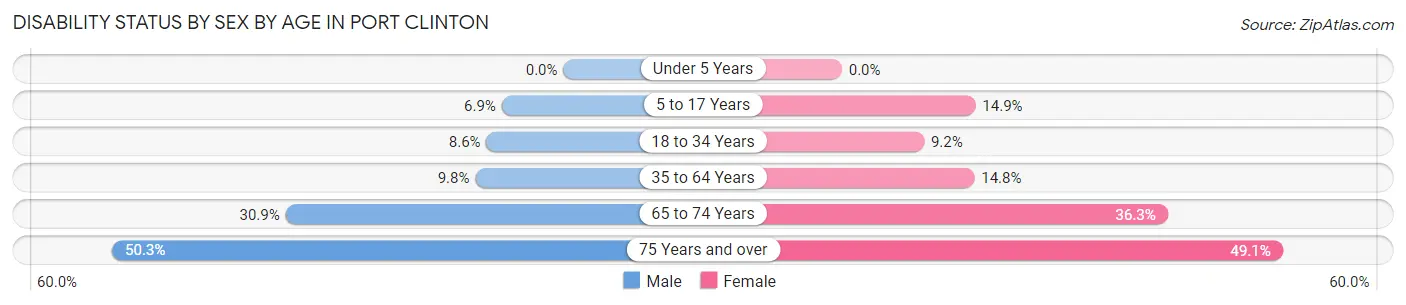
| Age Bracket | Male | Female |
| Under 5 Years | 0 (0.0%) | 0 (0.0%) |
| 5 to 17 Years | 29 (6.9%) | 79 (14.9%) |
| 18 to 34 Years | 40 (8.6%) | 52 (9.1%) |
| 35 to 64 Years | 126 (9.8%) | 157 (14.8%) |
| 65 to 74 Years | 86 (30.9%) | 201 (36.3%) |
| 75 Years and over | 101 (50.2%) | 162 (49.1%) |
Disability Class by Sex by Age in Port Clinton
Disability Class: Hearing Difficulty
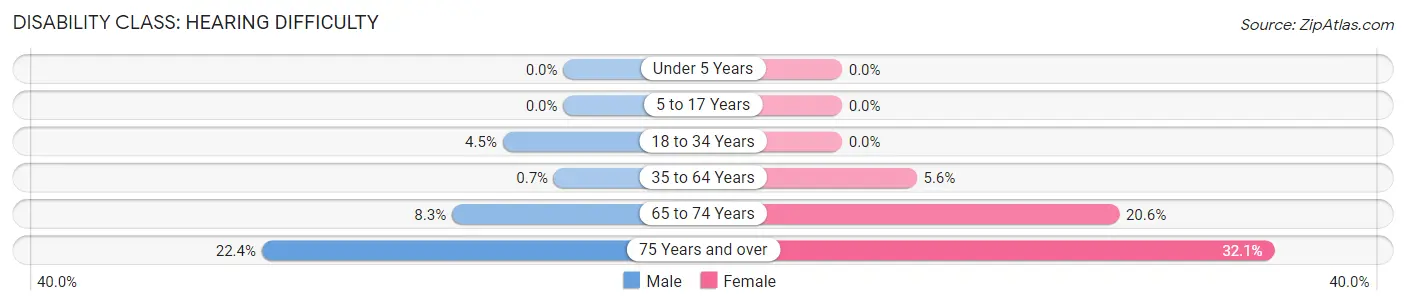
| Age Bracket | Male | Female |
| Under 5 Years | 0 (0.0%) | 0 (0.0%) |
| 5 to 17 Years | 0 (0.0%) | 0 (0.0%) |
| 18 to 34 Years | 21 (4.5%) | 0 (0.0%) |
| 35 to 64 Years | 9 (0.7%) | 59 (5.6%) |
| 65 to 74 Years | 23 (8.3%) | 114 (20.6%) |
| 75 Years and over | 45 (22.4%) | 106 (32.1%) |
Disability Class: Vision Difficulty
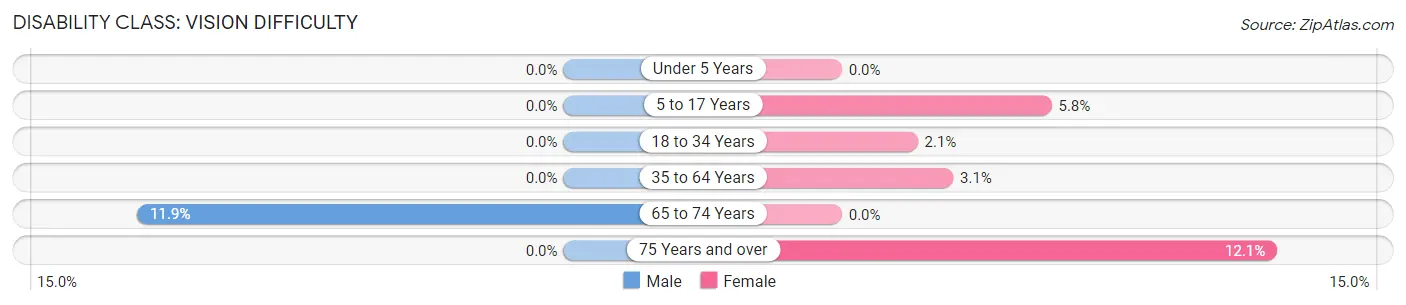
| Age Bracket | Male | Female |
| Under 5 Years | 0 (0.0%) | 0 (0.0%) |
| 5 to 17 Years | 0 (0.0%) | 31 (5.8%) |
| 18 to 34 Years | 0 (0.0%) | 12 (2.1%) |
| 35 to 64 Years | 0 (0.0%) | 33 (3.1%) |
| 65 to 74 Years | 33 (11.9%) | 0 (0.0%) |
| 75 Years and over | 0 (0.0%) | 40 (12.1%) |
Disability Class: Cognitive Difficulty
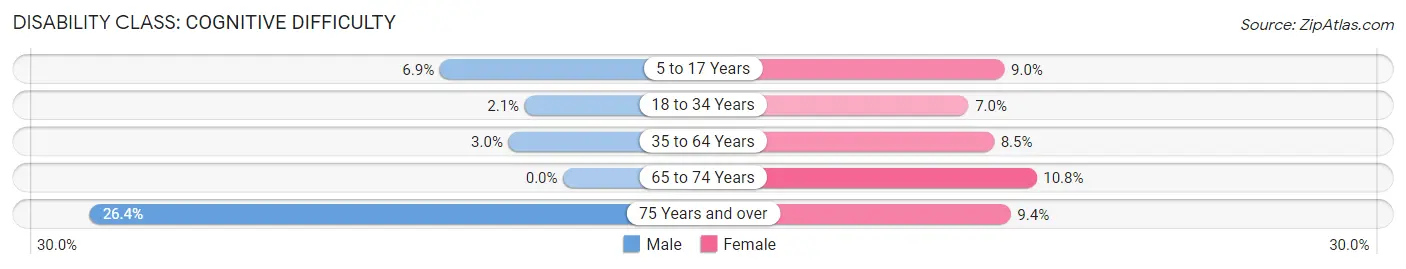
| Age Bracket | Male | Female |
| 5 to 17 Years | 29 (6.9%) | 48 (9.0%) |
| 18 to 34 Years | 10 (2.1%) | 40 (7.0%) |
| 35 to 64 Years | 39 (3.0%) | 90 (8.5%) |
| 65 to 74 Years | 0 (0.0%) | 60 (10.8%) |
| 75 Years and over | 53 (26.4%) | 31 (9.4%) |
Disability Class: Ambulatory Difficulty
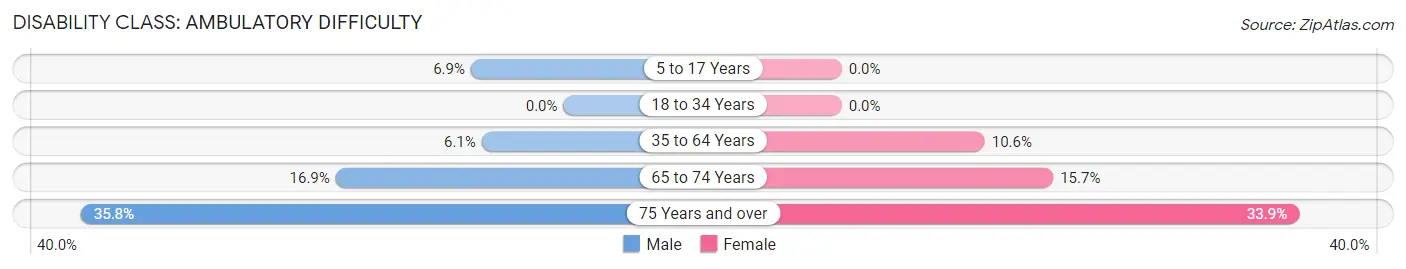
| Age Bracket | Male | Female |
| 5 to 17 Years | 29 (6.9%) | 0 (0.0%) |
| 18 to 34 Years | 0 (0.0%) | 0 (0.0%) |
| 35 to 64 Years | 78 (6.1%) | 113 (10.6%) |
| 65 to 74 Years | 47 (16.9%) | 87 (15.7%) |
| 75 Years and over | 72 (35.8%) | 112 (33.9%) |
Disability Class: Self-Care Difficulty
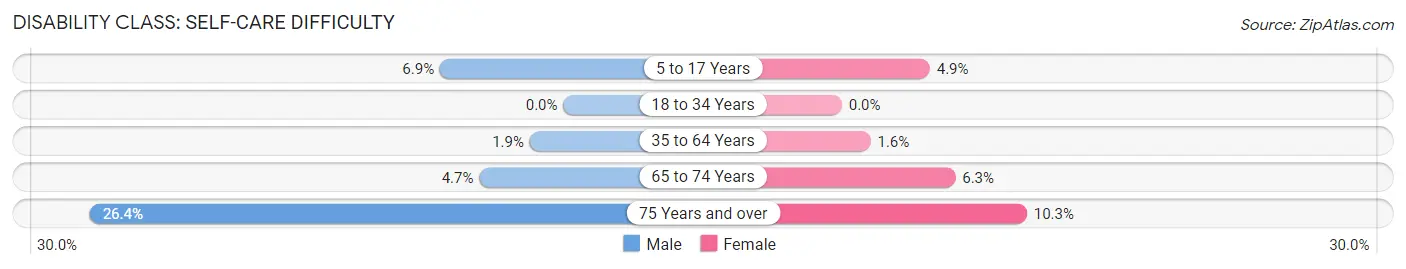
| Age Bracket | Male | Female |
| 5 to 17 Years | 29 (6.9%) | 26 (4.9%) |
| 18 to 34 Years | 0 (0.0%) | 0 (0.0%) |
| 35 to 64 Years | 24 (1.9%) | 17 (1.6%) |
| 65 to 74 Years | 13 (4.7%) | 35 (6.3%) |
| 75 Years and over | 53 (26.4%) | 34 (10.3%) |
Technology Access in Port Clinton
Computing Device Access in Port Clinton
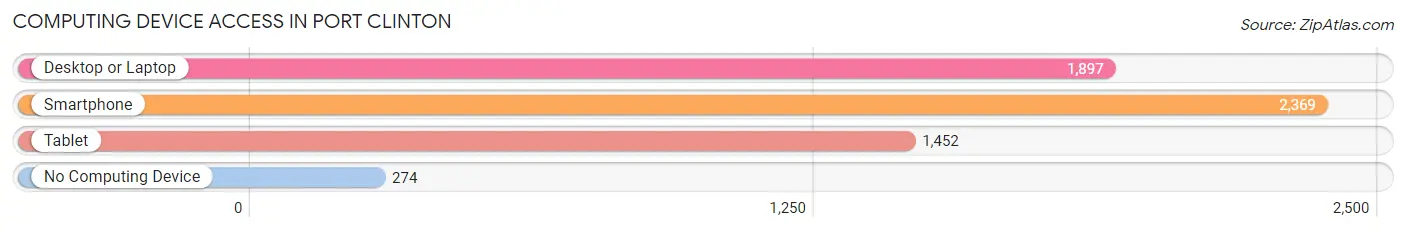
| Device Type | # Households | % Households |
| Desktop or Laptop | 1,897 | 64.5% |
| Smartphone | 2,369 | 80.5% |
| Tablet | 1,452 | 49.3% |
| No Computing Device | 274 | 9.3% |
| Total | 2,942 | 100.0% |
Internet Access in Port Clinton
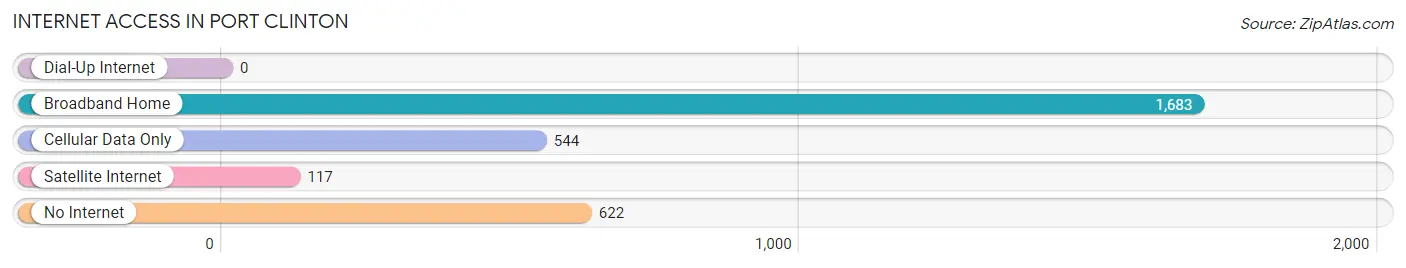
| Internet Type | # Households | % Households |
| Dial-Up Internet | 0 | 0.0% |
| Broadband Home | 1,683 | 57.2% |
| Cellular Data Only | 544 | 18.5% |
| Satellite Internet | 117 | 4.0% |
| No Internet | 622 | 21.1% |
| Total | 2,942 | 100.0% |
Port Clinton Summary
Port Clinton, Ohio is a small city located in Ottawa County in the northern part of the state. It is situated on the shores of Lake Erie, and is the county seat of Ottawa County. The city has a population of 6,056, according to the 2010 census.
History
Port Clinton was founded in 1818 by William Walker, a Revolutionary War veteran. The city was named after the nearby Portage River, which was named after the Native American term for “portage” or “carrying place”. The city was originally a trading post and port for the Great Lakes region. In 1837, the city was incorporated as a village, and in 1854, it was incorporated as a city.
In the late 19th century, Port Clinton became a popular tourist destination, with many visitors coming to enjoy the lakefront and the nearby islands. The city was also home to a number of resorts and hotels, as well as a number of amusement parks.
In the early 20th century, the city’s economy shifted from tourism to manufacturing. The city was home to a number of factories, including a glass factory, a paper mill, and a canning factory. The city also became a major port for the Great Lakes region, with ships carrying goods from all over the world.
Geography
Port Clinton is located in northern Ohio, on the shores of Lake Erie. The city is situated on the Portage River, which flows into the lake. The city is surrounded by a number of small towns and villages, including Marblehead, Oak Harbor, and Catawba Island.
The city has a total area of 4.2 square miles, of which 3.9 square miles is land and 0.3 square miles is water. The city has a humid continental climate, with hot summers and cold winters.
Economy
The economy of Port Clinton is largely based on tourism and manufacturing. The city is home to a number of resorts and hotels, as well as a number of amusement parks. The city is also home to a number of factories, including a glass factory, a paper mill, and a canning factory.
The city is also home to a number of retail stores, restaurants, and other businesses. The city is also home to a number of marinas, which provide services to boaters and fishermen.
Demographics
According to the 2010 census, the population of Port Clinton was 6,056. The racial makeup of the city was 95.3% White, 1.2% African American, 0.4% Native American, 0.7% Asian, 0.1% Pacific Islander, 0.7% from other races, and 1.6% from two or more races. Hispanic or Latino of any race were 2.2% of the population.
The median income for a household in the city was $37,917, and the median income for a family was $45,938. The per capita income for the city was $20,945. About 11.2% of families and 14.2% of the population were below the poverty line, including 19.2% of those under age 18 and 8.2% of those age 65 or over.
Common Questions
What is Per Capita Income in Port Clinton?
Per Capita income in Port Clinton is $35,900.
What is the Median Family Income in Port Clinton?
Median Family Income in Port Clinton is $60,331.
What is the Median Household income in Port Clinton?
Median Household Income in Port Clinton is $55,534.
What is Income or Wage Gap in Port Clinton?
Income or Wage Gap in Port Clinton is 42.4%.
Women in Port Clinton earn 57.6 cents for every dollar earned by a man.
What is Family Income Deficit in Port Clinton?
Family Income Deficit in Port Clinton is $9,780.
Families that are below poverty line in Port Clinton earn $9,780 less on average than the poverty threshold level.
What is Inequality or Gini Index in Port Clinton?
Inequality or Gini Index in Port Clinton is 0.49.
What is the Total Population of Port Clinton?
Total Population of Port Clinton is 6,024.
What is the Total Male Population of Port Clinton?
Total Male Population of Port Clinton is 2,807.
What is the Total Female Population of Port Clinton?
Total Female Population of Port Clinton is 3,217.
What is the Ratio of Males per 100 Females in Port Clinton?
There are 87.26 Males per 100 Females in Port Clinton.
What is the Ratio of Females per 100 Males in Port Clinton?
There are 114.61 Females per 100 Males in Port Clinton.
What is the Median Population Age in Port Clinton?
Median Population Age in Port Clinton is 44.9 Years.
What is the Average Family Size in Port Clinton
Average Family Size in Port Clinton is 2.7 People.
What is the Average Household Size in Port Clinton
Average Household Size in Port Clinton is 2.0 People.
How Large is the Labor Force in Port Clinton?
There are 2,942 People in the Labor Forcein in Port Clinton.
What is the Percentage of People in the Labor Force in Port Clinton?
57.9% of People are in the Labor Force in Port Clinton.
What is the Unemployment Rate in Port Clinton?
Unemployment Rate in Port Clinton is 5.3%.