Cities with the Highest Percentage of Puerto Rican Population in Michigan
RELATED REPORTS & OPTIONS
Puerto Rican
Michigan
Compare Cities
Map of Cities with the Highest Percentage of Puerto Rican Population in Michigan
0.00%
15.00%
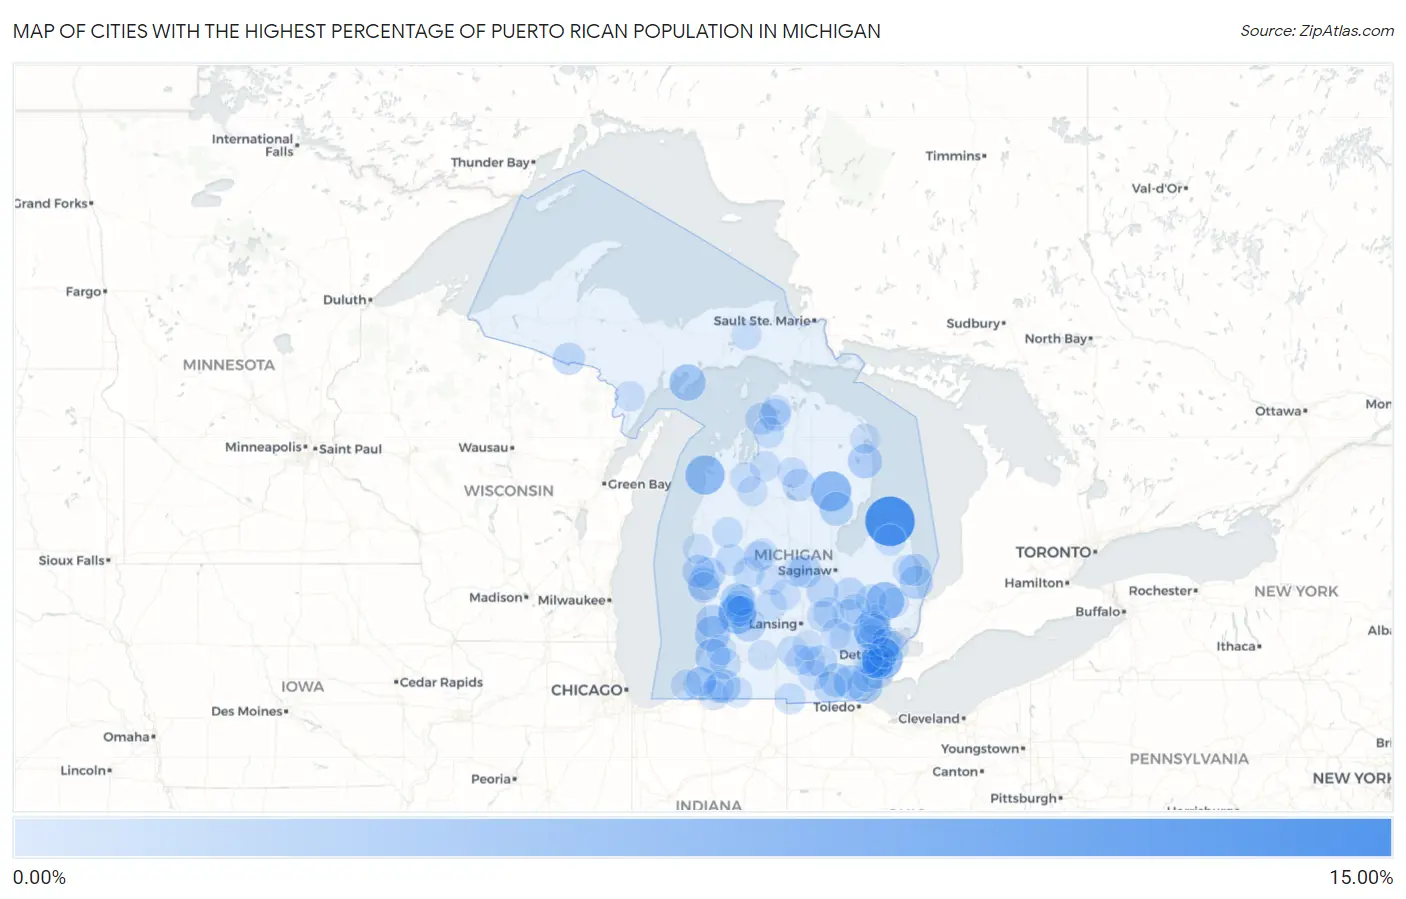
Cities with the Highest Percentage of Puerto Rican Population in Michigan
| City | Puerto Rican | vs State | vs National | |
| 1. | Port Austin | 11.69% | 0.51%(+11.2)#1 | 1.78%(+9.91)#595 |
| 2. | River Rouge | 6.44% | 0.51%(+5.94)#2 | 1.78%(+4.66)#1,154 |
| 3. | Lupton | 6.14% | 0.51%(+5.63)#3 | 1.78%(+4.35)#1,235 |
| 4. | Elberta | 5.78% | 0.51%(+5.27)#4 | 1.78%(+4.00)#1,340 |
| 5. | Imlay City | 5.11% | 0.51%(+4.60)#5 | 1.78%(+3.33)#1,514 |
| 6. | Cutlerville | 5.02% | 0.51%(+4.51)#6 | 1.78%(+3.24)#1,536 |
| 7. | Pontiac | 4.82% | 0.51%(+4.31)#7 | 1.78%(+3.04)#1,597 |
| 8. | Garden | 4.14% | 0.51%(+3.64)#8 | 1.78%(+2.36)#1,884 |
| 9. | Fennville | 3.57% | 0.51%(+3.07)#9 | 1.78%(+1.79)#2,243 |
| 10. | West Monroe | 3.39% | 0.51%(+2.89)#10 | 1.78%(+1.61)#2,350 |
| 11. | Bangor | 3.38% | 0.51%(+2.88)#11 | 1.78%(+1.60)#2,358 |
| 12. | Dundee | 3.35% | 0.51%(+2.84)#12 | 1.78%(+1.56)#2,390 |
| 13. | Lost Lake Woods | 2.90% | 0.51%(+2.39)#13 | 1.78%(+1.12)#2,689 |
| 14. | Prescott | 2.84% | 0.51%(+2.33)#14 | 1.78%(+1.05)#2,748 |
| 15. | Vandalia | 2.83% | 0.51%(+2.32)#15 | 1.78%(+1.05)#2,754 |
| 16. | Comstock Park | 2.73% | 0.51%(+2.22)#16 | 1.78%(+0.944)#2,841 |
| 17. | Cambria | 2.62% | 0.51%(+2.11)#17 | 1.78%(+0.835)#2,927 |
| 18. | Tecumseh | 2.57% | 0.51%(+2.06)#18 | 1.78%(+0.787)#2,976 |
| 19. | Lexington | 2.56% | 0.51%(+2.05)#19 | 1.78%(+0.776)#2,992 |
| 20. | Melvindale | 2.52% | 0.51%(+2.01)#20 | 1.78%(+0.733)#3,053 |
| 21. | Wyoming | 2.49% | 0.51%(+1.98)#21 | 1.78%(+0.704)#3,081 |
| 22. | Breckenridge | 2.48% | 0.51%(+1.97)#22 | 1.78%(+0.694)#3,091 |
| 23. | Middleville | 2.42% | 0.51%(+1.91)#23 | 1.78%(+0.636)#3,149 |
| 24. | Holland | 2.40% | 0.51%(+1.90)#24 | 1.78%(+0.622)#3,159 |
| 25. | Berrien Springs | 2.37% | 0.51%(+1.87)#25 | 1.78%(+0.591)#3,181 |
| 26. | North Muskegon | 2.23% | 0.51%(+1.73)#26 | 1.78%(+0.450)#3,329 |
| 27. | Twin Lake | 2.23% | 0.51%(+1.72)#27 | 1.78%(+0.445)#3,335 |
| 28. | Lincoln Park | 2.16% | 0.51%(+1.66)#28 | 1.78%(+0.380)#3,429 |
| 29. | Montague | 2.15% | 0.51%(+1.64)#29 | 1.78%(+0.365)#3,440 |
| 30. | Roscommon | 2.14% | 0.51%(+1.63)#30 | 1.78%(+0.354)#3,451 |
| 31. | Gibraltar | 2.08% | 0.51%(+1.57)#31 | 1.78%(+0.298)#3,521 |
| 32. | Mount Morris | 1.97% | 0.51%(+1.46)#32 | 1.78%(+0.187)#3,648 |
| 33. | Grass Lake | 1.96% | 0.51%(+1.46)#33 | 1.78%(+0.181)#3,659 |
| 34. | Caspian | 1.96% | 0.51%(+1.46)#34 | 1.78%(+0.181)#3,661 |
| 35. | Port Sanilac | 1.89% | 0.51%(+1.39)#35 | 1.78%(+0.111)#3,771 |
| 36. | Hazel Park | 1.89% | 0.51%(+1.38)#36 | 1.78%(+0.102)#3,788 |
| 37. | Charlevoix | 1.86% | 0.51%(+1.35)#37 | 1.78%(+0.077)#3,821 |
| 38. | Oakley | 1.85% | 0.51%(+1.35)#38 | 1.78%(+0.069)#3,834 |
| 39. | Petoskey | 1.83% | 0.51%(+1.32)#39 | 1.78%(+0.044)#3,872 |
| 40. | Lake Gogebic | 1.71% | 0.51%(+1.20)#40 | 1.78%(-0.073)#4,053 |
| 41. | Adrian | 1.68% | 0.51%(+1.18)#41 | 1.78%(-0.099)#4,109 |
| 42. | Lake Fenton | 1.61% | 0.51%(+1.11)#42 | 1.78%(-0.168)#4,227 |
| 43. | Grand Rapids | 1.55% | 0.51%(+1.05)#43 | 1.78%(-0.231)#4,348 |
| 44. | Carleton | 1.54% | 0.51%(+1.04)#44 | 1.78%(-0.238)#4,361 |
| 45. | White Cloud | 1.42% | 0.51%(+0.914)#45 | 1.78%(-0.362)#4,616 |
| 46. | Howard City | 1.42% | 0.51%(+0.910)#46 | 1.78%(-0.367)#4,631 |
| 47. | Bancroft | 1.40% | 0.51%(+0.894)#47 | 1.78%(-0.383)#4,664 |
| 48. | Ionia | 1.40% | 0.51%(+0.893)#48 | 1.78%(-0.384)#4,666 |
| 49. | Bad Axe | 1.39% | 0.51%(+0.882)#49 | 1.78%(-0.394)#4,698 |
| 50. | Paw Paw | 1.39% | 0.51%(+0.880)#50 | 1.78%(-0.396)#4,700 |
| 51. | Brighton | 1.38% | 0.51%(+0.870)#51 | 1.78%(-0.407)#4,727 |
| 52. | Lake Orion | 1.37% | 0.51%(+0.866)#52 | 1.78%(-0.410)#4,733 |
| 53. | Franklin | 1.36% | 0.51%(+0.851)#53 | 1.78%(-0.426)#4,773 |
| 54. | Northview | 1.35% | 0.51%(+0.848)#54 | 1.78%(-0.428)#4,777 |
| 55. | Lapeer | 1.35% | 0.51%(+0.844)#55 | 1.78%(-0.432)#4,795 |
| 56. | Ecorse | 1.35% | 0.51%(+0.839)#56 | 1.78%(-0.437)#4,803 |
| 57. | Kentwood | 1.34% | 0.51%(+0.837)#57 | 1.78%(-0.439)#4,809 |
| 58. | Morrice | 1.32% | 0.51%(+0.815)#58 | 1.78%(-0.461)#4,857 |
| 59. | Taylor | 1.31% | 0.51%(+0.806)#59 | 1.78%(-0.470)#4,885 |
| 60. | Keego Harbor | 1.30% | 0.51%(+0.793)#60 | 1.78%(-0.484)#4,912 |
| 61. | Camden | 1.29% | 0.51%(+0.781)#61 | 1.78%(-0.495)#4,943 |
| 62. | East Jordan | 1.28% | 0.51%(+0.773)#62 | 1.78%(-0.503)#4,963 |
| 63. | Baldwin | 1.26% | 0.51%(+0.756)#63 | 1.78%(-0.521)#5,018 |
| 64. | Bridgman | 1.26% | 0.51%(+0.755)#64 | 1.78%(-0.521)#5,019 |
| 65. | Roosevelt Park | 1.23% | 0.51%(+0.726)#65 | 1.78%(-0.550)#5,075 |
| 66. | Mecosta | 1.19% | 0.51%(+0.682)#66 | 1.78%(-0.595)#5,204 |
| 67. | Southgate | 1.18% | 0.51%(+0.669)#67 | 1.78%(-0.607)#5,236 |
| 68. | Kingsley | 1.12% | 0.51%(+0.610)#68 | 1.78%(-0.667)#5,414 |
| 69. | St Louis | 1.10% | 0.51%(+0.590)#69 | 1.78%(-0.686)#5,479 |
| 70. | Center Line | 1.10% | 0.51%(+0.589)#70 | 1.78%(-0.688)#5,483 |
| 71. | Cement City | 1.09% | 0.51%(+0.583)#71 | 1.78%(-0.694)#5,500 |
| 72. | Canadian Lakes | 1.09% | 0.51%(+0.580)#72 | 1.78%(-0.697)#5,509 |
| 73. | Springport | 1.09% | 0.51%(+0.580)#73 | 1.78%(-0.697)#5,510 |
| 74. | Cassopolis | 1.09% | 0.51%(+0.580)#74 | 1.78%(-0.697)#5,512 |
| 75. | Kalkaska | 1.05% | 0.51%(+0.547)#75 | 1.78%(-0.729)#5,615 |
| 76. | Capac | 1.04% | 0.51%(+0.535)#76 | 1.78%(-0.741)#5,664 |
| 77. | Grayling | 1.02% | 0.51%(+0.518)#77 | 1.78%(-0.759)#5,712 |
| 78. | Stanton | 1.01% | 0.51%(+0.499)#78 | 1.78%(-0.777)#5,774 |
| 79. | Carsonville | 1.00% | 0.51%(+0.494)#79 | 1.78%(-0.783)#5,798 |
| 80. | Carney | 0.98% | 0.51%(+0.474)#80 | 1.78%(-0.802)#5,865 |
| 81. | Harper Woods | 0.97% | 0.51%(+0.468)#81 | 1.78%(-0.809)#5,887 |
| 82. | Jackson | 0.97% | 0.51%(+0.468)#82 | 1.78%(-0.809)#5,890 |
| 83. | Auburn Hills | 0.97% | 0.51%(+0.462)#83 | 1.78%(-0.815)#5,914 |
| 84. | Newberry | 0.97% | 0.51%(+0.460)#84 | 1.78%(-0.816)#5,921 |
| 85. | Hubbardston | 0.95% | 0.51%(+0.448)#85 | 1.78%(-0.828)#5,963 |
| 86. | Detroit | 0.95% | 0.51%(+0.445)#86 | 1.78%(-0.831)#5,970 |
| 87. | Howell | 0.94% | 0.51%(+0.437)#87 | 1.78%(-0.839)#6,001 |
| 88. | Manton | 0.91% | 0.51%(+0.402)#88 | 1.78%(-0.875)#6,118 |
| 89. | Parma | 0.90% | 0.51%(+0.399)#89 | 1.78%(-0.878)#6,131 |
| 90. | Alpena | 0.88% | 0.51%(+0.376)#90 | 1.78%(-0.900)#6,214 |
| 91. | Edwardsburg | 0.87% | 0.51%(+0.363)#91 | 1.78%(-0.913)#6,265 |
| 92. | Grand Blanc | 0.86% | 0.51%(+0.353)#92 | 1.78%(-0.924)#6,316 |
| 93. | Constantine | 0.86% | 0.51%(+0.352)#93 | 1.78%(-0.925)#6,320 |
| 94. | Wayne | 0.85% | 0.51%(+0.348)#94 | 1.78%(-0.929)#6,331 |
| 95. | Leslie | 0.84% | 0.51%(+0.329)#95 | 1.78%(-0.947)#6,398 |
| 96. | Springfield | 0.84% | 0.51%(+0.329)#96 | 1.78%(-0.947)#6,401 |
| 97. | Eau Claire | 0.83% | 0.51%(+0.322)#97 | 1.78%(-0.955)#6,433 |
| 98. | Harbor Springs | 0.82% | 0.51%(+0.319)#98 | 1.78%(-0.958)#6,451 |
| 99. | Hart | 0.78% | 0.51%(+0.276)#99 | 1.78%(-1.00)#6,623 |
| 100. | Bloomingdale | 0.78% | 0.51%(+0.274)#100 | 1.78%(-1.00)#6,639 |
Common Questions
What are the Top 10 Cities with the Highest Percentage of Puerto Rican Population in Michigan?
Top 10 Cities with the Highest Percentage of Puerto Rican Population in Michigan are:
#1
11.69%
#2
6.44%
#3
6.14%
#4
5.78%
#5
5.11%
#6
5.02%
#7
4.82%
#8
4.14%
#9
3.57%
#10
3.39%
What city has the Highest Percentage of Puerto Rican Population in Michigan?
Port Austin has the Highest Percentage of Puerto Rican Population in Michigan with 11.69%.
What is the Percentage of Puerto Rican Population in the State of Michigan?
Percentage of Puerto Rican Population in Michigan is 0.51%.
What is the Percentage of Puerto Rican Population in the United States?
Percentage of Puerto Rican Population in the United States is 1.78%.