Cities with the Highest Percentage of Puerto Rican Population in Oklahoma
RELATED REPORTS & OPTIONS
Puerto Rican
Oklahoma
Compare Cities
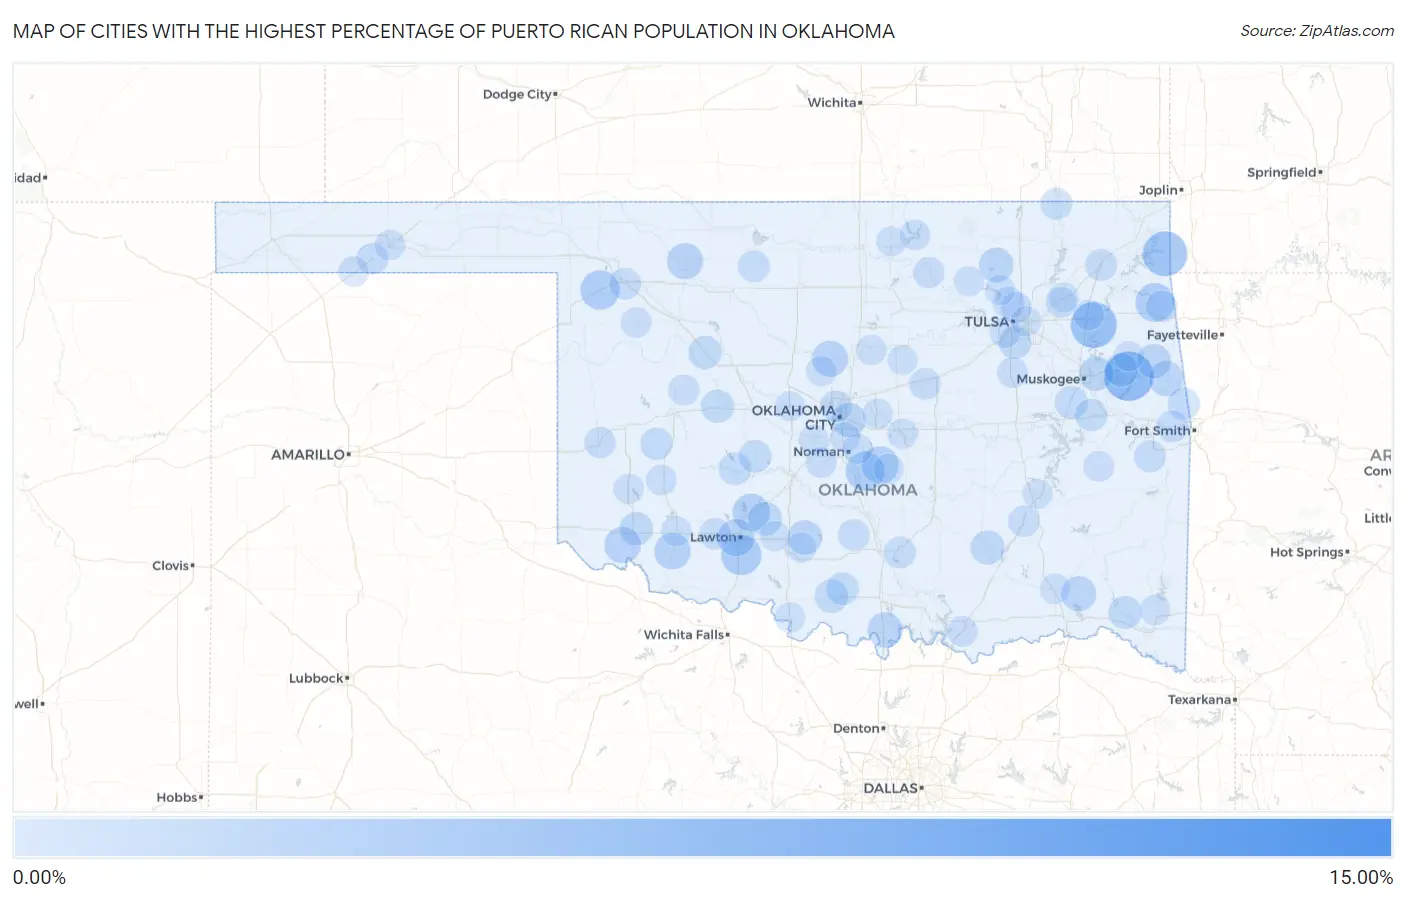
Map of Cities with the Highest Percentage of Puerto Rican Population in Oklahoma
0.00%
15.00%
Cities with the Highest Percentage of Puerto Rican Population in Oklahoma
| City | Puerto Rican | vs State | vs National | |
| 1. | Bentley | 15.00% | 0.45%(+14.5)#1 | 1.78%(+13.2)#476 |
| 2. | Pettit | 6.90% | 0.45%(+6.45)#2 | 1.78%(+5.12)#1,060 |
| 3. | Lowrey | 6.90% | 0.45%(+6.44)#3 | 1.78%(+5.11)#1,064 |
| 4. | Pin Oak Acres | 5.75% | 0.45%(+5.29)#4 | 1.78%(+3.96)#1,352 |
| 5. | Cayuga | 5.33% | 0.45%(+4.88)#5 | 1.78%(+3.55)#1,452 |
| 6. | Bache | 4.94% | 0.45%(+4.49)#6 | 1.78%(+3.16)#1,559 |
| 7. | Lake Ellsworth Addition | 4.92% | 0.45%(+4.47)#7 | 1.78%(+3.14)#1,566 |
| 8. | Geronimo | 3.86% | 0.45%(+3.41)#8 | 1.78%(+2.08)#2,051 |
| 9. | Fargo | 3.50% | 0.45%(+3.05)#9 | 1.78%(+1.72)#2,293 |
| 10. | Slaughterville | 3.44% | 0.45%(+2.99)#10 | 1.78%(+1.66)#2,335 |
| 11. | Cloud Creek | 3.40% | 0.45%(+2.95)#11 | 1.78%(+1.62)#2,348 |
| 12. | Elgin | 3.00% | 0.45%(+2.55)#12 | 1.78%(+1.22)#2,599 |
| 13. | Etowah | 2.88% | 0.45%(+2.43)#13 | 1.78%(+1.10)#2,704 |
| 14. | Toppers | 2.85% | 0.45%(+2.40)#14 | 1.78%(+1.07)#2,724 |
| 15. | Lawton | 2.82% | 0.45%(+2.37)#15 | 1.78%(+1.04)#2,761 |
| 16. | Manitou | 2.62% | 0.45%(+2.17)#16 | 1.78%(+0.837)#2,925 |
| 17. | Olustee | 2.58% | 0.45%(+2.13)#17 | 1.78%(+0.797)#2,963 |
| 18. | Waynoka | 2.50% | 0.45%(+2.05)#18 | 1.78%(+0.717)#3,072 |
| 19. | Cimarron City | 2.48% | 0.45%(+2.03)#19 | 1.78%(+0.702)#3,085 |
| 20. | Marietta | 2.23% | 0.45%(+1.78)#20 | 1.78%(+0.451)#3,328 |
| 21. | Cherry Tree | 2.20% | 0.45%(+1.75)#21 | 1.78%(+0.421)#3,368 |
| 22. | Rattan | 2.17% | 0.45%(+1.71)#22 | 1.78%(+0.385)#3,426 |
| 23. | Barnsdall | 2.06% | 0.45%(+1.61)#23 | 1.78%(+0.278)#3,545 |
| 24. | Fort Gibson | 1.97% | 0.45%(+1.52)#24 | 1.78%(+0.186)#3,652 |
| 25. | Bray | 1.95% | 0.45%(+1.50)#25 | 1.78%(+0.170)#3,674 |
| 26. | Wauhillau | 1.95% | 0.45%(+1.50)#26 | 1.78%(+0.169)#3,681 |
| 27. | Del City | 1.95% | 0.45%(+1.50)#27 | 1.78%(+0.168)#3,682 |
| 28. | Coalgate | 1.86% | 0.45%(+1.40)#28 | 1.78%(+0.073)#3,828 |
| 29. | Sterling | 1.76% | 0.45%(+1.31)#29 | 1.78%(-0.019)#3,971 |
| 30. | Altus | 1.70% | 0.45%(+1.25)#30 | 1.78%(-0.083)#4,071 |
| 31. | Ringling | 1.64% | 0.45%(+1.19)#31 | 1.78%(-0.141)#4,175 |
| 32. | Oakwood | 1.64% | 0.45%(+1.19)#32 | 1.78%(-0.143)#4,180 |
| 33. | Zeb | 1.63% | 0.45%(+1.17)#33 | 1.78%(-0.155)#4,205 |
| 34. | Hydro | 1.60% | 0.45%(+1.14)#34 | 1.78%(-0.187)#4,264 |
| 35. | Wright City | 1.55% | 0.45%(+1.10)#35 | 1.78%(-0.228)#4,340 |
| 36. | Oktaha | 1.48% | 0.45%(+1.03)#36 | 1.78%(-0.301)#4,485 |
| 37. | Jenks | 1.45% | 0.45%(+0.997)#37 | 1.78%(-0.333)#4,551 |
| 38. | Canadian Shores | 1.42% | 0.45%(+0.971)#38 | 1.78%(-0.359)#4,604 |
| 39. | Fort Cobb | 1.40% | 0.45%(+0.950)#39 | 1.78%(-0.380)#4,661 |
| 40. | Healdton | 1.40% | 0.45%(+0.945)#40 | 1.78%(-0.385)#4,668 |
| 41. | Gracemont | 1.37% | 0.45%(+0.917)#41 | 1.78%(-0.413)#4,743 |
| 42. | Warner | 1.33% | 0.45%(+0.882)#42 | 1.78%(-0.448)#4,823 |
| 43. | Dill City | 1.32% | 0.45%(+0.872)#43 | 1.78%(-0.458)#4,850 |
| 44. | Short | 1.24% | 0.45%(+0.792)#44 | 1.78%(-0.538)#5,059 |
| 45. | South Coffeyville | 1.16% | 0.45%(+0.705)#45 | 1.78%(-0.625)#5,289 |
| 46. | Bokoshe | 1.15% | 0.45%(+0.694)#46 | 1.78%(-0.636)#5,313 |
| 47. | Big Cabin | 1.14% | 0.45%(+0.684)#47 | 1.78%(-0.646)#5,342 |
| 48. | Sulphur | 1.13% | 0.45%(+0.682)#48 | 1.78%(-0.648)#5,349 |
| 49. | Elmore City | 1.10% | 0.45%(+0.646)#49 | 1.78%(-0.684)#5,473 |
| 50. | Helena | 1.10% | 0.45%(+0.644)#50 | 1.78%(-0.686)#5,478 |
| 51. | Muldrow | 1.09% | 0.45%(+0.640)#51 | 1.78%(-0.690)#5,490 |
| 52. | Woodward | 1.05% | 0.45%(+0.600)#52 | 1.78%(-0.730)#5,618 |
| 53. | Davenport | 1.02% | 0.45%(+0.568)#53 | 1.78%(-0.762)#5,723 |
| 54. | Kiowa | 1.02% | 0.45%(+0.566)#54 | 1.78%(-0.764)#5,730 |
| 55. | Nichols Hills | 1.01% | 0.45%(+0.559)#55 | 1.78%(-0.771)#5,752 |
| 56. | Sperry | 1.01% | 0.45%(+0.558)#56 | 1.78%(-0.772)#5,756 |
| 57. | Cache | 1.01% | 0.45%(+0.556)#57 | 1.78%(-0.774)#5,766 |
| 58. | Sayre | 0.99% | 0.45%(+0.537)#58 | 1.78%(-0.793)#5,843 |
| 59. | Colcord | 0.97% | 0.45%(+0.515)#59 | 1.78%(-0.815)#5,919 |
| 60. | Goodwell | 0.94% | 0.45%(+0.492)#60 | 1.78%(-0.838)#5,999 |
| 61. | Ralston | 0.94% | 0.45%(+0.491)#61 | 1.78%(-0.839)#6,002 |
| 62. | Taylor Ferry | 0.86% | 0.45%(+0.410)#62 | 1.78%(-0.920)#6,300 |
| 63. | Custer City | 0.86% | 0.45%(+0.406)#63 | 1.78%(-0.924)#6,315 |
| 64. | Blanchard | 0.82% | 0.45%(+0.363)#64 | 1.78%(-0.967)#6,496 |
| 65. | Turley | 0.79% | 0.45%(+0.336)#65 | 1.78%(-0.994)#6,590 |
| 66. | Hobart | 0.77% | 0.45%(+0.315)#66 | 1.78%(-1.01)#6,680 |
| 67. | Winchester | 0.76% | 0.45%(+0.311)#67 | 1.78%(-1.02)#6,690 |
| 68. | Oakhurst | 0.75% | 0.45%(+0.294)#68 | 1.78%(-1.04)#6,775 |
| 69. | Justice | 0.74% | 0.45%(+0.284)#69 | 1.78%(-1.05)#6,819 |
| 70. | Chouteau | 0.72% | 0.45%(+0.272)#70 | 1.78%(-1.06)#6,881 |
| 71. | Kinta | 0.72% | 0.45%(+0.264)#71 | 1.78%(-1.07)#6,915 |
| 72. | Vici | 0.71% | 0.45%(+0.262)#72 | 1.78%(-1.07)#6,927 |
| 73. | Guymon | 0.70% | 0.45%(+0.246)#73 | 1.78%(-1.08)#7,010 |
| 74. | Kaw City | 0.69% | 0.45%(+0.242)#74 | 1.78%(-1.09)#7,030 |
| 75. | Calera | 0.69% | 0.45%(+0.238)#75 | 1.78%(-1.09)#7,049 |
| 76. | Snyder | 0.68% | 0.45%(+0.228)#76 | 1.78%(-1.10)#7,093 |
| 77. | Antlers | 0.68% | 0.45%(+0.225)#77 | 1.78%(-1.10)#7,105 |
| 78. | Central High | 0.68% | 0.45%(+0.223)#78 | 1.78%(-1.11)#7,115 |
| 79. | Shawnee | 0.67% | 0.45%(+0.216)#79 | 1.78%(-1.11)#7,147 |
| 80. | Coyle | 0.67% | 0.45%(+0.214)#80 | 1.78%(-1.12)#7,163 |
| 81. | Broken Bow | 0.66% | 0.45%(+0.211)#81 | 1.78%(-1.12)#7,184 |
| 82. | Claremore | 0.65% | 0.45%(+0.196)#82 | 1.78%(-1.13)#7,271 |
| 83. | Texhoma | 0.65% | 0.45%(+0.193)#83 | 1.78%(-1.14)#7,292 |
| 84. | Harrah | 0.64% | 0.45%(+0.186)#84 | 1.78%(-1.14)#7,331 |
| 85. | Tulsa | 0.63% | 0.45%(+0.178)#85 | 1.78%(-1.15)#7,367 |
| 86. | Tuttle | 0.62% | 0.45%(+0.171)#86 | 1.78%(-1.16)#7,404 |
| 87. | Tahlequah | 0.62% | 0.45%(+0.170)#87 | 1.78%(-1.16)#7,412 |
| 88. | Duncan | 0.62% | 0.45%(+0.167)#88 | 1.78%(-1.16)#7,427 |
| 89. | Granite | 0.61% | 0.45%(+0.158)#89 | 1.78%(-1.17)#7,487 |
| 90. | Ryan | 0.61% | 0.45%(+0.154)#90 | 1.78%(-1.18)#7,519 |
| 91. | Cashion | 0.61% | 0.45%(+0.154)#91 | 1.78%(-1.18)#7,522 |
| 92. | Ponca City | 0.61% | 0.45%(+0.153)#92 | 1.78%(-1.18)#7,533 |
| 93. | Hominy | 0.60% | 0.45%(+0.149)#93 | 1.78%(-1.18)#7,561 |
| 94. | Moore | 0.60% | 0.45%(+0.142)#94 | 1.78%(-1.19)#7,590 |
| 95. | Mcalester | 0.59% | 0.45%(+0.133)#95 | 1.78%(-1.20)#7,648 |
| 96. | El Reno | 0.57% | 0.45%(+0.120)#96 | 1.78%(-1.21)#7,731 |
| 97. | Tribbey | 0.57% | 0.45%(+0.116)#97 | 1.78%(-1.21)#7,751 |
| 98. | Skiatook | 0.57% | 0.45%(+0.115)#98 | 1.78%(-1.22)#7,756 |
| 99. | Tryon | 0.57% | 0.45%(+0.114)#99 | 1.78%(-1.22)#7,757 |
| 100. | Norman | 0.57% | 0.45%(+0.114)#100 | 1.78%(-1.22)#7,758 |
Common Questions
What are the Top 10 Cities with the Highest Percentage of Puerto Rican Population in Oklahoma?
Top 10 Cities with the Highest Percentage of Puerto Rican Population in Oklahoma are:
#1
6.90%
#2
5.75%
#3
5.33%
#4
3.86%
#5
3.50%
#6
3.44%
#7
3.40%
#8
3.00%
#9
2.88%
#10
2.82%
What city has the Highest Percentage of Puerto Rican Population in Oklahoma?
Pettit has the Highest Percentage of Puerto Rican Population in Oklahoma with 6.90%.
What is the Percentage of Puerto Rican Population in the State of Oklahoma?
Percentage of Puerto Rican Population in Oklahoma is 0.45%.
What is the Percentage of Puerto Rican Population in the United States?
Percentage of Puerto Rican Population in the United States is 1.78%.