Cities with the Highest Percentage of Population Employed in Retail Trade in Oklahoma
RELATED REPORTS & OPTIONS
Retail Trade
Oklahoma
Compare Cities
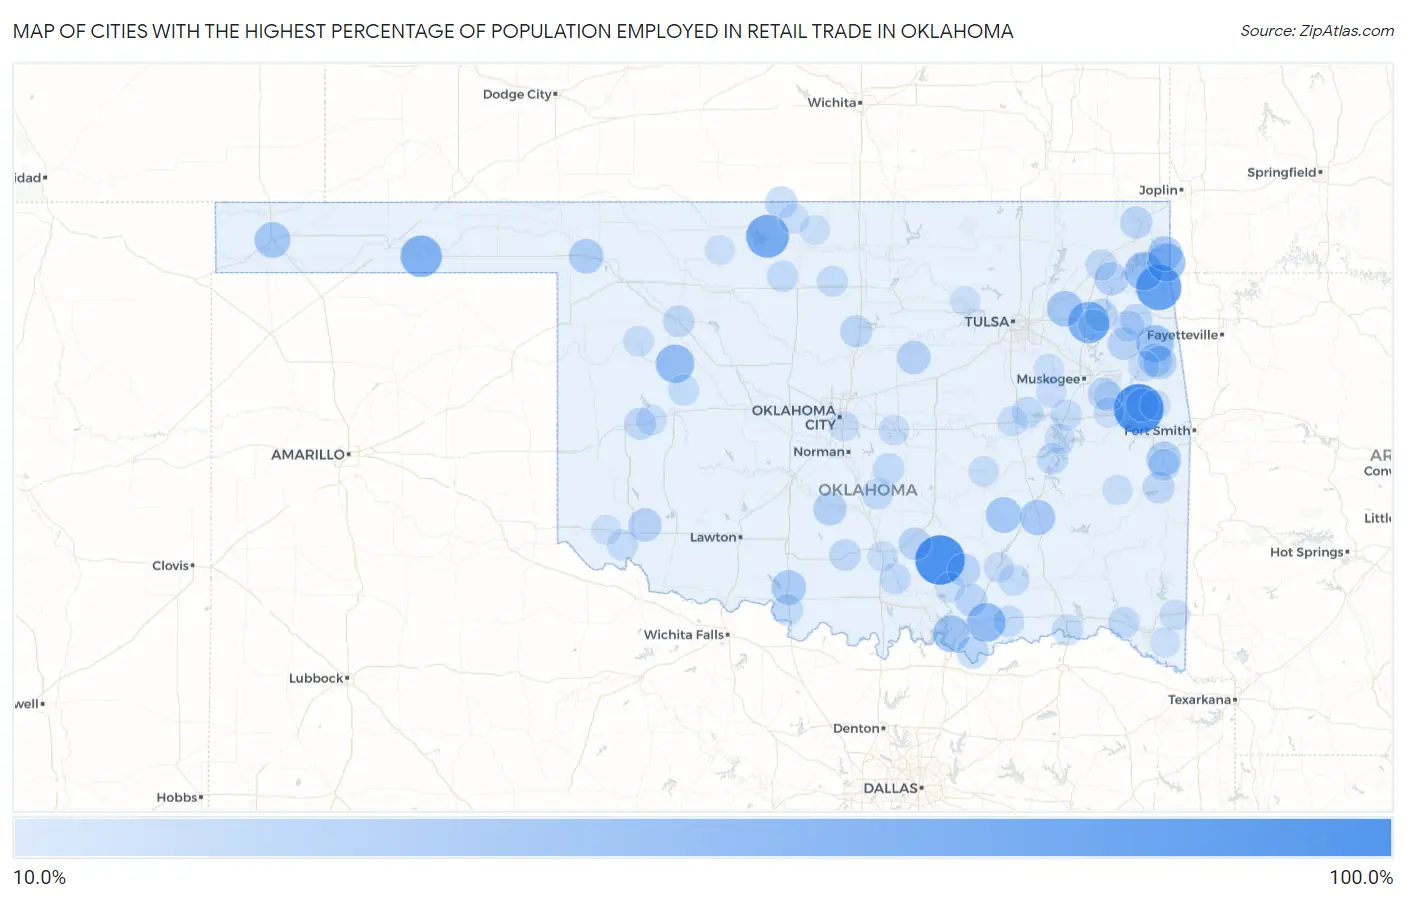
Map of Cities with the Highest Percentage of Population Employed in Retail Trade in Oklahoma
0.0%
100.0%
Cities with the Highest Percentage of Population Employed in Retail Trade in Oklahoma
| City | % Employed | vs State | vs National | |
| 1. | Connerville | 100.0% | 11.8%(+88.2)#1 | 11.0%(+89.0)#12 |
| 2. | Pinhook Corner | 100.0% | 11.8%(+88.2)#2 | 11.0%(+89.0)#22 |
| 3. | Vanoss | 100.0% | 11.8%(+88.2)#3 | 11.0%(+89.0)#33 |
| 4. | Sycamore | 82.1% | 11.8%(+70.3)#4 | 11.0%(+71.1)#71 |
| 5. | Nescatunga | 72.5% | 11.8%(+60.7)#5 | 11.0%(+61.5)#86 |
| 6. | Hardesty | 66.0% | 11.8%(+54.2)#6 | 11.0%(+55.0)#112 |
| 7. | Mazie | 65.9% | 11.8%(+54.1)#7 | 11.0%(+54.9)#113 |
| 8. | Hoyt | 58.3% | 11.8%(+46.6)#8 | 11.0%(+47.3)#167 |
| 9. | Blue | 54.3% | 11.8%(+42.5)#9 | 11.0%(+43.3)#200 |
| 10. | Putnam | 53.3% | 11.8%(+41.6)#10 | 11.0%(+42.3)#212 |
| 11. | Zena | 52.5% | 11.8%(+40.7)#11 | 11.0%(+41.5)#219 |
| 12. | Dodge | 52.2% | 11.8%(+40.4)#12 | 11.0%(+41.2)#222 |
| 13. | Proctor | 48.9% | 11.8%(+37.1)#13 | 11.0%(+37.9)#267 |
| 14. | Platter | 47.1% | 11.8%(+35.3)#14 | 11.0%(+36.1)#299 |
| 15. | Golden | 45.5% | 11.8%(+33.7)#15 | 11.0%(+34.5)#337 |
| 16. | Boise City | 42.6% | 11.8%(+30.8)#16 | 11.0%(+31.6)#402 |
| 17. | Tiawah | 42.4% | 11.8%(+30.6)#17 | 11.0%(+31.4)#406 |
| 18. | Ashland | 42.1% | 11.8%(+30.3)#18 | 11.0%(+31.1)#417 |
| 19. | Bunch | 41.7% | 11.8%(+29.9)#19 | 11.0%(+30.7)#428 |
| 20. | Blanco | 40.9% | 11.8%(+29.2)#20 | 11.0%(+29.9)#452 |
| 21. | Cayuga | 39.1% | 11.8%(+27.3)#21 | 11.0%(+28.1)#516 |
| 22. | Addington | 38.1% | 11.8%(+26.3)#22 | 11.0%(+27.1)#555 |
| 23. | Lake Ellsworth Addition | 38.0% | 11.8%(+26.2)#23 | 11.0%(+27.0)#560 |
| 24. | Panama | 37.6% | 11.8%(+25.9)#24 | 11.0%(+26.6)#569 |
| 25. | May | 37.5% | 11.8%(+25.7)#25 | 11.0%(+26.5)#580 |
| 26. | Lawtonka Acres | 36.8% | 11.8%(+25.1)#26 | 11.0%(+25.9)#614 |
| 27. | Titanic | 33.3% | 11.8%(+21.6)#27 | 11.0%(+22.3)#776 |
| 28. | Mulberry | 33.3% | 11.8%(+21.6)#28 | 11.0%(+22.3)#794 |
| 29. | Hodgen | 33.3% | 11.8%(+21.6)#29 | 11.0%(+22.3)#798 |
| 30. | Dwight Mission | 33.3% | 11.8%(+21.6)#30 | 11.0%(+22.3)#803 |
| 31. | Friendship | 33.3% | 11.8%(+21.6)#31 | 11.0%(+22.3)#810 |
| 32. | Agra | 33.0% | 11.8%(+21.2)#32 | 11.0%(+22.0)#826 |
| 33. | Erin Springs | 32.7% | 11.8%(+20.9)#33 | 11.0%(+21.7)#842 |
| 34. | Pensacola | 32.6% | 11.8%(+20.9)#34 | 11.0%(+21.6)#849 |
| 35. | Wapanucka | 31.2% | 11.8%(+19.4)#35 | 11.0%(+20.2)#961 |
| 36. | Gideon | 30.2% | 11.8%(+18.4)#36 | 11.0%(+19.2)#1,040 |
| 37. | Hickory | 30.0% | 11.8%(+18.2)#37 | 11.0%(+19.0)#1,062 |
| 38. | Sams Corner | 29.8% | 11.8%(+18.0)#38 | 11.0%(+18.8)#1,082 |
| 39. | Crescent Springs | 29.3% | 11.8%(+17.6)#39 | 11.0%(+18.4)#1,130 |
| 40. | Kenefic | 29.0% | 11.8%(+17.3)#40 | 11.0%(+18.0)#1,151 |
| 41. | Sand Hill | 28.6% | 11.8%(+16.8)#41 | 11.0%(+17.6)#1,203 |
| 42. | Mcbride | 28.6% | 11.8%(+16.8)#42 | 11.0%(+17.6)#1,214 |
| 43. | Rocky Ford | 28.4% | 11.8%(+16.7)#43 | 11.0%(+17.4)#1,239 |
| 44. | Manchester | 27.9% | 11.8%(+16.1)#44 | 11.0%(+16.9)#1,297 |
| 45. | Kemp | 27.8% | 11.8%(+16.1)#45 | 11.0%(+16.9)#1,304 |
| 46. | Dotyville | 27.7% | 11.8%(+15.9)#46 | 11.0%(+16.7)#1,330 |
| 47. | Mulhall | 27.7% | 11.8%(+15.9)#47 | 11.0%(+16.7)#1,332 |
| 48. | Canute | 27.2% | 11.8%(+15.4)#48 | 11.0%(+16.2)#1,392 |
| 49. | Wister | 27.1% | 11.8%(+15.4)#49 | 11.0%(+16.2)#1,393 |
| 50. | Shady Point | 26.8% | 11.8%(+15.1)#50 | 11.0%(+15.9)#1,437 |
| 51. | Tatums | 26.8% | 11.8%(+15.1)#51 | 11.0%(+15.8)#1,438 |
| 52. | Seiling | 26.4% | 11.8%(+14.7)#52 | 11.0%(+15.5)#1,491 |
| 53. | Nashoba | 26.3% | 11.8%(+14.6)#53 | 11.0%(+15.3)#1,515 |
| 54. | Millerton | 25.8% | 11.8%(+14.1)#54 | 11.0%(+14.9)#1,578 |
| 55. | Carrier | 25.6% | 11.8%(+13.8)#55 | 11.0%(+14.6)#1,624 |
| 56. | Pin Oak Acres | 25.0% | 11.8%(+13.2)#56 | 11.0%(+14.0)#1,726 |
| 57. | Teresita | 25.0% | 11.8%(+13.2)#57 | 11.0%(+14.0)#1,739 |
| 58. | Grayson | 25.0% | 11.8%(+13.2)#58 | 11.0%(+14.0)#1,742 |
| 59. | Sugden | 25.0% | 11.8%(+13.2)#59 | 11.0%(+14.0)#1,759 |
| 60. | Elohim | 25.0% | 11.8%(+13.2)#60 | 11.0%(+14.0)#1,762 |
| 61. | Rosedale | 25.0% | 11.8%(+13.2)#61 | 11.0%(+14.0)#1,764 |
| 62. | Tribbey | 24.8% | 11.8%(+13.0)#62 | 11.0%(+13.8)#1,791 |
| 63. | Gene Autry | 24.7% | 11.8%(+13.0)#63 | 11.0%(+13.7)#1,808 |
| 64. | Canadian | 24.7% | 11.8%(+12.9)#64 | 11.0%(+13.7)#1,819 |
| 65. | Big Cabin | 24.7% | 11.8%(+12.9)#65 | 11.0%(+13.7)#1,820 |
| 66. | Lane | 24.5% | 11.8%(+12.8)#66 | 11.0%(+13.6)#1,847 |
| 67. | Bennington | 24.2% | 11.8%(+12.5)#67 | 11.0%(+13.3)#1,900 |
| 68. | Grant | 24.2% | 11.8%(+12.5)#68 | 11.0%(+13.2)#1,913 |
| 69. | Checotah | 24.1% | 11.8%(+12.3)#69 | 11.0%(+13.1)#1,952 |
| 70. | Moyers | 24.0% | 11.8%(+12.2)#70 | 11.0%(+13.0)#1,967 |
| 71. | Olustee | 23.8% | 11.8%(+12.1)#71 | 11.0%(+12.8)#2,000 |
| 72. | Custer City | 23.7% | 11.8%(+12.0)#72 | 11.0%(+12.7)#2,034 |
| 73. | Bug Tussle | 23.6% | 11.8%(+11.9)#73 | 11.0%(+12.6)#2,053 |
| 74. | Garber | 23.5% | 11.8%(+11.8)#74 | 11.0%(+12.5)#2,072 |
| 75. | Foss | 23.3% | 11.8%(+11.5)#75 | 11.0%(+12.3)#2,161 |
| 76. | Caney | 23.2% | 11.8%(+11.4)#76 | 11.0%(+12.2)#2,170 |
| 77. | Eagletown | 23.1% | 11.8%(+11.3)#77 | 11.0%(+12.1)#2,192 |
| 78. | Camargo | 22.5% | 11.8%(+10.8)#78 | 11.0%(+11.5)#2,346 |
| 79. | Horntown | 22.2% | 11.8%(+10.5)#79 | 11.0%(+11.2)#2,435 |
| 80. | Dale | 22.0% | 11.8%(+10.3)#80 | 11.0%(+11.0)#2,489 |
| 81. | Atoka | 22.0% | 11.8%(+10.2)#81 | 11.0%(+11.0)#2,510 |
| 82. | Webbers Falls | 21.8% | 11.8%(+10.0)#82 | 11.0%(+10.8)#2,569 |
| 83. | Honey Hill | 21.7% | 11.8%(+9.98)#83 | 11.0%(+10.7)#2,582 |
| 84. | Brushy | 21.6% | 11.8%(+9.88)#84 | 11.0%(+10.6)#2,610 |
| 85. | Boynton | 21.6% | 11.8%(+9.81)#85 | 11.0%(+10.6)#2,636 |
| 86. | Red Oak | 21.3% | 11.8%(+9.58)#86 | 11.0%(+10.4)#2,714 |
| 87. | Henryetta | 21.3% | 11.8%(+9.55)#87 | 11.0%(+10.3)#2,731 |
| 88. | Eufaula | 21.0% | 11.8%(+9.29)#88 | 11.0%(+10.1)#2,824 |
| 89. | Valley Brook | 21.0% | 11.8%(+9.28)#89 | 11.0%(+10.0)#2,826 |
| 90. | Davis | 20.9% | 11.8%(+9.18)#90 | 11.0%(+9.95)#2,862 |
| 91. | East Duke | 20.6% | 11.8%(+8.85)#91 | 11.0%(+9.62)#2,994 |
| 92. | Wakita | 20.6% | 11.8%(+8.83)#92 | 11.0%(+9.60)#2,998 |
| 93. | Haskell | 20.6% | 11.8%(+8.80)#93 | 11.0%(+9.57)#3,015 |
| 94. | Dacoma | 20.4% | 11.8%(+8.65)#94 | 11.0%(+9.42)#3,078 |
| 95. | Medford | 20.2% | 11.8%(+8.48)#95 | 11.0%(+9.25)#3,149 |
| 96. | Toppers | 20.1% | 11.8%(+8.29)#96 | 11.0%(+9.06)#3,225 |
| 97. | Haworth | 20.0% | 11.8%(+8.24)#97 | 11.0%(+9.01)#3,268 |
| 98. | Milburn | 20.0% | 11.8%(+8.24)#98 | 11.0%(+9.01)#3,270 |
| 99. | Sour John | 20.0% | 11.8%(+8.24)#99 | 11.0%(+9.01)#3,284 |
| 100. | Osage | 20.0% | 11.8%(+8.24)#100 | 11.0%(+9.01)#3,286 |
Common Questions
What are the Top 10 Cities with the Highest Percentage of Population Employed in Retail Trade in Oklahoma?
Top 10 Cities with the Highest Percentage of Population Employed in Retail Trade in Oklahoma are:
#1
100.0%
#2
100.0%
#3
82.1%
#4
72.5%
#5
66.0%
#6
65.9%
#7
54.3%
#8
53.3%
#9
52.5%
#10
52.2%
What city has the Highest Percentage of Population Employed in Retail Trade in Oklahoma?
Connerville has the Highest Percentage of Population Employed in Retail Trade in Oklahoma with 100.0%.
What is the Percentage of Population Employed in Retail Trade in the State of Oklahoma?
Percentage of Population Employed in Retail Trade in Oklahoma is 11.8%.
What is the Percentage of Population Employed in Retail Trade in the United States?
Percentage of Population Employed in Retail Trade in the United States is 11.0%.