Preston Potter Hollow, NY Map & Demographics
Preston Potter Hollow Map
Preston Potter Hollow Overview
$54,011
PER CAPITA INCOME
$84,583
AVG FAMILY INCOME
$113,464
AVG HOUSEHOLD INCOME
0.25
INEQUALITY / GINI INDEX
466
TOTAL POPULATION
241
MALE POPULATION
225
FEMALE POPULATION
107.11
MALES / 100 FEMALES
93.36
FEMALES / 100 MALES
52.0
MEDIAN AGE
2.5
AVG FAMILY SIZE
2.2
AVG HOUSEHOLD SIZE
239
LABOR FORCE [ PEOPLE ]
53.1%
PERCENT IN LABOR FORCE
5.0%
UNEMPLOYMENT RATE
Income in Preston Potter Hollow
Income Overview in Preston Potter Hollow
Per Capita Income in Preston Potter Hollow is $54,011, while median incomes of families and households are $84,583 and $113,464 respectively.
| Characteristic | Number | Measure |
| Per Capita Income | 466 | $54,011 |
| Median Family Income | 87 | $84,583 |
| Mean Family Income | 87 | $98,628 |
| Median Household Income | 216 | $113,464 |
| Mean Household Income | 216 | $106,440 |
| Income Deficit | 87 | $0 |
| Wage / Income Gap (%) | 466 | 0.00% |
| Wage / Income Gap ($) | 466 | 100.00¢ per $1 |
| Gini / Inequality Index | 466 | 0.25 |
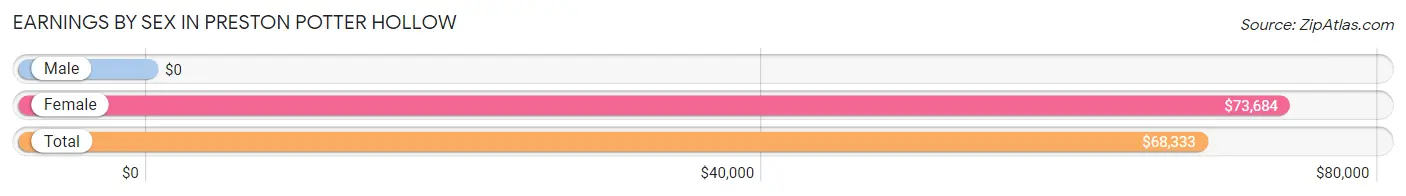
Earnings by Sex in Preston Potter Hollow
| Sex | Number | Average Earnings |
| Male | 130 (42.2%) | $0 |
| Female | 178 (57.8%) | $73,684 |
| Total | 308 (100.0%) | $68,333 |
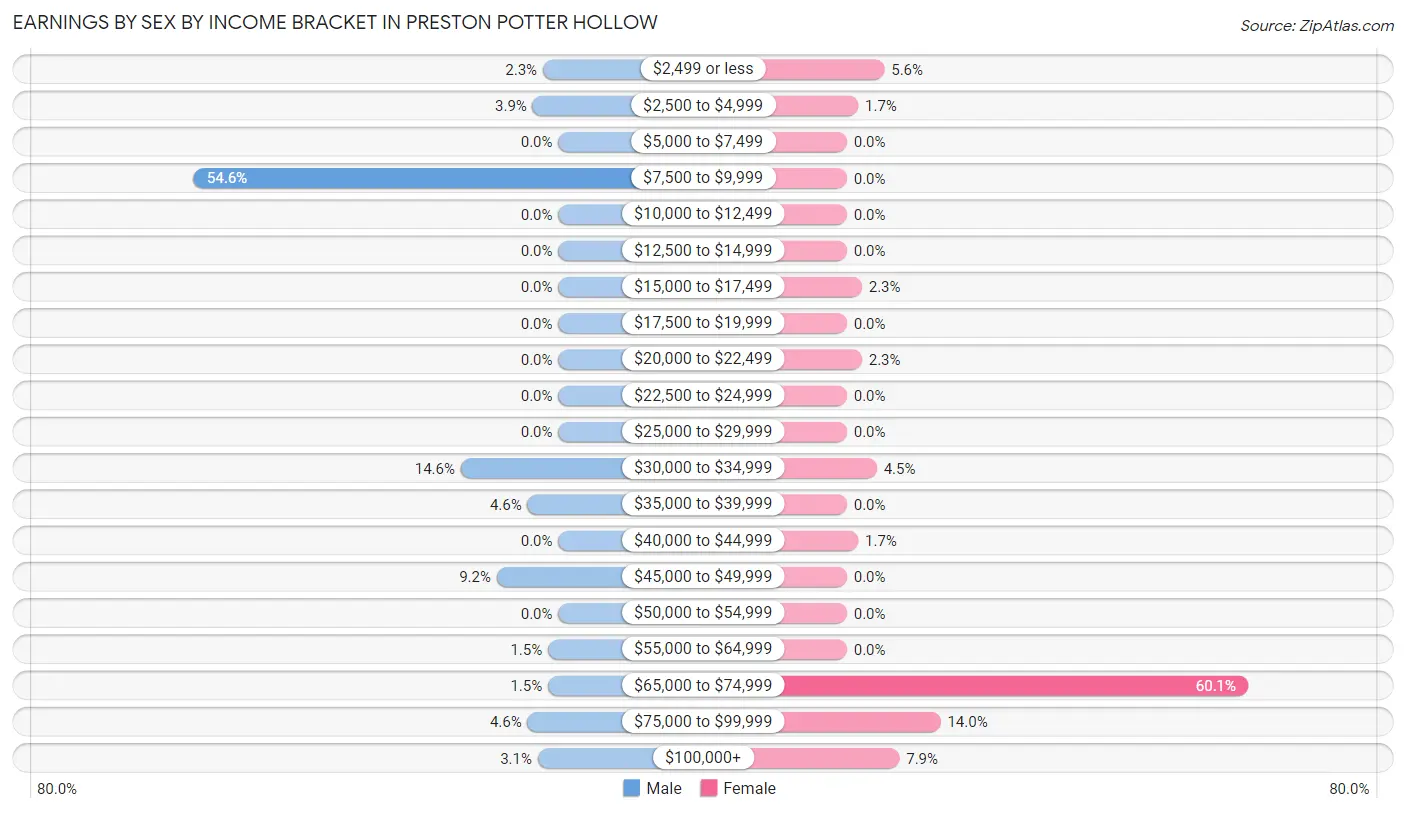
Earnings by Sex by Income Bracket in Preston Potter Hollow
The most common earnings brackets in Preston Potter Hollow are $7,500 to $9,999 for men (71 | 54.6%) and $65,000 to $74,999 for women (107 | 60.1%).
| Income | Male | Female |
| $2,499 or less | 3 (2.3%) | 10 (5.6%) |
| $2,500 to $4,999 | 5 (3.8%) | 3 (1.7%) |
| $5,000 to $7,499 | 0 (0.0%) | 0 (0.0%) |
| $7,500 to $9,999 | 71 (54.6%) | 0 (0.0%) |
| $10,000 to $12,499 | 0 (0.0%) | 0 (0.0%) |
| $12,500 to $14,999 | 0 (0.0%) | 0 (0.0%) |
| $15,000 to $17,499 | 0 (0.0%) | 4 (2.2%) |
| $17,500 to $19,999 | 0 (0.0%) | 0 (0.0%) |
| $20,000 to $22,499 | 0 (0.0%) | 4 (2.2%) |
| $22,500 to $24,999 | 0 (0.0%) | 0 (0.0%) |
| $25,000 to $29,999 | 0 (0.0%) | 0 (0.0%) |
| $30,000 to $34,999 | 19 (14.6%) | 8 (4.5%) |
| $35,000 to $39,999 | 6 (4.6%) | 0 (0.0%) |
| $40,000 to $44,999 | 0 (0.0%) | 3 (1.7%) |
| $45,000 to $49,999 | 12 (9.2%) | 0 (0.0%) |
| $50,000 to $54,999 | 0 (0.0%) | 0 (0.0%) |
| $55,000 to $64,999 | 2 (1.5%) | 0 (0.0%) |
| $65,000 to $74,999 | 2 (1.5%) | 107 (60.1%) |
| $75,000 to $99,999 | 6 (4.6%) | 25 (14.0%) |
| $100,000+ | 4 (3.1%) | 14 (7.9%) |
| Total | 130 (100.0%) | 178 (100.0%) |
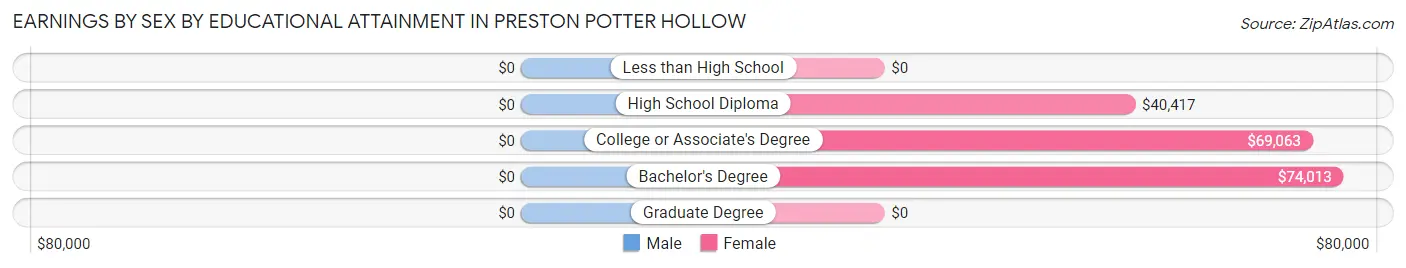
Earnings by Sex by Educational Attainment in Preston Potter Hollow
| Educational Attainment | Male Income | Female Income |
| Less than High School | - | - |
| High School Diploma | - | - |
| College or Associate's Degree | - | - |
| Bachelor's Degree | - | - |
| Graduate Degree | - | - |
| Total | - | - |
Family Income in Preston Potter Hollow
Family Income Brackets in Preston Potter Hollow
According to the Preston Potter Hollow family income data, there are 21 families falling into the $100,000 to $149,999 income range, which is the most common income bracket and makes up 24.1% of all families.
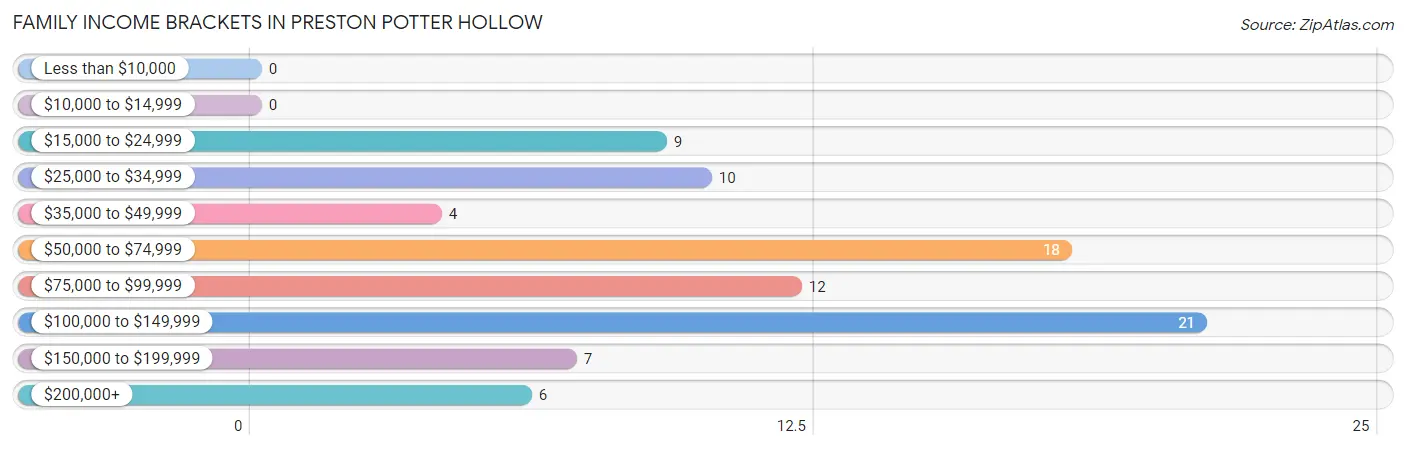
| Income Bracket | # Families | % Families |
| Less than $10,000 | 0 | 0.0% |
| $10,000 to $14,999 | 0 | 0.0% |
| $15,000 to $24,999 | 9 | 10.3% |
| $25,000 to $34,999 | 10 | 11.5% |
| $35,000 to $49,999 | 4 | 4.6% |
| $50,000 to $74,999 | 18 | 20.7% |
| $75,000 to $99,999 | 12 | 13.8% |
| $100,000 to $149,999 | 21 | 24.1% |
| $150,000 to $199,999 | 7 | 8.0% |
| $200,000+ | 6 | 6.9% |
Family Income by Famaliy Size in Preston Potter Hollow
3-person families (19 | 21.8%) account for the highest median family income in Preston Potter Hollow with $120,536 per family, while 3-person families (19 | 21.8%) have the highest median income of $40,179 per family member.
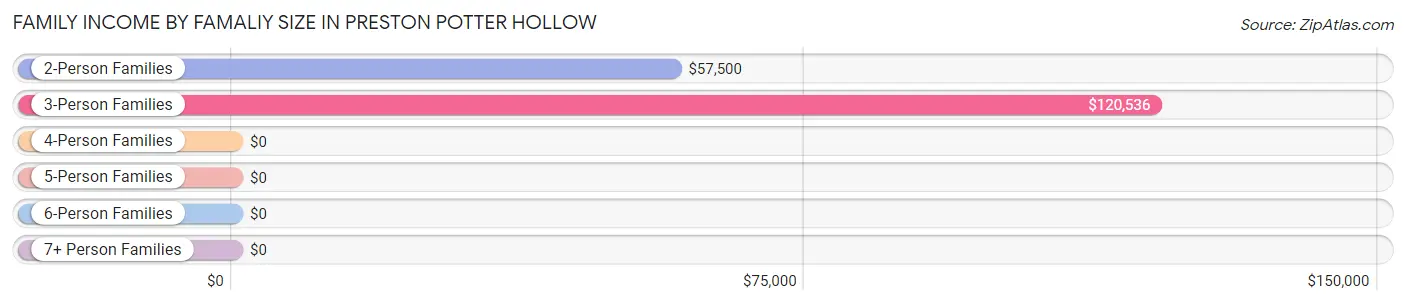
| Income Bracket | # Families | Median Income |
| 2-Person Families | 62 (71.3%) | $57,500 |
| 3-Person Families | 19 (21.8%) | $120,536 |
| 4-Person Families | 4 (4.6%) | $0 |
| 5-Person Families | 2 (2.3%) | $0 |
| 6-Person Families | 0 (0.0%) | $0 |
| 7+ Person Families | 0 (0.0%) | $0 |
| Total | 87 (100.0%) | $84,583 |
Family Income by Number of Earners in Preston Potter Hollow
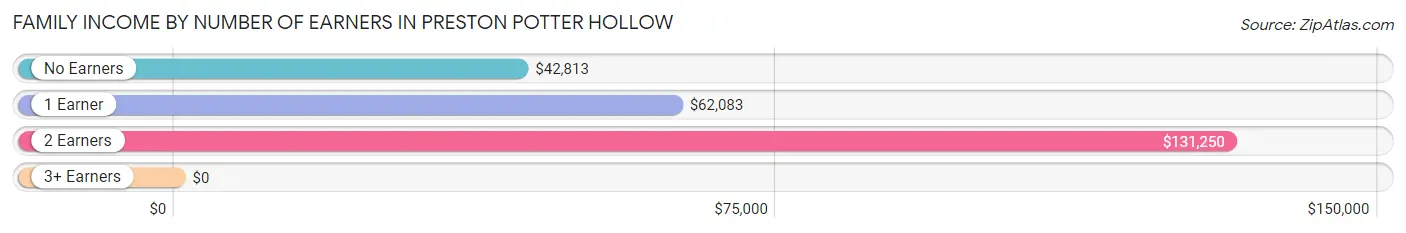
| Number of Earners | # Families | Median Income |
| No Earners | 31 (35.6%) | $42,813 |
| 1 Earner | 34 (39.1%) | $62,083 |
| 2 Earners | 16 (18.4%) | $131,250 |
| 3+ Earners | 6 (6.9%) | $0 |
| Total | 87 (100.0%) | $84,583 |
Household Income in Preston Potter Hollow
Household Income Brackets in Preston Potter Hollow
With 126 households falling in the category, the $100,000 to $149,999 income range is the most frequent in Preston Potter Hollow, accounting for 58.3% of all households.
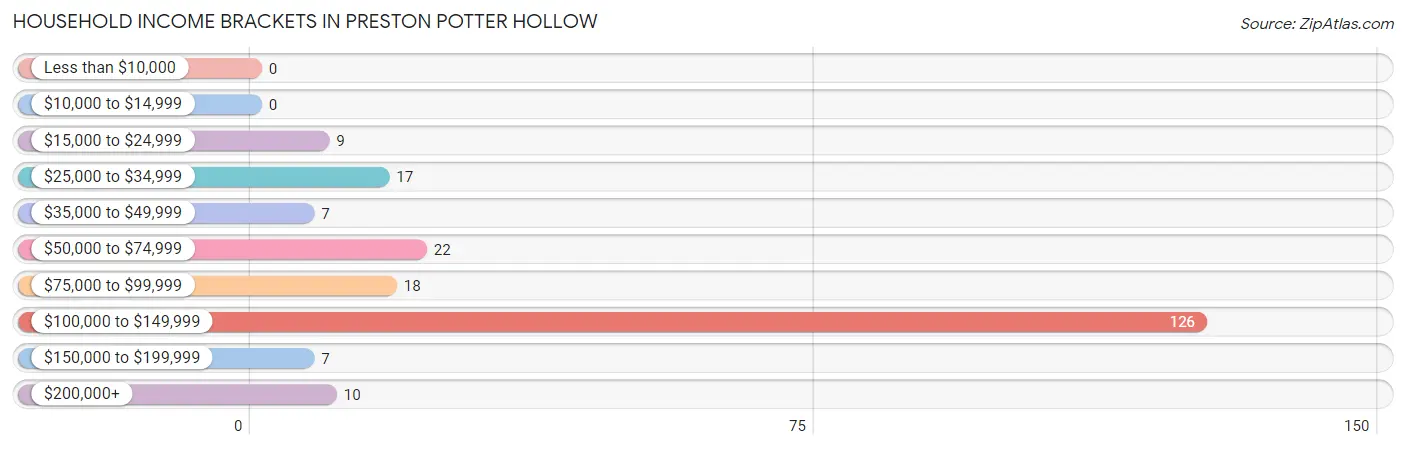
| Income Bracket | # Households | % Households |
| Less than $10,000 | 0 | 0.0% |
| $10,000 to $14,999 | 0 | 0.0% |
| $15,000 to $24,999 | 9 | 4.2% |
| $25,000 to $34,999 | 17 | 7.9% |
| $35,000 to $49,999 | 7 | 3.2% |
| $50,000 to $74,999 | 22 | 10.2% |
| $75,000 to $99,999 | 18 | 8.3% |
| $100,000 to $149,999 | 126 | 58.3% |
| $150,000 to $199,999 | 7 | 3.2% |
| $200,000+ | 10 | 4.6% |
Household Income by Householder Age in Preston Potter Hollow
The median household income in Preston Potter Hollow is $113,464, with the highest median household income of $121,786 found in the 25 to 44 years age bracket for the primary householder. A total of 20 households (9.3%) fall into this category.
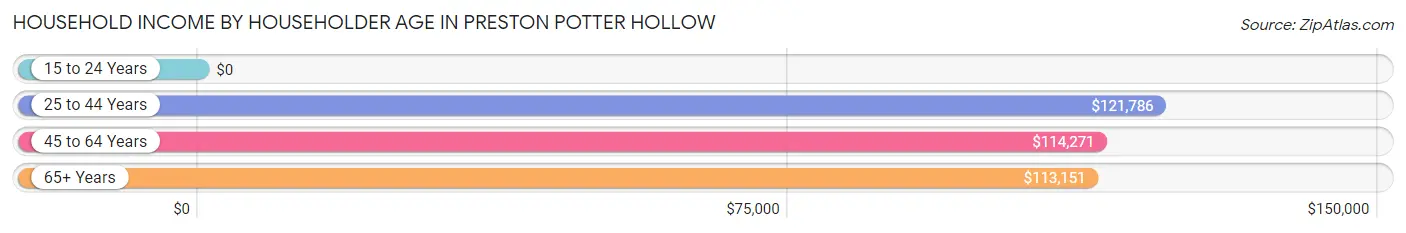
| Income Bracket | # Households | Median Income |
| 15 to 24 Years | 0 (0.0%) | $0 |
| 25 to 44 Years | 20 (9.3%) | $121,786 |
| 45 to 64 Years | 73 (33.8%) | $114,271 |
| 65+ Years | 123 (56.9%) | $113,151 |
| Total | 216 (100.0%) | $113,464 |
Poverty in Preston Potter Hollow
Income Below Poverty by Sex and Age in Preston Potter Hollow
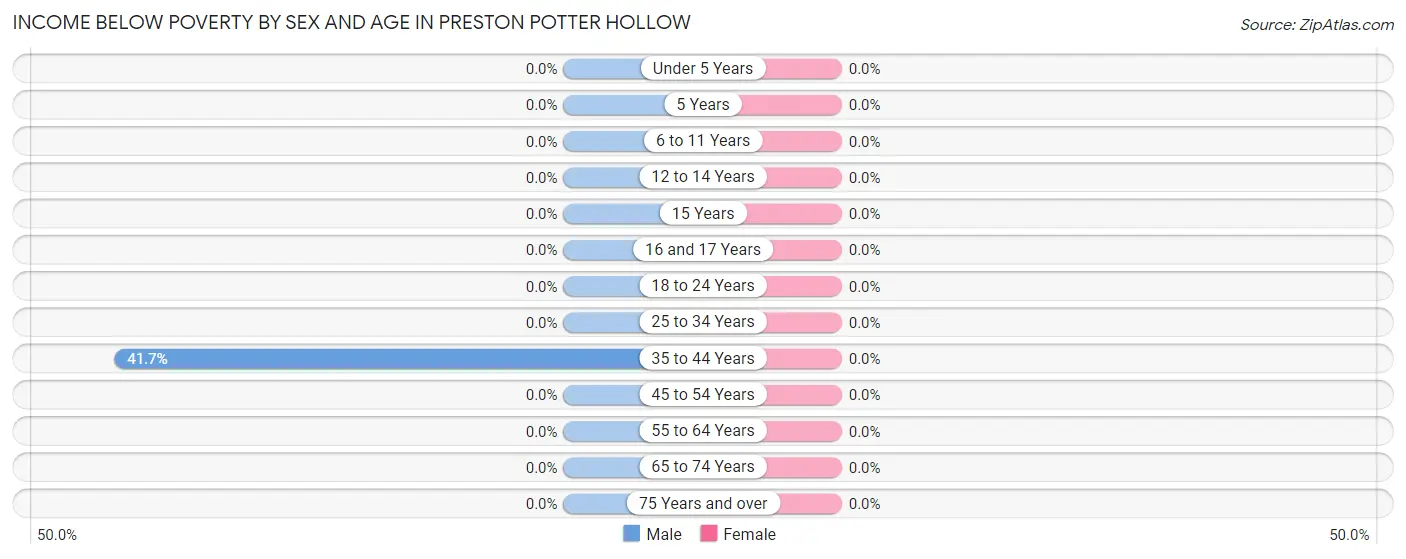
| Age Bracket | Male | Female |
| Under 5 Years | 0 (0.0%) | 0 (0.0%) |
| 5 Years | 0 (0.0%) | 0 (0.0%) |
| 6 to 11 Years | 0 (0.0%) | 0 (0.0%) |
| 12 to 14 Years | 0 (0.0%) | 0 (0.0%) |
| 15 Years | 0 (0.0%) | 0 (0.0%) |
| 16 and 17 Years | 0 (0.0%) | 0 (0.0%) |
| 18 to 24 Years | 0 (0.0%) | 0 (0.0%) |
| 25 to 34 Years | 0 (0.0%) | 0 (0.0%) |
| 35 to 44 Years | 5 (41.7%) | 0 (0.0%) |
| 45 to 54 Years | 0 (0.0%) | 0 (0.0%) |
| 55 to 64 Years | 0 (0.0%) | 0 (0.0%) |
| 65 to 74 Years | 0 (0.0%) | 0 (0.0%) |
| 75 Years and over | 0 (0.0%) | 0 (0.0%) |
| Total | 5 (2.1%) | 0 (0.0%) |
Income Above Poverty by Sex and Age in Preston Potter Hollow
According to the poverty statistics in Preston Potter Hollow, males aged under 5 years and females aged 12 to 14 years are the age groups that are most secure financially, with 100.0% of males and 100.0% of females in these age groups living above the poverty line.
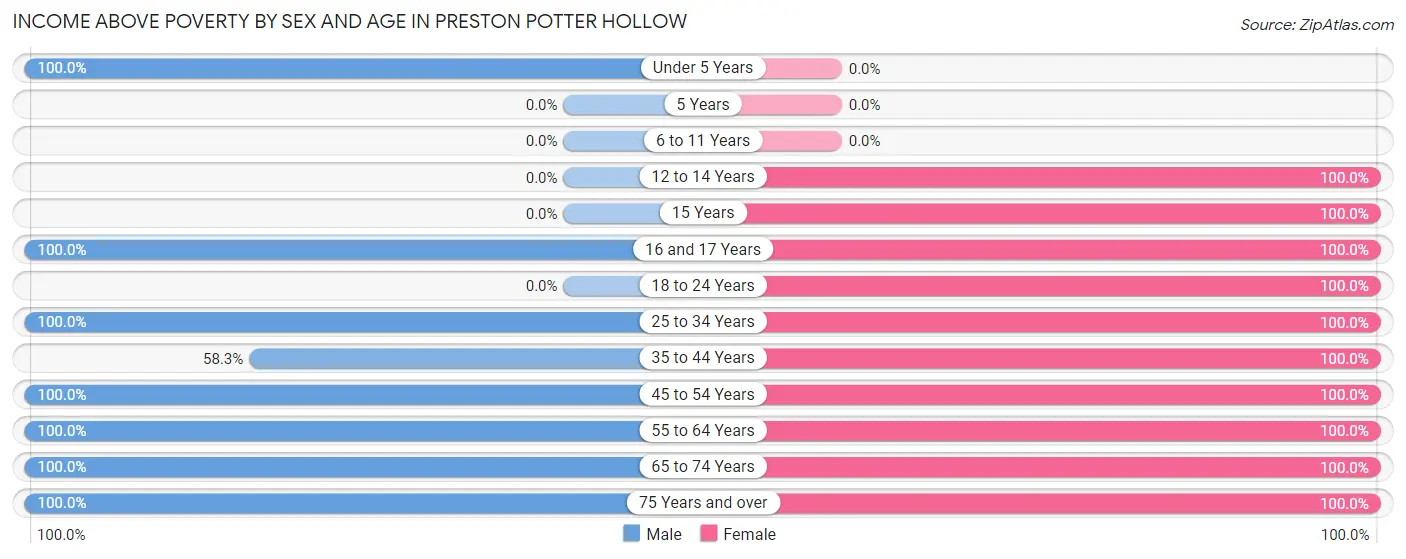
| Age Bracket | Male | Female |
| Under 5 Years | 6 (100.0%) | 0 (0.0%) |
| 5 Years | 0 (0.0%) | 0 (0.0%) |
| 6 to 11 Years | 0 (0.0%) | 0 (0.0%) |
| 12 to 14 Years | 0 (0.0%) | 4 (100.0%) |
| 15 Years | 0 (0.0%) | 6 (100.0%) |
| 16 and 17 Years | 12 (100.0%) | 7 (100.0%) |
| 18 to 24 Years | 0 (0.0%) | 6 (100.0%) |
| 25 to 34 Years | 15 (100.0%) | 15 (100.0%) |
| 35 to 44 Years | 7 (58.3%) | 5 (100.0%) |
| 45 to 54 Years | 38 (100.0%) | 119 (100.0%) |
| 55 to 64 Years | 33 (100.0%) | 40 (100.0%) |
| 65 to 74 Years | 87 (100.0%) | 14 (100.0%) |
| 75 Years and over | 38 (100.0%) | 9 (100.0%) |
| Total | 236 (97.9%) | 225 (100.0%) |
Income Below Poverty Among Married-Couple Families in Preston Potter Hollow
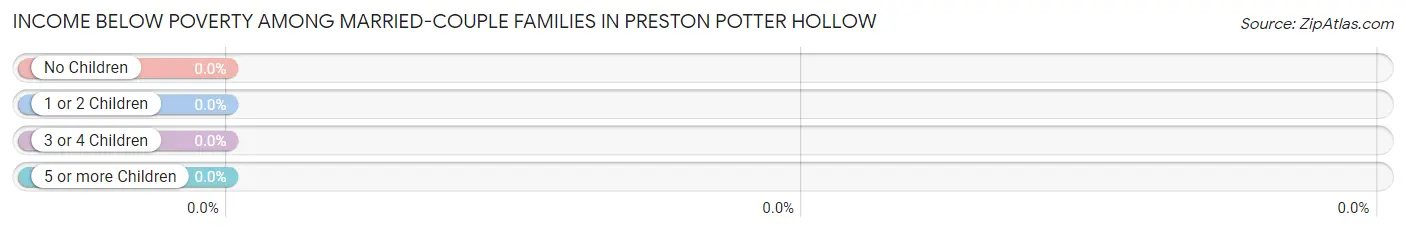
| Children | Above Poverty | Below Poverty |
| No Children | 61 (100.0%) | 0 (0.0%) |
| 1 or 2 Children | 17 (100.0%) | 0 (0.0%) |
| 3 or 4 Children | 0 (0.0%) | 0 (0.0%) |
| 5 or more Children | 0 (0.0%) | 0 (0.0%) |
| Total | 78 (100.0%) | 0 (0.0%) |
Income Below Poverty Among Single-Parent Households in Preston Potter Hollow
| Children | Single Father | Single Mother |
| No Children | 0 (0.0%) | 0 (0.0%) |
| 1 or 2 Children | 0 (0.0%) | 0 (0.0%) |
| 3 or 4 Children | 0 (0.0%) | 0 (0.0%) |
| 5 or more Children | 0 (0.0%) | 0 (0.0%) |
| Total | 0 (0.0%) | 0 (0.0%) |
Income Below Poverty Among Married-Couple vs Single-Parent Households in Preston Potter Hollow
| Children | Married-Couple Families | Single-Parent Households |
| No Children | 0 (0.0%) | 0 (0.0%) |
| 1 or 2 Children | 0 (0.0%) | 0 (0.0%) |
| 3 or 4 Children | 0 (0.0%) | 0 (0.0%) |
| 5 or more Children | 0 (0.0%) | 0 (0.0%) |
| Total | 0 (0.0%) | 0 (0.0%) |
Race in Preston Potter Hollow
The most populous races in Preston Potter Hollow are White / Caucasian (463 | 99.4%), Hispanic or Latino (15 | 3.2%), and Two or more Races (3 | 0.6%).
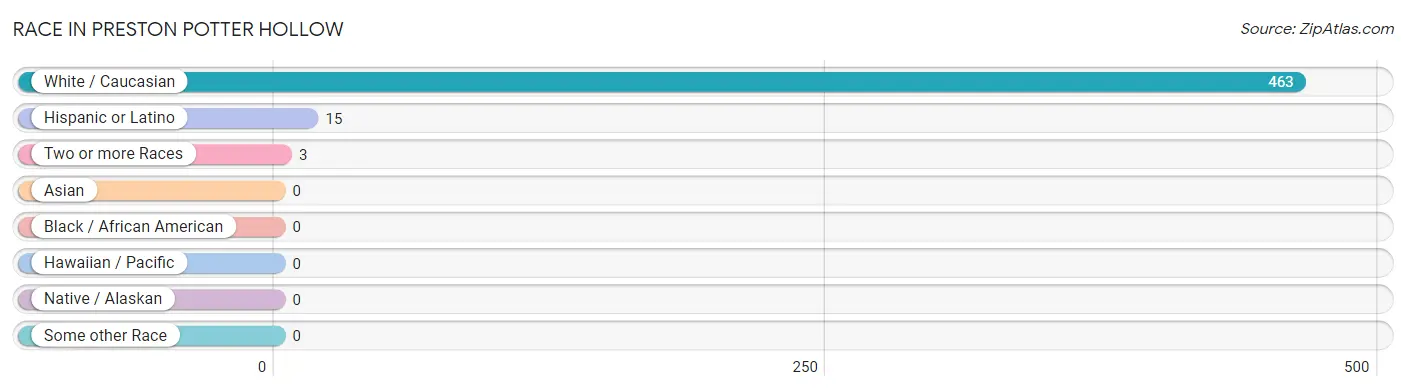
| Race | # Population | % Population |
| Asian | 0 | 0.0% |
| Black / African American | 0 | 0.0% |
| Hawaiian / Pacific | 0 | 0.0% |
| Hispanic or Latino | 15 | 3.2% |
| Native / Alaskan | 0 | 0.0% |
| White / Caucasian | 463 | 99.4% |
| Two or more Races | 3 | 0.6% |
| Some other Race | 0 | 0.0% |
| Total | 466 | 100.0% |
Ancestry in Preston Potter Hollow
The most populous ancestries reported in Preston Potter Hollow are Irish (162 | 34.8%), Italian (157 | 33.7%), German (71 | 15.2%), English (31 | 6.7%), and Russian (18 | 3.9%), together accounting for 94.2% of all Preston Potter Hollow residents.
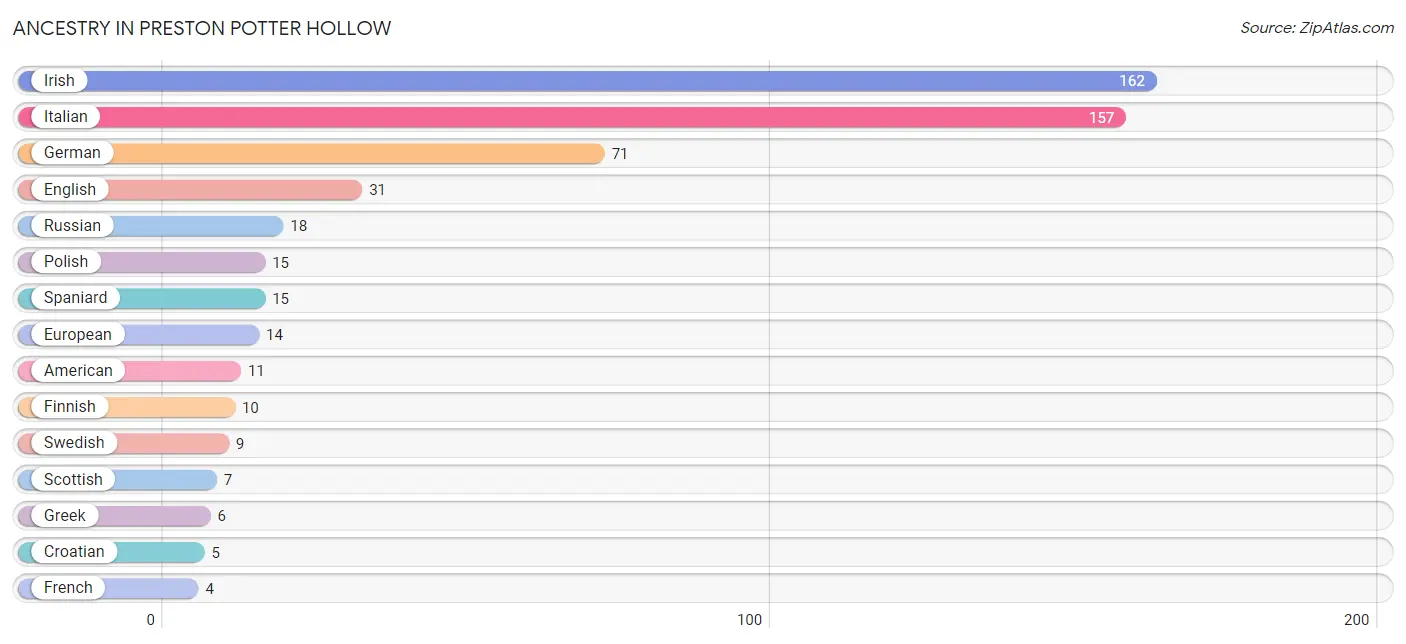
| Ancestry | # Population | % Population |
| American | 11 | 2.4% |
| Arab | 2 | 0.4% |
| Croatian | 5 | 1.1% |
| English | 31 | 6.7% |
| European | 14 | 3.0% |
| Finnish | 10 | 2.1% |
| French | 4 | 0.9% |
| French Canadian | 4 | 0.9% |
| German | 71 | 15.2% |
| Greek | 6 | 1.3% |
| Irish | 162 | 34.8% |
| Italian | 157 | 33.7% |
| Norwegian | 4 | 0.9% |
| Polish | 15 | 3.2% |
| Portuguese | 3 | 0.6% |
| Russian | 18 | 3.9% |
| Scottish | 7 | 1.5% |
| Spaniard | 15 | 3.2% |
| Swedish | 9 | 1.9% | View All 19 Rows |
Immigrants in Preston Potter Hollow
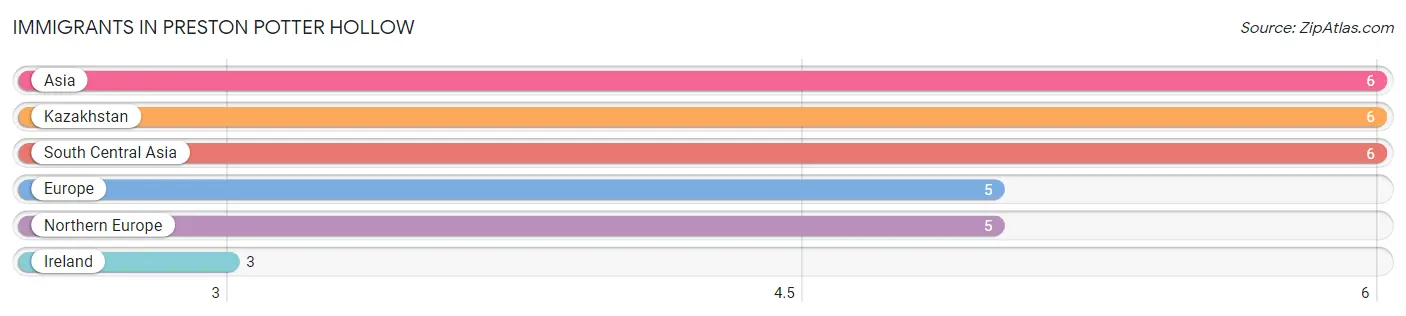
The most numerous immigrant groups reported in Preston Potter Hollow came from Asia (6 | 1.3%), Kazakhstan (6 | 1.3%), South Central Asia (6 | 1.3%), Europe (5 | 1.1%), and Northern Europe (5 | 1.1%), together accounting for 6.0% of all Preston Potter Hollow residents.
| Immigration Origin | # Population | % Population |
| Asia | 6 | 1.3% |
| Europe | 5 | 1.1% |
| Ireland | 3 | 0.6% |
| Kazakhstan | 6 | 1.3% |
| Northern Europe | 5 | 1.1% |
| South Central Asia | 6 | 1.3% | View All 6 Rows |
Sex and Age in Preston Potter Hollow
Sex and Age in Preston Potter Hollow
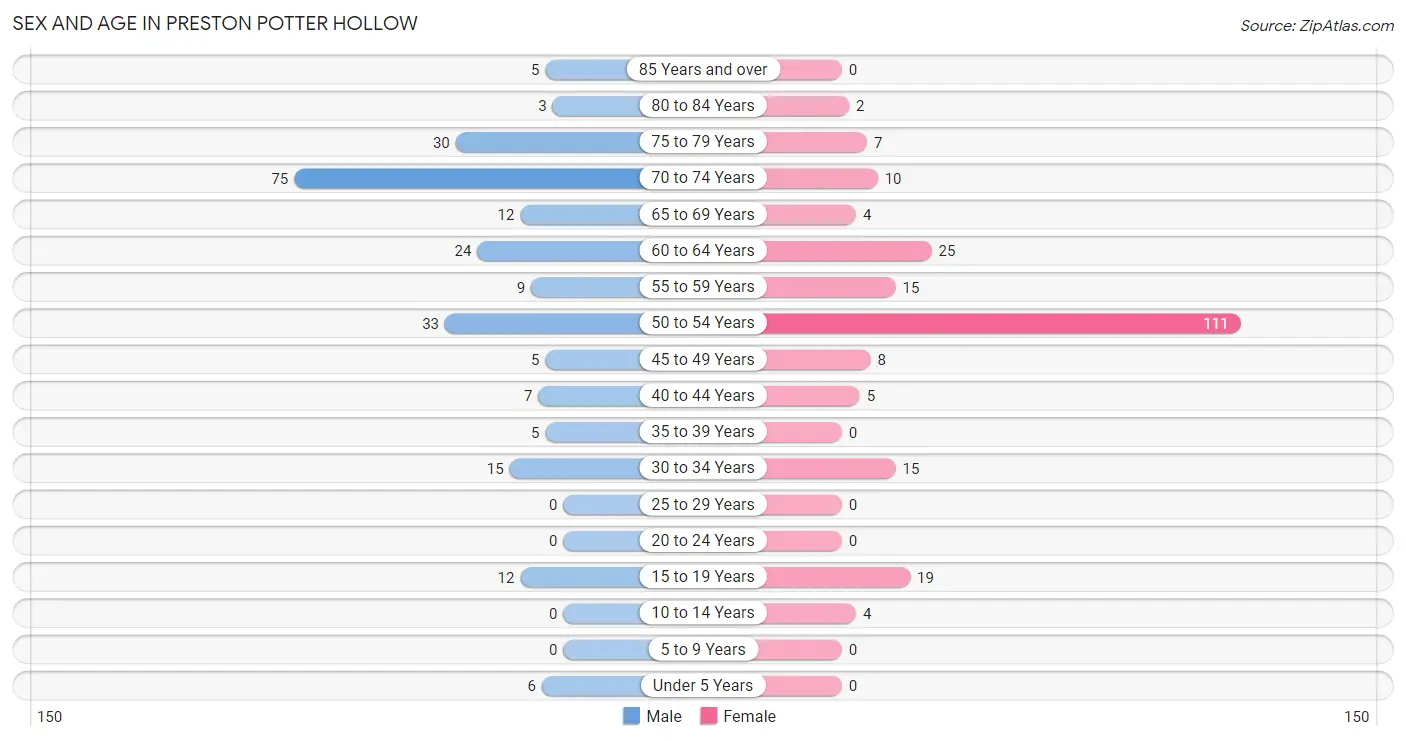
The most populous age groups in Preston Potter Hollow are 70 to 74 Years (75 | 31.1%) for men and 50 to 54 Years (111 | 49.3%) for women.
| Age Bracket | Male | Female |
| Under 5 Years | 6 (2.5%) | 0 (0.0%) |
| 5 to 9 Years | 0 (0.0%) | 0 (0.0%) |
| 10 to 14 Years | 0 (0.0%) | 4 (1.8%) |
| 15 to 19 Years | 12 (5.0%) | 19 (8.4%) |
| 20 to 24 Years | 0 (0.0%) | 0 (0.0%) |
| 25 to 29 Years | 0 (0.0%) | 0 (0.0%) |
| 30 to 34 Years | 15 (6.2%) | 15 (6.7%) |
| 35 to 39 Years | 5 (2.1%) | 0 (0.0%) |
| 40 to 44 Years | 7 (2.9%) | 5 (2.2%) |
| 45 to 49 Years | 5 (2.1%) | 8 (3.6%) |
| 50 to 54 Years | 33 (13.7%) | 111 (49.3%) |
| 55 to 59 Years | 9 (3.7%) | 15 (6.7%) |
| 60 to 64 Years | 24 (10.0%) | 25 (11.1%) |
| 65 to 69 Years | 12 (5.0%) | 4 (1.8%) |
| 70 to 74 Years | 75 (31.1%) | 10 (4.4%) |
| 75 to 79 Years | 30 (12.4%) | 7 (3.1%) |
| 80 to 84 Years | 3 (1.2%) | 2 (0.9%) |
| 85 Years and over | 5 (2.1%) | 0 (0.0%) |
| Total | 241 (100.0%) | 225 (100.0%) |
Families and Households in Preston Potter Hollow
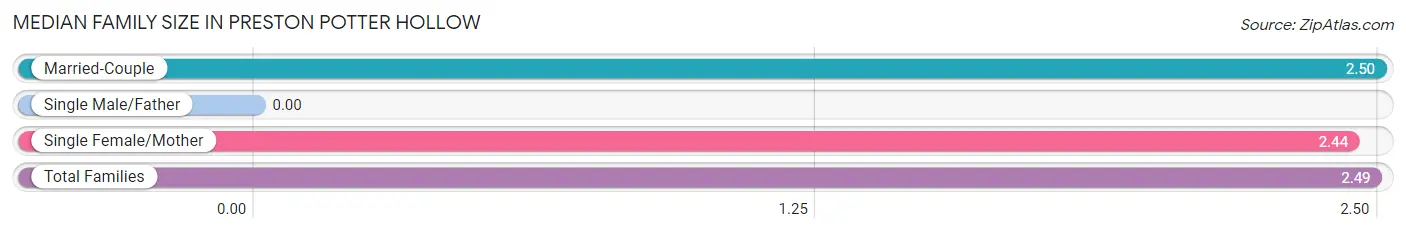
Median Family Size in Preston Potter Hollow
| Family Type | # Families | Family Size |
| Married-Couple | 78 (89.7%) | 2.50 |
| Single Male/Father | 0 (0.0%) | - |
| Single Female/Mother | 9 (10.3%) | 2.44 |
| Total Families | 87 (100.0%) | 2.49 |
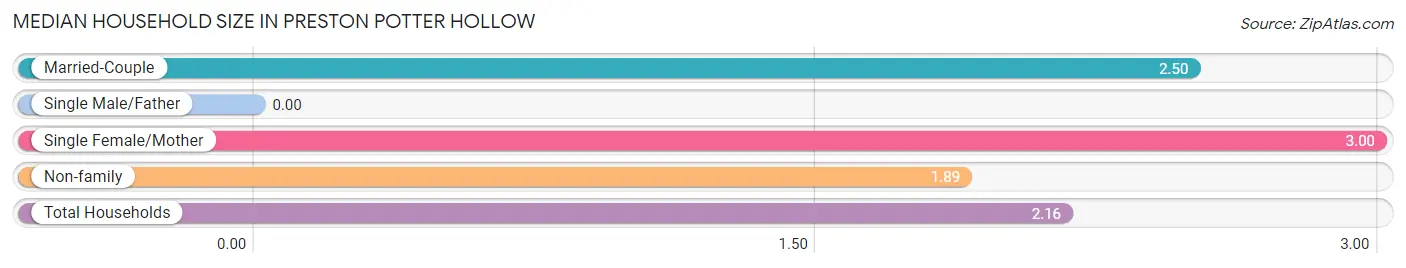
Median Household Size in Preston Potter Hollow
| Household Type | # Households | Household Size |
| Married-Couple | 78 (36.1%) | 2.50 |
| Single Male/Father | 0 (0.0%) | - |
| Single Female/Mother | 9 (4.2%) | 3.00 |
| Non-family | 129 (59.7%) | 1.89 |
| Total Households | 216 (100.0%) | 2.16 |
Household Size by Marriage Status in Preston Potter Hollow
Out of a total of 216 households in Preston Potter Hollow, 87 (40.3%) are family households, while 129 (59.7%) are nonfamily households. The most numerous type of family households are 2-person households, comprising 57, and the most common type of nonfamily households are 2-person households, comprising 90.
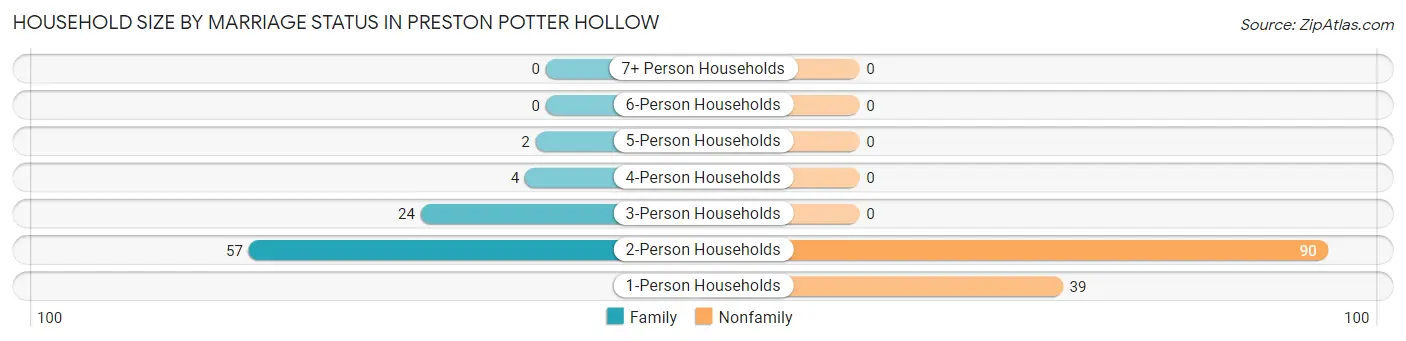
| Household Size | Family Households | Nonfamily Households |
| 1-Person Households | - | 39 (18.1%) |
| 2-Person Households | 57 (26.4%) | 90 (41.7%) |
| 3-Person Households | 24 (11.1%) | 0 (0.0%) |
| 4-Person Households | 4 (1.8%) | 0 (0.0%) |
| 5-Person Households | 2 (0.9%) | 0 (0.0%) |
| 6-Person Households | 0 (0.0%) | 0 (0.0%) |
| 7+ Person Households | 0 (0.0%) | 0 (0.0%) |
| Total | 87 (40.3%) | 129 (59.7%) |
Female Fertility in Preston Potter Hollow
Fertility by Age in Preston Potter Hollow
Average fertility rate in Preston Potter Hollow is 143.0 births per 1,000 women. Women in the age bracket of 20 to 34 years have the highest fertility rate with 467.0 births per 1,000 women. Women in the age bracket of 20 to 34 years acount for 100.0% of all women with births.
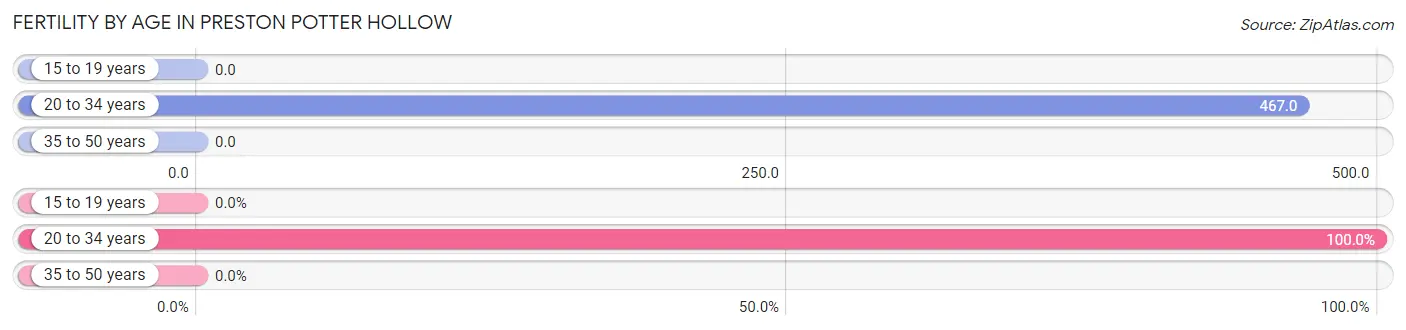
| Age Bracket | Women with Births | Births / 1,000 Women |
| 15 to 19 years | 0 (0.0%) | 0.0 |
| 20 to 34 years | 7 (100.0%) | 467.0 |
| 35 to 50 years | 0 (0.0%) | 0.0 |
| Total | 7 (100.0%) | 143.0 |
Fertility by Age by Marriage Status in Preston Potter Hollow
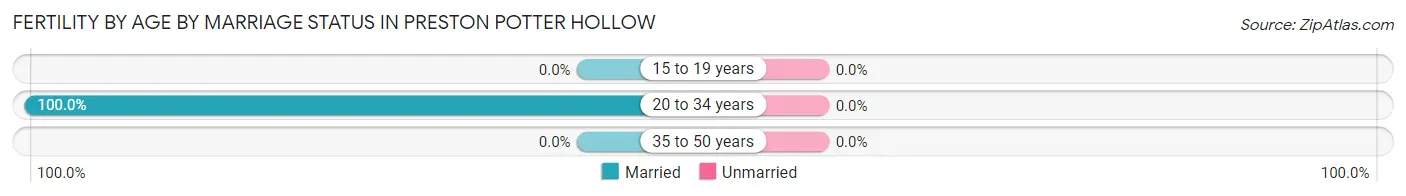
| Age Bracket | Married | Unmarried |
| 15 to 19 years | 0 (0.0%) | 0 (0.0%) |
| 20 to 34 years | 7 (100.0%) | 0 (0.0%) |
| 35 to 50 years | 0 (0.0%) | 0 (0.0%) |
| Total | 7 (100.0%) | 0 (0.0%) |
Fertility by Education in Preston Potter Hollow
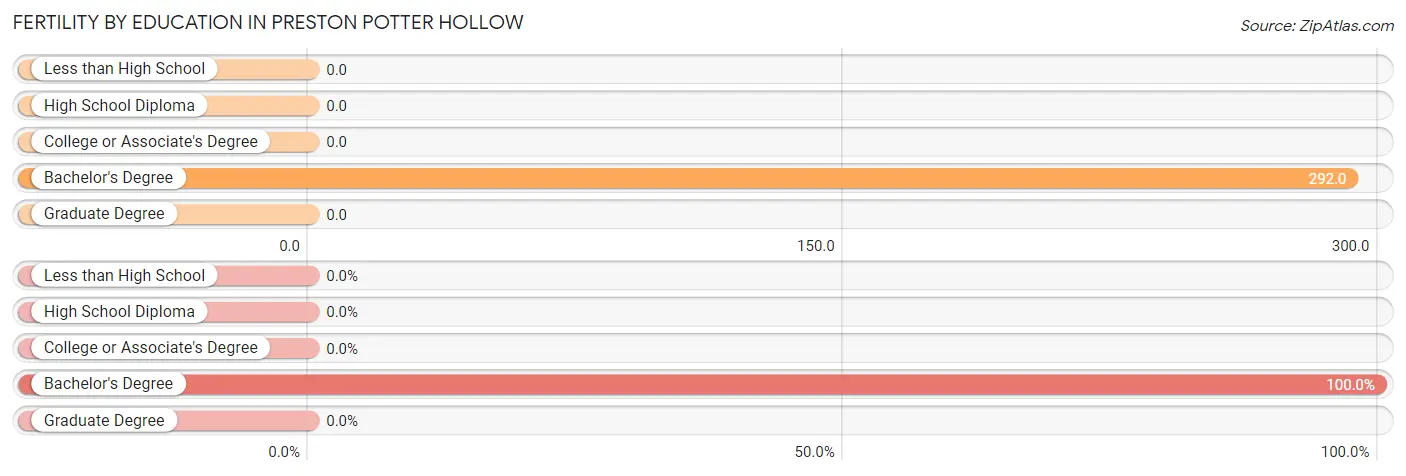
| Educational Attainment | Women with Births | Births / 1,000 Women |
| Less than High School | 0 (0.0%) | 0.0 |
| High School Diploma | 0 (0.0%) | 0.0 |
| College or Associate's Degree | 0 (0.0%) | 0.0 |
| Bachelor's Degree | 7 (100.0%) | 292.0 |
| Graduate Degree | 0 (0.0%) | 0.0 |
| Total | 7 (100.0%) | 143.0 |
Fertility by Education by Marriage Status in Preston Potter Hollow
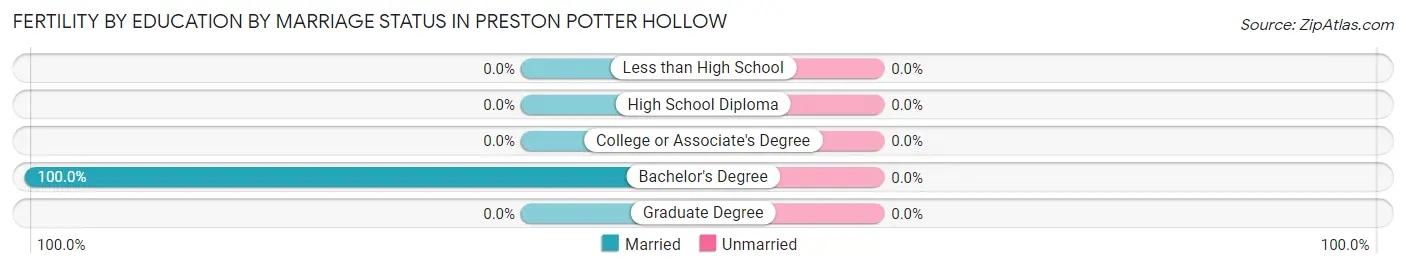
| Educational Attainment | Married | Unmarried |
| Less than High School | 0 (0.0%) | 0 (0.0%) |
| High School Diploma | 0 (0.0%) | 0 (0.0%) |
| College or Associate's Degree | 0 (0.0%) | 0 (0.0%) |
| Bachelor's Degree | 7 (100.0%) | 0 (0.0%) |
| Graduate Degree | 0 (0.0%) | 0 (0.0%) |
| Total | 7 (100.0%) | 0 (0.0%) |
Employment Characteristics in Preston Potter Hollow
Employment by Class of Employer in Preston Potter Hollow
Among the 227 employed individuals in Preston Potter Hollow, private company employees (184 | 81.1%), self-employed (incorporated) (17 | 7.5%), and self-employed (not incorporated) (10 | 4.4%) make up the most common classes of employment.
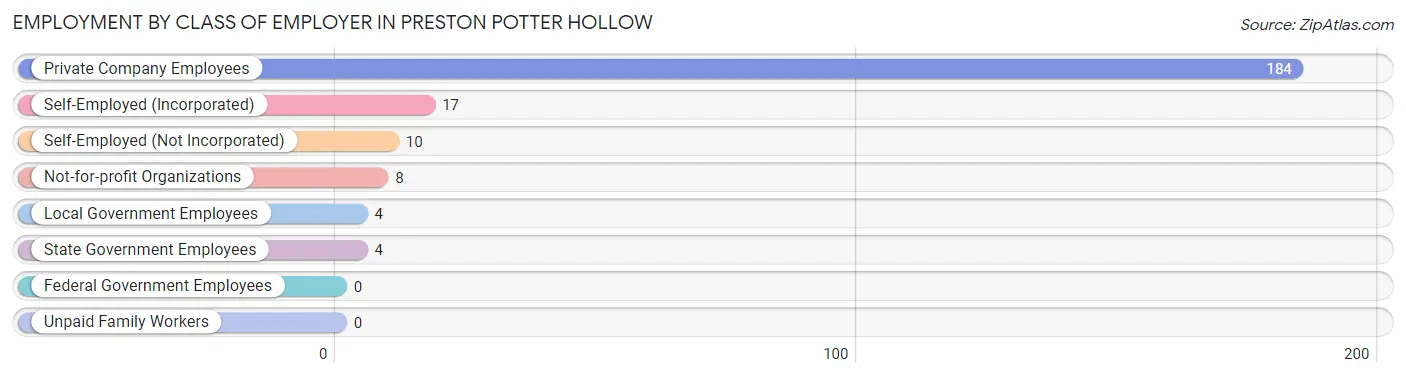
| Employer Class | # Employees | % Employees |
| Private Company Employees | 184 | 81.1% |
| Self-Employed (Incorporated) | 17 | 7.5% |
| Self-Employed (Not Incorporated) | 10 | 4.4% |
| Not-for-profit Organizations | 8 | 3.5% |
| Local Government Employees | 4 | 1.8% |
| State Government Employees | 4 | 1.8% |
| Federal Government Employees | 0 | 0.0% |
| Unpaid Family Workers | 0 | 0.0% |
| Total | 227 | 100.0% |
Employment Status by Age in Preston Potter Hollow
According to the labor force statistics for Preston Potter Hollow, out of the total population over 16 years of age (450), 53.1% or 239 individuals are in the labor force, with 5.0% or 12 of them unemployed. The age group with the highest labor force participation rate is 30 to 34 years, with 100.0% or 30 individuals in the labor force. Within the labor force, the 35 to 44 years age range has the highest percentage of unemployed individuals, with 58.3% or 7 of them being unemployed.
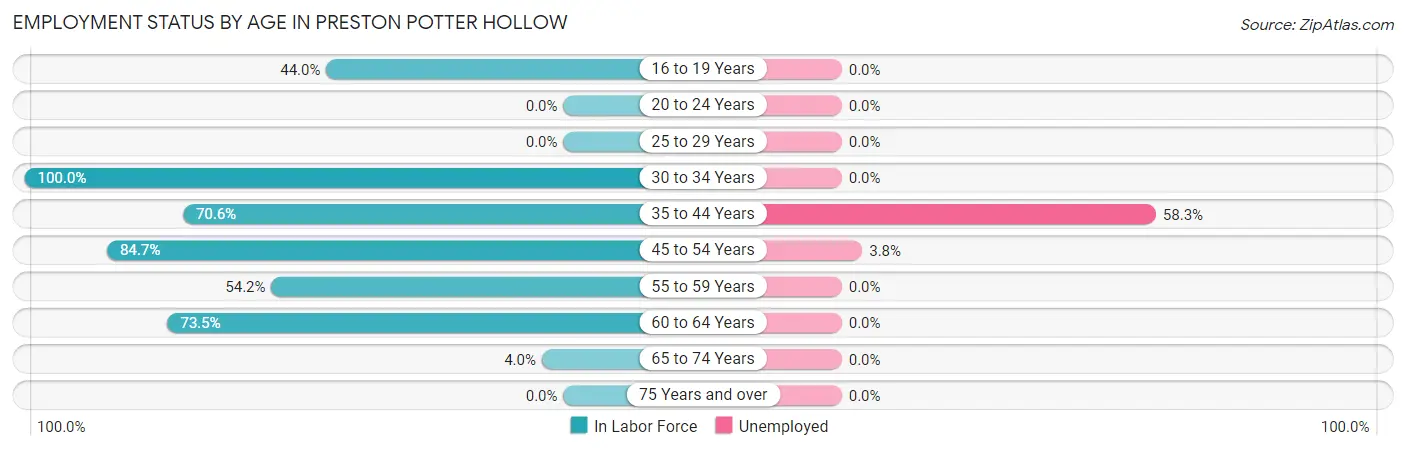
| Age Bracket | In Labor Force | Unemployed |
| 16 to 19 Years | 11 (44.0%) | 0 (0.0%) |
| 20 to 24 Years | 0 (0.0%) | 0 (0.0%) |
| 25 to 29 Years | 0 (0.0%) | 0 (0.0%) |
| 30 to 34 Years | 30 (100.0%) | 0 (0.0%) |
| 35 to 44 Years | 12 (70.6%) | 7 (58.3%) |
| 45 to 54 Years | 133 (84.7%) | 5 (3.8%) |
| 55 to 59 Years | 13 (54.2%) | 0 (0.0%) |
| 60 to 64 Years | 36 (73.5%) | 0 (0.0%) |
| 65 to 74 Years | 4 (4.0%) | 0 (0.0%) |
| 75 Years and over | 0 (0.0%) | 0 (0.0%) |
| Total | 239 (53.1%) | 12 (5.0%) |
Employment Status by Educational Attainment in Preston Potter Hollow
According to labor force statistics for Preston Potter Hollow, 80.9% of individuals (224) out of the total population between 25 and 64 years of age (277) are in the labor force, with 5.4% or 12 of them being unemployed. The group with the highest labor force participation rate are those with the educational attainment of college / associate degree, with 91.8% or 56 individuals in the labor force. Within the labor force, individuals with college / associate degree education have the highest percentage of unemployment, with 21.4% or 12 of them being unemployed.
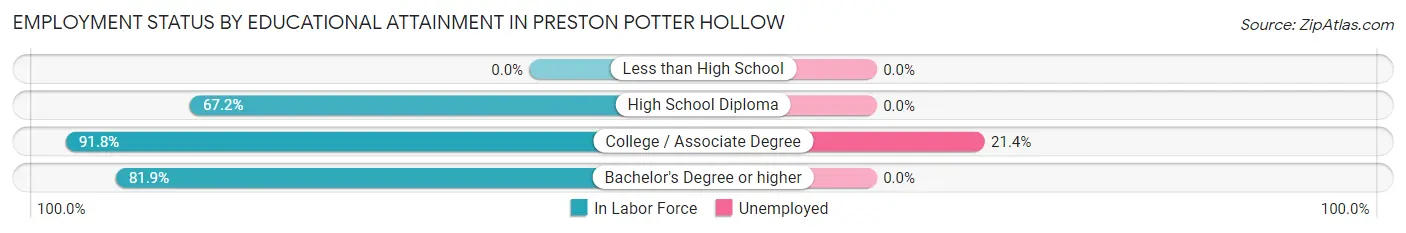
| Educational Attainment | In Labor Force | Unemployed |
| Less than High School | 0 (0.0%) | 0 (0.0%) |
| High School Diploma | 41 (67.2%) | 0 (0.0%) |
| College / Associate Degree | 56 (91.8%) | 13 (21.4%) |
| Bachelor's Degree or higher | 127 (81.9%) | 0 (0.0%) |
| Total | 224 (80.9%) | 15 (5.4%) |
Employment Occupations by Sex in Preston Potter Hollow
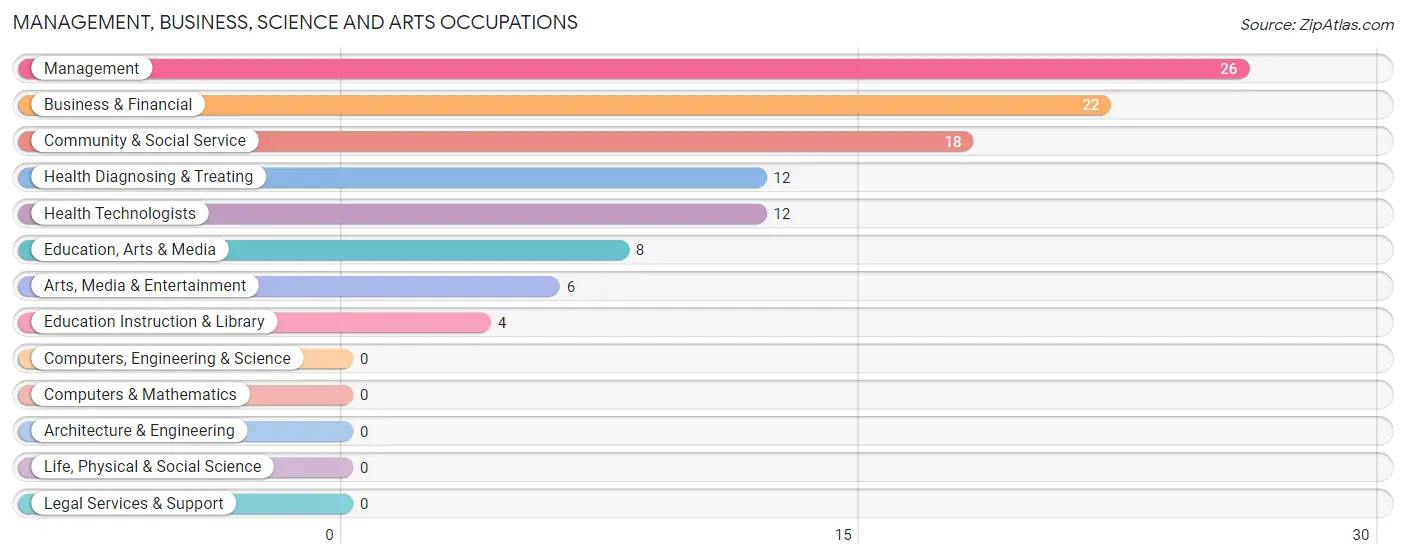
Management, Business, Science and Arts Occupations
The most common Management, Business, Science and Arts occupations in Preston Potter Hollow are Management (26 | 11.5%), Business & Financial (22 | 9.7%), Community & Social Service (18 | 7.9%), Health Diagnosing & Treating (12 | 5.3%), and Health Technologists (12 | 5.3%).
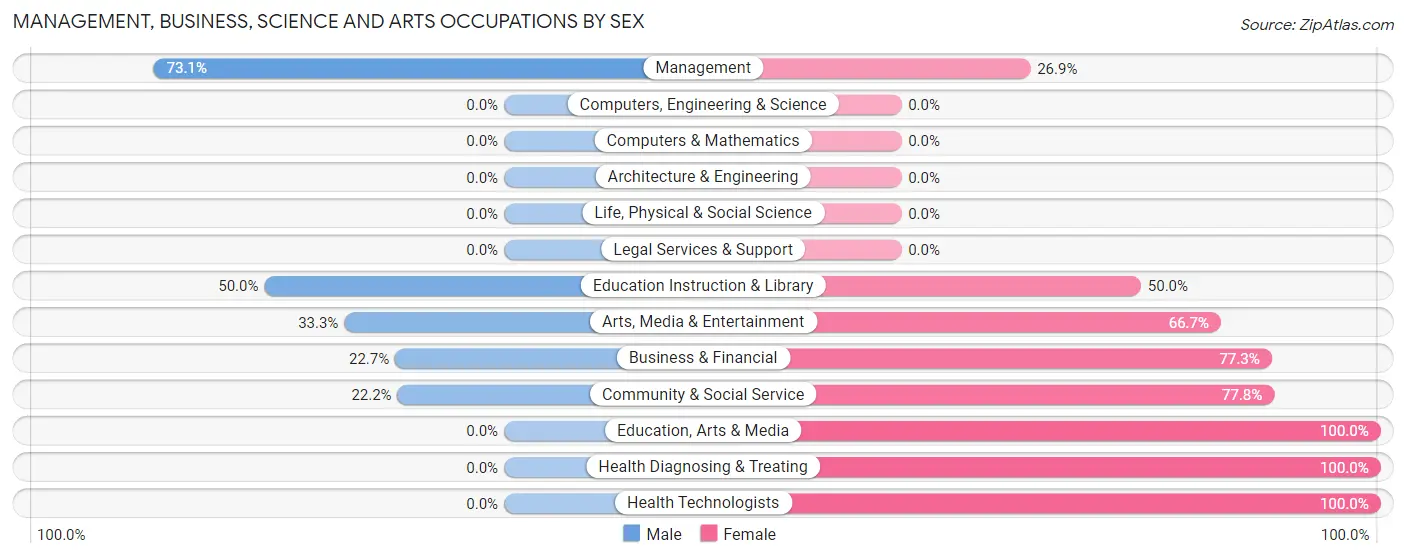
Management, Business, Science and Arts Occupations by Sex
Within the Management, Business, Science and Arts occupations in Preston Potter Hollow, the most male-oriented occupations are Management (73.1%), Education Instruction & Library (50.0%), and Arts, Media & Entertainment (33.3%), while the most female-oriented occupations are Education, Arts & Media (100.0%), Health Diagnosing & Treating (100.0%), and Health Technologists (100.0%).
| Occupation | Male | Female |
| Management | 19 (73.1%) | 7 (26.9%) |
| Business & Financial | 5 (22.7%) | 17 (77.3%) |
| Computers, Engineering & Science | 0 (0.0%) | 0 (0.0%) |
| Computers & Mathematics | 0 (0.0%) | 0 (0.0%) |
| Architecture & Engineering | 0 (0.0%) | 0 (0.0%) |
| Life, Physical & Social Science | 0 (0.0%) | 0 (0.0%) |
| Community & Social Service | 4 (22.2%) | 14 (77.8%) |
| Education, Arts & Media | 0 (0.0%) | 8 (100.0%) |
| Legal Services & Support | 0 (0.0%) | 0 (0.0%) |
| Education Instruction & Library | 2 (50.0%) | 2 (50.0%) |
| Arts, Media & Entertainment | 2 (33.3%) | 4 (66.7%) |
| Health Diagnosing & Treating | 0 (0.0%) | 12 (100.0%) |
| Health Technologists | 0 (0.0%) | 12 (100.0%) |
| Total (Category) | 28 (35.9%) | 50 (64.1%) |
| Total (Overall) | 59 (26.0%) | 168 (74.0%) |
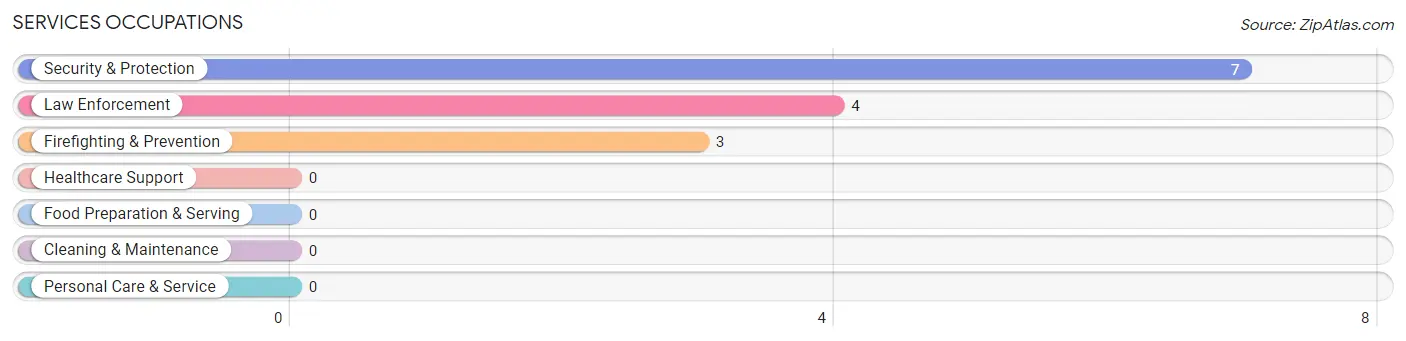
Services Occupations
The most common Services occupations in Preston Potter Hollow are Security & Protection (7 | 3.1%), Law Enforcement (4 | 1.8%), and Firefighting & Prevention (3 | 1.3%).
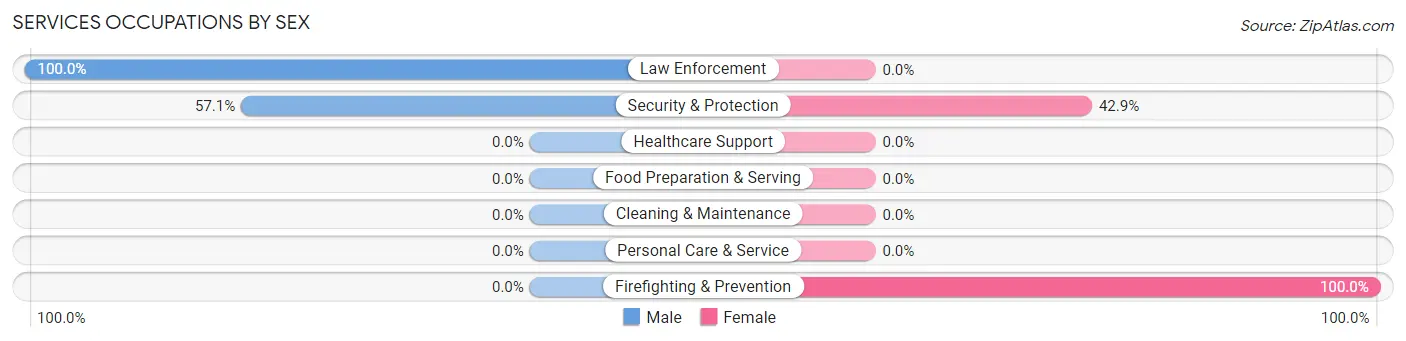
Services Occupations by Sex
Within the Services occupations in Preston Potter Hollow, the most male-oriented occupations are Law Enforcement (100.0%), and Security & Protection (57.1%), while the most female-oriented occupations are Firefighting & Prevention (100.0%), and Security & Protection (42.9%).
| Occupation | Male | Female |
| Healthcare Support | 0 (0.0%) | 0 (0.0%) |
| Security & Protection | 4 (57.1%) | 3 (42.9%) |
| Firefighting & Prevention | 0 (0.0%) | 3 (100.0%) |
| Law Enforcement | 4 (100.0%) | 0 (0.0%) |
| Food Preparation & Serving | 0 (0.0%) | 0 (0.0%) |
| Cleaning & Maintenance | 0 (0.0%) | 0 (0.0%) |
| Personal Care & Service | 0 (0.0%) | 0 (0.0%) |
| Total (Category) | 4 (57.1%) | 3 (42.9%) |
| Total (Overall) | 59 (26.0%) | 168 (74.0%) |
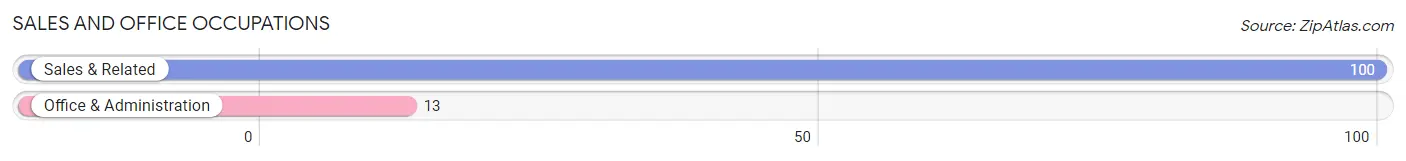
Sales and Office Occupations
The most common Sales and Office occupations in Preston Potter Hollow are Sales & Related (100 | 44.1%), and Office & Administration (13 | 5.7%).
Sales and Office Occupations by Sex
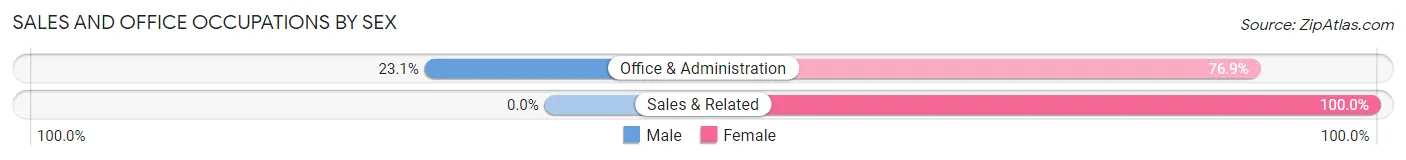
| Occupation | Male | Female |
| Sales & Related | 0 (0.0%) | 100 (100.0%) |
| Office & Administration | 3 (23.1%) | 10 (76.9%) |
| Total (Category) | 3 (2.6%) | 110 (97.4%) |
| Total (Overall) | 59 (26.0%) | 168 (74.0%) |
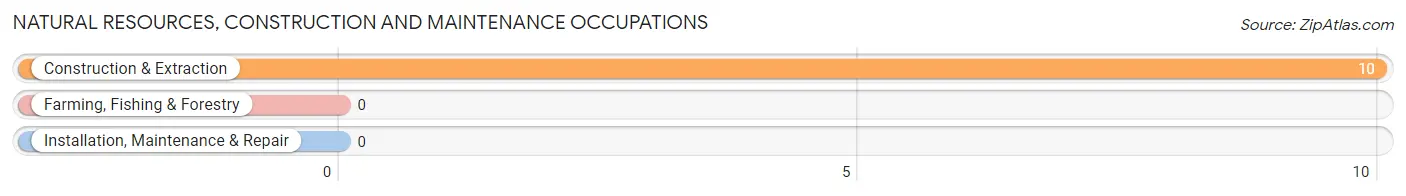
Natural Resources, Construction and Maintenance Occupations
The most common Natural Resources, Construction and Maintenance occupations in Preston Potter Hollow are , and Construction & Extraction (10 | 4.4%).
Natural Resources, Construction and Maintenance Occupations by Sex
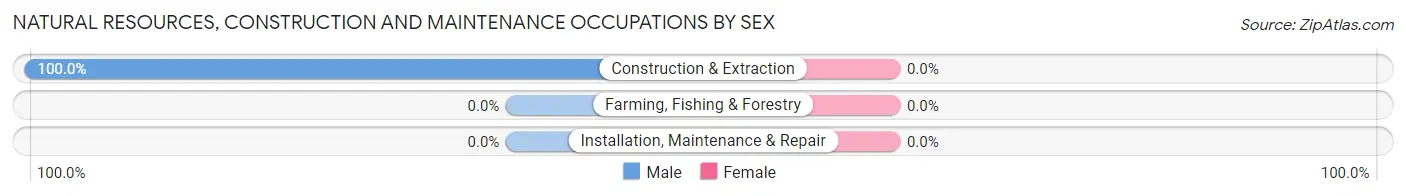
| Occupation | Male | Female |
| Farming, Fishing & Forestry | 0 (0.0%) | 0 (0.0%) |
| Construction & Extraction | 10 (100.0%) | 0 (0.0%) |
| Installation, Maintenance & Repair | 0 (0.0%) | 0 (0.0%) |
| Total (Category) | 10 (100.0%) | 0 (0.0%) |
| Total (Overall) | 59 (26.0%) | 168 (74.0%) |
Production, Transportation and Moving Occupations
The most common Production, Transportation and Moving occupations in Preston Potter Hollow are Material Moving (12 | 5.3%), and Production (7 | 3.1%).
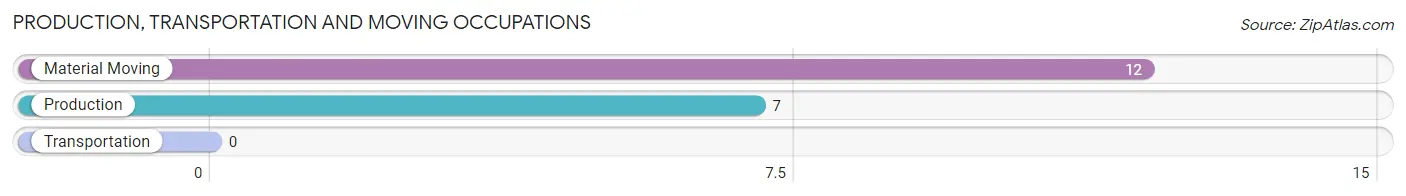
Production, Transportation and Moving Occupations by Sex
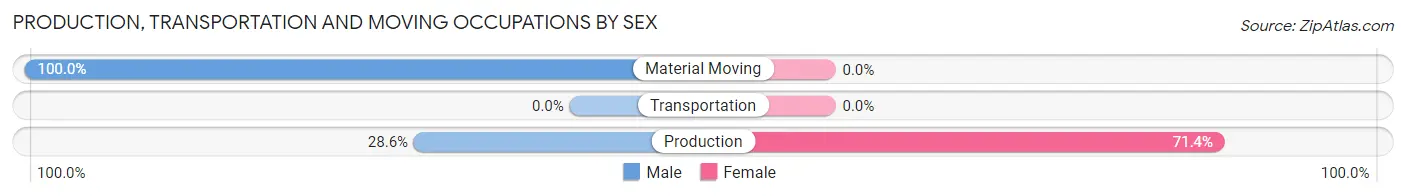
| Occupation | Male | Female |
| Production | 2 (28.6%) | 5 (71.4%) |
| Transportation | 0 (0.0%) | 0 (0.0%) |
| Material Moving | 12 (100.0%) | 0 (0.0%) |
| Total (Category) | 14 (73.7%) | 5 (26.3%) |
| Total (Overall) | 59 (26.0%) | 168 (74.0%) |
Employment Industries by Sex in Preston Potter Hollow
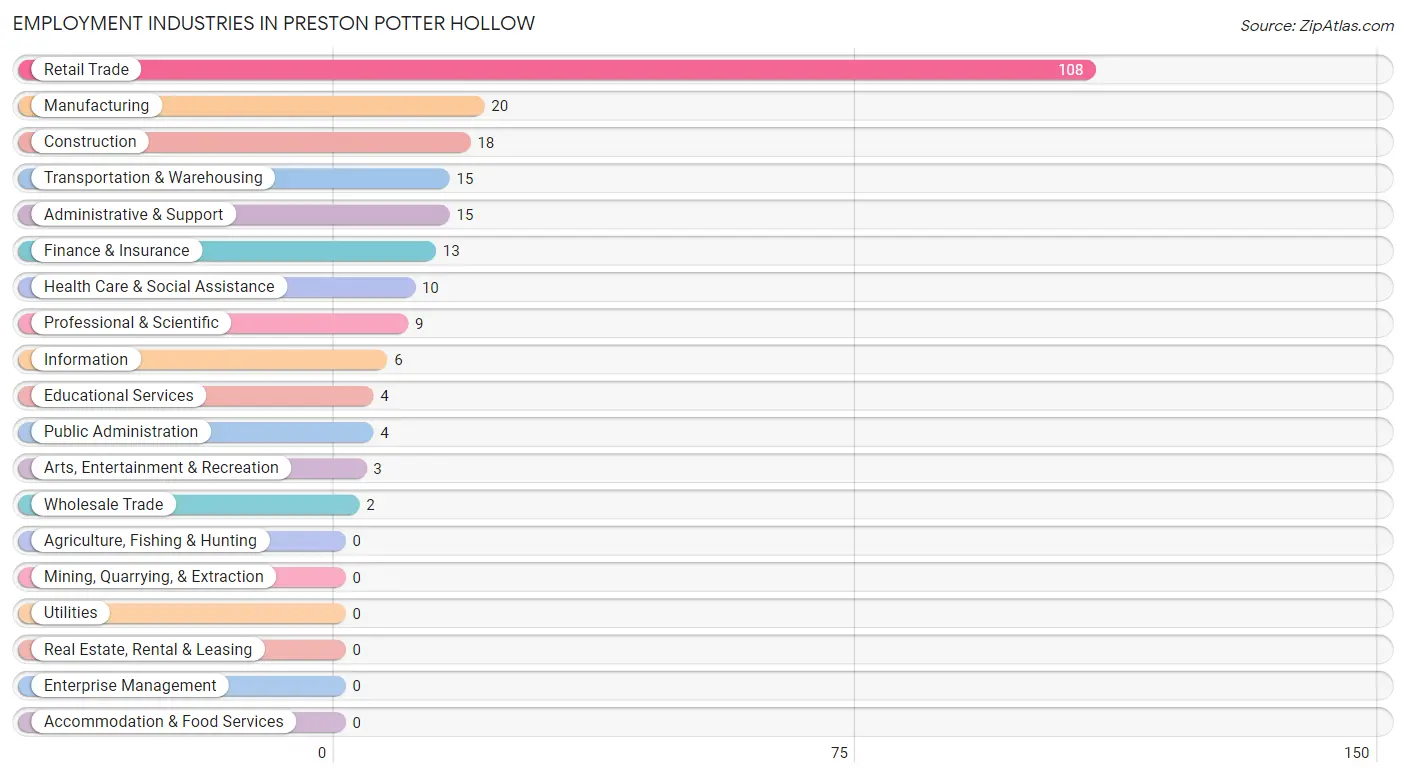
Employment Industries in Preston Potter Hollow
The major employment industries in Preston Potter Hollow include Retail Trade (108 | 47.6%), Manufacturing (20 | 8.8%), Construction (18 | 7.9%), Transportation & Warehousing (15 | 6.6%), and Administrative & Support (15 | 6.6%).
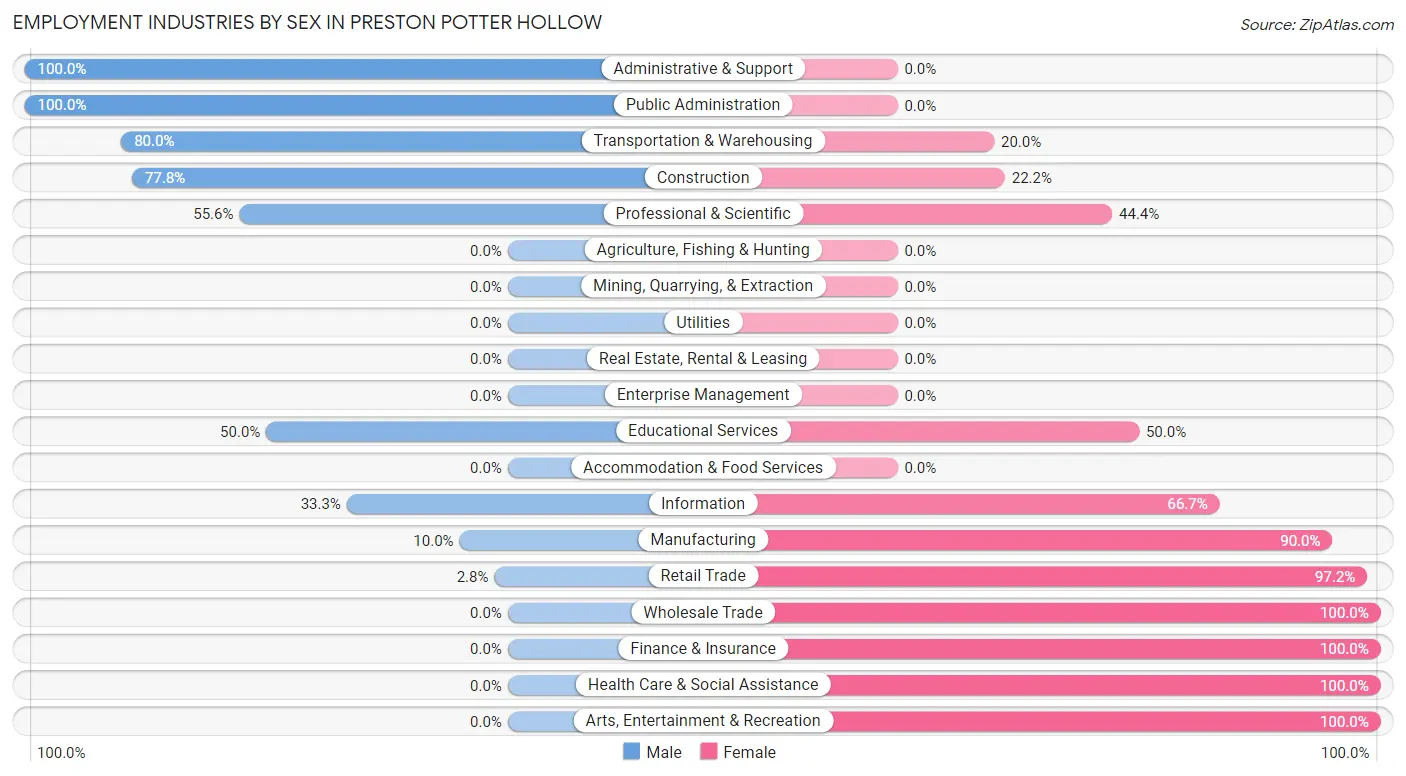
Employment Industries by Sex in Preston Potter Hollow
The Preston Potter Hollow industries that see more men than women are Administrative & Support (100.0%), Public Administration (100.0%), and Transportation & Warehousing (80.0%), whereas the industries that tend to have a higher number of women are Wholesale Trade (100.0%), Finance & Insurance (100.0%), and Health Care & Social Assistance (100.0%).
| Industry | Male | Female |
| Agriculture, Fishing & Hunting | 0 (0.0%) | 0 (0.0%) |
| Mining, Quarrying, & Extraction | 0 (0.0%) | 0 (0.0%) |
| Construction | 14 (77.8%) | 4 (22.2%) |
| Manufacturing | 2 (10.0%) | 18 (90.0%) |
| Wholesale Trade | 0 (0.0%) | 2 (100.0%) |
| Retail Trade | 3 (2.8%) | 105 (97.2%) |
| Transportation & Warehousing | 12 (80.0%) | 3 (20.0%) |
| Utilities | 0 (0.0%) | 0 (0.0%) |
| Information | 2 (33.3%) | 4 (66.7%) |
| Finance & Insurance | 0 (0.0%) | 13 (100.0%) |
| Real Estate, Rental & Leasing | 0 (0.0%) | 0 (0.0%) |
| Professional & Scientific | 5 (55.6%) | 4 (44.4%) |
| Enterprise Management | 0 (0.0%) | 0 (0.0%) |
| Administrative & Support | 15 (100.0%) | 0 (0.0%) |
| Educational Services | 2 (50.0%) | 2 (50.0%) |
| Health Care & Social Assistance | 0 (0.0%) | 10 (100.0%) |
| Arts, Entertainment & Recreation | 0 (0.0%) | 3 (100.0%) |
| Accommodation & Food Services | 0 (0.0%) | 0 (0.0%) |
| Public Administration | 4 (100.0%) | 0 (0.0%) |
| Total | 59 (26.0%) | 168 (74.0%) |
Education in Preston Potter Hollow
School Enrollment in Preston Potter Hollow
The most common levels of schooling among the 37 students in Preston Potter Hollow are high school (25 | 67.6%), college / undergraduate (6 | 16.2%), and middle school (4 | 10.8%).
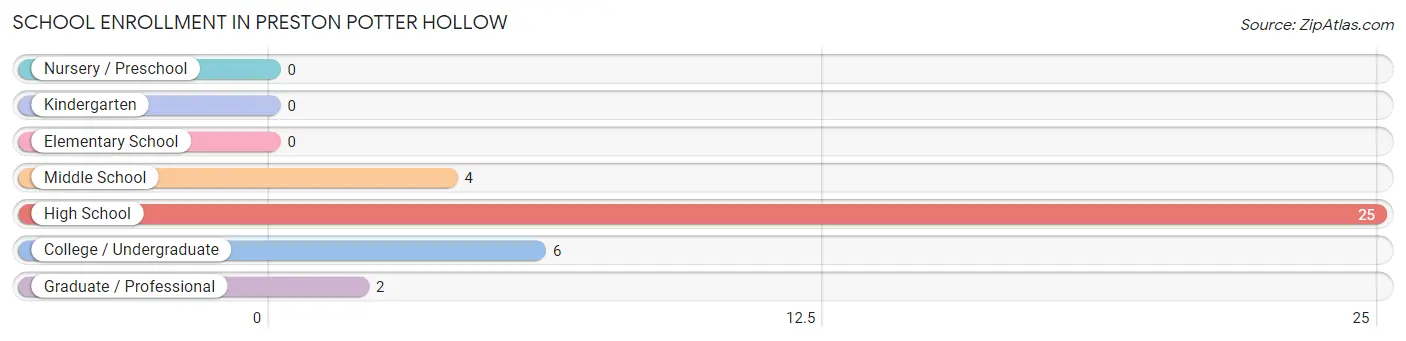
| School Level | # Students | % Students |
| Nursery / Preschool | 0 | 0.0% |
| Kindergarten | 0 | 0.0% |
| Elementary School | 0 | 0.0% |
| Middle School | 4 | 10.8% |
| High School | 25 | 67.6% |
| College / Undergraduate | 6 | 16.2% |
| Graduate / Professional | 2 | 5.4% |
| Total | 37 | 100.0% |
School Enrollment by Age by Funding Source in Preston Potter Hollow
Out of a total of 37 students who are enrolled in schools in Preston Potter Hollow, 6 (16.2%) attend a private institution, while the remaining 31 (83.8%) are enrolled in public schools. The age group of 15 to 17 year olds has the highest likelihood of being enrolled in private schools, with 6 (24.0% in the age bracket) enrolled. Conversely, the age group of 10 to 14 year olds has the lowest likelihood of being enrolled in a private school, with 4 (100.0% in the age bracket) attending a public institution.
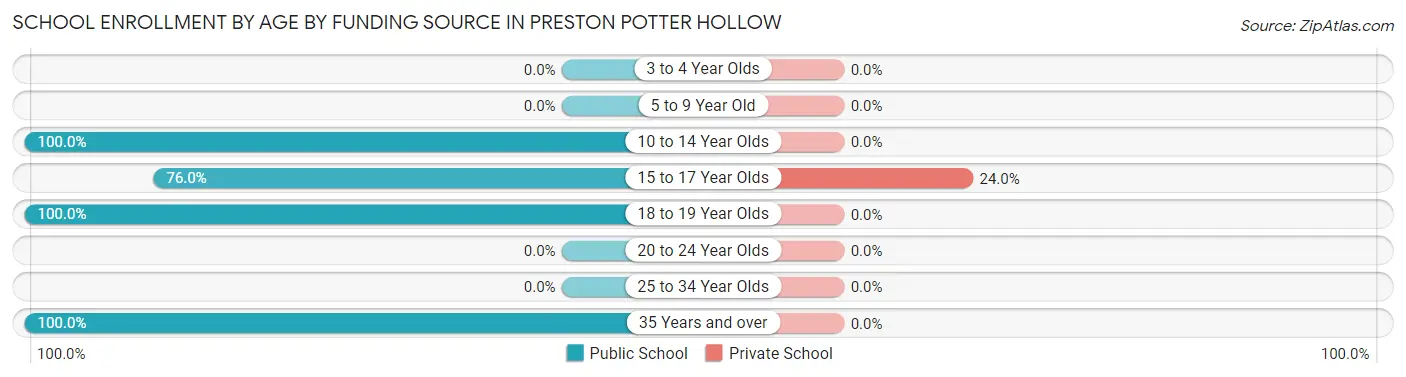
| Age Bracket | Public School | Private School |
| 3 to 4 Year Olds | 0 (0.0%) | 0 (0.0%) |
| 5 to 9 Year Old | 0 (0.0%) | 0 (0.0%) |
| 10 to 14 Year Olds | 4 (100.0%) | 0 (0.0%) |
| 15 to 17 Year Olds | 19 (76.0%) | 6 (24.0%) |
| 18 to 19 Year Olds | 6 (100.0%) | 0 (0.0%) |
| 20 to 24 Year Olds | 0 (0.0%) | 0 (0.0%) |
| 25 to 34 Year Olds | 0 (0.0%) | 0 (0.0%) |
| 35 Years and over | 2 (100.0%) | 0 (0.0%) |
| Total | 31 (83.8%) | 6 (16.2%) |
Educational Attainment by Field of Study in Preston Potter Hollow
Education (112 | 59.0%), business (27 | 14.2%), arts & humanities (15 | 7.9%), visual & performing arts (10 | 5.3%), and social sciences (5 | 2.6%) are the most common fields of study among 190 individuals in Preston Potter Hollow who have obtained a bachelor's degree or higher.
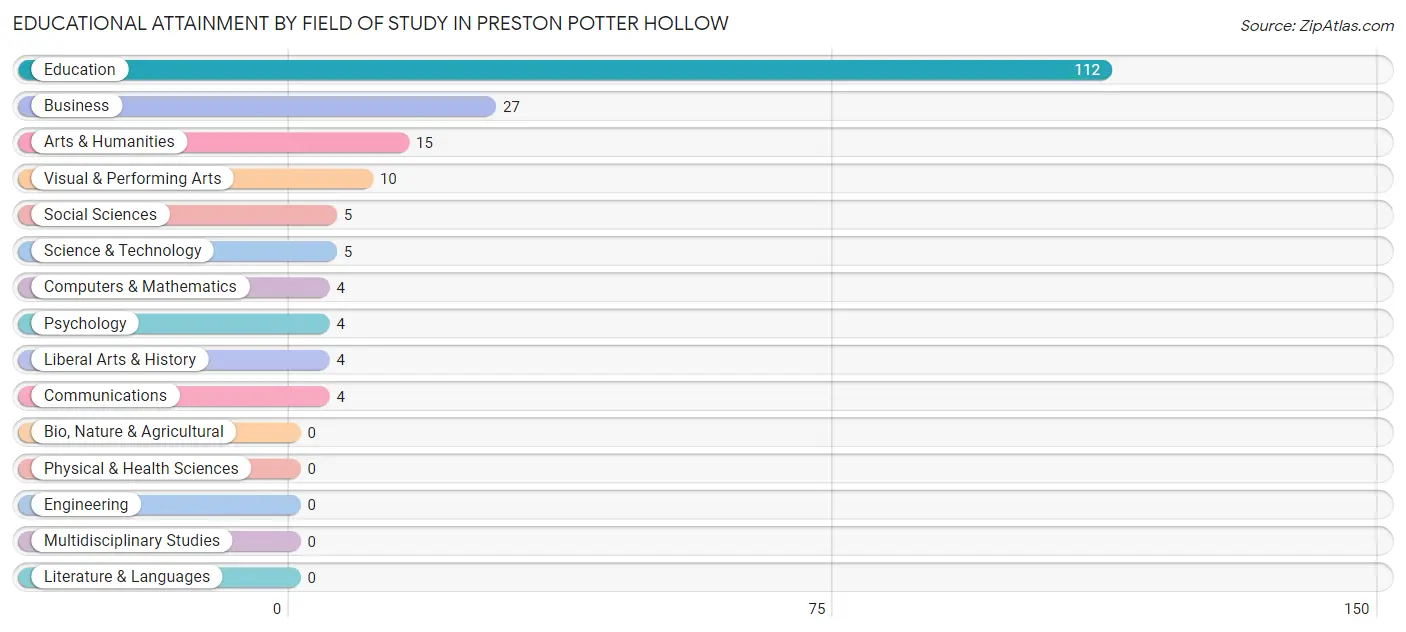
| Field of Study | # Graduates | % Graduates |
| Computers & Mathematics | 4 | 2.1% |
| Bio, Nature & Agricultural | 0 | 0.0% |
| Physical & Health Sciences | 0 | 0.0% |
| Psychology | 4 | 2.1% |
| Social Sciences | 5 | 2.6% |
| Engineering | 0 | 0.0% |
| Multidisciplinary Studies | 0 | 0.0% |
| Science & Technology | 5 | 2.6% |
| Business | 27 | 14.2% |
| Education | 112 | 59.0% |
| Literature & Languages | 0 | 0.0% |
| Liberal Arts & History | 4 | 2.1% |
| Visual & Performing Arts | 10 | 5.3% |
| Communications | 4 | 2.1% |
| Arts & Humanities | 15 | 7.9% |
| Total | 190 | 100.0% |
Transportation & Commute in Preston Potter Hollow
Vehicle Availability by Sex in Preston Potter Hollow
The most prevalent vehicle ownership categories in Preston Potter Hollow are males with 2 vehicles (28, accounting for 47.5%) and females with 2 vehicles (122, making up 16.7%).
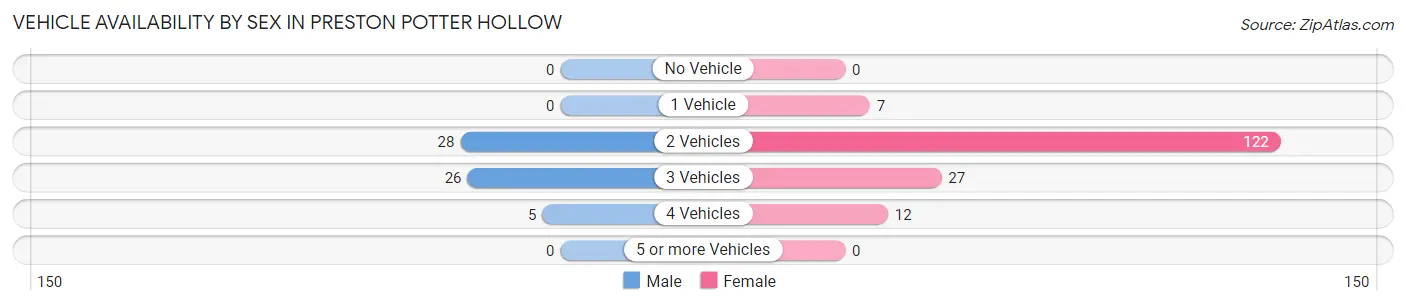
| Vehicles Available | Male | Female |
| No Vehicle | 0 (0.0%) | 0 (0.0%) |
| 1 Vehicle | 0 (0.0%) | 7 (4.2%) |
| 2 Vehicles | 28 (47.5%) | 122 (72.6%) |
| 3 Vehicles | 26 (44.1%) | 27 (16.1%) |
| 4 Vehicles | 5 (8.5%) | 12 (7.1%) |
| 5 or more Vehicles | 0 (0.0%) | 0 (0.0%) |
| Total | 59 (100.0%) | 168 (100.0%) |
Commute Time in Preston Potter Hollow
The most frequently occuring commute durations in Preston Potter Hollow are 15 to 19 minutes (97 commuters, 49.2%), 60 to 89 minutes (26 commuters, 13.2%), and 45 to 59 minutes (17 commuters, 8.6%).
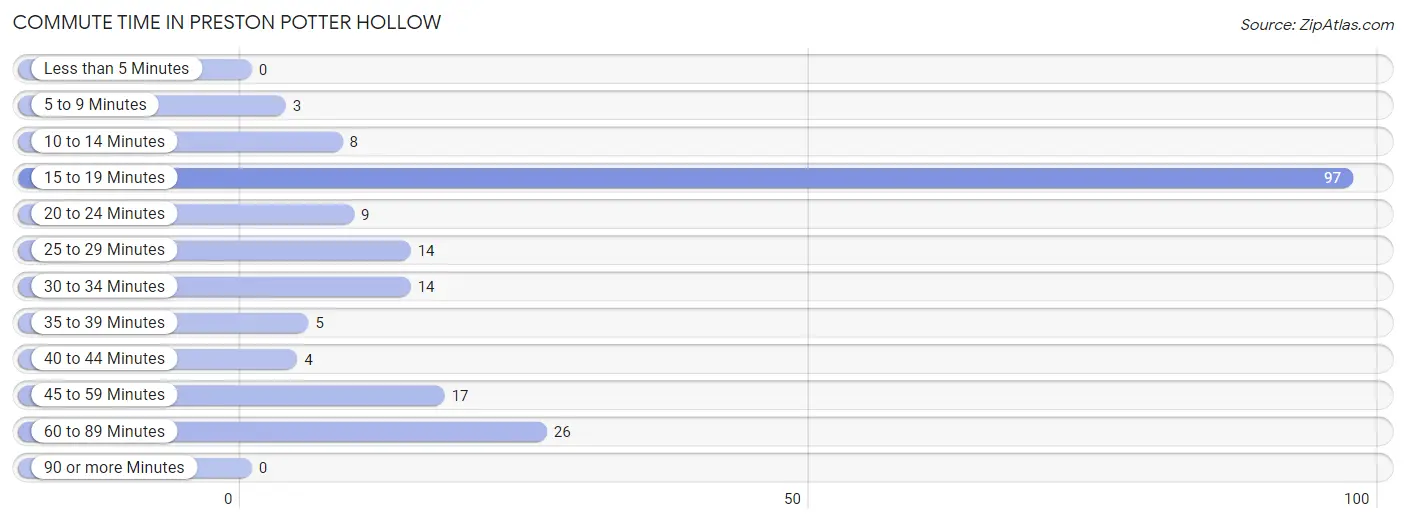
| Commute Time | # Commuters | % Commuters |
| Less than 5 Minutes | 0 | 0.0% |
| 5 to 9 Minutes | 3 | 1.5% |
| 10 to 14 Minutes | 8 | 4.1% |
| 15 to 19 Minutes | 97 | 49.2% |
| 20 to 24 Minutes | 9 | 4.6% |
| 25 to 29 Minutes | 14 | 7.1% |
| 30 to 34 Minutes | 14 | 7.1% |
| 35 to 39 Minutes | 5 | 2.5% |
| 40 to 44 Minutes | 4 | 2.0% |
| 45 to 59 Minutes | 17 | 8.6% |
| 60 to 89 Minutes | 26 | 13.2% |
| 90 or more Minutes | 0 | 0.0% |
Commute Time by Sex in Preston Potter Hollow
The most common commute times in Preston Potter Hollow are 60 to 89 minutes (15 commuters, 26.3%) for males and 15 to 19 minutes (97 commuters, 69.3%) for females.
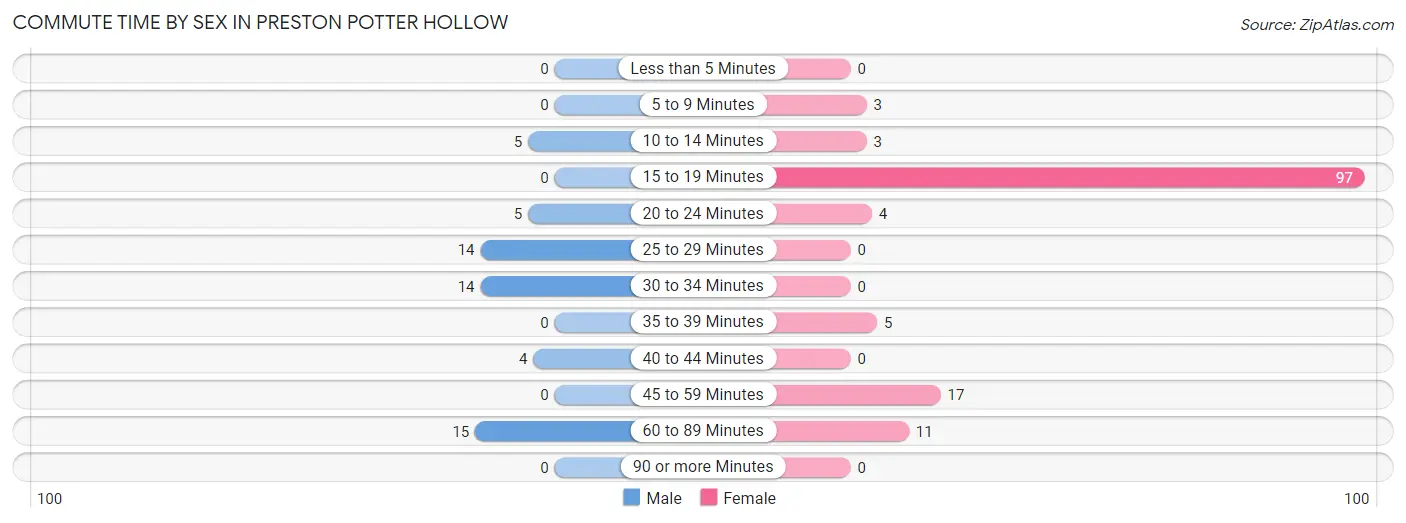
| Commute Time | Male | Female |
| Less than 5 Minutes | 0 (0.0%) | 0 (0.0%) |
| 5 to 9 Minutes | 0 (0.0%) | 3 (2.1%) |
| 10 to 14 Minutes | 5 (8.8%) | 3 (2.1%) |
| 15 to 19 Minutes | 0 (0.0%) | 97 (69.3%) |
| 20 to 24 Minutes | 5 (8.8%) | 4 (2.9%) |
| 25 to 29 Minutes | 14 (24.6%) | 0 (0.0%) |
| 30 to 34 Minutes | 14 (24.6%) | 0 (0.0%) |
| 35 to 39 Minutes | 0 (0.0%) | 5 (3.6%) |
| 40 to 44 Minutes | 4 (7.0%) | 0 (0.0%) |
| 45 to 59 Minutes | 0 (0.0%) | 17 (12.1%) |
| 60 to 89 Minutes | 15 (26.3%) | 11 (7.9%) |
| 90 or more Minutes | 0 (0.0%) | 0 (0.0%) |
Time of Departure to Work by Sex in Preston Potter Hollow
The most frequent times of departure to work in Preston Potter Hollow are 5:30 AM to 5:59 AM (15, 26.3%) for males and 4:00 PM to 11:59 PM (95, 67.9%) for females.
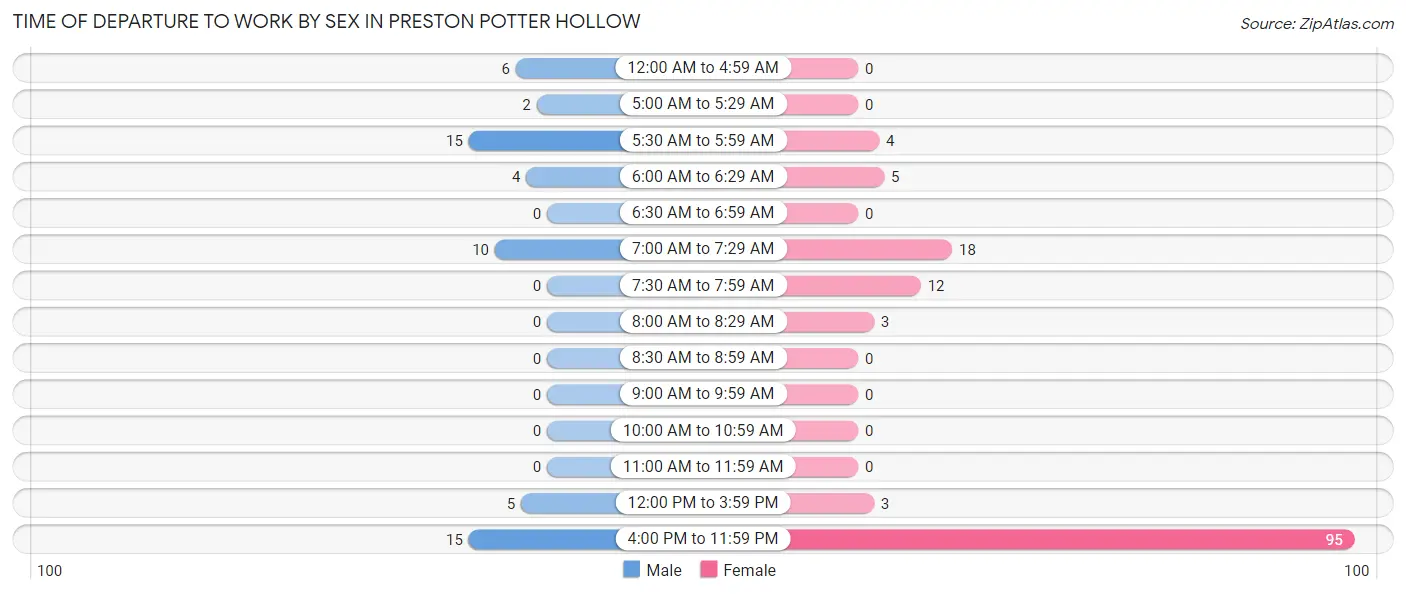
| Time of Departure | Male | Female |
| 12:00 AM to 4:59 AM | 6 (10.5%) | 0 (0.0%) |
| 5:00 AM to 5:29 AM | 2 (3.5%) | 0 (0.0%) |
| 5:30 AM to 5:59 AM | 15 (26.3%) | 4 (2.9%) |
| 6:00 AM to 6:29 AM | 4 (7.0%) | 5 (3.6%) |
| 6:30 AM to 6:59 AM | 0 (0.0%) | 0 (0.0%) |
| 7:00 AM to 7:29 AM | 10 (17.5%) | 18 (12.9%) |
| 7:30 AM to 7:59 AM | 0 (0.0%) | 12 (8.6%) |
| 8:00 AM to 8:29 AM | 0 (0.0%) | 3 (2.1%) |
| 8:30 AM to 8:59 AM | 0 (0.0%) | 0 (0.0%) |
| 9:00 AM to 9:59 AM | 0 (0.0%) | 0 (0.0%) |
| 10:00 AM to 10:59 AM | 0 (0.0%) | 0 (0.0%) |
| 11:00 AM to 11:59 AM | 0 (0.0%) | 0 (0.0%) |
| 12:00 PM to 3:59 PM | 5 (8.8%) | 3 (2.1%) |
| 4:00 PM to 11:59 PM | 15 (26.3%) | 95 (67.9%) |
| Total | 57 (100.0%) | 140 (100.0%) |
Housing Occupancy in Preston Potter Hollow
Occupancy by Ownership in Preston Potter Hollow
Of the total 216 dwellings in Preston Potter Hollow, owner-occupied units account for 216 (100.0%), while renter-occupied units make up 0 (0.0%).
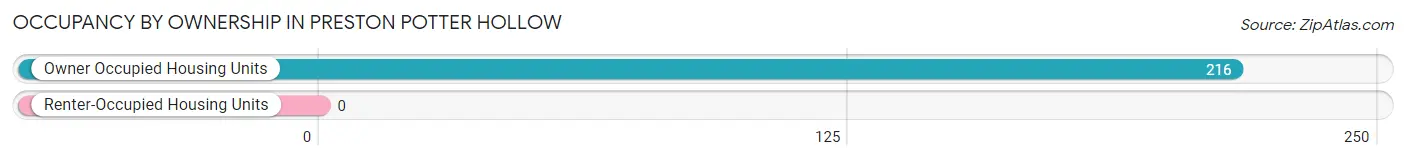
| Occupancy | # Housing Units | % Housing Units |
| Owner Occupied Housing Units | 216 | 100.0% |
| Renter-Occupied Housing Units | 0 | 0.0% |
| Total Occupied Housing Units | 216 | 100.0% |
Occupancy by Household Size in Preston Potter Hollow
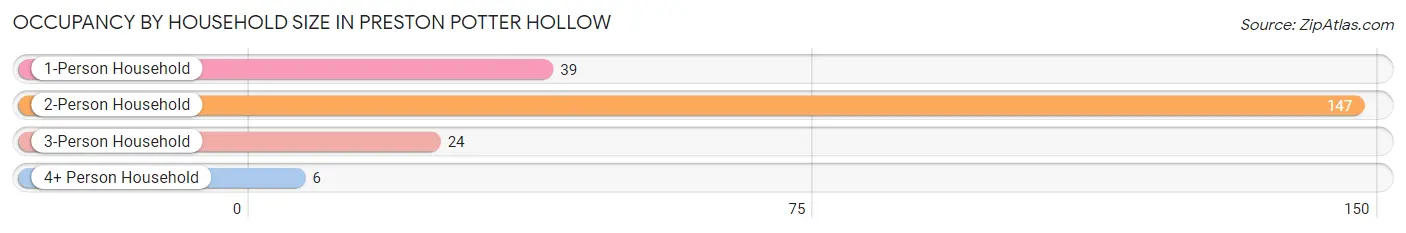
| Household Size | # Housing Units | % Housing Units |
| 1-Person Household | 39 | 18.1% |
| 2-Person Household | 147 | 68.1% |
| 3-Person Household | 24 | 11.1% |
| 4+ Person Household | 6 | 2.8% |
| Total Housing Units | 216 | 100.0% |
Occupancy by Ownership by Household Size in Preston Potter Hollow
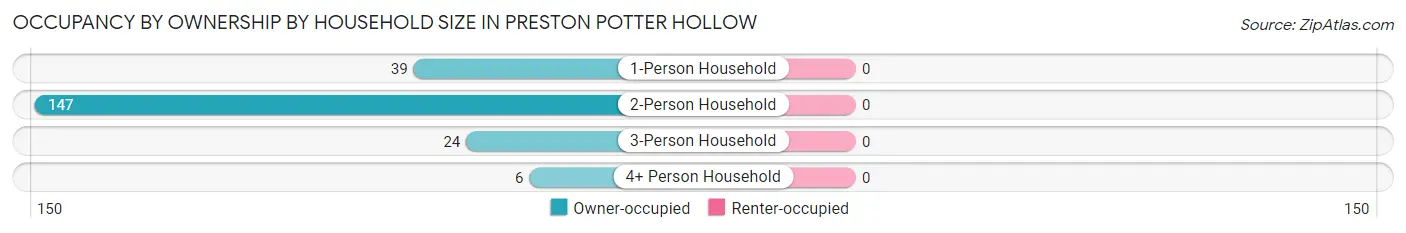
| Household Size | Owner-occupied | Renter-occupied |
| 1-Person Household | 39 (100.0%) | 0 (0.0%) |
| 2-Person Household | 147 (100.0%) | 0 (0.0%) |
| 3-Person Household | 24 (100.0%) | 0 (0.0%) |
| 4+ Person Household | 6 (100.0%) | 0 (0.0%) |
| Total Housing Units | 216 (100.0%) | 0 (0.0%) |
Occupancy by Educational Attainment in Preston Potter Hollow
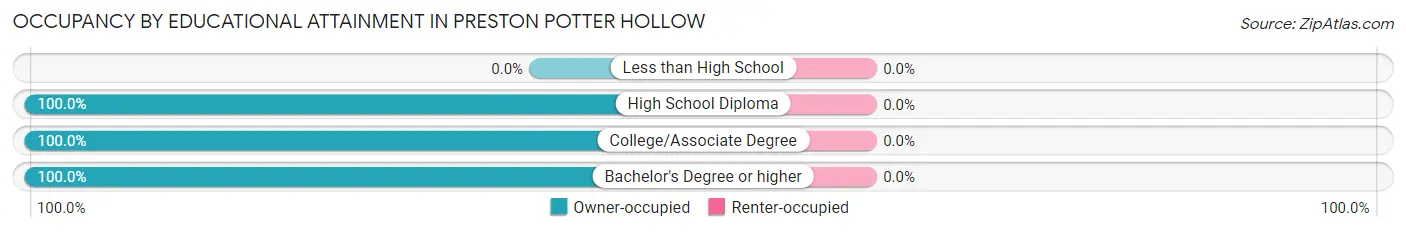
| Household Size | Owner-occupied | Renter-occupied |
| Less than High School | 0 (0.0%) | 0 (0.0%) |
| High School Diploma | 110 (100.0%) | 0 (0.0%) |
| College/Associate Degree | 52 (100.0%) | 0 (0.0%) |
| Bachelor's Degree or higher | 54 (100.0%) | 0 (0.0%) |
Occupancy by Age of Householder in Preston Potter Hollow
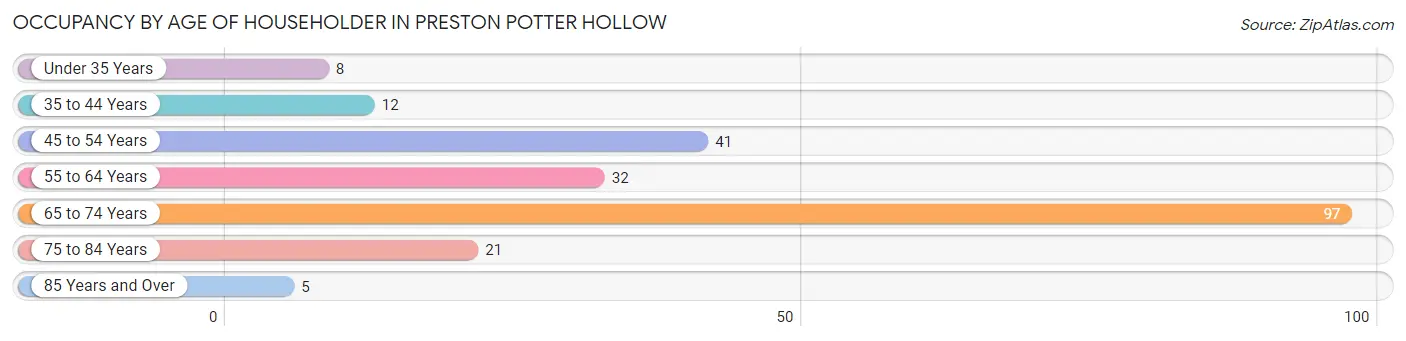
| Age Bracket | # Households | % Households |
| Under 35 Years | 8 | 3.7% |
| 35 to 44 Years | 12 | 5.6% |
| 45 to 54 Years | 41 | 19.0% |
| 55 to 64 Years | 32 | 14.8% |
| 65 to 74 Years | 97 | 44.9% |
| 75 to 84 Years | 21 | 9.7% |
| 85 Years and Over | 5 | 2.3% |
| Total | 216 | 100.0% |
Housing Finances in Preston Potter Hollow
Median Income by Occupancy in Preston Potter Hollow
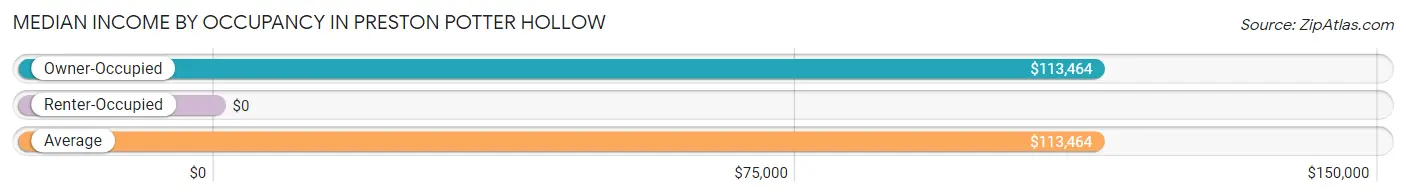
| Occupancy Type | # Households | Median Income |
| Owner-Occupied | 216 (100.0%) | $113,464 |
| Renter-Occupied | 0 (0.0%) | $0 |
| Average | 216 (100.0%) | $113,464 |
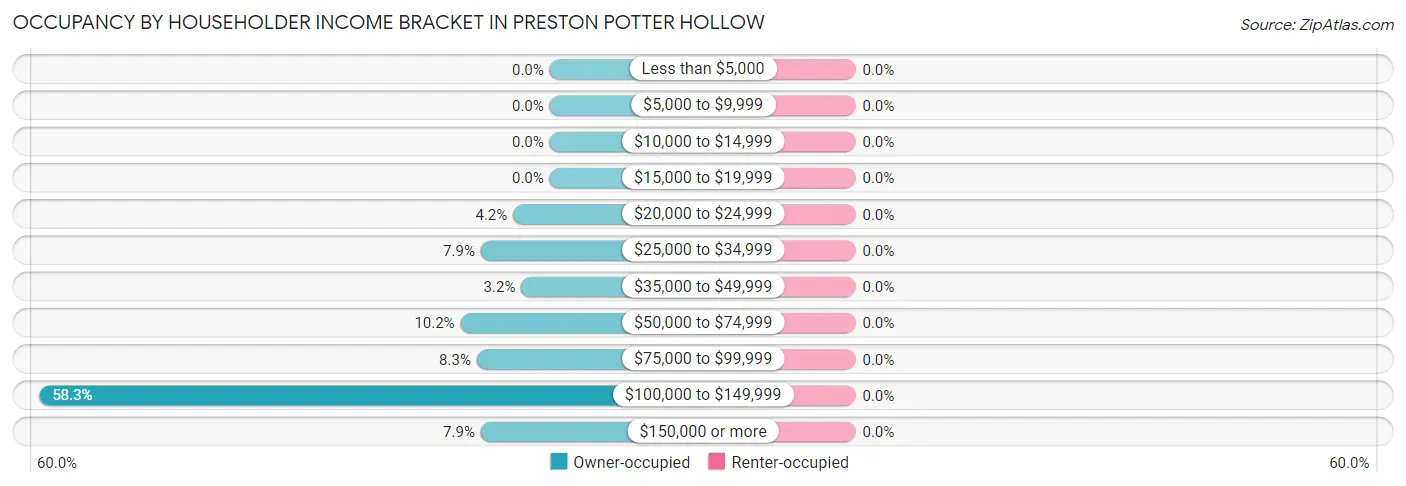
Occupancy by Householder Income Bracket in Preston Potter Hollow
| Income Bracket | Owner-occupied | Renter-occupied |
| Less than $5,000 | 0 (0.0%) | 0 (0.0%) |
| $5,000 to $9,999 | 0 (0.0%) | 0 (0.0%) |
| $10,000 to $14,999 | 0 (0.0%) | 0 (0.0%) |
| $15,000 to $19,999 | 0 (0.0%) | 0 (0.0%) |
| $20,000 to $24,999 | 9 (4.2%) | 0 (0.0%) |
| $25,000 to $34,999 | 17 (7.9%) | 0 (0.0%) |
| $35,000 to $49,999 | 7 (3.2%) | 0 (0.0%) |
| $50,000 to $74,999 | 22 (10.2%) | 0 (0.0%) |
| $75,000 to $99,999 | 18 (8.3%) | 0 (0.0%) |
| $100,000 to $149,999 | 126 (58.3%) | 0 (0.0%) |
| $150,000 or more | 17 (7.9%) | 0 (0.0%) |
| Total | 216 (100.0%) | 0 (0.0%) |
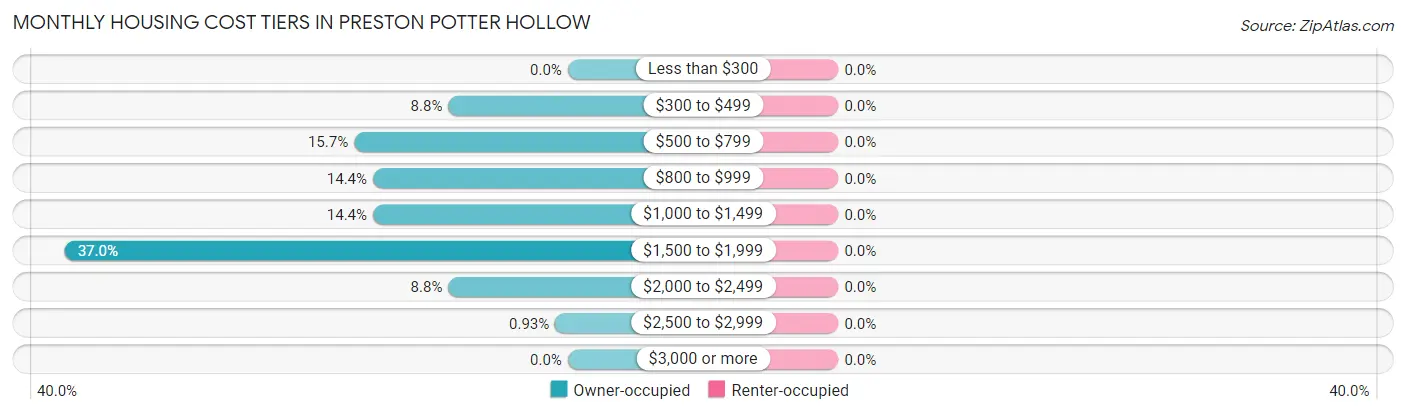
Monthly Housing Cost Tiers in Preston Potter Hollow
| Monthly Cost | Owner-occupied | Renter-occupied |
| Less than $300 | 0 (0.0%) | 0 (0.0%) |
| $300 to $499 | 19 (8.8%) | 0 (0.0%) |
| $500 to $799 | 34 (15.7%) | 0 (0.0%) |
| $800 to $999 | 31 (14.3%) | 0 (0.0%) |
| $1,000 to $1,499 | 31 (14.3%) | 0 (0.0%) |
| $1,500 to $1,999 | 80 (37.0%) | 0 (0.0%) |
| $2,000 to $2,499 | 19 (8.8%) | 0 (0.0%) |
| $2,500 to $2,999 | 2 (0.9%) | 0 (0.0%) |
| $3,000 or more | 0 (0.0%) | 0 (0.0%) |
| Total | 216 (100.0%) | 0 (0.0%) |
Physical Housing Characteristics in Preston Potter Hollow
Housing Structures in Preston Potter Hollow
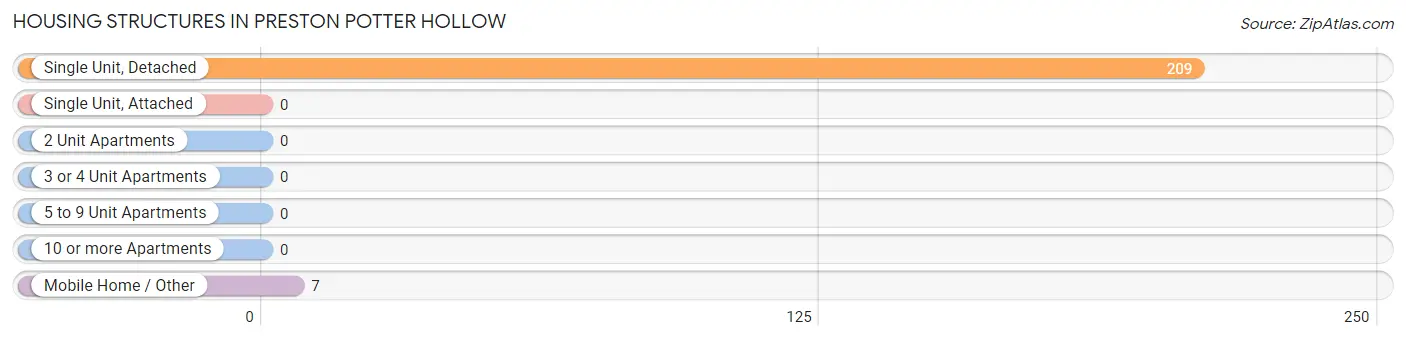
| Structure Type | # Housing Units | % Housing Units |
| Single Unit, Detached | 209 | 96.8% |
| Single Unit, Attached | 0 | 0.0% |
| 2 Unit Apartments | 0 | 0.0% |
| 3 or 4 Unit Apartments | 0 | 0.0% |
| 5 to 9 Unit Apartments | 0 | 0.0% |
| 10 or more Apartments | 0 | 0.0% |
| Mobile Home / Other | 7 | 3.2% |
| Total | 216 | 100.0% |
Housing Structures by Occupancy in Preston Potter Hollow
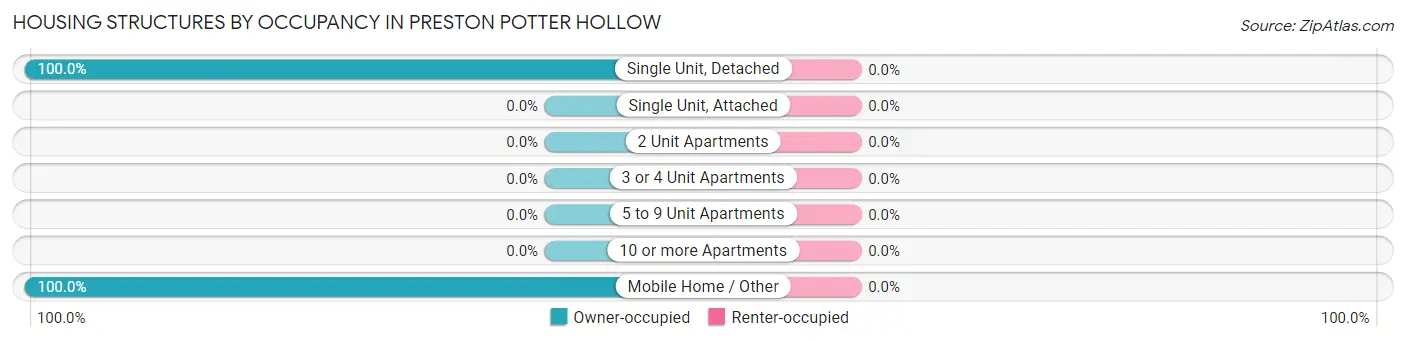
| Structure Type | Owner-occupied | Renter-occupied |
| Single Unit, Detached | 209 (100.0%) | 0 (0.0%) |
| Single Unit, Attached | 0 (0.0%) | 0 (0.0%) |
| 2 Unit Apartments | 0 (0.0%) | 0 (0.0%) |
| 3 or 4 Unit Apartments | 0 (0.0%) | 0 (0.0%) |
| 5 to 9 Unit Apartments | 0 (0.0%) | 0 (0.0%) |
| 10 or more Apartments | 0 (0.0%) | 0 (0.0%) |
| Mobile Home / Other | 7 (100.0%) | 0 (0.0%) |
| Total | 216 (100.0%) | 0 (0.0%) |
Housing Structures by Number of Rooms in Preston Potter Hollow
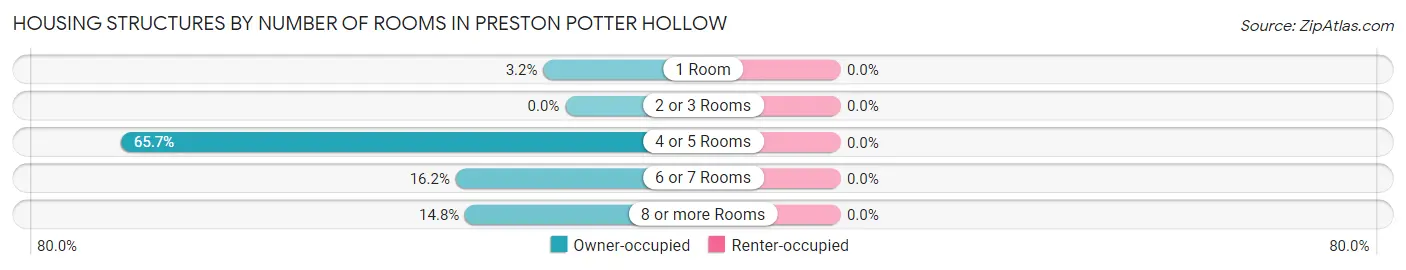
| Number of Rooms | Owner-occupied | Renter-occupied |
| 1 Room | 7 (3.2%) | 0 (0.0%) |
| 2 or 3 Rooms | 0 (0.0%) | 0 (0.0%) |
| 4 or 5 Rooms | 142 (65.7%) | 0 (0.0%) |
| 6 or 7 Rooms | 35 (16.2%) | 0 (0.0%) |
| 8 or more Rooms | 32 (14.8%) | 0 (0.0%) |
| Total | 216 (100.0%) | 0 (0.0%) |
Housing Structure by Heating Type in Preston Potter Hollow
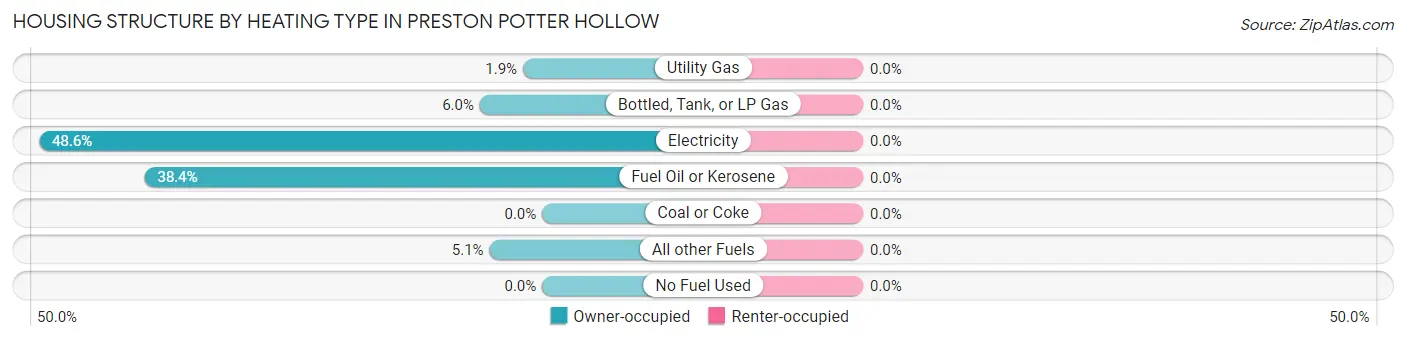
| Heating Type | Owner-occupied | Renter-occupied |
| Utility Gas | 4 (1.8%) | 0 (0.0%) |
| Bottled, Tank, or LP Gas | 13 (6.0%) | 0 (0.0%) |
| Electricity | 105 (48.6%) | 0 (0.0%) |
| Fuel Oil or Kerosene | 83 (38.4%) | 0 (0.0%) |
| Coal or Coke | 0 (0.0%) | 0 (0.0%) |
| All other Fuels | 11 (5.1%) | 0 (0.0%) |
| No Fuel Used | 0 (0.0%) | 0 (0.0%) |
| Total | 216 (100.0%) | 0 (0.0%) |
Household Vehicle Usage in Preston Potter Hollow
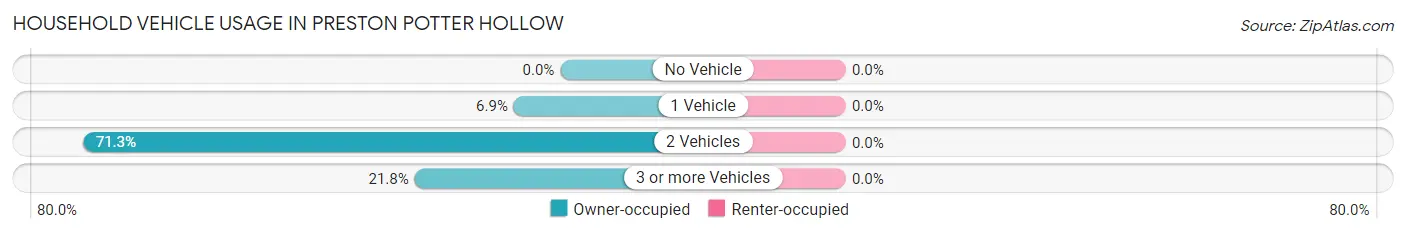
| Vehicles per Household | Owner-occupied | Renter-occupied |
| No Vehicle | 0 (0.0%) | 0 (0.0%) |
| 1 Vehicle | 15 (6.9%) | 0 (0.0%) |
| 2 Vehicles | 154 (71.3%) | 0 (0.0%) |
| 3 or more Vehicles | 47 (21.8%) | 0 (0.0%) |
| Total | 216 (100.0%) | 0 (0.0%) |
Real Estate & Mortgages in Preston Potter Hollow
Real Estate and Mortgage Overview in Preston Potter Hollow
| Characteristic | Without Mortgage | With Mortgage |
| Housing Units | 83 | 133 |
| Median Property Value | $186,000 | $187,700 |
| Median Household Income | $112,604 | $6 |
| Monthly Housing Costs | $778 | $0 |
| Real Estate Taxes | $5,043 | $0 |
Property Value by Mortgage Status in Preston Potter Hollow
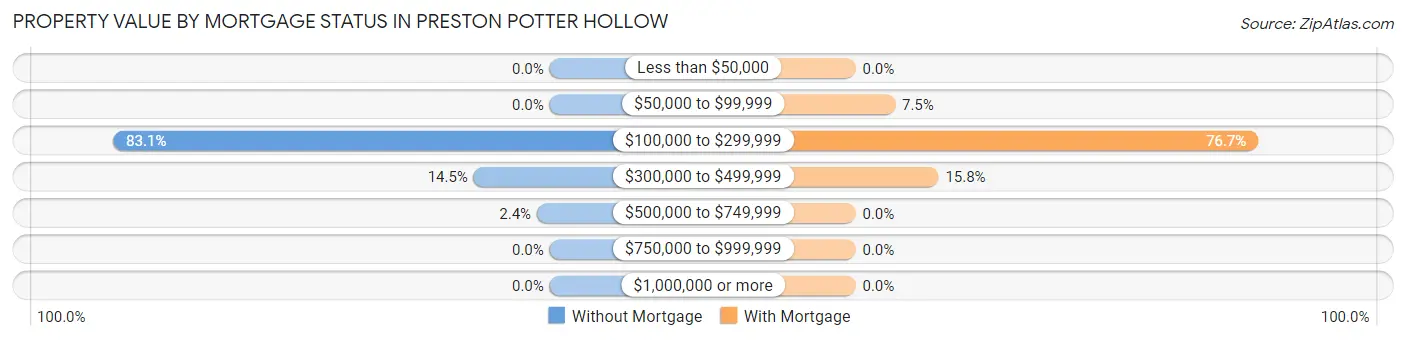
| Property Value | Without Mortgage | With Mortgage |
| Less than $50,000 | 0 (0.0%) | 0 (0.0%) |
| $50,000 to $99,999 | 0 (0.0%) | 10 (7.5%) |
| $100,000 to $299,999 | 69 (83.1%) | 102 (76.7%) |
| $300,000 to $499,999 | 12 (14.5%) | 21 (15.8%) |
| $500,000 to $749,999 | 2 (2.4%) | 0 (0.0%) |
| $750,000 to $999,999 | 0 (0.0%) | 0 (0.0%) |
| $1,000,000 or more | 0 (0.0%) | 0 (0.0%) |
| Total | 83 (100.0%) | 133 (100.0%) |
Household Income by Mortgage Status in Preston Potter Hollow
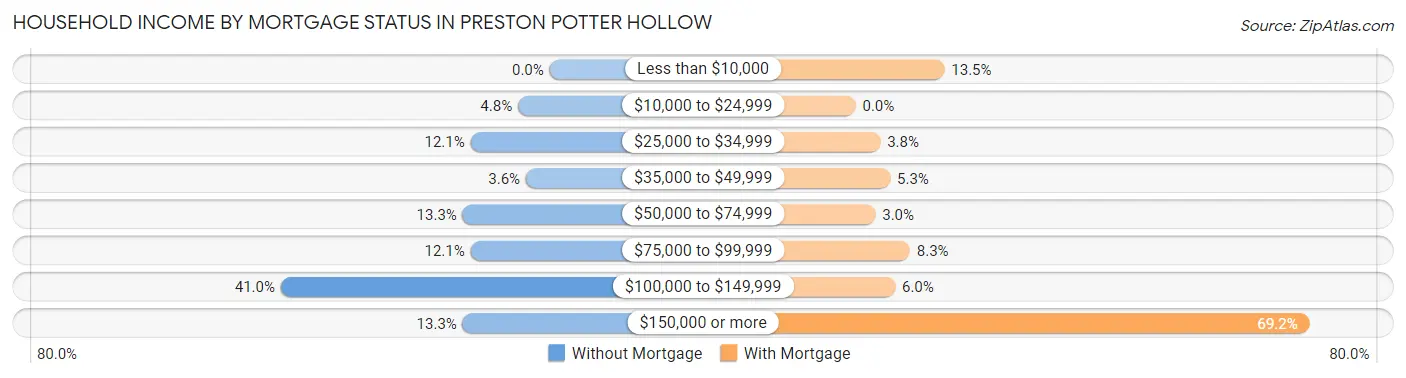
| Household Income | Without Mortgage | With Mortgage |
| Less than $10,000 | 0 (0.0%) | 18 (13.5%) |
| $10,000 to $24,999 | 4 (4.8%) | 0 (0.0%) |
| $25,000 to $34,999 | 10 (12.0%) | 5 (3.8%) |
| $35,000 to $49,999 | 3 (3.6%) | 7 (5.3%) |
| $50,000 to $74,999 | 11 (13.3%) | 4 (3.0%) |
| $75,000 to $99,999 | 10 (12.0%) | 11 (8.3%) |
| $100,000 to $149,999 | 34 (41.0%) | 8 (6.0%) |
| $150,000 or more | 11 (13.3%) | 92 (69.2%) |
| Total | 83 (100.0%) | 133 (100.0%) |
Property Value to Household Income Ratio in Preston Potter Hollow
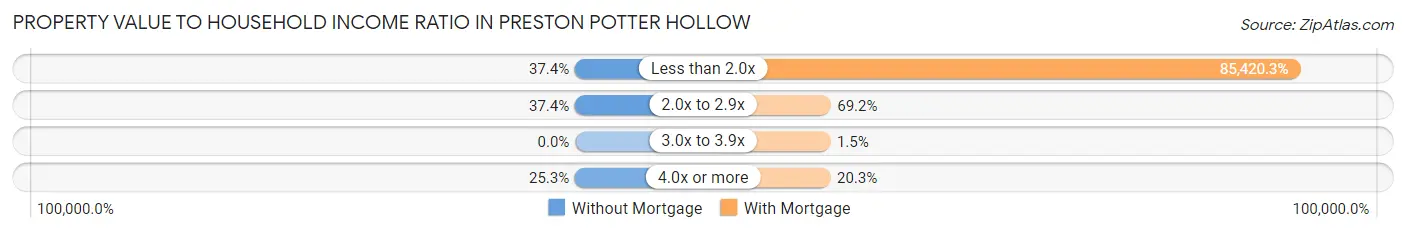
| Value-to-Income Ratio | Without Mortgage | With Mortgage |
| Less than 2.0x | 31 (37.3%) | 113,609 (85,420.3%) |
| 2.0x to 2.9x | 31 (37.3%) | 92 (69.2%) |
| 3.0x to 3.9x | 0 (0.0%) | 2 (1.5%) |
| 4.0x or more | 21 (25.3%) | 27 (20.3%) |
| Total | 83 (100.0%) | 133 (100.0%) |
Real Estate Taxes by Mortgage Status in Preston Potter Hollow
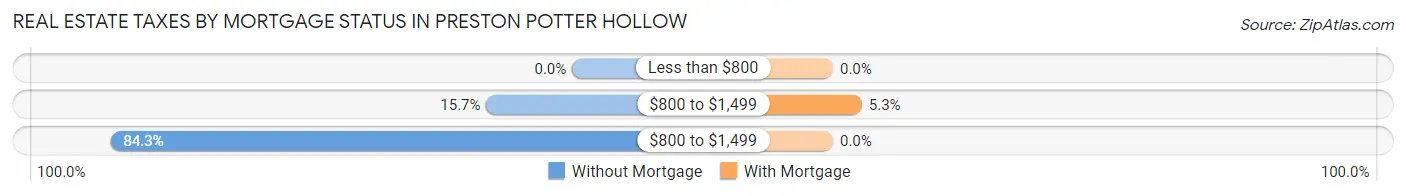
| Property Taxes | Without Mortgage | With Mortgage |
| Less than $800 | 0 (0.0%) | 0 (0.0%) |
| $800 to $1,499 | 13 (15.7%) | 7 (5.3%) |
| $800 to $1,499 | 70 (84.3%) | 0 (0.0%) |
| Total | 83 (100.0%) | 133 (100.0%) |
Health & Disability in Preston Potter Hollow
Health Insurance Coverage by Age in Preston Potter Hollow
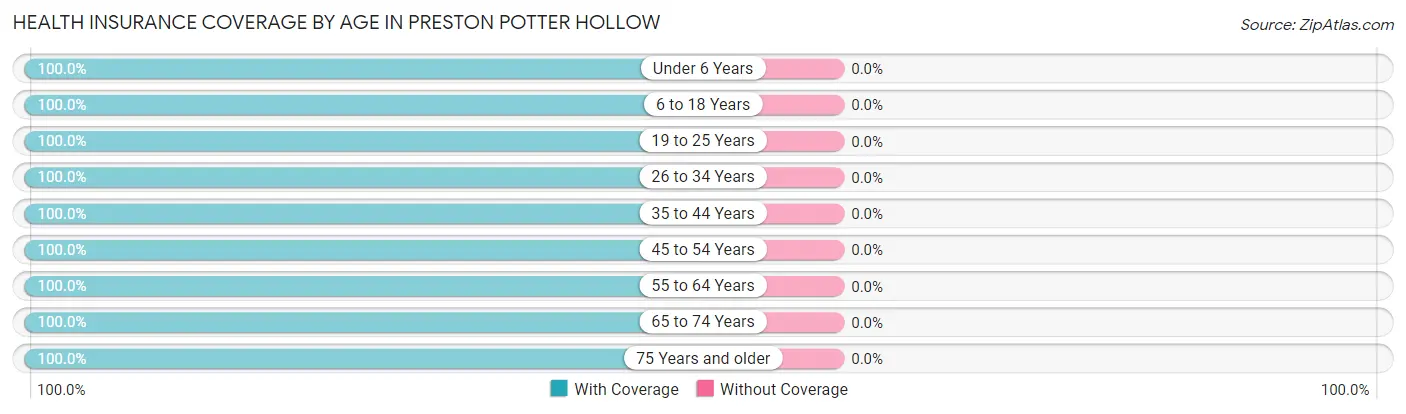
| Age Bracket | With Coverage | Without Coverage |
| Under 6 Years | 6 (100.0%) | 0 (0.0%) |
| 6 to 18 Years | 29 (100.0%) | 0 (0.0%) |
| 19 to 25 Years | 6 (100.0%) | 0 (0.0%) |
| 26 to 34 Years | 30 (100.0%) | 0 (0.0%) |
| 35 to 44 Years | 17 (100.0%) | 0 (0.0%) |
| 45 to 54 Years | 157 (100.0%) | 0 (0.0%) |
| 55 to 64 Years | 73 (100.0%) | 0 (0.0%) |
| 65 to 74 Years | 101 (100.0%) | 0 (0.0%) |
| 75 Years and older | 47 (100.0%) | 0 (0.0%) |
| Total | 466 (100.0%) | 0 (0.0%) |
Health Insurance Coverage by Citizenship Status in Preston Potter Hollow
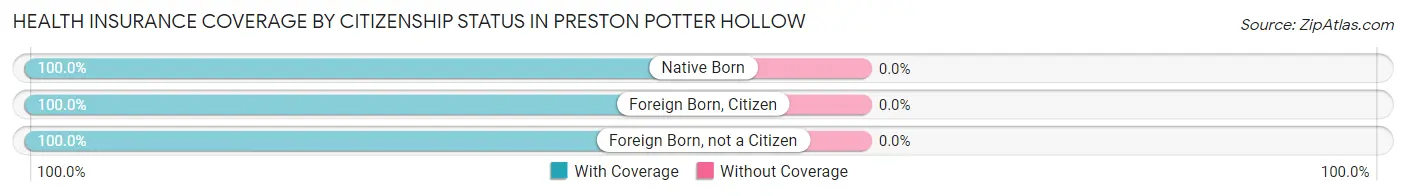
| Citizenship Status | With Coverage | Without Coverage |
| Native Born | 6 (100.0%) | 0 (0.0%) |
| Foreign Born, Citizen | 29 (100.0%) | 0 (0.0%) |
| Foreign Born, not a Citizen | 6 (100.0%) | 0 (0.0%) |
Health Insurance Coverage by Household Income in Preston Potter Hollow
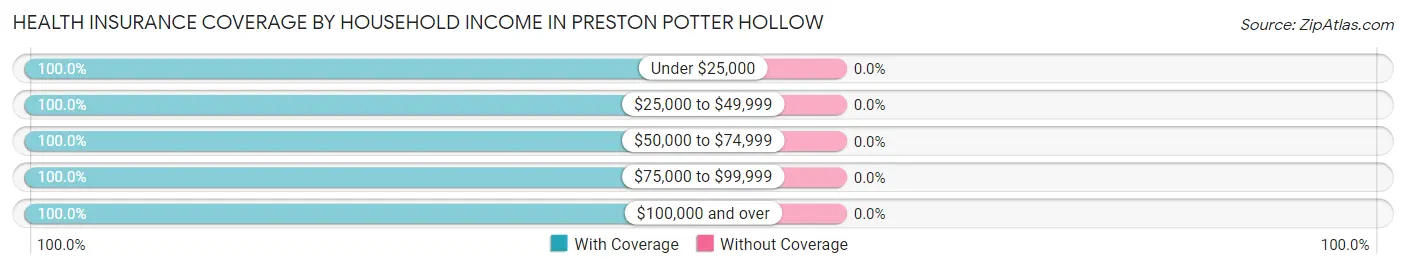
| Household Income | With Coverage | Without Coverage |
| Under $25,000 | 16 (100.0%) | 0 (0.0%) |
| $25,000 to $49,999 | 38 (100.0%) | 0 (0.0%) |
| $50,000 to $74,999 | 42 (100.0%) | 0 (0.0%) |
| $75,000 to $99,999 | 44 (100.0%) | 0 (0.0%) |
| $100,000 and over | 326 (100.0%) | 0 (0.0%) |
Public vs Private Health Insurance Coverage by Age in Preston Potter Hollow
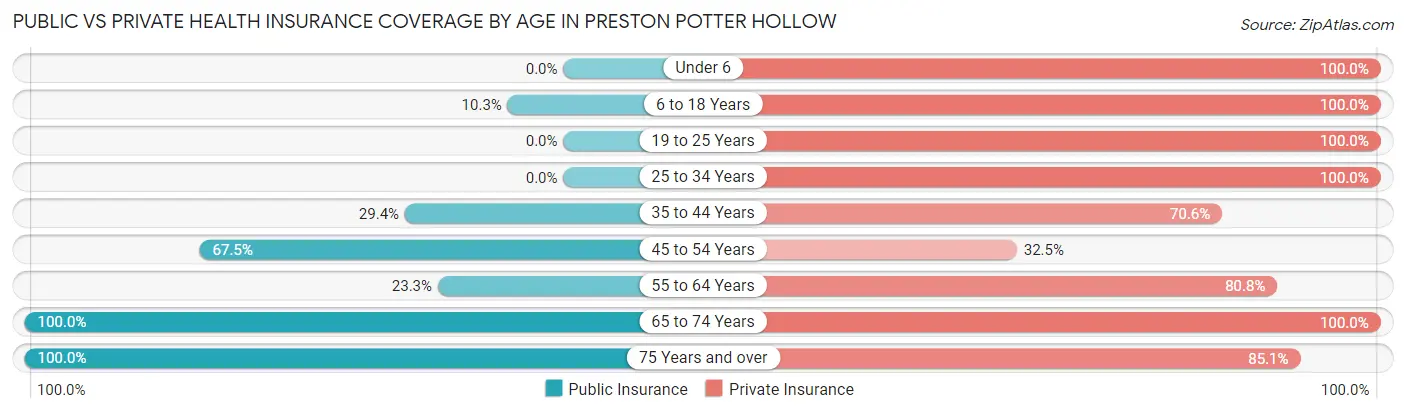
| Age Bracket | Public Insurance | Private Insurance |
| Under 6 | 0 (0.0%) | 6 (100.0%) |
| 6 to 18 Years | 3 (10.3%) | 29 (100.0%) |
| 19 to 25 Years | 0 (0.0%) | 6 (100.0%) |
| 25 to 34 Years | 0 (0.0%) | 30 (100.0%) |
| 35 to 44 Years | 5 (29.4%) | 12 (70.6%) |
| 45 to 54 Years | 106 (67.5%) | 51 (32.5%) |
| 55 to 64 Years | 17 (23.3%) | 59 (80.8%) |
| 65 to 74 Years | 101 (100.0%) | 101 (100.0%) |
| 75 Years and over | 47 (100.0%) | 40 (85.1%) |
| Total | 279 (59.9%) | 334 (71.7%) |
Disability Status by Sex by Age in Preston Potter Hollow
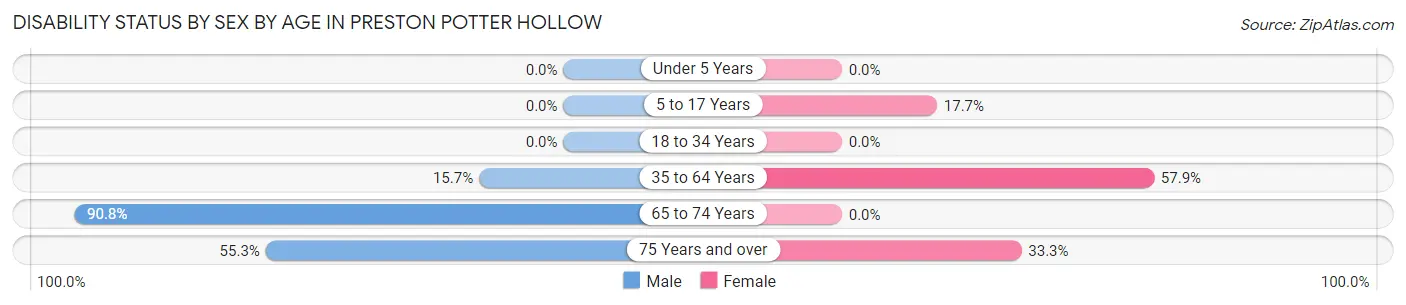
| Age Bracket | Male | Female |
| Under 5 Years | 0 (0.0%) | 0 (0.0%) |
| 5 to 17 Years | 0 (0.0%) | 3 (17.6%) |
| 18 to 34 Years | 0 (0.0%) | 0 (0.0%) |
| 35 to 64 Years | 13 (15.7%) | 95 (57.9%) |
| 65 to 74 Years | 79 (90.8%) | 0 (0.0%) |
| 75 Years and over | 21 (55.3%) | 3 (33.3%) |
Disability Class by Sex by Age in Preston Potter Hollow
Disability Class: Hearing Difficulty
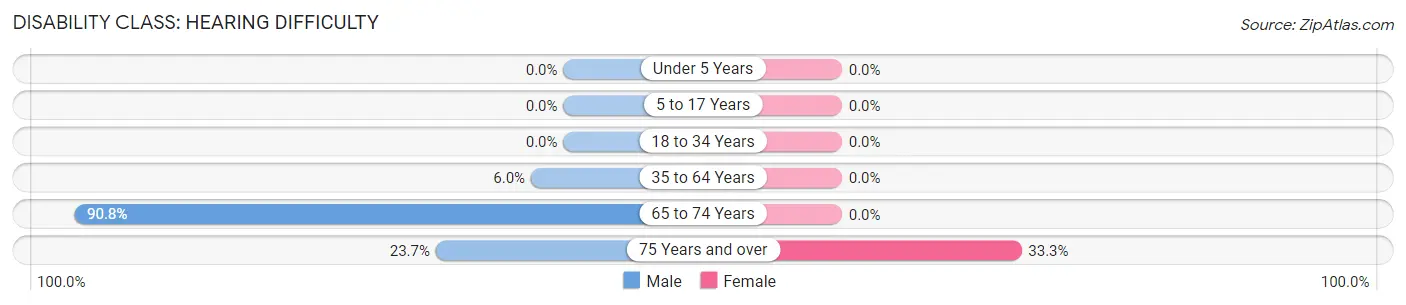
| Age Bracket | Male | Female |
| Under 5 Years | 0 (0.0%) | 0 (0.0%) |
| 5 to 17 Years | 0 (0.0%) | 0 (0.0%) |
| 18 to 34 Years | 0 (0.0%) | 0 (0.0%) |
| 35 to 64 Years | 5 (6.0%) | 0 (0.0%) |
| 65 to 74 Years | 79 (90.8%) | 0 (0.0%) |
| 75 Years and over | 9 (23.7%) | 3 (33.3%) |
Disability Class: Vision Difficulty
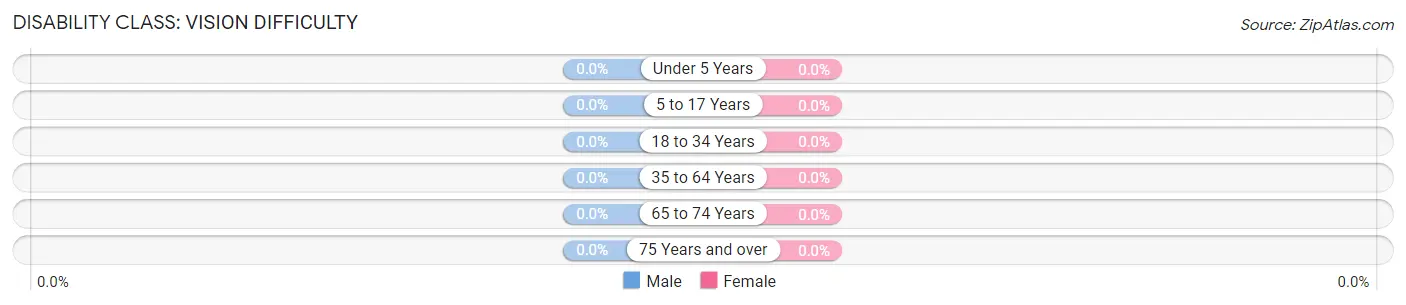
| Age Bracket | Male | Female |
| Under 5 Years | 0 (0.0%) | 0 (0.0%) |
| 5 to 17 Years | 0 (0.0%) | 0 (0.0%) |
| 18 to 34 Years | 0 (0.0%) | 0 (0.0%) |
| 35 to 64 Years | 0 (0.0%) | 0 (0.0%) |
| 65 to 74 Years | 0 (0.0%) | 0 (0.0%) |
| 75 Years and over | 0 (0.0%) | 0 (0.0%) |
Disability Class: Cognitive Difficulty
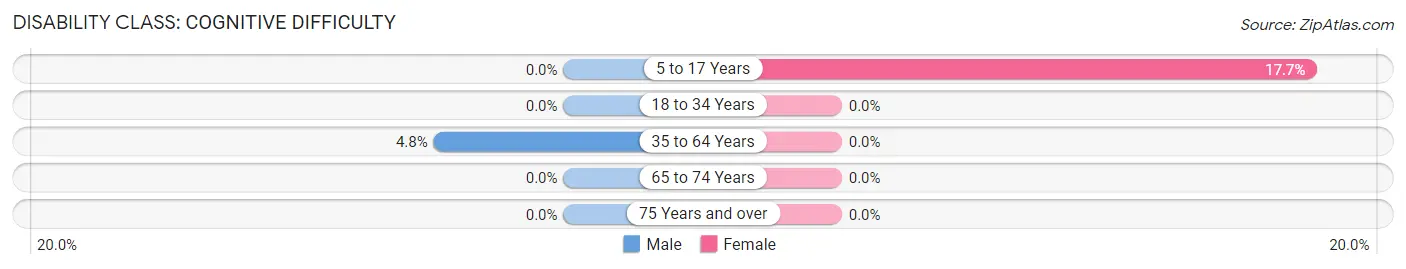
| Age Bracket | Male | Female |
| 5 to 17 Years | 0 (0.0%) | 3 (17.6%) |
| 18 to 34 Years | 0 (0.0%) | 0 (0.0%) |
| 35 to 64 Years | 4 (4.8%) | 0 (0.0%) |
| 65 to 74 Years | 0 (0.0%) | 0 (0.0%) |
| 75 Years and over | 0 (0.0%) | 0 (0.0%) |
Disability Class: Ambulatory Difficulty
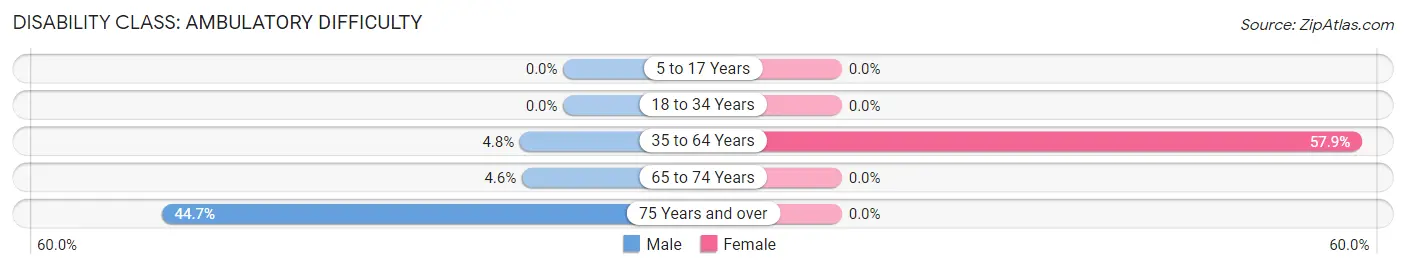
| Age Bracket | Male | Female |
| 5 to 17 Years | 0 (0.0%) | 0 (0.0%) |
| 18 to 34 Years | 0 (0.0%) | 0 (0.0%) |
| 35 to 64 Years | 4 (4.8%) | 95 (57.9%) |
| 65 to 74 Years | 4 (4.6%) | 0 (0.0%) |
| 75 Years and over | 17 (44.7%) | 0 (0.0%) |
Disability Class: Self-Care Difficulty
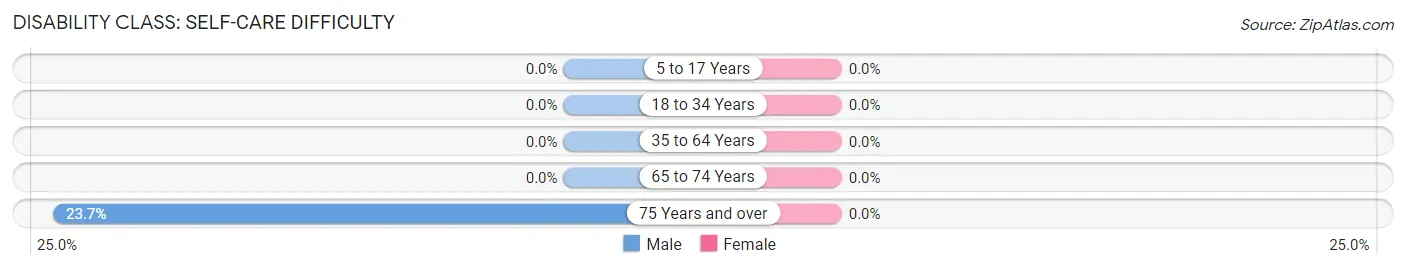
| Age Bracket | Male | Female |
| 5 to 17 Years | 0 (0.0%) | 0 (0.0%) |
| 18 to 34 Years | 0 (0.0%) | 0 (0.0%) |
| 35 to 64 Years | 0 (0.0%) | 0 (0.0%) |
| 65 to 74 Years | 0 (0.0%) | 0 (0.0%) |
| 75 Years and over | 9 (23.7%) | 0 (0.0%) |
Technology Access in Preston Potter Hollow
Computing Device Access in Preston Potter Hollow
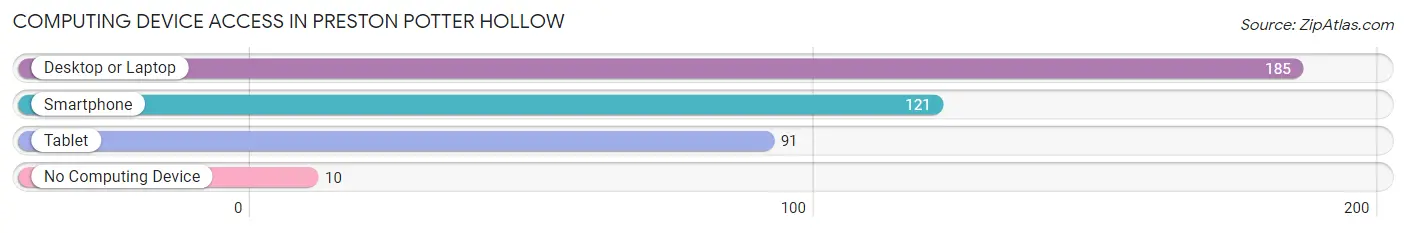
| Device Type | # Households | % Households |
| Desktop or Laptop | 185 | 85.7% |
| Smartphone | 121 | 56.0% |
| Tablet | 91 | 42.1% |
| No Computing Device | 10 | 4.6% |
| Total | 216 | 100.0% |
Internet Access in Preston Potter Hollow
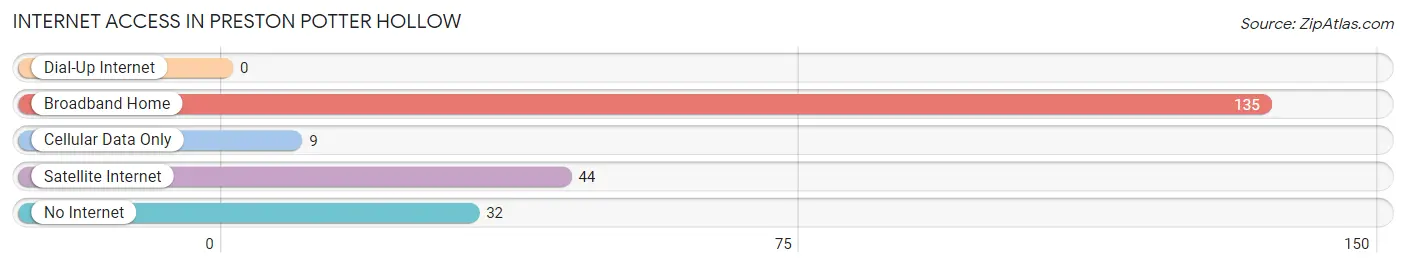
| Internet Type | # Households | % Households |
| Dial-Up Internet | 0 | 0.0% |
| Broadband Home | 135 | 62.5% |
| Cellular Data Only | 9 | 4.2% |
| Satellite Internet | 44 | 20.4% |
| No Internet | 32 | 14.8% |
| Total | 216 | 100.0% |
Preston Potter Hollow Summary
Preston Potter Hollow is a small hamlet located in the town of Preston in Chenango County, New York. It is situated in the foothills of the Catskill Mountains, approximately 20 miles south of the city of Binghamton. The hamlet is home to a population of approximately 500 people, and is a rural community with a strong agricultural heritage.
History
The hamlet of Preston Potter Hollow was first settled in the early 1800s by a group of settlers from Connecticut. The settlers were attracted to the area due to its fertile soil and abundant natural resources. The hamlet was named after the first settler, Preston Potter, who established a farm in the area.
The hamlet grew slowly over the years, and by the mid-1800s, it had become a thriving agricultural community. The hamlet was home to several small farms, as well as a general store, a blacksmith, and a post office.
In the late 1800s, the hamlet began to experience a period of decline. The population began to decline as many of the residents moved away in search of better economic opportunities. By the early 1900s, the hamlet had become a virtual ghost town.
In the mid-1900s, the hamlet began to experience a resurgence. The population began to increase as new residents moved to the area in search of a rural lifestyle. The hamlet also began to attract tourists, who were drawn to the area’s natural beauty and rural charm.
Geography
Preston Potter Hollow is located in the foothills of the Catskill Mountains in Chenango County, New York. The hamlet is situated in a rural area, and is surrounded by rolling hills and farmland. The hamlet is located approximately 20 miles south of the city of Binghamton.
The hamlet is located in a temperate climate, with warm summers and cold winters. The average annual temperature is approximately 50 degrees Fahrenheit. The average annual precipitation is approximately 40 inches.
Economy
The economy of Preston Potter Hollow is largely based on agriculture. The hamlet is home to several small farms, which produce a variety of crops, including corn, soybeans, hay, and wheat. The hamlet also has a small number of businesses, including a general store, a blacksmith, and a post office.
The hamlet is also home to a number of tourist attractions, including a historic covered bridge, a nature preserve, and a number of hiking trails. These attractions draw visitors from all over the region, and help to support the local economy.
Demographics
As of the 2010 census, the population of Preston Potter Hollow was approximately 500 people. The population is predominantly white, with a small minority of African Americans and Hispanics. The median household income is approximately $45,000, and the median home value is approximately $150,000.
The hamlet is home to a number of churches, including the Preston Potter Hollow United Methodist Church, the Preston Potter Hollow Baptist Church, and the Preston Potter Hollow Presbyterian Church. The hamlet also has a public library, a fire department, and a post office.
Conclusion
Preston Potter Hollow is a small hamlet located in the town of Preston in Chenango County, New York. The hamlet is situated in the foothills of the Catskill Mountains, and is home to a population of approximately 500 people. The hamlet has a strong agricultural heritage, and is home to several small farms, as well as a number of tourist attractions. The economy of the hamlet is largely based on agriculture, and the population is predominantly white. The hamlet is home to a number of churches, a public library, a fire department, and a post office.
Common Questions
What is Per Capita Income in Preston Potter Hollow?
Per Capita income in Preston Potter Hollow is $54,011.
What is the Median Family Income in Preston Potter Hollow?
Median Family Income in Preston Potter Hollow is $84,583.
What is the Median Household income in Preston Potter Hollow?
Median Household Income in Preston Potter Hollow is $113,464.
What is Inequality or Gini Index in Preston Potter Hollow?
Inequality or Gini Index in Preston Potter Hollow is 0.25.
What is the Total Population of Preston Potter Hollow?
Total Population of Preston Potter Hollow is 466.
What is the Total Male Population of Preston Potter Hollow?
Total Male Population of Preston Potter Hollow is 241.
What is the Total Female Population of Preston Potter Hollow?
Total Female Population of Preston Potter Hollow is 225.
What is the Ratio of Males per 100 Females in Preston Potter Hollow?
There are 107.11 Males per 100 Females in Preston Potter Hollow.
What is the Ratio of Females per 100 Males in Preston Potter Hollow?
There are 93.36 Females per 100 Males in Preston Potter Hollow.
What is the Median Population Age in Preston Potter Hollow?
Median Population Age in Preston Potter Hollow is 52.0 Years.
What is the Average Family Size in Preston Potter Hollow
Average Family Size in Preston Potter Hollow is 2.5 People.
What is the Average Household Size in Preston Potter Hollow
Average Household Size in Preston Potter Hollow is 2.2 People.
How Large is the Labor Force in Preston Potter Hollow?
There are 239 People in the Labor Forcein in Preston Potter Hollow.
What is the Percentage of People in the Labor Force in Preston Potter Hollow?
53.1% of People are in the Labor Force in Preston Potter Hollow.
What is the Unemployment Rate in Preston Potter Hollow?
Unemployment Rate in Preston Potter Hollow is 5.0%.