Cities with the Highest Percentage of Population Employed in Retail Trade in Michigan
RELATED REPORTS & OPTIONS
Retail Trade
Michigan
Compare Cities
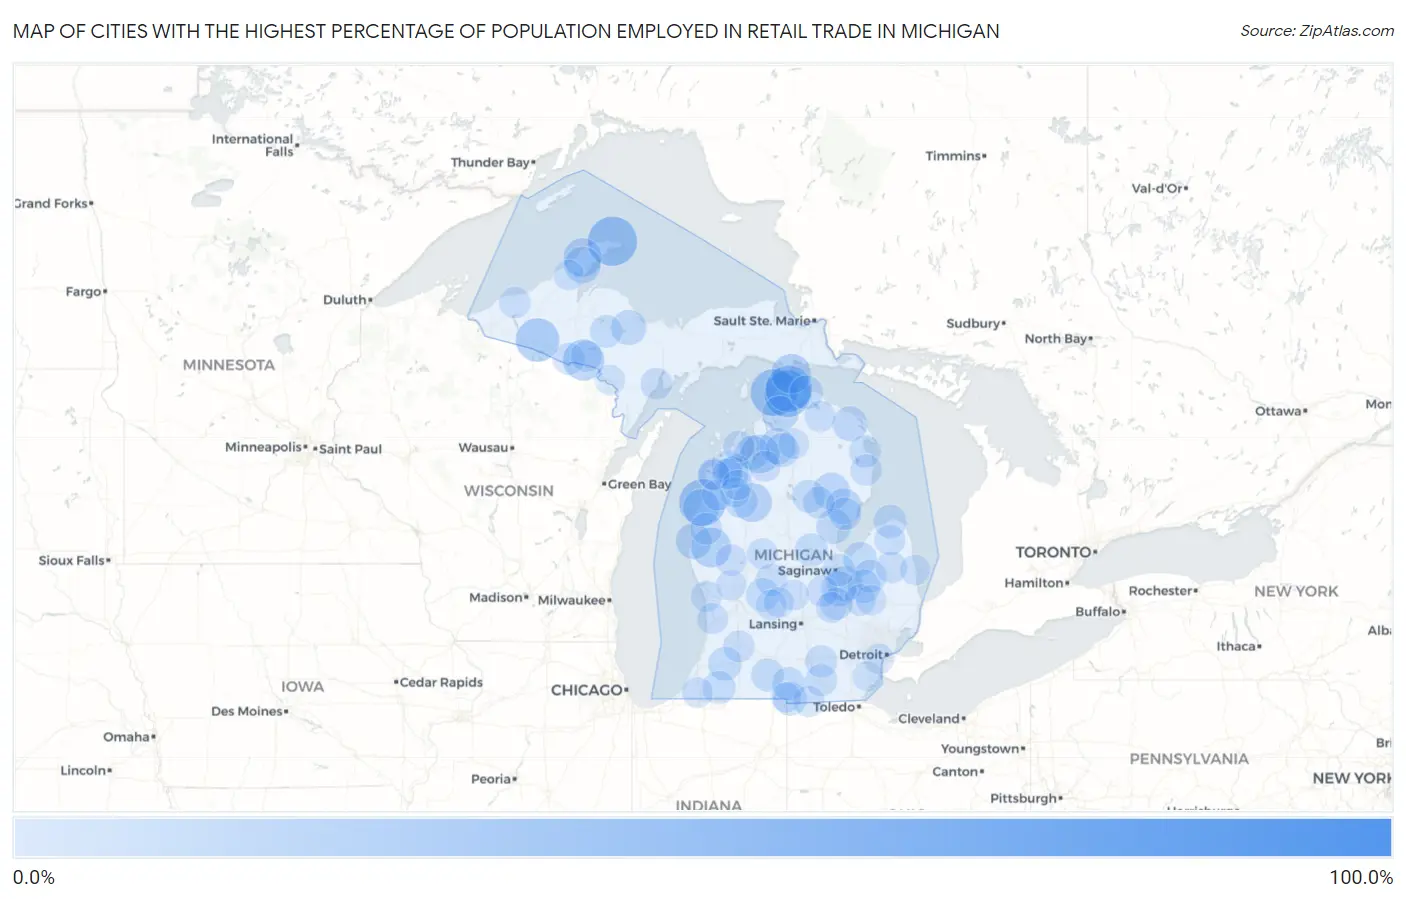
Map of Cities with the Highest Percentage of Population Employed in Retail Trade in Michigan
0.0%
100.0%
Cities with the Highest Percentage of Population Employed in Retail Trade in Michigan
| City | % Employed | vs State | vs National | |
| 1. | Hurontown | 84.3% | 10.8%(+73.5)#1 | 11.0%(+73.3)#66 |
| 2. | Pelkie | 42.1% | 10.8%(+31.3)#2 | 11.0%(+31.1)#419 |
| 3. | Copper Harbor | 40.7% | 10.8%(+29.9)#3 | 11.0%(+29.8)#460 |
| 4. | Parkdale | 37.8% | 10.8%(+27.0)#4 | 11.0%(+26.8)#564 |
| 5. | Cross Village | 37.5% | 10.8%(+26.7)#5 | 11.0%(+26.5)#578 |
| 6. | Levering | 37.5% | 10.8%(+26.7)#6 | 11.0%(+26.5)#579 |
| 7. | Carp Lake | 37.2% | 10.8%(+26.4)#7 | 11.0%(+26.2)#594 |
| 8. | Watersmeet | 33.6% | 10.8%(+22.8)#8 | 11.0%(+22.6)#767 |
| 9. | Alpha | 30.9% | 10.8%(+20.1)#9 | 11.0%(+19.9)#990 |
| 10. | Walkerville | 29.3% | 10.8%(+18.5)#10 | 11.0%(+18.3)#1,131 |
| 11. | St Ignace | 29.2% | 10.8%(+18.4)#11 | 11.0%(+18.2)#1,146 |
| 12. | Haring | 28.2% | 10.8%(+17.4)#12 | 11.0%(+17.2)#1,261 |
| 13. | Alden | 28.0% | 10.8%(+17.2)#13 | 11.0%(+17.0)#1,285 |
| 14. | Copper City | 27.7% | 10.8%(+16.9)#14 | 11.0%(+16.7)#1,329 |
| 15. | Millburg | 26.8% | 10.8%(+16.0)#15 | 11.0%(+15.8)#1,446 |
| 16. | Cannonsburg | 26.2% | 10.8%(+15.4)#16 | 11.0%(+15.2)#1,523 |
| 17. | Lupton | 25.9% | 10.8%(+15.1)#17 | 11.0%(+14.9)#1,571 |
| 18. | Lake Linden | 25.6% | 10.8%(+14.8)#18 | 11.0%(+14.6)#1,618 |
| 19. | Oak Hill | 25.5% | 10.8%(+14.7)#19 | 11.0%(+14.5)#1,631 |
| 20. | Pentwater | 24.7% | 10.8%(+13.9)#20 | 11.0%(+13.7)#1,813 |
| 21. | Alba | 24.7% | 10.8%(+13.9)#21 | 11.0%(+13.7)#1,814 |
| 22. | Bay View | 24.5% | 10.8%(+13.7)#22 | 11.0%(+13.5)#1,853 |
| 23. | Birch Run | 24.2% | 10.8%(+13.4)#23 | 11.0%(+13.2)#1,928 |
| 24. | Whittemore | 24.0% | 10.8%(+13.2)#24 | 11.0%(+13.0)#1,964 |
| 25. | Standish | 23.9% | 10.8%(+13.1)#25 | 11.0%(+12.9)#1,989 |
| 26. | Palmer | 23.8% | 10.8%(+13.0)#26 | 11.0%(+12.8)#2,003 |
| 27. | Posen | 23.5% | 10.8%(+12.7)#27 | 11.0%(+12.5)#2,074 |
| 28. | Montrose | 23.5% | 10.8%(+12.7)#28 | 11.0%(+12.5)#2,103 |
| 29. | Three Lakes | 23.2% | 10.8%(+12.4)#29 | 11.0%(+12.2)#2,167 |
| 30. | Elk Rapids | 22.7% | 10.8%(+11.9)#30 | 11.0%(+11.7)#2,299 |
| 31. | Lakes Of The North | 22.4% | 10.8%(+11.6)#31 | 11.0%(+11.4)#2,376 |
| 32. | Atlantic Mine | 22.2% | 10.8%(+11.4)#32 | 11.0%(+11.2)#2,448 |
| 33. | Cheboygan | 22.2% | 10.8%(+11.4)#33 | 11.0%(+11.2)#2,455 |
| 34. | Paw Paw | 22.0% | 10.8%(+11.3)#34 | 11.0%(+11.1)#2,486 |
| 35. | Camden | 21.9% | 10.8%(+11.1)#35 | 11.0%(+10.9)#2,528 |
| 36. | Akron | 21.9% | 10.8%(+11.1)#36 | 11.0%(+10.9)#2,533 |
| 37. | Boon | 21.7% | 10.8%(+10.9)#37 | 11.0%(+10.7)#2,584 |
| 38. | Belding | 21.7% | 10.8%(+10.9)#38 | 11.0%(+10.7)#2,592 |
| 39. | Port Austin | 21.6% | 10.8%(+10.8)#39 | 11.0%(+10.6)#2,623 |
| 40. | Sanford | 21.5% | 10.8%(+10.8)#40 | 11.0%(+10.6)#2,644 |
| 41. | Otter Lake | 21.5% | 10.8%(+10.7)#41 | 11.0%(+10.5)#2,661 |
| 42. | Cassopolis | 21.4% | 10.8%(+10.6)#42 | 11.0%(+10.4)#2,672 |
| 43. | Allen | 21.4% | 10.8%(+10.6)#43 | 11.0%(+10.4)#2,675 |
| 44. | Union City | 21.3% | 10.8%(+10.5)#44 | 11.0%(+10.3)#2,745 |
| 45. | St Helen | 21.1% | 10.8%(+10.3)#45 | 11.0%(+10.1)#2,788 |
| 46. | Mayville | 20.9% | 10.8%(+10.1)#46 | 11.0%(+9.89)#2,886 |
| 47. | Turner | 20.8% | 10.8%(+10.0)#47 | 11.0%(+9.84)#2,907 |
| 48. | Grawn | 20.8% | 10.8%(+10.0)#48 | 11.0%(+9.84)#2,911 |
| 49. | Republic | 20.7% | 10.8%(+9.95)#49 | 11.0%(+9.75)#2,935 |
| 50. | Lake Ann | 20.6% | 10.8%(+9.83)#50 | 11.0%(+9.64)#2,983 |
| 51. | Buena Vista | 20.6% | 10.8%(+9.78)#51 | 11.0%(+9.58)#3,010 |
| 52. | Lennon | 20.5% | 10.8%(+9.68)#52 | 11.0%(+9.48)#3,047 |
| 53. | Barnes Lake | 20.4% | 10.8%(+9.66)#53 | 11.0%(+9.46)#3,061 |
| 54. | Grass Lake | 20.4% | 10.8%(+9.63)#54 | 11.0%(+9.43)#3,068 |
| 55. | Beulah | 20.4% | 10.8%(+9.62)#55 | 11.0%(+9.42)#3,076 |
| 56. | Onsted | 20.3% | 10.8%(+9.51)#56 | 11.0%(+9.31)#3,120 |
| 57. | Caspian | 20.1% | 10.8%(+9.29)#57 | 11.0%(+9.10)#3,213 |
| 58. | West Branch | 20.0% | 10.8%(+9.21)#58 | 11.0%(+9.01)#3,245 |
| 59. | Ossineke | 20.0% | 10.8%(+9.21)#59 | 11.0%(+9.01)#3,250 |
| 60. | Interlochen | 20.0% | 10.8%(+9.21)#60 | 11.0%(+9.01)#3,254 |
| 61. | Stanton | 20.0% | 10.8%(+9.16)#61 | 11.0%(+8.96)#3,314 |
| 62. | Hermansville | 19.8% | 10.8%(+9.01)#62 | 11.0%(+8.81)#3,370 |
| 63. | Custer | 19.7% | 10.8%(+8.94)#63 | 11.0%(+8.74)#3,397 |
| 64. | Escanaba | 19.6% | 10.8%(+8.85)#64 | 11.0%(+8.65)#3,436 |
| 65. | Lincoln | 19.5% | 10.8%(+8.72)#65 | 11.0%(+8.52)#3,502 |
| 66. | White Pine | 19.5% | 10.8%(+8.70)#66 | 11.0%(+8.50)#3,517 |
| 67. | Oakley | 19.5% | 10.8%(+8.68)#67 | 11.0%(+8.48)#3,530 |
| 68. | Plainwell | 19.5% | 10.8%(+8.66)#68 | 11.0%(+8.46)#3,536 |
| 69. | Waldron | 19.4% | 10.8%(+8.57)#69 | 11.0%(+8.38)#3,569 |
| 70. | White Cloud | 19.4% | 10.8%(+8.57)#70 | 11.0%(+8.37)#3,571 |
| 71. | Snover | 19.4% | 10.8%(+8.56)#71 | 11.0%(+8.37)#3,574 |
| 72. | Davison | 19.3% | 10.8%(+8.50)#72 | 11.0%(+8.30)#3,605 |
| 73. | Suttons Bay | 19.3% | 10.8%(+8.47)#73 | 11.0%(+8.28)#3,618 |
| 74. | Benzonia | 19.2% | 10.8%(+8.42)#74 | 11.0%(+8.22)#3,660 |
| 75. | Crystal Falls | 19.2% | 10.8%(+8.39)#75 | 11.0%(+8.19)#3,667 |
| 76. | Ferrysburg | 19.1% | 10.8%(+8.33)#76 | 11.0%(+8.13)#3,694 |
| 77. | Onaway | 19.1% | 10.8%(+8.29)#77 | 11.0%(+8.09)#3,711 |
| 78. | Beechwood | 18.9% | 10.8%(+8.11)#78 | 11.0%(+7.92)#3,823 |
| 79. | Kalkaska | 18.8% | 10.8%(+8.05)#79 | 11.0%(+7.85)#3,852 |
| 80. | Kaleva | 18.8% | 10.8%(+8.05)#80 | 11.0%(+7.85)#3,853 |
| 81. | Vernon | 18.7% | 10.8%(+7.91)#81 | 11.0%(+7.71)#3,939 |
| 82. | Mecosta | 18.7% | 10.8%(+7.86)#82 | 11.0%(+7.66)#3,965 |
| 83. | Bad Axe | 18.5% | 10.8%(+7.75)#83 | 11.0%(+7.55)#4,018 |
| 84. | Bendon | 18.5% | 10.8%(+7.69)#84 | 11.0%(+7.49)#4,069 |
| 85. | Maple Rapids | 18.5% | 10.8%(+7.68)#85 | 11.0%(+7.49)#4,074 |
| 86. | Buchanan | 18.5% | 10.8%(+7.68)#86 | 11.0%(+7.48)#4,076 |
| 87. | Gaylord | 18.4% | 10.8%(+7.65)#87 | 11.0%(+7.45)#4,098 |
| 88. | Lapeer | 18.4% | 10.8%(+7.63)#88 | 11.0%(+7.43)#4,102 |
| 89. | Ionia | 18.4% | 10.8%(+7.57)#89 | 11.0%(+7.37)#4,140 |
| 90. | South Range | 18.3% | 10.8%(+7.47)#90 | 11.0%(+7.27)#4,198 |
| 91. | Muir | 18.1% | 10.8%(+7.32)#91 | 11.0%(+7.12)#4,303 |
| 92. | Melvindale | 18.1% | 10.8%(+7.32)#92 | 11.0%(+7.12)#4,308 |
| 93. | Casnovia | 18.1% | 10.8%(+7.30)#93 | 11.0%(+7.11)#4,316 |
| 94. | Norway | 18.1% | 10.8%(+7.29)#94 | 11.0%(+7.09)#4,322 |
| 95. | Mesick | 18.0% | 10.8%(+7.25)#95 | 11.0%(+7.06)#4,350 |
| 96. | Port Sanilac | 18.0% | 10.8%(+7.24)#96 | 11.0%(+7.04)#4,364 |
| 97. | Hartland | 18.0% | 10.8%(+7.19)#97 | 11.0%(+6.99)#4,397 |
| 98. | Carleton | 18.0% | 10.8%(+7.16)#98 | 11.0%(+6.96)#4,412 |
| 99. | Buckley | 17.9% | 10.8%(+7.14)#99 | 11.0%(+6.94)#4,425 |
| 100. | Montgomery | 17.9% | 10.8%(+7.12)#100 | 11.0%(+6.92)#4,435 |
Common Questions
What are the Top 10 Cities with the Highest Percentage of Population Employed in Retail Trade in Michigan?
Top 10 Cities with the Highest Percentage of Population Employed in Retail Trade in Michigan are:
#1
40.7%
#2
37.8%
#3
37.5%
#4
37.5%
#5
37.2%
#6
33.6%
#7
30.9%
#8
29.3%
#9
29.2%
#10
28.2%
What city has the Highest Percentage of Population Employed in Retail Trade in Michigan?
Copper Harbor has the Highest Percentage of Population Employed in Retail Trade in Michigan with 40.7%.
What is the Percentage of Population Employed in Retail Trade in the State of Michigan?
Percentage of Population Employed in Retail Trade in Michigan is 10.8%.
What is the Percentage of Population Employed in Retail Trade in the United States?
Percentage of Population Employed in Retail Trade in the United States is 11.0%.