Zip Codes with the Highest Percentage of Population Employed in Business & Financial in Glenview, IL
RELATED REPORTS & OPTIONS
Business & Financial
Glenview
Compare Zip Codes
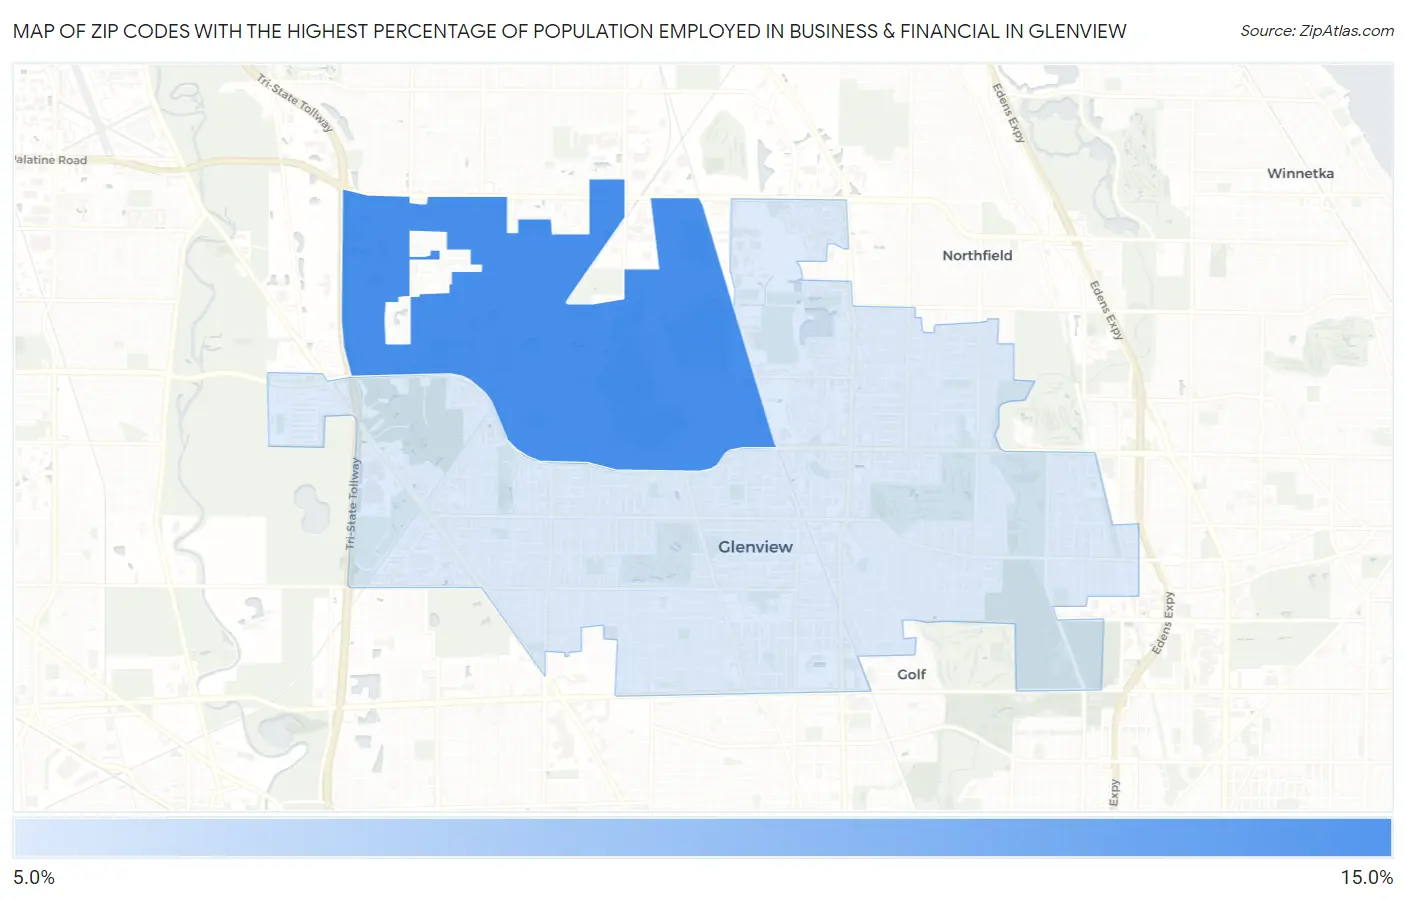
Map of Zip Codes with the Highest Percentage of Population Employed in Business & Financial in Glenview
10.2%
14.4%
Zip Codes with the Highest Percentage of Population Employed in Business & Financial in Glenview, IL
| Zip Code | % Employed | vs State | vs National | |
| 1. | 60026 | 14.4% | 6.5%(+7.89)#35 | 5.8%(+8.65)#683 |
| 2. | 60025 | 10.2% | 6.5%(+3.67)#106 | 5.8%(+4.42)#2,072 |
1
Common Questions
What are the Top Zip Codes with the Highest Percentage of Population Employed in Business & Financial in Glenview, IL?
Top Zip Codes with the Highest Percentage of Population Employed in Business & Financial in Glenview, IL are:
What zip code has the Highest Percentage of Population Employed in Business & Financial in Glenview, IL?
60026 has the Highest Percentage of Population Employed in Business & Financial in Glenview, IL with 14.4%.
What is the Percentage of Population Employed in Business & Financial in Glenview, IL?
Percentage of Population Employed in Business & Financial in Glenview is 11.8%.
What is the Percentage of Population Employed in Business & Financial in Illinois?
Percentage of Population Employed in Business & Financial in Illinois is 6.5%.
What is the Percentage of Population Employed in Business & Financial in the United States?
Percentage of Population Employed in Business & Financial in the United States is 5.8%.