Zip Codes with the Lowest Poverty Level Among Children Under the Age of 5 in Connecticut
RELATED REPORTS & OPTIONS
Lowest Poverty | Child 0-5
Connecticut
Compare Zip Codes
Map of Zip Codes with the Lowest Poverty Level Among Children Under the Age of 5 in Connecticut
20.0%
0.0%
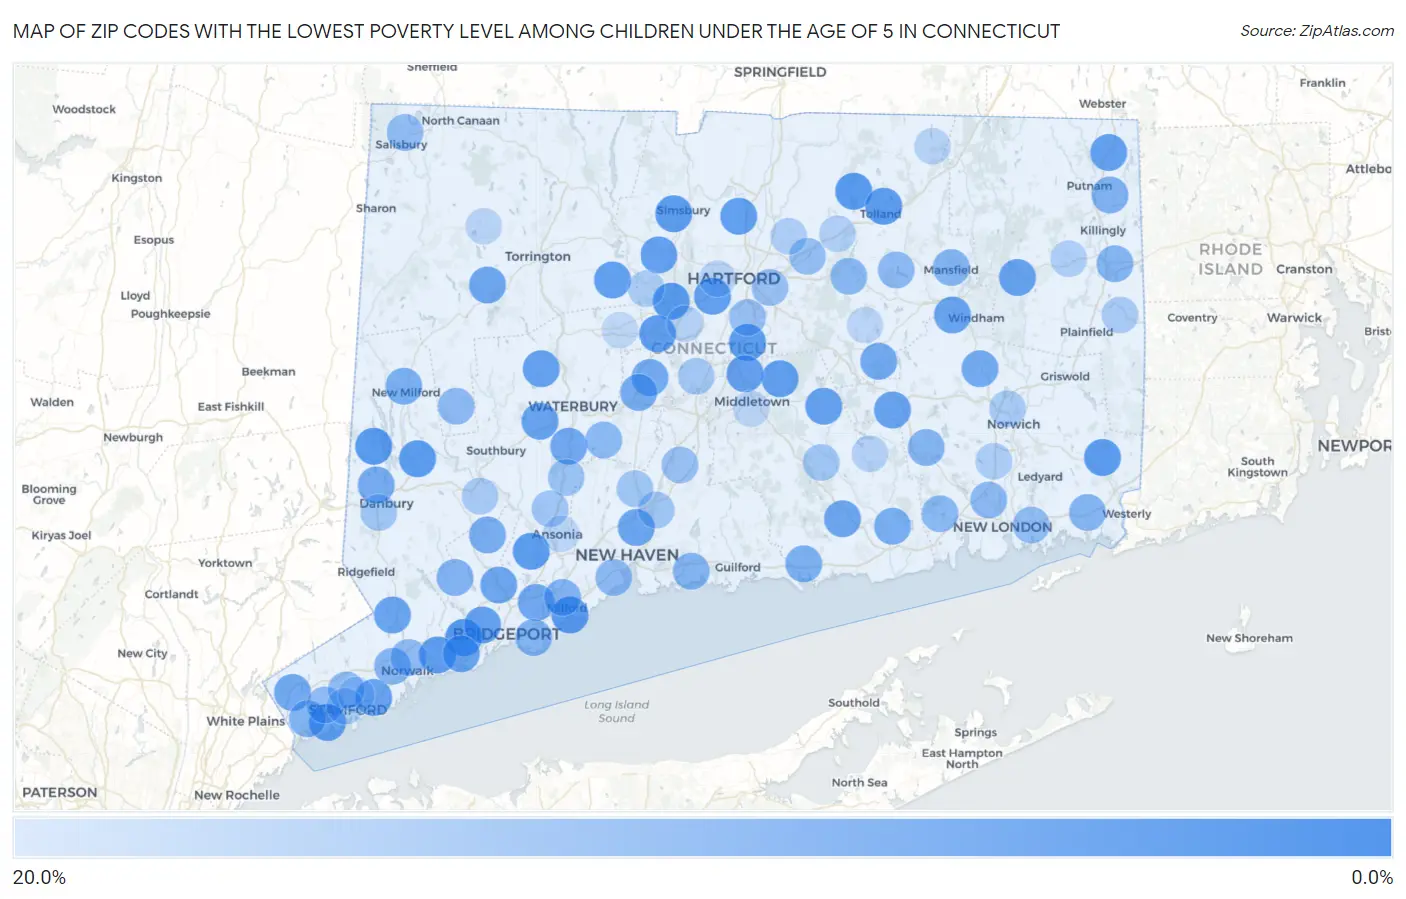
Zip Codes with the Lowest Poverty Level Among Children Under the Age of 5 in Connecticut
| Zip Code | Child Poverty | vs State | vs National | |
| 1. | 06824 | 0.85% | 14.1%(-13.2)#1 | 18.1%(-17.2)#199 |
| 2. | 06029 | 1.1% | 14.1%(-12.9)#2 | 18.1%(-16.9)#342 |
| 3. | 06460 | 1.1% | 14.1%(-12.9)#3 | 18.1%(-16.9)#344 |
| 4. | 06812 | 1.2% | 14.1%(-12.9)#4 | 18.1%(-16.9)#380 |
| 5. | 06032 | 1.2% | 14.1%(-12.9)#5 | 18.1%(-16.9)#382 |
| 6. | 06804 | 1.5% | 14.1%(-12.6)#6 | 18.1%(-16.6)#519 |
| 7. | 06359 | 1.6% | 14.1%(-12.5)#7 | 18.1%(-16.5)#577 |
| 8. | 06070 | 1.8% | 14.1%(-12.3)#8 | 18.1%(-16.3)#691 |
| 9. | 06484 | 1.8% | 14.1%(-12.3)#9 | 18.1%(-16.3)#713 |
| 10. | 06067 | 1.9% | 14.1%(-12.2)#10 | 18.1%(-16.2)#743 |
| 11. | 06084 | 1.9% | 14.1%(-12.2)#11 | 18.1%(-16.2)#773 |
| 12. | 06062 | 2.1% | 14.1%(-12.0)#12 | 18.1%(-16.0)#899 |
| 13. | 06880 | 2.2% | 14.1%(-11.9)#13 | 18.1%(-15.9)#955 |
| 14. | 06095 | 2.3% | 14.1%(-11.7)#14 | 18.1%(-15.7)#1,056 |
| 15. | 06013 | 2.4% | 14.1%(-11.7)#15 | 18.1%(-15.7)#1,062 |
| 16. | 06110 | 2.4% | 14.1%(-11.7)#16 | 18.1%(-15.7)#1,099 |
| 17. | 06480 | 2.5% | 14.1%(-11.6)#17 | 18.1%(-15.6)#1,145 |
| 18. | 06277 | 2.7% | 14.1%(-11.4)#18 | 18.1%(-15.4)#1,305 |
| 19. | 06878 | 2.7% | 14.1%(-11.3)#19 | 18.1%(-15.3)#1,326 |
| 20. | 06001 | 2.8% | 14.1%(-11.3)#20 | 18.1%(-15.3)#1,345 |
| 21. | 06424 | 3.0% | 14.1%(-11.0)#21 | 18.1%(-15.0)#1,535 |
| 22. | 06416 | 3.1% | 14.1%(-10.9)#22 | 18.1%(-14.9)#1,595 |
| 23. | 06825 | 3.1% | 14.1%(-10.9)#23 | 18.1%(-14.9)#1,598 |
| 24. | 06795 | 3.2% | 14.1%(-10.9)#24 | 18.1%(-14.9)#1,637 |
| 25. | 06247 | 3.2% | 14.1%(-10.9)#25 | 18.1%(-14.8)#1,653 |
| 26. | 06820 | 3.2% | 14.1%(-10.8)#26 | 18.1%(-14.8)#1,670 |
| 27. | 06890 | 3.3% | 14.1%(-10.8)#27 | 18.1%(-14.8)#1,698 |
| 28. | 06762 | 3.4% | 14.1%(-10.7)#28 | 18.1%(-14.7)#1,747 |
| 29. | 06415 | 3.5% | 14.1%(-10.6)#29 | 18.1%(-14.6)#1,807 |
| 30. | 06897 | 3.8% | 14.1%(-10.3)#30 | 18.1%(-14.3)#1,998 |
| 31. | 06226 | 3.8% | 14.1%(-10.3)#31 | 18.1%(-14.3)#2,010 |
| 32. | 06517 | 3.9% | 14.1%(-10.2)#32 | 18.1%(-14.2)#2,085 |
| 33. | 06611 | 4.2% | 14.1%(-9.90)#33 | 18.1%(-13.9)#2,320 |
| 34. | 06759 | 4.2% | 14.1%(-9.85)#34 | 18.1%(-13.8)#2,359 |
| 35. | 06417 | 4.3% | 14.1%(-9.77)#35 | 18.1%(-13.8)#2,416 |
| 36. | 06770 | 4.6% | 14.1%(-9.47)#36 | 18.1%(-13.5)#2,644 |
| 37. | 06614 | 4.8% | 14.1%(-9.32)#37 | 18.1%(-13.3)#2,728 |
| 38. | 06231 | 4.9% | 14.1%(-9.20)#38 | 18.1%(-13.2)#2,815 |
| 39. | 06831 | 5.0% | 14.1%(-9.06)#39 | 18.1%(-13.0)#2,925 |
| 40. | 06489 | 5.2% | 14.1%(-8.90)#40 | 18.1%(-12.9)#3,029 |
| 41. | 06254 | 5.3% | 14.1%(-8.78)#41 | 18.1%(-12.8)#3,096 |
| 42. | 06479 | 5.6% | 14.1%(-8.49)#42 | 18.1%(-12.5)#3,315 |
| 43. | 06811 | 5.6% | 14.1%(-8.44)#43 | 18.1%(-12.4)#3,342 |
| 44. | 06468 | 5.9% | 14.1%(-8.14)#44 | 18.1%(-12.1)#3,558 |
| 45. | 06371 | 6.3% | 14.1%(-7.78)#45 | 18.1%(-11.8)#3,810 |
| 46. | 06776 | 6.3% | 14.1%(-7.77)#46 | 18.1%(-11.8)#3,830 |
| 47. | 06413 | 6.6% | 14.1%(-7.52)#47 | 18.1%(-11.5)#3,982 |
| 48. | 06830 | 7.0% | 14.1%(-7.08)#48 | 18.1%(-11.1)#4,288 |
| 49. | 06260 | 7.1% | 14.1%(-7.00)#49 | 18.1%(-11.0)#4,334 |
| 50. | 06612 | 7.4% | 14.1%(-6.72)#50 | 18.1%(-10.7)#4,508 |
| 51. | 06461 | 7.4% | 14.1%(-6.63)#51 | 18.1%(-10.6)#4,576 |
| 52. | 06405 | 7.6% | 14.1%(-6.48)#52 | 18.1%(-10.5)#4,669 |
| 53. | 06239 | 7.6% | 14.1%(-6.45)#53 | 18.1%(-10.4)#4,686 |
| 54. | 06420 | 7.6% | 14.1%(-6.44)#54 | 18.1%(-10.4)#4,691 |
| 55. | 06378 | 7.6% | 14.1%(-6.43)#55 | 18.1%(-10.4)#4,696 |
| 56. | 06250 | 7.7% | 14.1%(-6.39)#56 | 18.1%(-10.4)#4,722 |
| 57. | 06615 | 7.8% | 14.1%(-6.30)#57 | 18.1%(-10.3)#4,780 |
| 58. | 06850 | 8.0% | 14.1%(-6.11)#58 | 18.1%(-10.1)#4,892 |
| 59. | 06043 | 8.2% | 14.1%(-5.87)#59 | 18.1%(-9.85)#5,043 |
| 60. | 06333 | 8.7% | 14.1%(-5.36)#60 | 18.1%(-9.34)#5,418 |
| 61. | 06712 | 8.8% | 14.1%(-5.29)#61 | 18.1%(-9.27)#5,463 |
| 62. | 06516 | 8.9% | 14.1%(-5.21)#62 | 18.1%(-9.19)#5,523 |
| 63. | 06783 | 8.9% | 14.1%(-5.15)#63 | 18.1%(-9.13)#5,561 |
| 64. | 06375 | 9.0% | 14.1%(-5.10)#64 | 18.1%(-9.09)#5,596 |
| 65. | 06238 | 9.1% | 14.1%(-4.94)#65 | 18.1%(-8.92)#5,715 |
| 66. | 06851 | 9.3% | 14.1%(-4.74)#66 | 18.1%(-8.72)#5,845 |
| 67. | 06807 | 9.4% | 14.1%(-4.72)#67 | 18.1%(-8.71)#5,854 |
| 68. | 06905 | 9.5% | 14.1%(-4.63)#68 | 18.1%(-8.61)#5,911 |
| 69. | 06068 | 9.8% | 14.1%(-4.26)#69 | 18.1%(-8.24)#6,147 |
| 70. | 06340 | 9.9% | 14.1%(-4.17)#70 | 18.1%(-8.15)#6,190 |
| 71. | 06042 | 10.4% | 14.1%(-3.71)#71 | 18.1%(-7.69)#6,489 |
| 72. | 06118 | 10.5% | 14.1%(-3.62)#72 | 18.1%(-7.61)#6,524 |
| 73. | 06109 | 10.5% | 14.1%(-3.55)#73 | 18.1%(-7.53)#6,580 |
| 74. | 06492 | 10.6% | 14.1%(-3.45)#74 | 18.1%(-7.44)#6,632 |
| 75. | 06403 | 11.3% | 14.1%(-2.79)#75 | 18.1%(-6.78)#7,016 |
| 76. | 06483 | 11.9% | 14.1%(-2.16)#76 | 18.1%(-6.14)#7,410 |
| 77. | 06473 | 12.0% | 14.1%(-2.11)#77 | 18.1%(-6.09)#7,440 |
| 78. | 06518 | 12.0% | 14.1%(-2.08)#78 | 18.1%(-6.07)#7,448 |
| 79. | 06438 | 12.0% | 14.1%(-2.08)#79 | 18.1%(-6.06)#7,452 |
| 80. | 06810 | 12.1% | 14.1%(-1.98)#80 | 18.1%(-5.96)#7,524 |
| 81. | 06037 | 12.3% | 14.1%(-1.76)#81 | 18.1%(-5.75)#7,641 |
| 82. | 06482 | 13.0% | 14.1%(-1.10)#82 | 18.1%(-5.09)#8,029 |
| 83. | 06354 | 13.3% | 14.1%(-0.803)#83 | 18.1%(-4.79)#8,198 |
| 84. | 06360 | 13.5% | 14.1%(-0.620)#84 | 18.1%(-4.61)#8,321 |
| 85. | 06382 | 13.6% | 14.1%(-0.513)#85 | 18.1%(-4.50)#8,379 |
| 86. | 06085 | 13.7% | 14.1%(-0.417)#86 | 18.1%(-4.40)#8,442 |
| 87. | 06902 | 13.8% | 14.1%(-0.322)#87 | 18.1%(-4.31)#8,485 |
| 88. | 06234 | 13.9% | 14.1%(-0.221)#88 | 18.1%(-4.21)#8,558 |
| 89. | 06074 | 14.0% | 14.1%(-0.052)#89 | 18.1%(-4.04)#8,650 |
| 90. | 06066 | 14.2% | 14.1%(+0.161)#90 | 18.1%(-3.82)#8,757 |
| 91. | 06053 | 14.9% | 14.1%(+0.780)#91 | 18.1%(-3.20)#9,120 |
| 92. | 06423 | 14.9% | 14.1%(+0.787)#92 | 18.1%(-3.20)#9,125 |
| 93. | 06119 | 15.3% | 14.1%(+1.24)#93 | 18.1%(-2.75)#9,386 |
| 94. | 06076 | 15.4% | 14.1%(+1.32)#94 | 18.1%(-2.66)#9,458 |
| 95. | 06756 | 15.5% | 14.1%(+1.40)#95 | 18.1%(-2.59)#9,491 |
| 96. | 06906 | 15.9% | 14.1%(+1.83)#96 | 18.1%(-2.15)#9,717 |
| 97. | 06401 | 16.2% | 14.1%(+2.10)#97 | 18.1%(-1.89)#9,849 |
| 98. | 06457 | 16.2% | 14.1%(+2.10)#98 | 18.1%(-1.88)#9,852 |
| 99. | 06248 | 16.3% | 14.1%(+2.21)#99 | 18.1%(-1.77)#9,913 |
| 100. | 06010 | 16.5% | 14.1%(+2.42)#100 | 18.1%(-1.56)#10,029 |
Common Questions
What are the Top 10 Zip Codes with the Lowest Poverty Level Among Children Under the Age of 5 in Connecticut?
Top 10 Zip Codes with the Lowest Poverty Level Among Children Under the Age of 5 in Connecticut are:
What zip code has the Lowest Poverty Level Among Children Under the Age of 5 in Connecticut?
06824 has the Lowest Poverty Level Among Children Under the Age of 5 in Connecticut with 0.85%.
What is the Poverty Level Among Children Under the Age of 5 in the State of Connecticut?
Poverty Level Among Children Under the Age of 5 in Connecticut is 14.1%.
What is the Poverty Level Among Children Under the Age of 5 in the United States?
Poverty Level Among Children Under the Age of 5 in the United States is 18.1%.