Mount Eaton, OH Map & Demographics
Mount Eaton Map
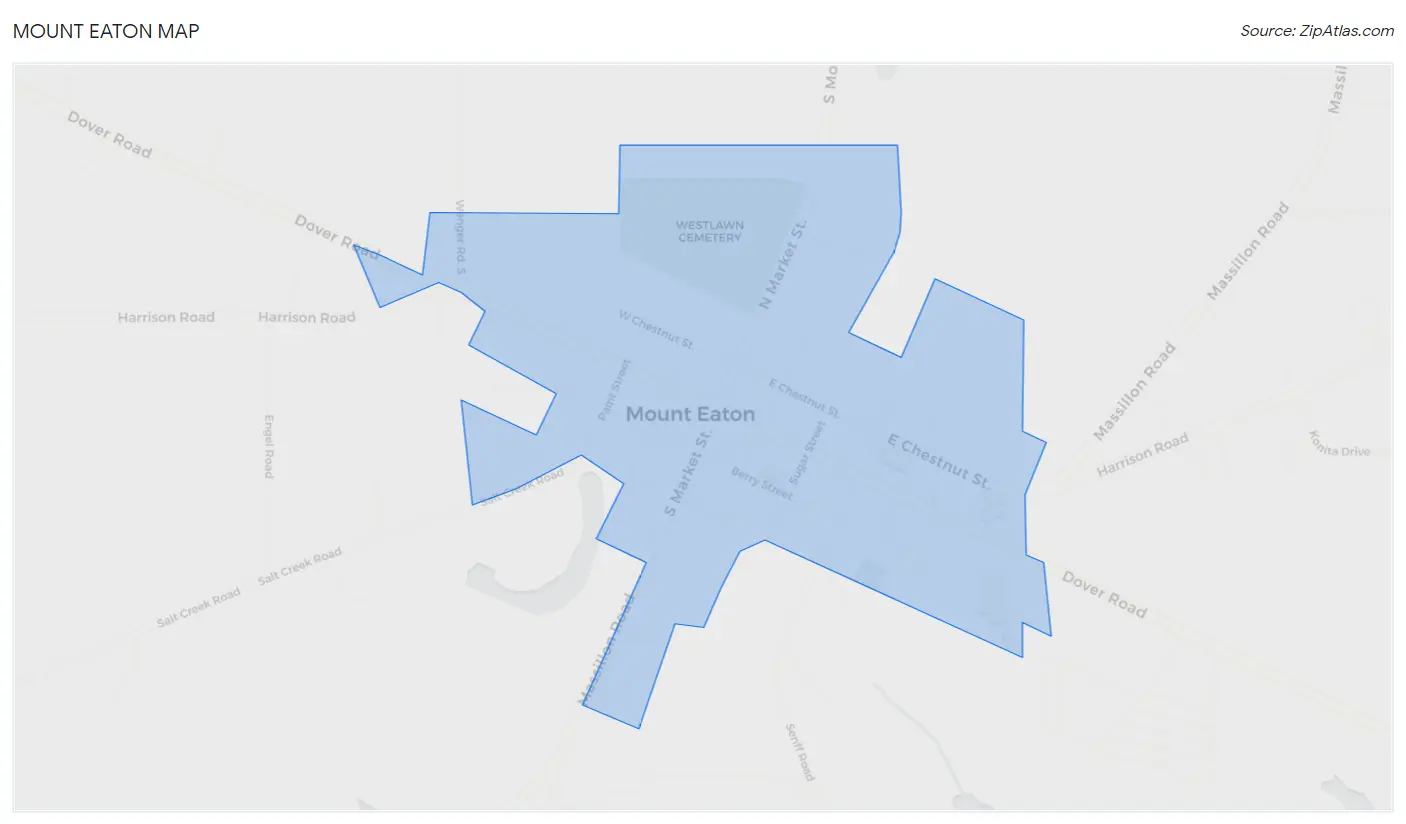
Mount Eaton Overview
$30,597
PER CAPITA INCOME
$69,750
AVG FAMILY INCOME
$66,250
AVG HOUSEHOLD INCOME
0.36
INEQUALITY / GINI INDEX
128
TOTAL POPULATION
62
MALE POPULATION
66
FEMALE POPULATION
93.94
MALES / 100 FEMALES
106.45
FEMALES / 100 MALES
35.6
MEDIAN AGE
3.0
AVG FAMILY SIZE
2.4
AVG HOUSEHOLD SIZE
90
LABOR FORCE [ PEOPLE ]
90.0%
PERCENT IN LABOR FORCE
4.4%
UNEMPLOYMENT RATE
Mount Eaton Zip Codes
Income in Mount Eaton
Income Overview in Mount Eaton
Per Capita Income in Mount Eaton is $30,597, while median incomes of families and households are $69,750 and $66,250 respectively.
| Characteristic | Number | Measure |
| Per Capita Income | 128 | $30,597 |
| Median Family Income | 37 | $69,750 |
| Mean Family Income | 37 | $90,516 |
| Median Household Income | 53 | $66,250 |
| Mean Household Income | 53 | $72,328 |
| Income Deficit | 37 | $0 |
| Wage / Income Gap (%) | 128 | 0.00% |
| Wage / Income Gap ($) | 128 | 100.00¢ per $1 |
| Gini / Inequality Index | 128 | 0.36 |
Earnings by Sex in Mount Eaton
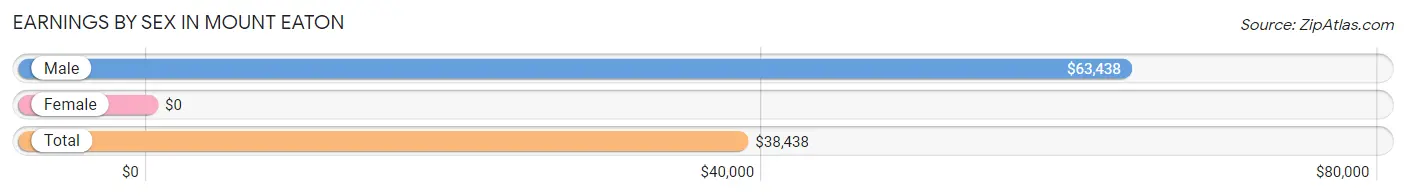
| Sex | Number | Average Earnings |
| Male | 39 (42.9%) | $63,438 |
| Female | 52 (57.1%) | $0 |
| Total | 91 (100.0%) | $38,438 |
Earnings by Sex by Income Bracket in Mount Eaton
The most common earnings brackets in Mount Eaton are $55,000 to $64,999 for men (12 | 30.8%) and $2,500 to $4,999 for women (10 | 19.2%).
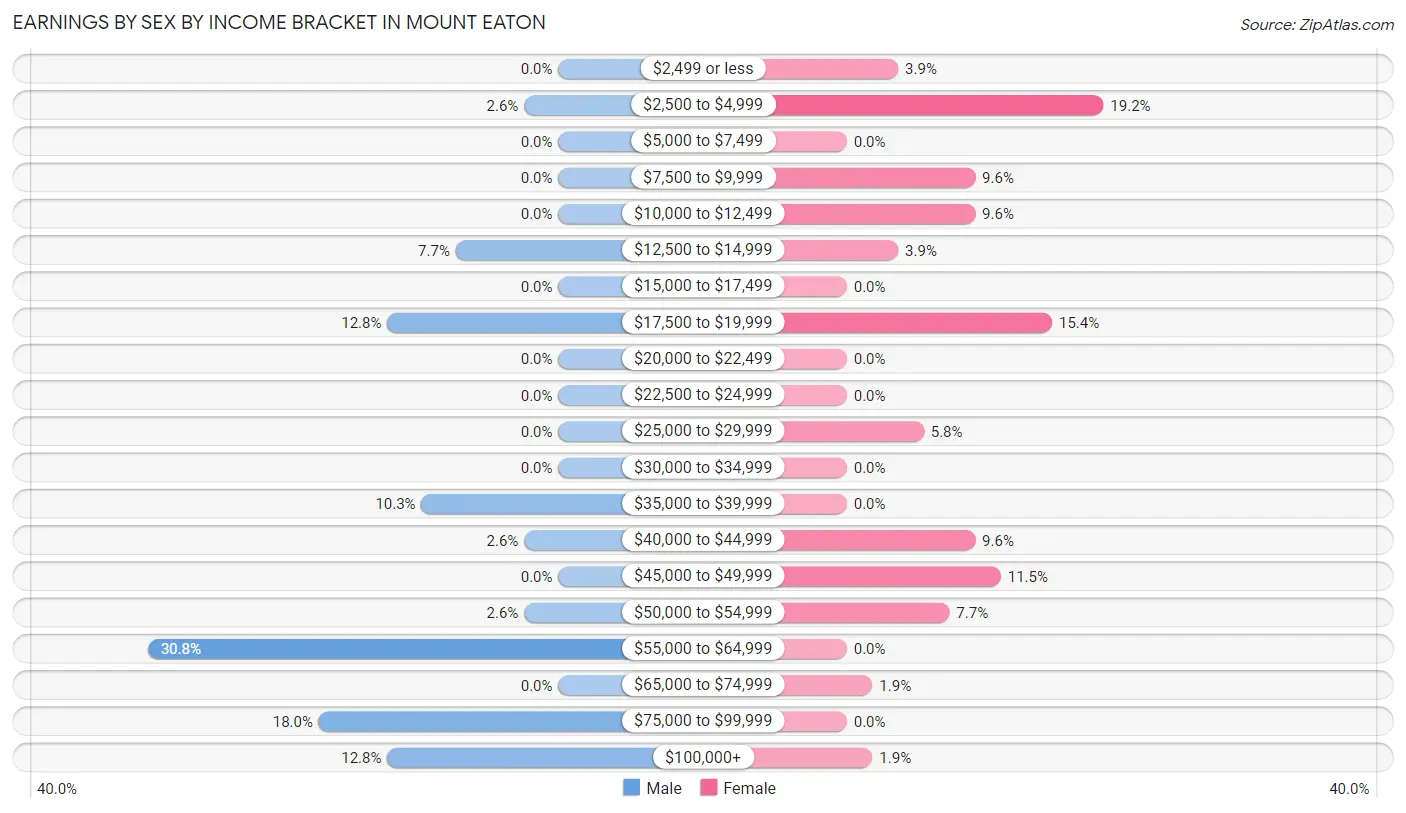
| Income | Male | Female |
| $2,499 or less | 0 (0.0%) | 2 (3.8%) |
| $2,500 to $4,999 | 1 (2.6%) | 10 (19.2%) |
| $5,000 to $7,499 | 0 (0.0%) | 0 (0.0%) |
| $7,500 to $9,999 | 0 (0.0%) | 5 (9.6%) |
| $10,000 to $12,499 | 0 (0.0%) | 5 (9.6%) |
| $12,500 to $14,999 | 3 (7.7%) | 2 (3.8%) |
| $15,000 to $17,499 | 0 (0.0%) | 0 (0.0%) |
| $17,500 to $19,999 | 5 (12.8%) | 8 (15.4%) |
| $20,000 to $22,499 | 0 (0.0%) | 0 (0.0%) |
| $22,500 to $24,999 | 0 (0.0%) | 0 (0.0%) |
| $25,000 to $29,999 | 0 (0.0%) | 3 (5.8%) |
| $30,000 to $34,999 | 0 (0.0%) | 0 (0.0%) |
| $35,000 to $39,999 | 4 (10.3%) | 0 (0.0%) |
| $40,000 to $44,999 | 1 (2.6%) | 5 (9.6%) |
| $45,000 to $49,999 | 0 (0.0%) | 6 (11.5%) |
| $50,000 to $54,999 | 1 (2.6%) | 4 (7.7%) |
| $55,000 to $64,999 | 12 (30.8%) | 0 (0.0%) |
| $65,000 to $74,999 | 0 (0.0%) | 1 (1.9%) |
| $75,000 to $99,999 | 7 (17.9%) | 0 (0.0%) |
| $100,000+ | 5 (12.8%) | 1 (1.9%) |
| Total | 39 (100.0%) | 52 (100.0%) |
Earnings by Sex by Educational Attainment in Mount Eaton
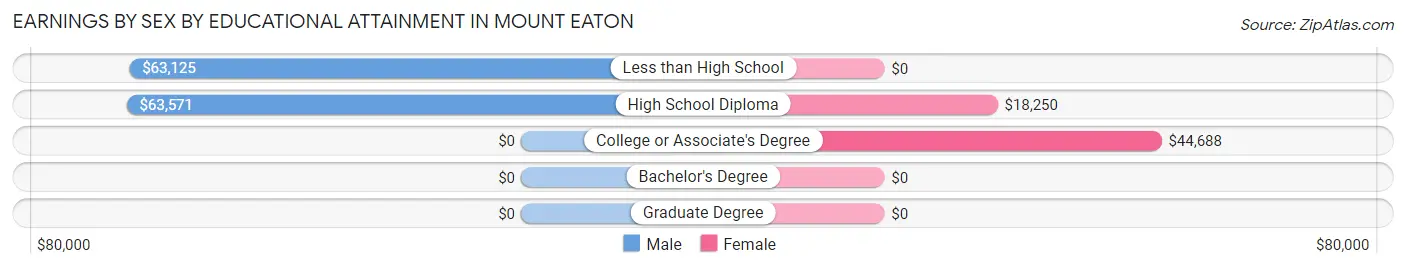
| Educational Attainment | Male Income | Female Income |
| Less than High School | $63,125 | $0 |
| High School Diploma | $63,571 | $18,250 |
| College or Associate's Degree | - | - |
| Bachelor's Degree | - | - |
| Graduate Degree | - | - |
| Total | $63,438 | $0 |
Family Income in Mount Eaton
Family Income Brackets in Mount Eaton
According to the Mount Eaton family income data, there are 12 families falling into the $100,000 to $149,999 income range, which is the most common income bracket and makes up 32.4% of all families.
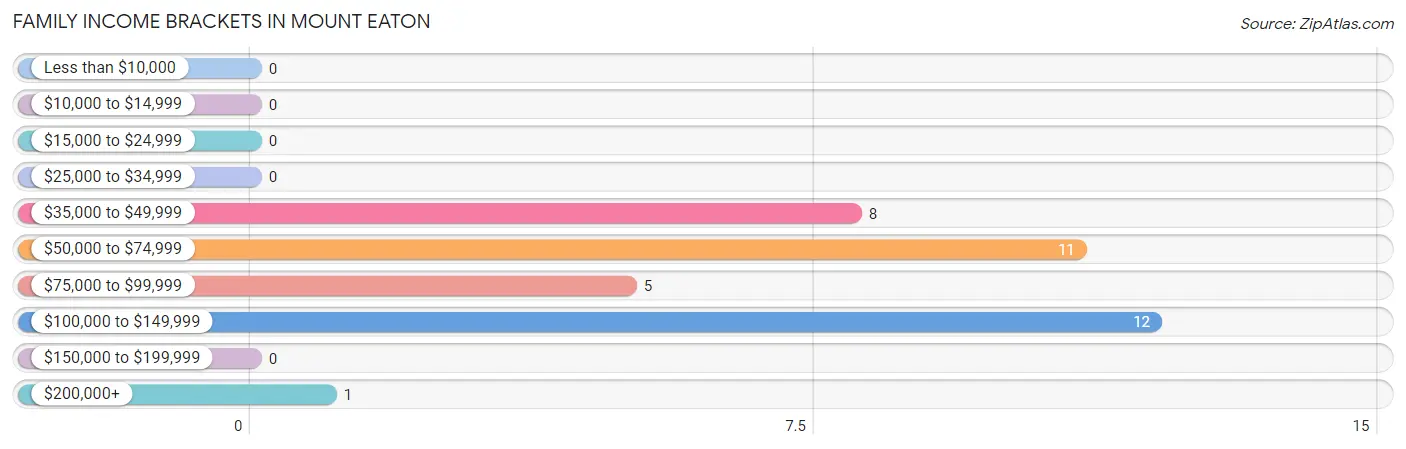
| Income Bracket | # Families | % Families |
| Less than $10,000 | 0 | 0.0% |
| $10,000 to $14,999 | 0 | 0.0% |
| $15,000 to $24,999 | 0 | 0.0% |
| $25,000 to $34,999 | 0 | 0.0% |
| $35,000 to $49,999 | 8 | 21.6% |
| $50,000 to $74,999 | 11 | 29.7% |
| $75,000 to $99,999 | 5 | 13.5% |
| $100,000 to $149,999 | 12 | 32.4% |
| $150,000 to $199,999 | 0 | 0.0% |
| $200,000+ | 1 | 2.7% |
Family Income by Famaliy Size in Mount Eaton
5-person families (9 | 24.3%) account for the highest median family income in Mount Eaton with $142,750 per family, while 5-person families (9 | 24.3%) have the highest median income of $28,550 per family member.
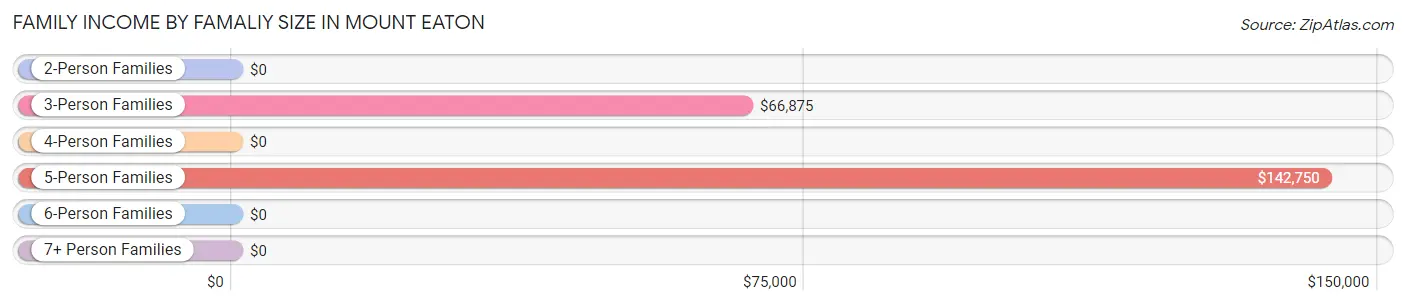
| Income Bracket | # Families | Median Income |
| 2-Person Families | 19 (51.3%) | $0 |
| 3-Person Families | 9 (24.3%) | $66,875 |
| 4-Person Families | 0 (0.0%) | $0 |
| 5-Person Families | 9 (24.3%) | $142,750 |
| 6-Person Families | 0 (0.0%) | $0 |
| 7+ Person Families | 0 (0.0%) | $0 |
| Total | 37 (100.0%) | $69,750 |
Family Income by Number of Earners in Mount Eaton
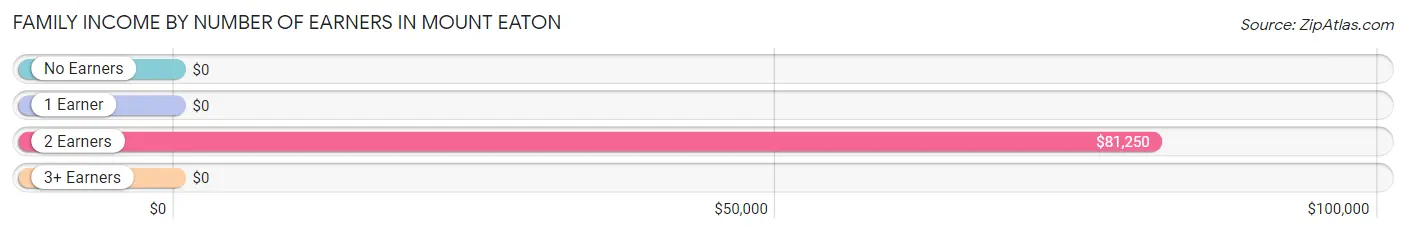
| Number of Earners | # Families | Median Income |
| No Earners | 0 (0.0%) | $0 |
| 1 Earner | 10 (27.0%) | $0 |
| 2 Earners | 21 (56.8%) | $81,250 |
| 3+ Earners | 6 (16.2%) | $0 |
| Total | 37 (100.0%) | $69,750 |
Household Income in Mount Eaton
Household Income Brackets in Mount Eaton
With 16 households falling in the category, the $50,000 to $74,999 income range is the most frequent in Mount Eaton, accounting for 30.2% of all households.
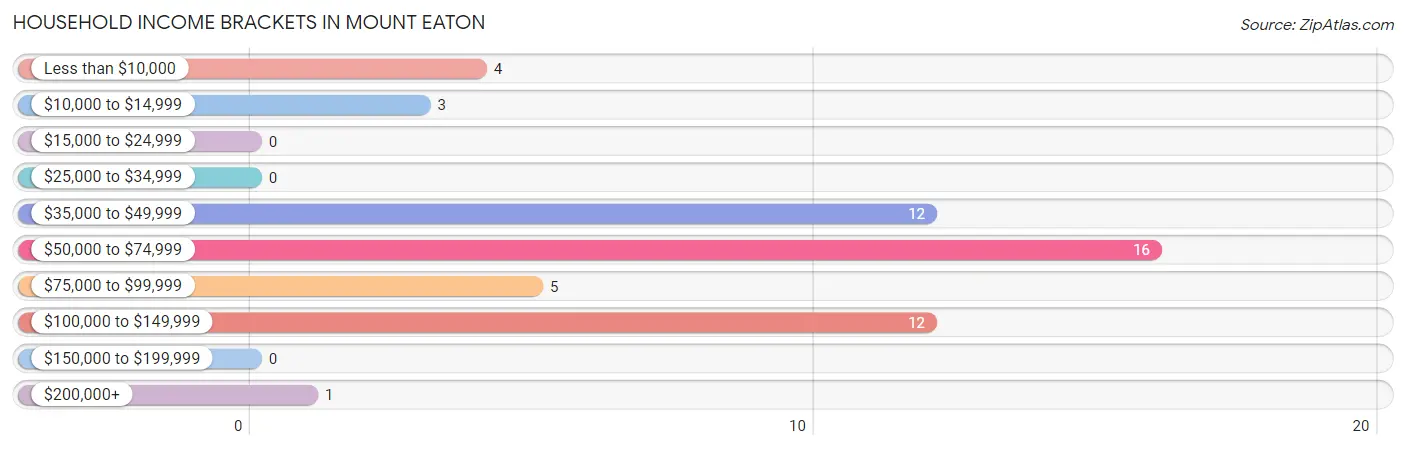
| Income Bracket | # Households | % Households |
| Less than $10,000 | 4 | 7.5% |
| $10,000 to $14,999 | 3 | 5.7% |
| $15,000 to $24,999 | 0 | 0.0% |
| $25,000 to $34,999 | 0 | 0.0% |
| $35,000 to $49,999 | 12 | 22.6% |
| $50,000 to $74,999 | 16 | 30.2% |
| $75,000 to $99,999 | 5 | 9.4% |
| $100,000 to $149,999 | 12 | 22.6% |
| $150,000 to $199,999 | 0 | 0.0% |
| $200,000+ | 1 | 1.9% |
Household Income by Householder Age in Mount Eaton
The median household income in Mount Eaton is $66,250, with the highest median household income of $80,417 found in the 25 to 44 years age bracket for the primary householder. A total of 23 households (43.4%) fall into this category. Meanwhile, the 15 to 24 years age bracket for the primary householder has the lowest median household income of $0, with 1 households (1.9%) in this group.
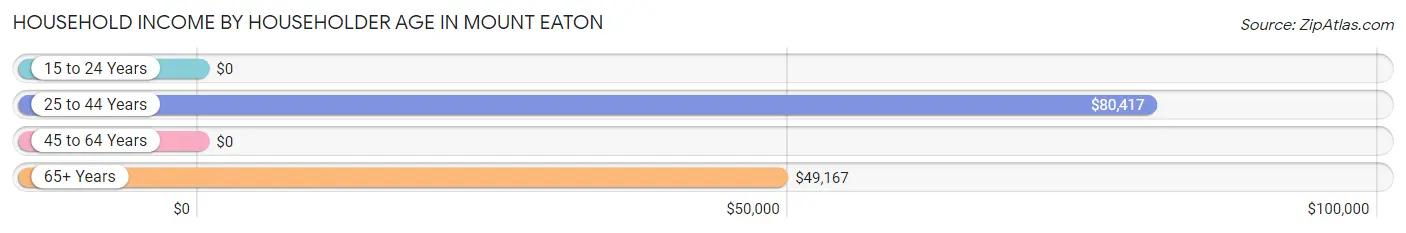
| Income Bracket | # Households | Median Income |
| 15 to 24 Years | 1 (1.9%) | $0 |
| 25 to 44 Years | 23 (43.4%) | $80,417 |
| 45 to 64 Years | 19 (35.8%) | $0 |
| 65+ Years | 10 (18.9%) | $49,167 |
| Total | 53 (100.0%) | $66,250 |
Poverty in Mount Eaton
Income Below Poverty by Sex and Age in Mount Eaton
With 6.5% poverty level for males and 4.5% for females among the residents of Mount Eaton, 55 to 64 year old males and 65 to 74 year old females are the most vulnerable to poverty, with 4 males (80.0%) and 3 females (75.0%) in their respective age groups living below the poverty level.
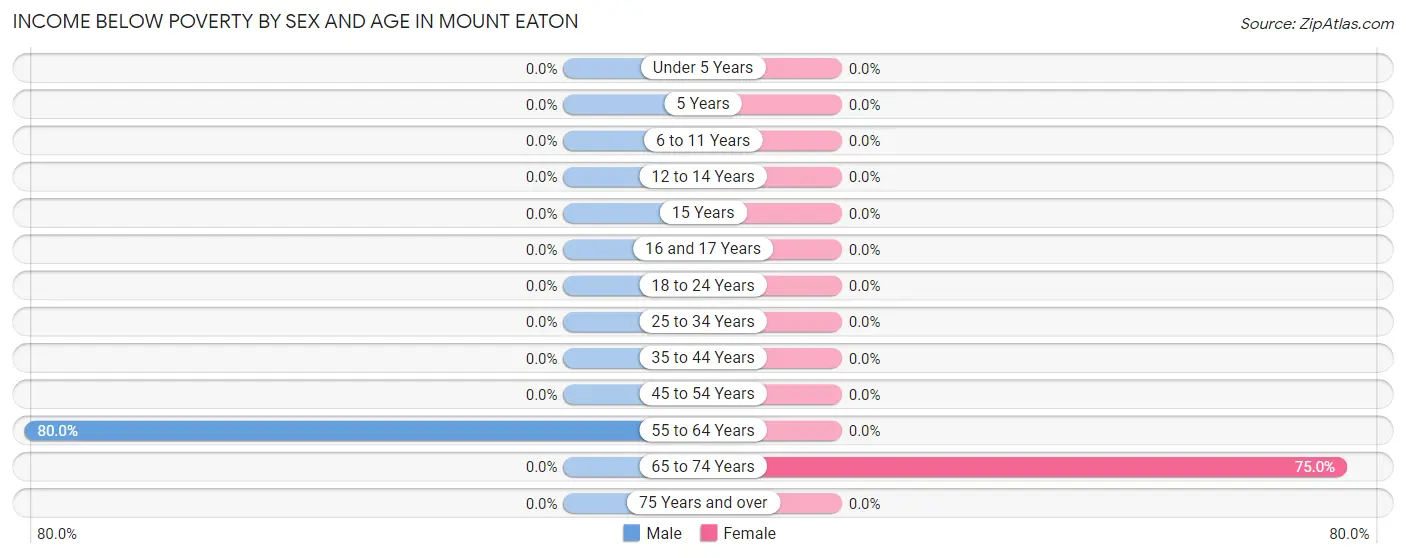
| Age Bracket | Male | Female |
| Under 5 Years | 0 (0.0%) | 0 (0.0%) |
| 5 Years | 0 (0.0%) | 0 (0.0%) |
| 6 to 11 Years | 0 (0.0%) | 0 (0.0%) |
| 12 to 14 Years | 0 (0.0%) | 0 (0.0%) |
| 15 Years | 0 (0.0%) | 0 (0.0%) |
| 16 and 17 Years | 0 (0.0%) | 0 (0.0%) |
| 18 to 24 Years | 0 (0.0%) | 0 (0.0%) |
| 25 to 34 Years | 0 (0.0%) | 0 (0.0%) |
| 35 to 44 Years | 0 (0.0%) | 0 (0.0%) |
| 45 to 54 Years | 0 (0.0%) | 0 (0.0%) |
| 55 to 64 Years | 4 (80.0%) | 0 (0.0%) |
| 65 to 74 Years | 0 (0.0%) | 3 (75.0%) |
| 75 Years and over | 0 (0.0%) | 0 (0.0%) |
| Total | 4 (6.5%) | 3 (4.5%) |
Income Above Poverty by Sex and Age in Mount Eaton
According to the poverty statistics in Mount Eaton, males aged under 5 years and females aged under 5 years are the age groups that are most secure financially, with 100.0% of males and 100.0% of females in these age groups living above the poverty line.
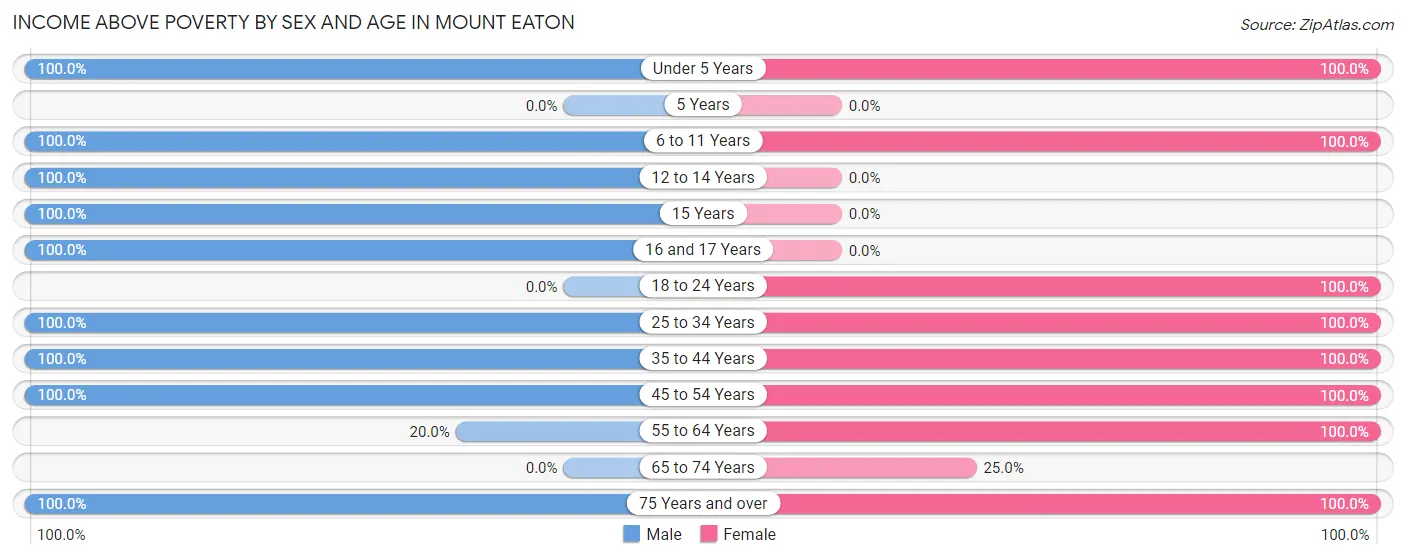
| Age Bracket | Male | Female |
| Under 5 Years | 3 (100.0%) | 1 (100.0%) |
| 5 Years | 0 (0.0%) | 0 (0.0%) |
| 6 to 11 Years | 1 (100.0%) | 9 (100.0%) |
| 12 to 14 Years | 8 (100.0%) | 0 (0.0%) |
| 15 Years | 6 (100.0%) | 0 (0.0%) |
| 16 and 17 Years | 1 (100.0%) | 0 (0.0%) |
| 18 to 24 Years | 0 (0.0%) | 13 (100.0%) |
| 25 to 34 Years | 9 (100.0%) | 9 (100.0%) |
| 35 to 44 Years | 17 (100.0%) | 10 (100.0%) |
| 45 to 54 Years | 5 (100.0%) | 10 (100.0%) |
| 55 to 64 Years | 1 (20.0%) | 4 (100.0%) |
| 65 to 74 Years | 0 (0.0%) | 1 (25.0%) |
| 75 Years and over | 7 (100.0%) | 6 (100.0%) |
| Total | 58 (93.5%) | 63 (95.5%) |
Income Below Poverty Among Married-Couple Families in Mount Eaton
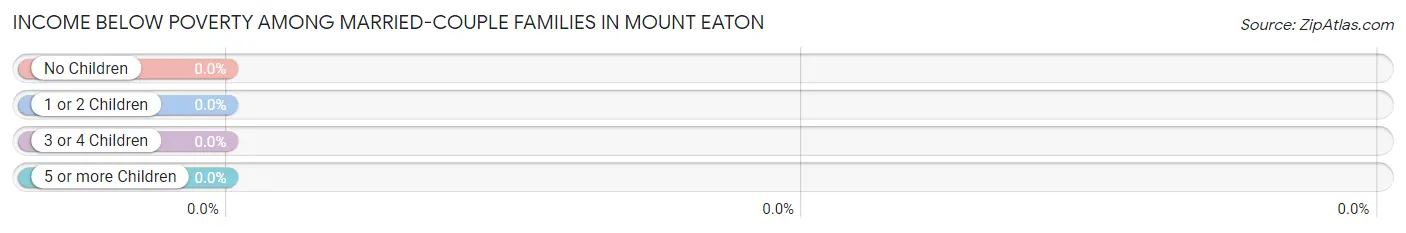
| Children | Above Poverty | Below Poverty |
| No Children | 19 (100.0%) | 0 (0.0%) |
| 1 or 2 Children | 2 (100.0%) | 0 (0.0%) |
| 3 or 4 Children | 4 (100.0%) | 0 (0.0%) |
| 5 or more Children | 0 (0.0%) | 0 (0.0%) |
| Total | 25 (100.0%) | 0 (0.0%) |
Income Below Poverty Among Single-Parent Households in Mount Eaton
| Children | Single Father | Single Mother |
| No Children | 0 (0.0%) | 0 (0.0%) |
| 1 or 2 Children | 0 (0.0%) | 0 (0.0%) |
| 3 or 4 Children | 0 (0.0%) | 0 (0.0%) |
| 5 or more Children | 0 (0.0%) | 0 (0.0%) |
| Total | 0 (0.0%) | 0 (0.0%) |
Income Below Poverty Among Married-Couple vs Single-Parent Households in Mount Eaton
| Children | Married-Couple Families | Single-Parent Households |
| No Children | 0 (0.0%) | 0 (0.0%) |
| 1 or 2 Children | 0 (0.0%) | 0 (0.0%) |
| 3 or 4 Children | 0 (0.0%) | 0 (0.0%) |
| 5 or more Children | 0 (0.0%) | 0 (0.0%) |
| Total | 0 (0.0%) | 0 (0.0%) |
Race in Mount Eaton
The most populous races in Mount Eaton are White / Caucasian (116 | 90.6%), and Two or more Races (12 | 9.4%).
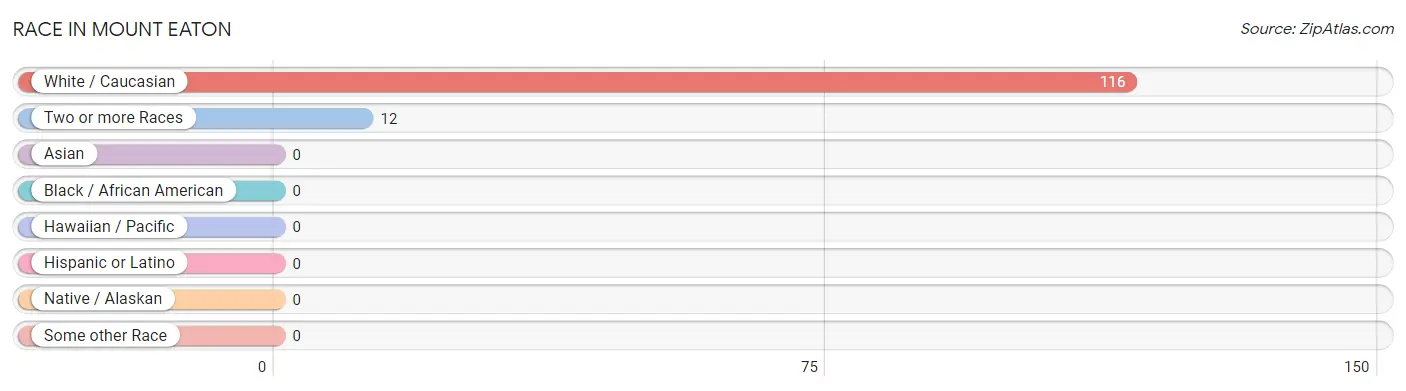
| Race | # Population | % Population |
| Asian | 0 | 0.0% |
| Black / African American | 0 | 0.0% |
| Hawaiian / Pacific | 0 | 0.0% |
| Hispanic or Latino | 0 | 0.0% |
| Native / Alaskan | 0 | 0.0% |
| White / Caucasian | 116 | 90.6% |
| Two or more Races | 12 | 9.4% |
| Some other Race | 0 | 0.0% |
| Total | 128 | 100.0% |
Ancestry in Mount Eaton
The most populous ancestries reported in Mount Eaton are German (52 | 40.6%), Swiss (29 | 22.7%), Irish (23 | 18.0%), Belizean (12 | 9.4%), and Dutch (3 | 2.3%), together accounting for 93.0% of all Mount Eaton residents.
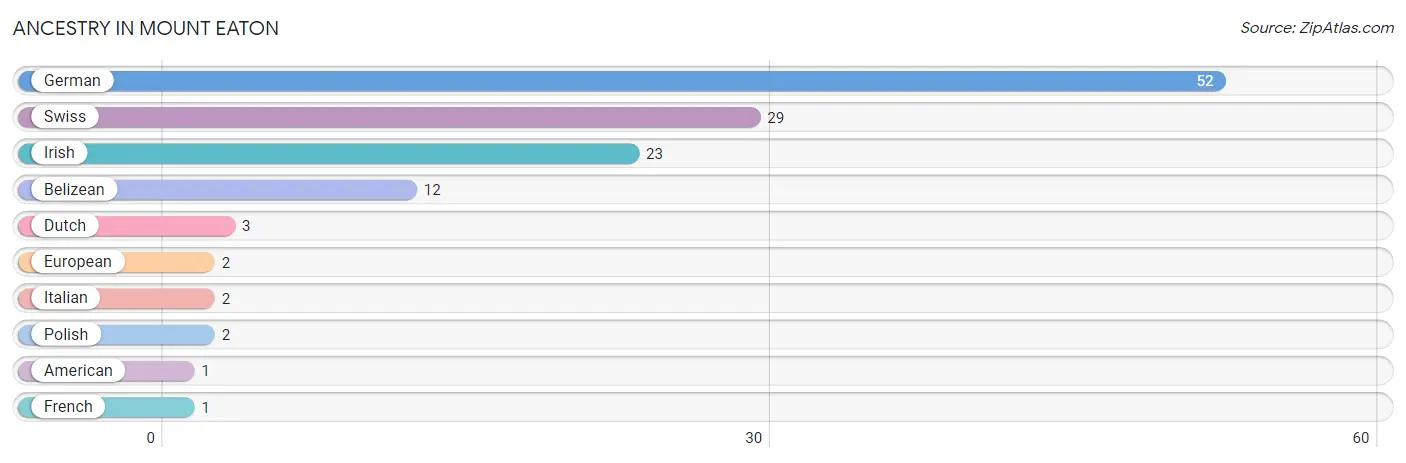
| Ancestry | # Population | % Population |
| American | 1 | 0.8% |
| Belizean | 12 | 9.4% |
| Dutch | 3 | 2.3% |
| European | 2 | 1.6% |
| French | 1 | 0.8% |
| German | 52 | 40.6% |
| Irish | 23 | 18.0% |
| Italian | 2 | 1.6% |
| Polish | 2 | 1.6% |
| Swiss | 29 | 22.7% | View All 10 Rows |
Immigrants in Mount Eaton

| Immigration Origin | # Population | % Population | View All 0 Rows |
Sex and Age in Mount Eaton
Sex and Age in Mount Eaton
The most populous age groups in Mount Eaton are 40 to 44 Years (12 | 19.4%) for men and 50 to 54 Years (10 | 15.1%) for women.
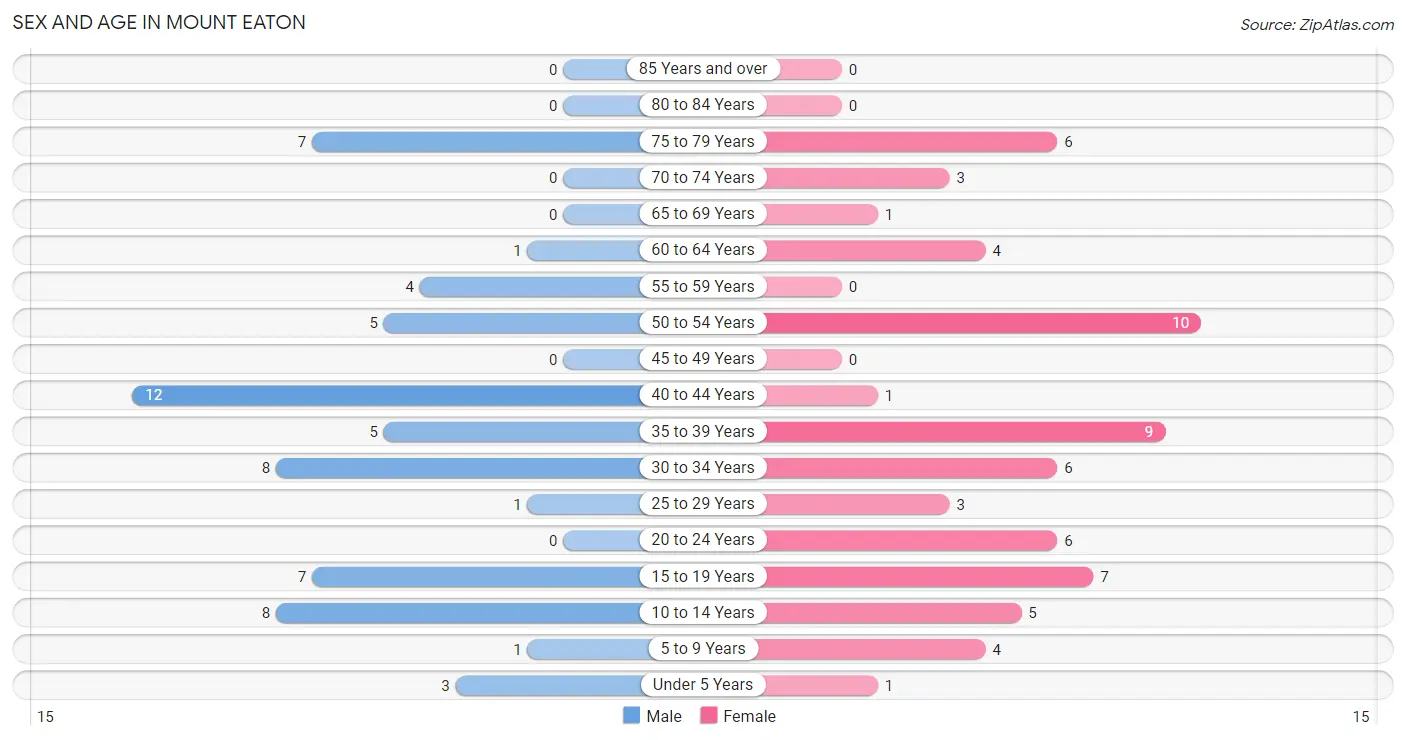
| Age Bracket | Male | Female |
| Under 5 Years | 3 (4.8%) | 1 (1.5%) |
| 5 to 9 Years | 1 (1.6%) | 4 (6.1%) |
| 10 to 14 Years | 8 (12.9%) | 5 (7.6%) |
| 15 to 19 Years | 7 (11.3%) | 7 (10.6%) |
| 20 to 24 Years | 0 (0.0%) | 6 (9.1%) |
| 25 to 29 Years | 1 (1.6%) | 3 (4.5%) |
| 30 to 34 Years | 8 (12.9%) | 6 (9.1%) |
| 35 to 39 Years | 5 (8.1%) | 9 (13.6%) |
| 40 to 44 Years | 12 (19.4%) | 1 (1.5%) |
| 45 to 49 Years | 0 (0.0%) | 0 (0.0%) |
| 50 to 54 Years | 5 (8.1%) | 10 (15.1%) |
| 55 to 59 Years | 4 (6.5%) | 0 (0.0%) |
| 60 to 64 Years | 1 (1.6%) | 4 (6.1%) |
| 65 to 69 Years | 0 (0.0%) | 1 (1.5%) |
| 70 to 74 Years | 0 (0.0%) | 3 (4.5%) |
| 75 to 79 Years | 7 (11.3%) | 6 (9.1%) |
| 80 to 84 Years | 0 (0.0%) | 0 (0.0%) |
| 85 Years and over | 0 (0.0%) | 0 (0.0%) |
| Total | 62 (100.0%) | 66 (100.0%) |
Families and Households in Mount Eaton
Median Family Size in Mount Eaton
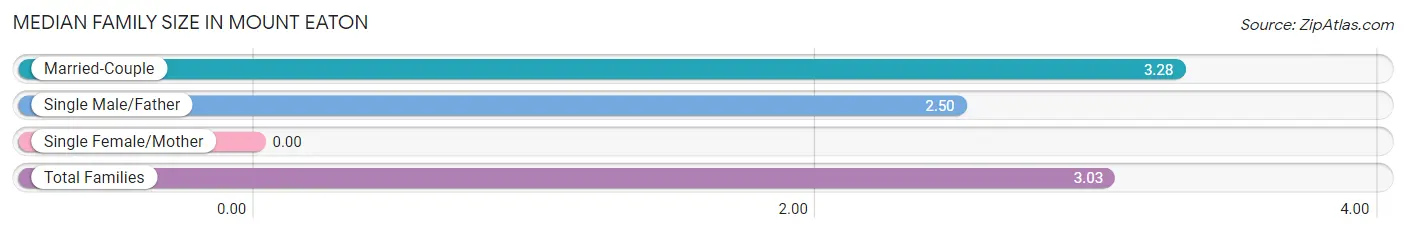
| Family Type | # Families | Family Size |
| Married-Couple | 25 (67.6%) | 3.28 |
| Single Male/Father | 12 (32.4%) | 2.50 |
| Single Female/Mother | 0 (0.0%) | - |
| Total Families | 37 (100.0%) | 3.03 |
Median Household Size in Mount Eaton
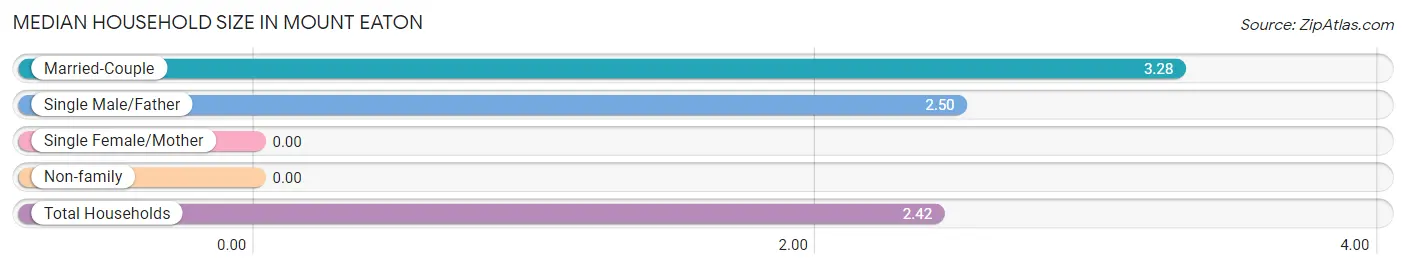
| Household Type | # Households | Household Size |
| Married-Couple | 25 (47.2%) | 3.28 |
| Single Male/Father | 12 (22.6%) | 2.50 |
| Single Female/Mother | 0 (0.0%) | - |
| Non-family | 16 (30.2%) | - |
| Total Households | 53 (100.0%) | 2.42 |
Household Size by Marriage Status in Mount Eaton
Out of a total of 53 households in Mount Eaton, 37 (69.8%) are family households, while 16 (30.2%) are nonfamily households. The most numerous type of family households are 2-person households, comprising 19, and the most common type of nonfamily households are 1-person households, comprising 16.
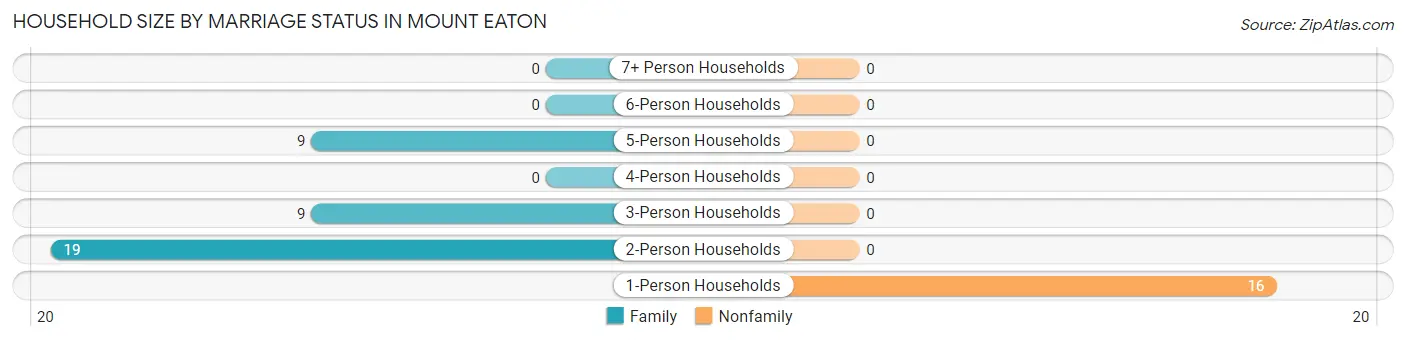
| Household Size | Family Households | Nonfamily Households |
| 1-Person Households | - | 16 (30.2%) |
| 2-Person Households | 19 (35.8%) | 0 (0.0%) |
| 3-Person Households | 9 (17.0%) | 0 (0.0%) |
| 4-Person Households | 0 (0.0%) | 0 (0.0%) |
| 5-Person Households | 9 (17.0%) | 0 (0.0%) |
| 6-Person Households | 0 (0.0%) | 0 (0.0%) |
| 7+ Person Households | 0 (0.0%) | 0 (0.0%) |
| Total | 37 (69.8%) | 16 (30.2%) |
Female Fertility in Mount Eaton
Fertility by Age in Mount Eaton
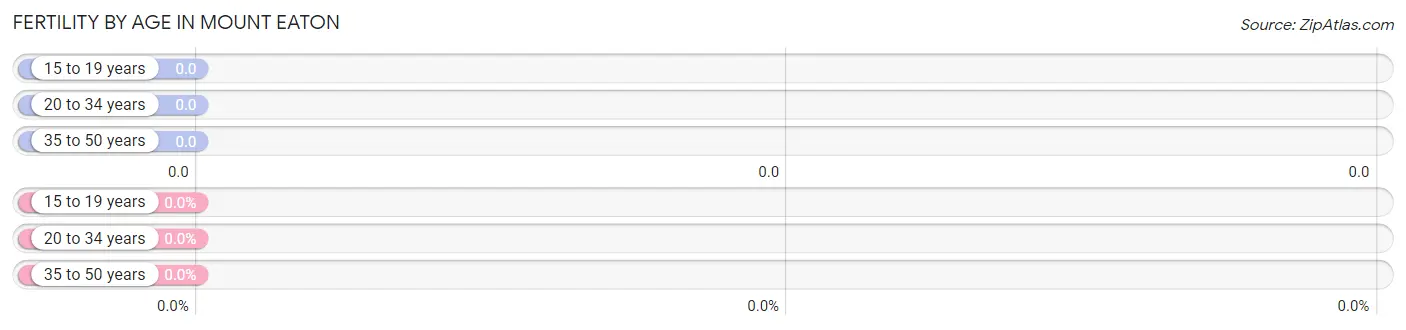
| Age Bracket | Women with Births | Births / 1,000 Women |
| 15 to 19 years | 0 (0.0%) | 0.0 |
| 20 to 34 years | 0 (0.0%) | 0.0 |
| 35 to 50 years | 0 (0.0%) | 0.0 |
| Total | 0 (0.0%) | 0.0 |
Fertility by Age by Marriage Status in Mount Eaton
| Age Bracket | Married | Unmarried |
| 15 to 19 years | 0 (0.0%) | 0 (0.0%) |
| 20 to 34 years | 0 (0.0%) | 0 (0.0%) |
| 35 to 50 years | 0 (0.0%) | 0 (0.0%) |
| Total | 0 (0.0%) | 0 (0.0%) |
Fertility by Education in Mount Eaton
| Educational Attainment | Women with Births | Births / 1,000 Women |
| Less than High School | 0 (0.0%) | 0.0 |
| High School Diploma | 0 (0.0%) | 0.0 |
| College or Associate's Degree | 0 (0.0%) | 0.0 |
| Bachelor's Degree | 0 (0.0%) | 0.0 |
| Graduate Degree | 0 (0.0%) | 0.0 |
| Total | 0 (0.0%) | 0.0 |
Fertility by Education by Marriage Status in Mount Eaton
| Educational Attainment | Married | Unmarried |
| Less than High School | 0 (0.0%) | 0 (0.0%) |
| High School Diploma | 0 (0.0%) | 0 (0.0%) |
| College or Associate's Degree | 0 (0.0%) | 0 (0.0%) |
| Bachelor's Degree | 0 (0.0%) | 0 (0.0%) |
| Graduate Degree | 0 (0.0%) | 0 (0.0%) |
| Total | 0 (0.0%) | 0 (0.0%) |
Employment Characteristics in Mount Eaton
Employment by Class of Employer in Mount Eaton
Among the 86 employed individuals in Mount Eaton, private company employees (40 | 46.5%), self-employed (incorporated) (22 | 25.6%), and not-for-profit organizations (15 | 17.4%) make up the most common classes of employment.
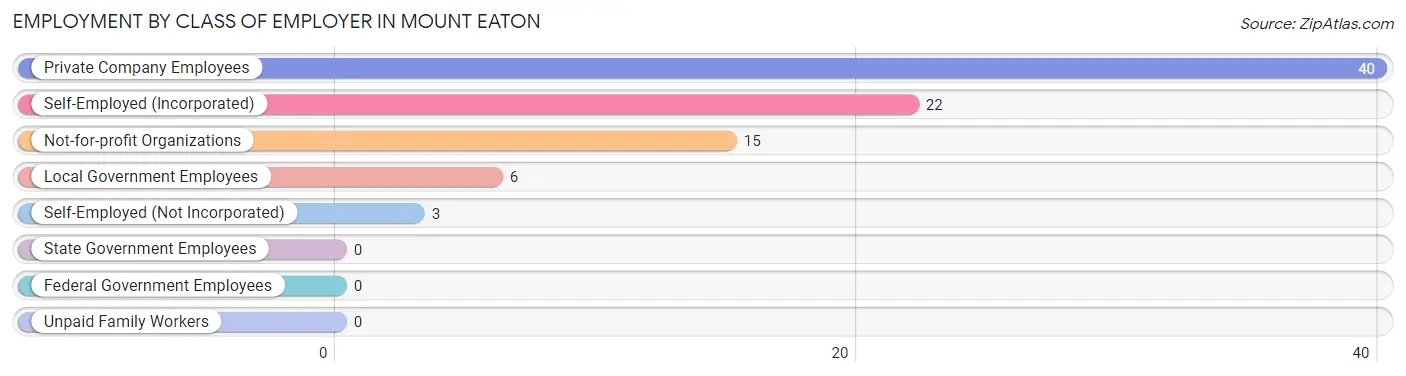
| Employer Class | # Employees | % Employees |
| Private Company Employees | 40 | 46.5% |
| Self-Employed (Incorporated) | 22 | 25.6% |
| Self-Employed (Not Incorporated) | 3 | 3.5% |
| Not-for-profit Organizations | 15 | 17.4% |
| Local Government Employees | 6 | 7.0% |
| State Government Employees | 0 | 0.0% |
| Federal Government Employees | 0 | 0.0% |
| Unpaid Family Workers | 0 | 0.0% |
| Total | 86 | 100.0% |
Employment Status by Age in Mount Eaton
According to the labor force statistics for Mount Eaton, out of the total population over 16 years of age (100), 90.0% or 90 individuals are in the labor force, with 4.4% or 4 of them unemployed. The age group with the highest labor force participation rate is 25 to 29 years, with 100.0% or 4 individuals in the labor force. Within the labor force, the 55 to 59 years age range has the highest percentage of unemployed individuals, with 100.0% or 4 of them being unemployed.
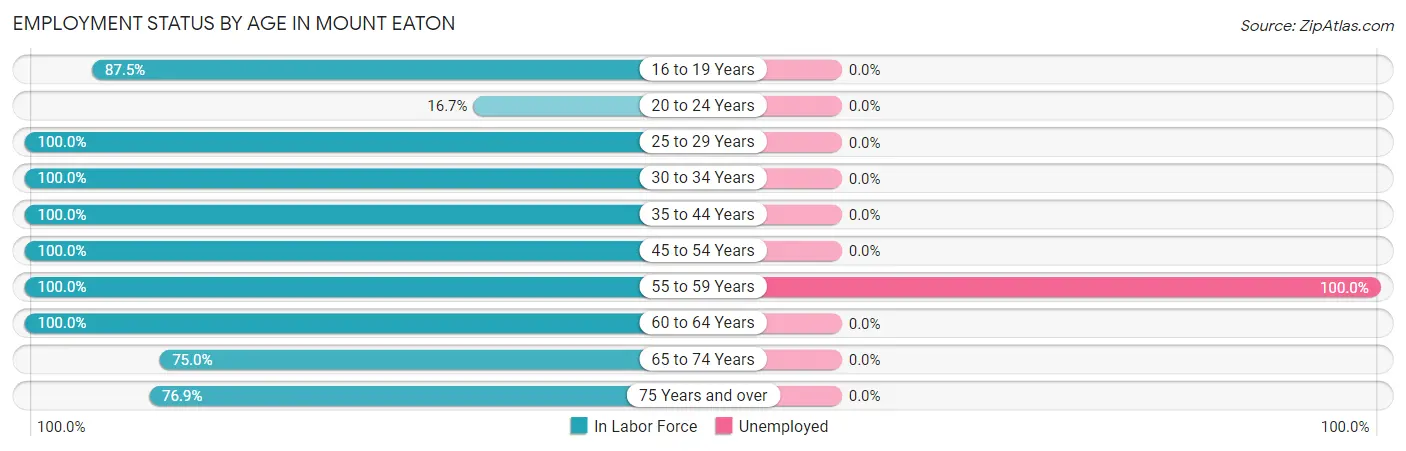
| Age Bracket | In Labor Force | Unemployed |
| 16 to 19 Years | 7 (87.5%) | 0 (0.0%) |
| 20 to 24 Years | 1 (16.7%) | 0 (0.0%) |
| 25 to 29 Years | 4 (100.0%) | 0 (0.0%) |
| 30 to 34 Years | 14 (100.0%) | 0 (0.0%) |
| 35 to 44 Years | 27 (100.0%) | 0 (0.0%) |
| 45 to 54 Years | 15 (100.0%) | 0 (0.0%) |
| 55 to 59 Years | 4 (100.0%) | 4 (100.0%) |
| 60 to 64 Years | 5 (100.0%) | 0 (0.0%) |
| 65 to 74 Years | 3 (75.0%) | 0 (0.0%) |
| 75 Years and over | 10 (76.9%) | 0 (0.0%) |
| Total | 90 (90.0%) | 4 (4.4%) |
Employment Status by Educational Attainment in Mount Eaton
According to labor force statistics for Mount Eaton, 100.0% of individuals (69) out of the total population between 25 and 64 years of age (69) are in the labor force, with 5.8% or 4 of them being unemployed. The group with the highest labor force participation rate are those with the educational attainment of less than high school, with 100.0% or 20 individuals in the labor force. Within the labor force, individuals with high school diploma education have the highest percentage of unemployment, with 12.9% or 4 of them being unemployed.
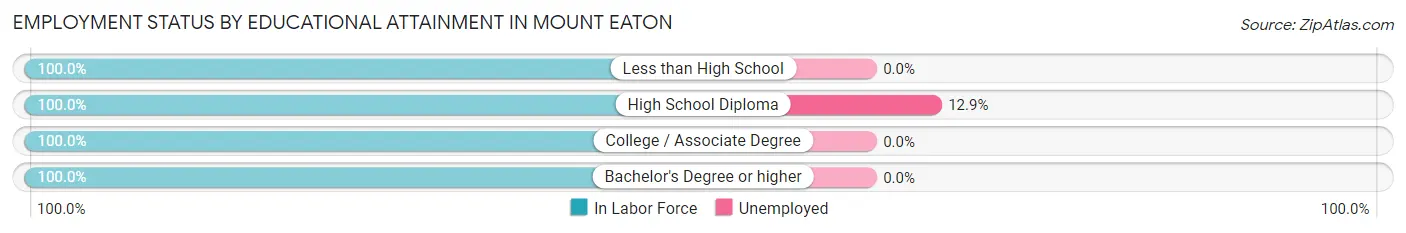
| Educational Attainment | In Labor Force | Unemployed |
| Less than High School | 20 (100.0%) | 0 (0.0%) |
| High School Diploma | 31 (100.0%) | 4 (12.9%) |
| College / Associate Degree | 9 (100.0%) | 0 (0.0%) |
| Bachelor's Degree or higher | 9 (100.0%) | 0 (0.0%) |
| Total | 69 (100.0%) | 4 (5.8%) |
Employment Occupations by Sex in Mount Eaton
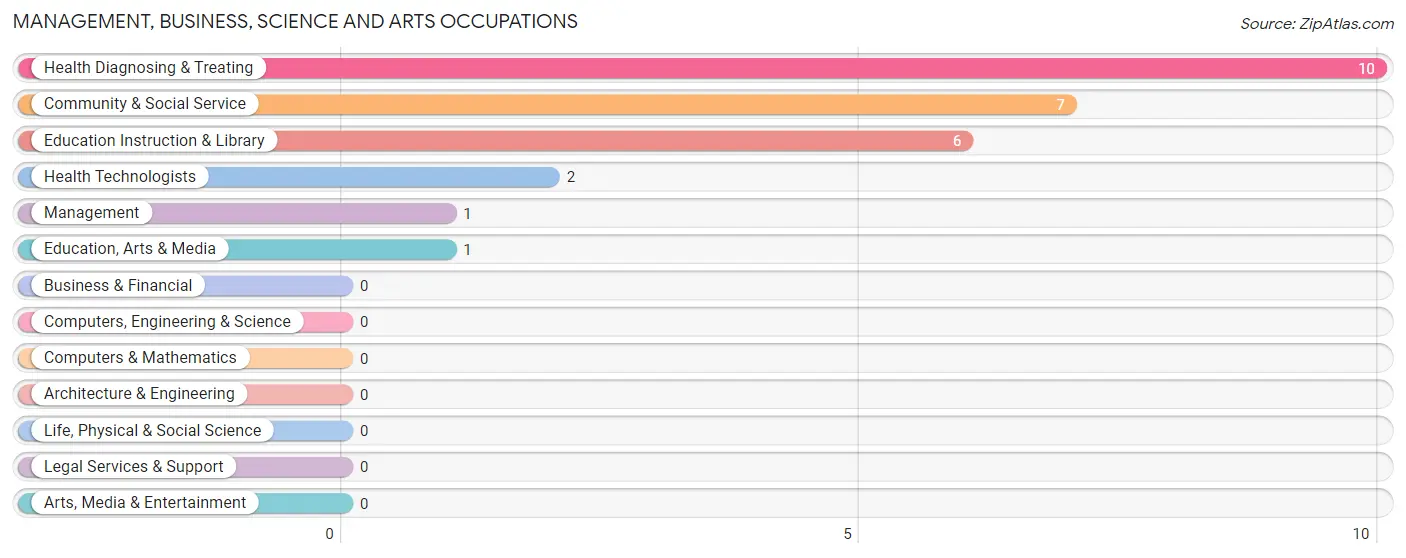
Management, Business, Science and Arts Occupations
The most common Management, Business, Science and Arts occupations in Mount Eaton are Health Diagnosing & Treating (10 | 11.6%), Community & Social Service (7 | 8.1%), Education Instruction & Library (6 | 7.0%), Health Technologists (2 | 2.3%), and Management (1 | 1.2%).
Management, Business, Science and Arts Occupations by Sex
Within the Management, Business, Science and Arts occupations in Mount Eaton, the most male-oriented occupations are Management (100.0%), Education, Arts & Media (100.0%), and Health Technologists (50.0%), while the most female-oriented occupations are Education Instruction & Library (100.0%), Health Diagnosing & Treating (90.0%), and Community & Social Service (85.7%).
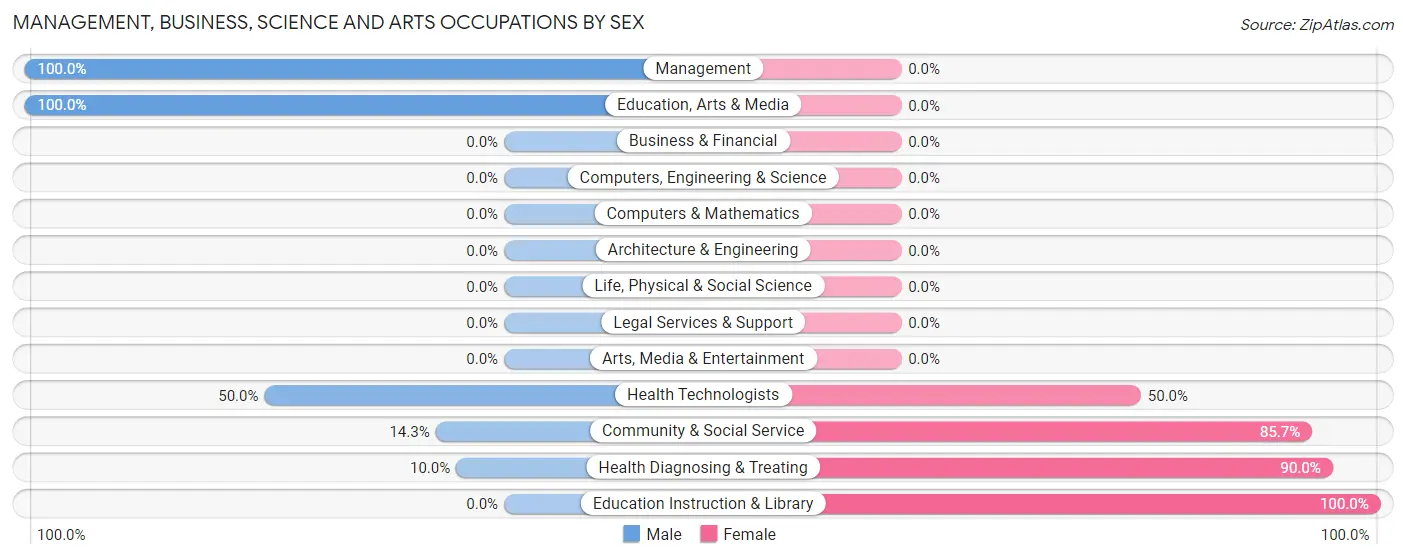
| Occupation | Male | Female |
| Management | 1 (100.0%) | 0 (0.0%) |
| Business & Financial | 0 (0.0%) | 0 (0.0%) |
| Computers, Engineering & Science | 0 (0.0%) | 0 (0.0%) |
| Computers & Mathematics | 0 (0.0%) | 0 (0.0%) |
| Architecture & Engineering | 0 (0.0%) | 0 (0.0%) |
| Life, Physical & Social Science | 0 (0.0%) | 0 (0.0%) |
| Community & Social Service | 1 (14.3%) | 6 (85.7%) |
| Education, Arts & Media | 1 (100.0%) | 0 (0.0%) |
| Legal Services & Support | 0 (0.0%) | 0 (0.0%) |
| Education Instruction & Library | 0 (0.0%) | 6 (100.0%) |
| Arts, Media & Entertainment | 0 (0.0%) | 0 (0.0%) |
| Health Diagnosing & Treating | 1 (10.0%) | 9 (90.0%) |
| Health Technologists | 1 (50.0%) | 1 (50.0%) |
| Total (Category) | 3 (16.7%) | 15 (83.3%) |
| Total (Overall) | 39 (45.4%) | 47 (54.6%) |
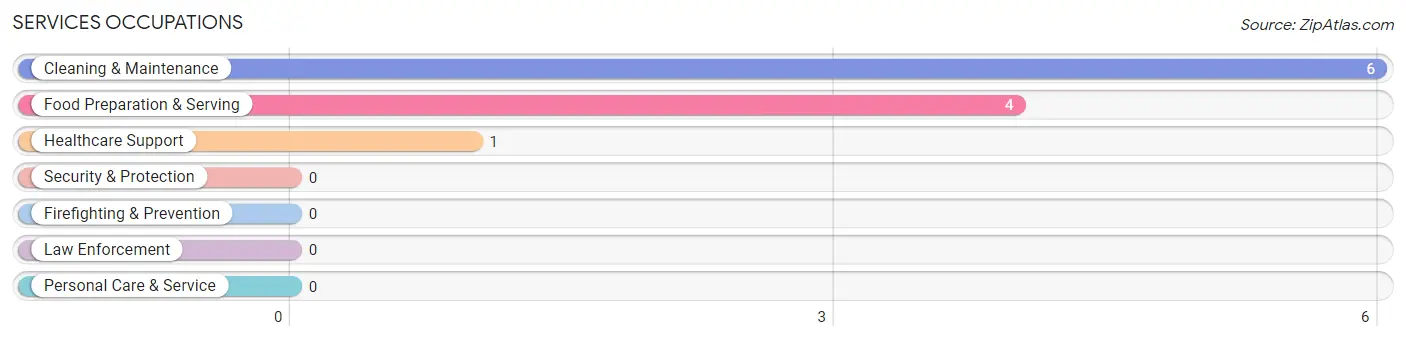
Services Occupations
The most common Services occupations in Mount Eaton are Cleaning & Maintenance (6 | 7.0%), Food Preparation & Serving (4 | 4.6%), and Healthcare Support (1 | 1.2%).
Services Occupations by Sex
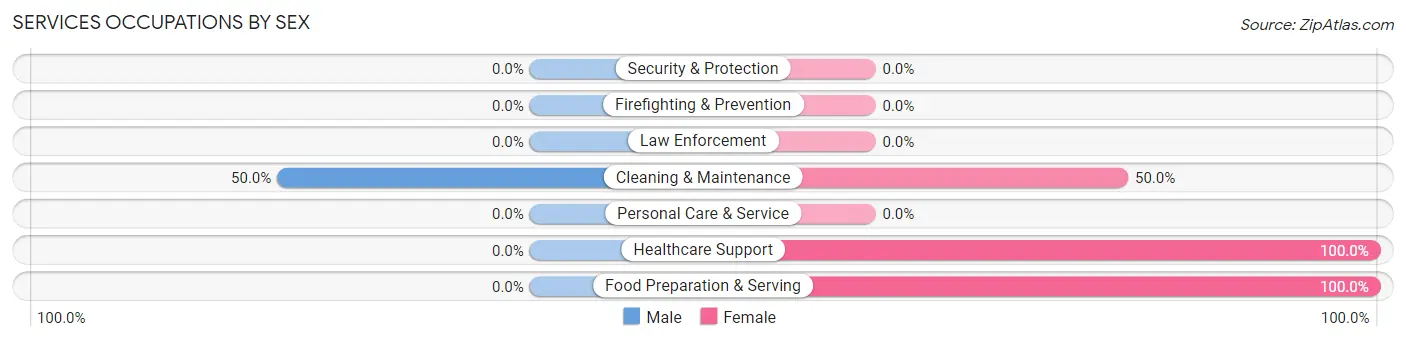
| Occupation | Male | Female |
| Healthcare Support | 0 (0.0%) | 1 (100.0%) |
| Security & Protection | 0 (0.0%) | 0 (0.0%) |
| Firefighting & Prevention | 0 (0.0%) | 0 (0.0%) |
| Law Enforcement | 0 (0.0%) | 0 (0.0%) |
| Food Preparation & Serving | 0 (0.0%) | 4 (100.0%) |
| Cleaning & Maintenance | 3 (50.0%) | 3 (50.0%) |
| Personal Care & Service | 0 (0.0%) | 0 (0.0%) |
| Total (Category) | 3 (27.3%) | 8 (72.7%) |
| Total (Overall) | 39 (45.4%) | 47 (54.6%) |
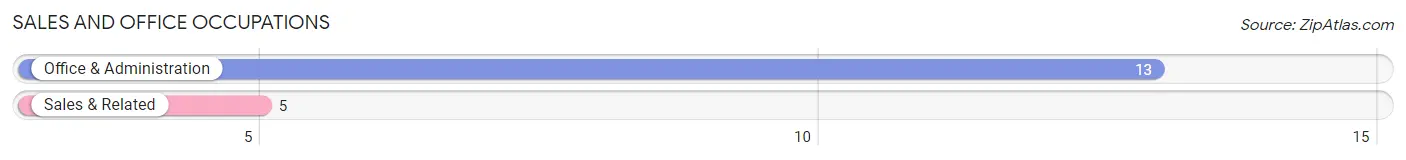
Sales and Office Occupations
The most common Sales and Office occupations in Mount Eaton are Office & Administration (13 | 15.1%), and Sales & Related (5 | 5.8%).
Sales and Office Occupations by Sex
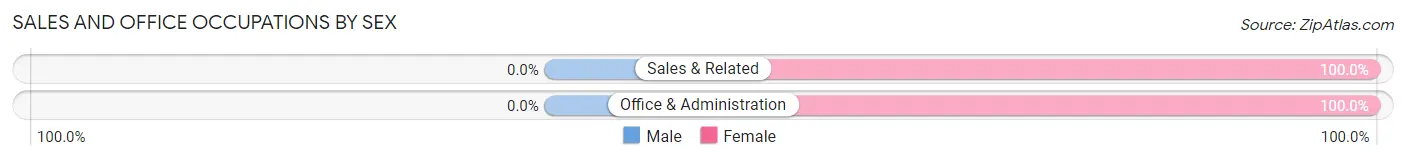
| Occupation | Male | Female |
| Sales & Related | 0 (0.0%) | 5 (100.0%) |
| Office & Administration | 0 (0.0%) | 13 (100.0%) |
| Total (Category) | 0 (0.0%) | 18 (100.0%) |
| Total (Overall) | 39 (45.4%) | 47 (54.6%) |
Natural Resources, Construction and Maintenance Occupations
The most common Natural Resources, Construction and Maintenance occupations in Mount Eaton are Construction & Extraction (14 | 16.3%), and Farming, Fishing & Forestry (5 | 5.8%).
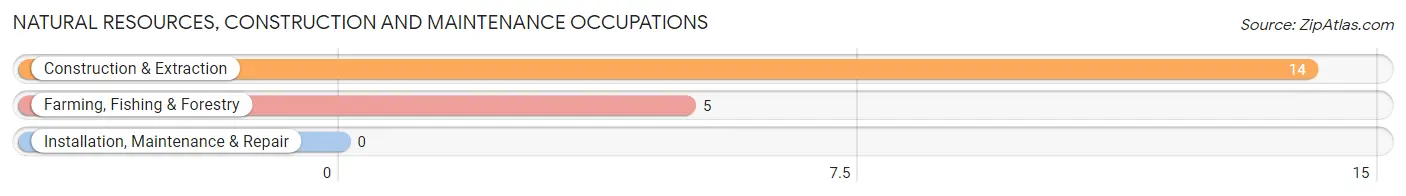
Natural Resources, Construction and Maintenance Occupations by Sex
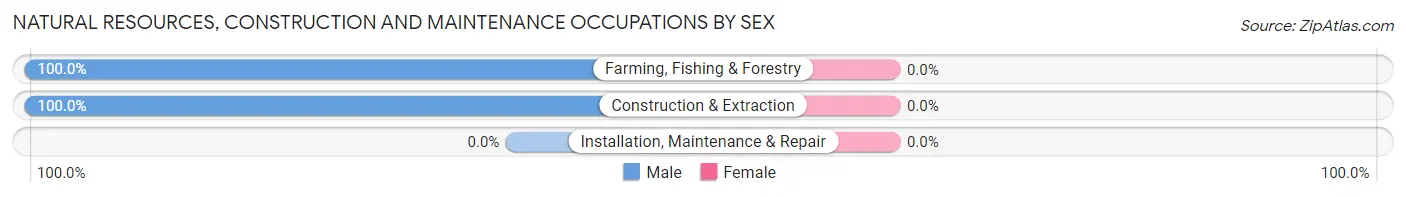
| Occupation | Male | Female |
| Farming, Fishing & Forestry | 5 (100.0%) | 0 (0.0%) |
| Construction & Extraction | 14 (100.0%) | 0 (0.0%) |
| Installation, Maintenance & Repair | 0 (0.0%) | 0 (0.0%) |
| Total (Category) | 19 (100.0%) | 0 (0.0%) |
| Total (Overall) | 39 (45.4%) | 47 (54.6%) |
Production, Transportation and Moving Occupations
The most common Production, Transportation and Moving occupations in Mount Eaton are Transportation (18 | 20.9%), Production (1 | 1.2%), and Material Moving (1 | 1.2%).
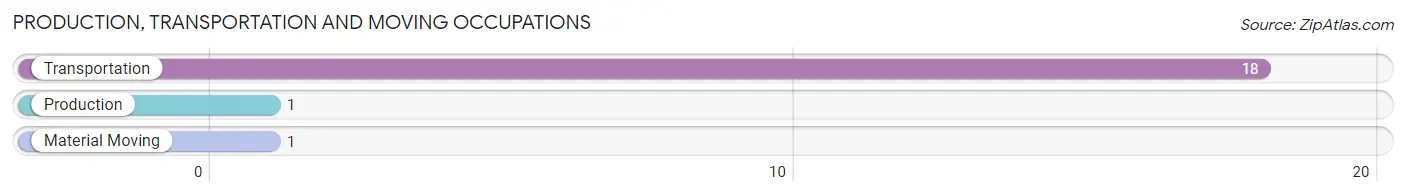
Production, Transportation and Moving Occupations by Sex
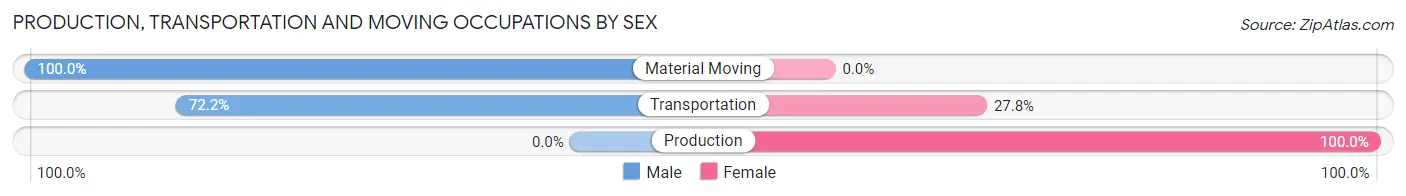
| Occupation | Male | Female |
| Production | 0 (0.0%) | 1 (100.0%) |
| Transportation | 13 (72.2%) | 5 (27.8%) |
| Material Moving | 1 (100.0%) | 0 (0.0%) |
| Total (Category) | 14 (70.0%) | 6 (30.0%) |
| Total (Overall) | 39 (45.4%) | 47 (54.6%) |
Employment Industries by Sex in Mount Eaton
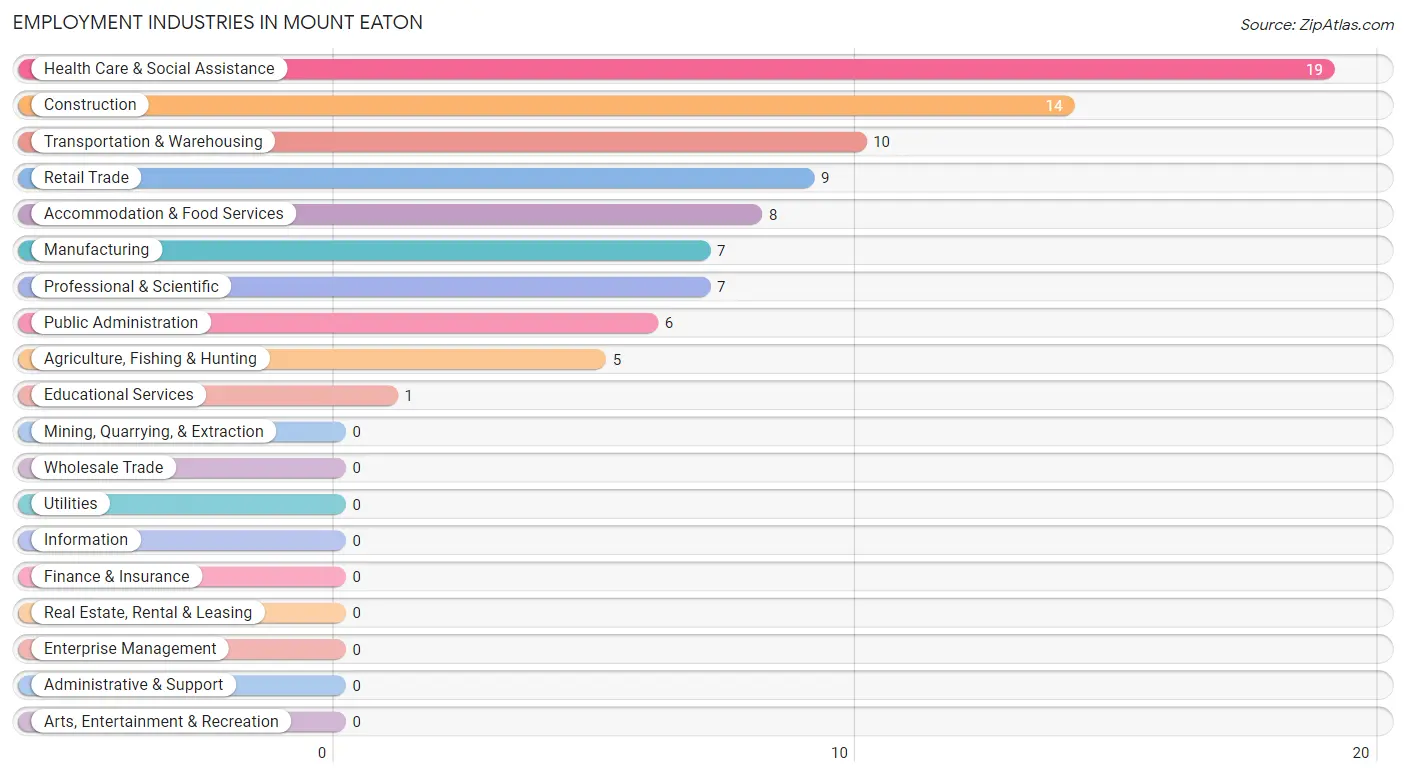
Employment Industries in Mount Eaton
The major employment industries in Mount Eaton include Health Care & Social Assistance (19 | 22.1%), Construction (14 | 16.3%), Transportation & Warehousing (10 | 11.6%), Retail Trade (9 | 10.5%), and Accommodation & Food Services (8 | 9.3%).
Employment Industries by Sex in Mount Eaton
The Mount Eaton industries that see more men than women are Agriculture, Fishing & Hunting (100.0%), Construction (100.0%), and Retail Trade (55.6%), whereas the industries that tend to have a higher number of women are Manufacturing (100.0%), Educational Services (100.0%), and Accommodation & Food Services (87.5%).
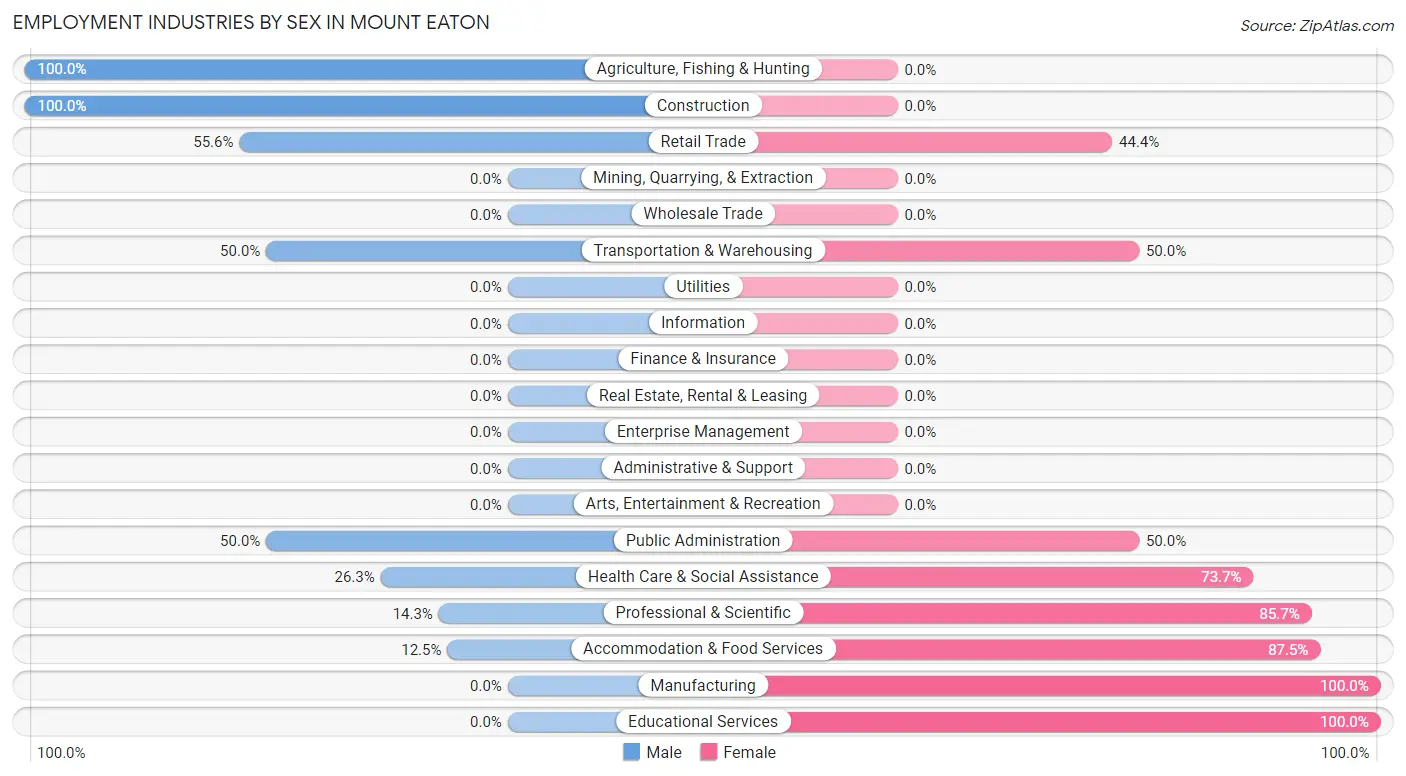
| Industry | Male | Female |
| Agriculture, Fishing & Hunting | 5 (100.0%) | 0 (0.0%) |
| Mining, Quarrying, & Extraction | 0 (0.0%) | 0 (0.0%) |
| Construction | 14 (100.0%) | 0 (0.0%) |
| Manufacturing | 0 (0.0%) | 7 (100.0%) |
| Wholesale Trade | 0 (0.0%) | 0 (0.0%) |
| Retail Trade | 5 (55.6%) | 4 (44.4%) |
| Transportation & Warehousing | 5 (50.0%) | 5 (50.0%) |
| Utilities | 0 (0.0%) | 0 (0.0%) |
| Information | 0 (0.0%) | 0 (0.0%) |
| Finance & Insurance | 0 (0.0%) | 0 (0.0%) |
| Real Estate, Rental & Leasing | 0 (0.0%) | 0 (0.0%) |
| Professional & Scientific | 1 (14.3%) | 6 (85.7%) |
| Enterprise Management | 0 (0.0%) | 0 (0.0%) |
| Administrative & Support | 0 (0.0%) | 0 (0.0%) |
| Educational Services | 0 (0.0%) | 1 (100.0%) |
| Health Care & Social Assistance | 5 (26.3%) | 14 (73.7%) |
| Arts, Entertainment & Recreation | 0 (0.0%) | 0 (0.0%) |
| Accommodation & Food Services | 1 (12.5%) | 7 (87.5%) |
| Public Administration | 3 (50.0%) | 3 (50.0%) |
| Total | 39 (45.4%) | 47 (54.6%) |
Education in Mount Eaton
School Enrollment in Mount Eaton
The most common levels of schooling among the 44 students in Mount Eaton are middle school (13 | 29.5%), college / undergraduate (12 | 27.3%), and high school (11 | 25.0%).
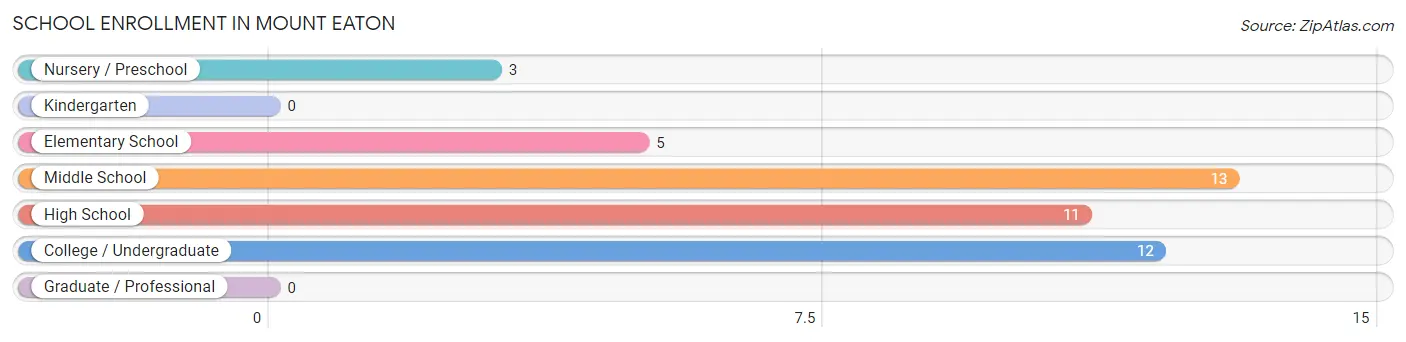
| School Level | # Students | % Students |
| Nursery / Preschool | 3 | 6.8% |
| Kindergarten | 0 | 0.0% |
| Elementary School | 5 | 11.4% |
| Middle School | 13 | 29.5% |
| High School | 11 | 25.0% |
| College / Undergraduate | 12 | 27.3% |
| Graduate / Professional | 0 | 0.0% |
| Total | 44 | 100.0% |
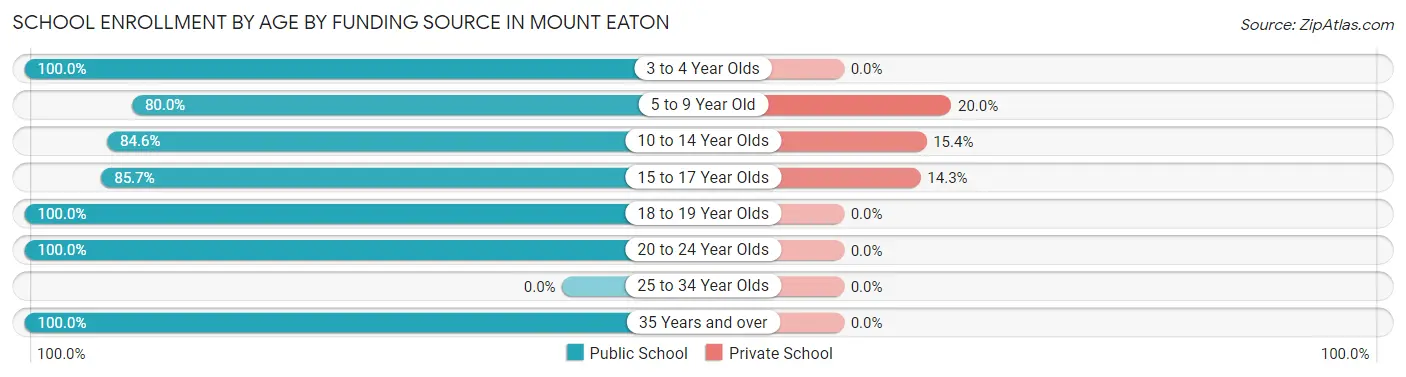
School Enrollment by Age by Funding Source in Mount Eaton
Out of a total of 44 students who are enrolled in schools in Mount Eaton, 4 (9.1%) attend a private institution, while the remaining 40 (90.9%) are enrolled in public schools. The age group of 5 to 9 year old has the highest likelihood of being enrolled in private schools, with 1 (20.0% in the age bracket) enrolled. Conversely, the age group of 3 to 4 year olds has the lowest likelihood of being enrolled in a private school, with 3 (100.0% in the age bracket) attending a public institution.
| Age Bracket | Public School | Private School |
| 3 to 4 Year Olds | 3 (100.0%) | 0 (0.0%) |
| 5 to 9 Year Old | 4 (80.0%) | 1 (20.0%) |
| 10 to 14 Year Olds | 11 (84.6%) | 2 (15.4%) |
| 15 to 17 Year Olds | 6 (85.7%) | 1 (14.3%) |
| 18 to 19 Year Olds | 7 (100.0%) | 0 (0.0%) |
| 20 to 24 Year Olds | 5 (100.0%) | 0 (0.0%) |
| 25 to 34 Year Olds | 0 (0.0%) | 0 (0.0%) |
| 35 Years and over | 4 (100.0%) | 0 (0.0%) |
| Total | 40 (90.9%) | 4 (9.1%) |
Educational Attainment by Field of Study in Mount Eaton
Education (6 | 54.5%), arts & humanities (2 | 18.2%), bio, nature & agricultural (1 | 9.1%), psychology (1 | 9.1%), and social sciences (1 | 9.1%) are the most common fields of study among 11 individuals in Mount Eaton who have obtained a bachelor's degree or higher.
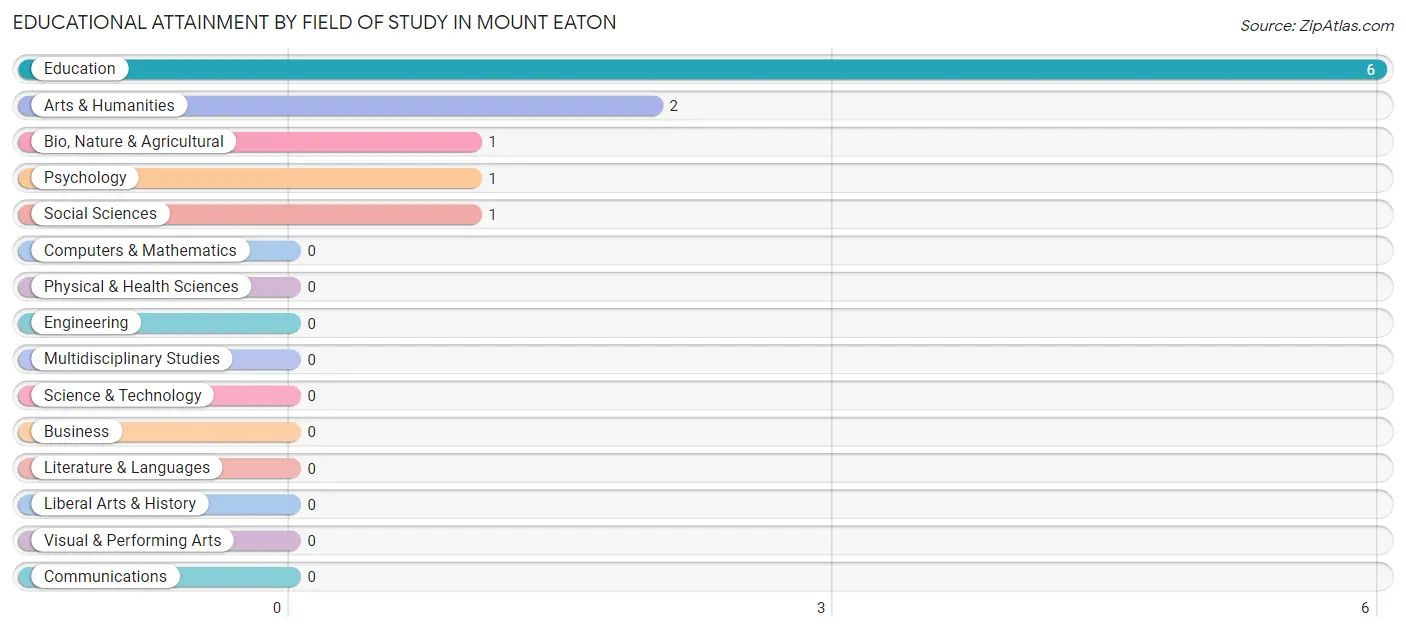
| Field of Study | # Graduates | % Graduates |
| Computers & Mathematics | 0 | 0.0% |
| Bio, Nature & Agricultural | 1 | 9.1% |
| Physical & Health Sciences | 0 | 0.0% |
| Psychology | 1 | 9.1% |
| Social Sciences | 1 | 9.1% |
| Engineering | 0 | 0.0% |
| Multidisciplinary Studies | 0 | 0.0% |
| Science & Technology | 0 | 0.0% |
| Business | 0 | 0.0% |
| Education | 6 | 54.5% |
| Literature & Languages | 0 | 0.0% |
| Liberal Arts & History | 0 | 0.0% |
| Visual & Performing Arts | 0 | 0.0% |
| Communications | 0 | 0.0% |
| Arts & Humanities | 2 | 18.2% |
| Total | 11 | 100.0% |
Transportation & Commute in Mount Eaton
Vehicle Availability by Sex in Mount Eaton
The most prevalent vehicle ownership categories in Mount Eaton are males with 2 vehicles (19, accounting for 48.7%) and females with 2 vehicles (15, making up 40.4%).
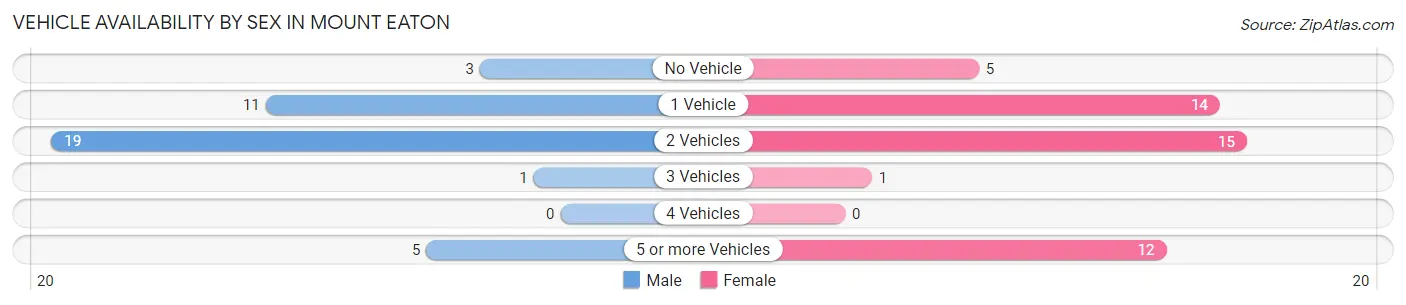
| Vehicles Available | Male | Female |
| No Vehicle | 3 (7.7%) | 5 (10.6%) |
| 1 Vehicle | 11 (28.2%) | 14 (29.8%) |
| 2 Vehicles | 19 (48.7%) | 15 (31.9%) |
| 3 Vehicles | 1 (2.6%) | 1 (2.1%) |
| 4 Vehicles | 0 (0.0%) | 0 (0.0%) |
| 5 or more Vehicles | 5 (12.8%) | 12 (25.5%) |
| Total | 39 (100.0%) | 47 (100.0%) |
Commute Time in Mount Eaton
The most frequently occuring commute durations in Mount Eaton are 10 to 14 minutes (19 commuters, 28.8%), 15 to 19 minutes (18 commuters, 27.3%), and less than 5 minutes (14 commuters, 21.2%).
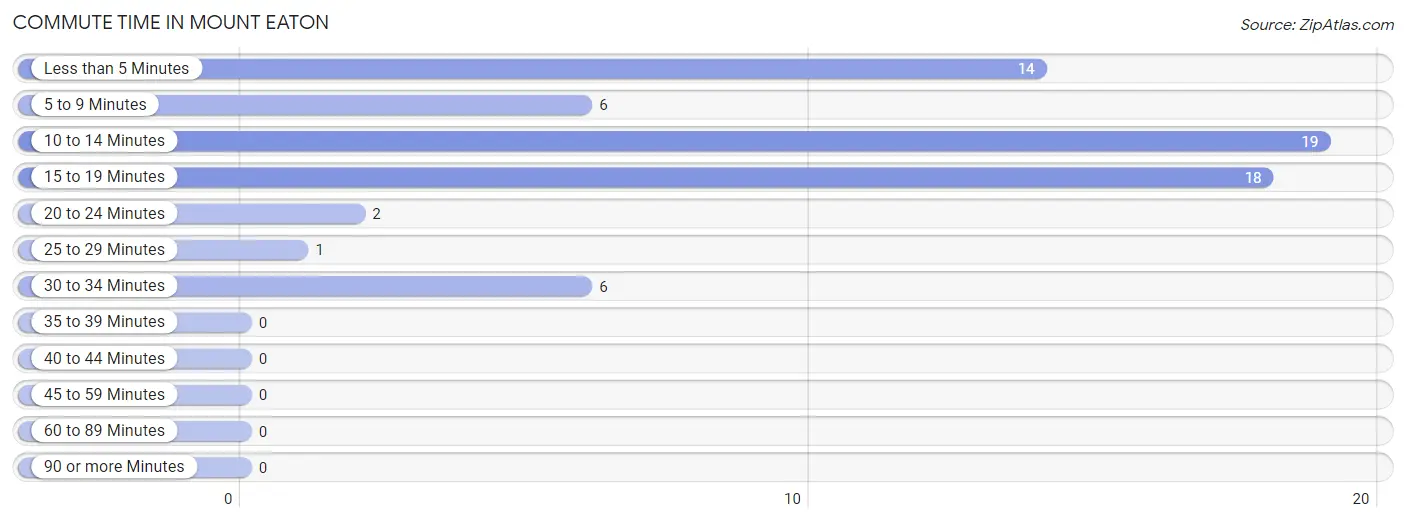
| Commute Time | # Commuters | % Commuters |
| Less than 5 Minutes | 14 | 21.2% |
| 5 to 9 Minutes | 6 | 9.1% |
| 10 to 14 Minutes | 19 | 28.8% |
| 15 to 19 Minutes | 18 | 27.3% |
| 20 to 24 Minutes | 2 | 3.0% |
| 25 to 29 Minutes | 1 | 1.5% |
| 30 to 34 Minutes | 6 | 9.1% |
| 35 to 39 Minutes | 0 | 0.0% |
| 40 to 44 Minutes | 0 | 0.0% |
| 45 to 59 Minutes | 0 | 0.0% |
| 60 to 89 Minutes | 0 | 0.0% |
| 90 or more Minutes | 0 | 0.0% |
Commute Time by Sex in Mount Eaton
The most common commute times in Mount Eaton are 10 to 14 minutes (7 commuters, 24.1%) for males and 15 to 19 minutes (13 commuters, 35.1%) for females.
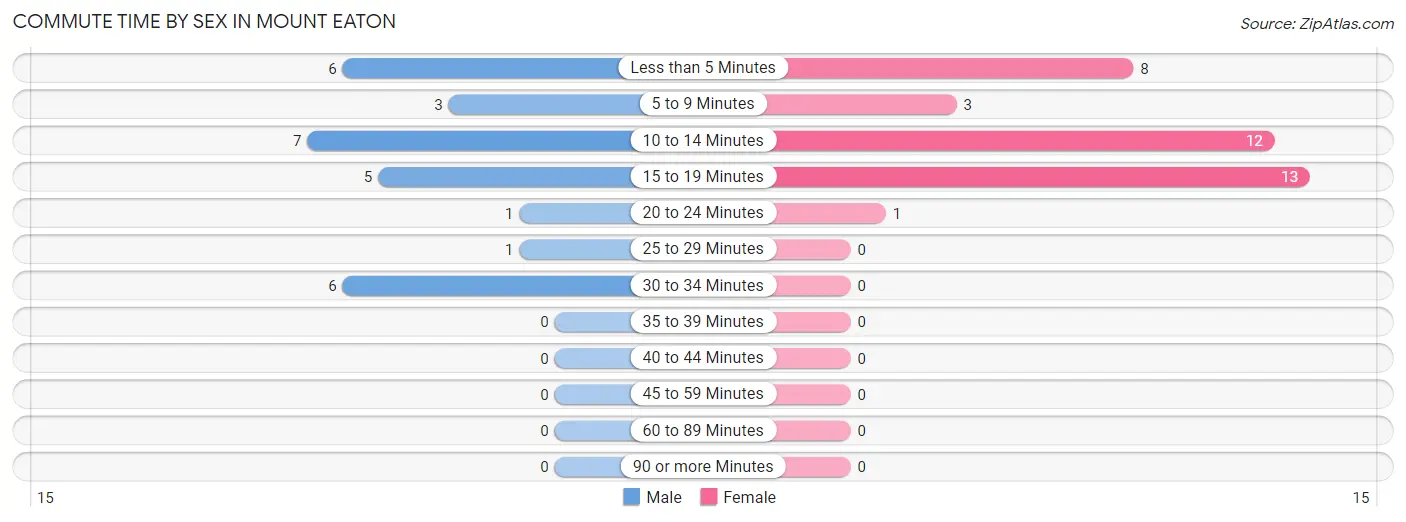
| Commute Time | Male | Female |
| Less than 5 Minutes | 6 (20.7%) | 8 (21.6%) |
| 5 to 9 Minutes | 3 (10.3%) | 3 (8.1%) |
| 10 to 14 Minutes | 7 (24.1%) | 12 (32.4%) |
| 15 to 19 Minutes | 5 (17.2%) | 13 (35.1%) |
| 20 to 24 Minutes | 1 (3.5%) | 1 (2.7%) |
| 25 to 29 Minutes | 1 (3.5%) | 0 (0.0%) |
| 30 to 34 Minutes | 6 (20.7%) | 0 (0.0%) |
| 35 to 39 Minutes | 0 (0.0%) | 0 (0.0%) |
| 40 to 44 Minutes | 0 (0.0%) | 0 (0.0%) |
| 45 to 59 Minutes | 0 (0.0%) | 0 (0.0%) |
| 60 to 89 Minutes | 0 (0.0%) | 0 (0.0%) |
| 90 or more Minutes | 0 (0.0%) | 0 (0.0%) |
Time of Departure to Work by Sex in Mount Eaton
The most frequent times of departure to work in Mount Eaton are 12:00 AM to 4:59 AM (10, 34.5%) for males and 8:00 AM to 8:29 AM (13, 35.1%) for females.
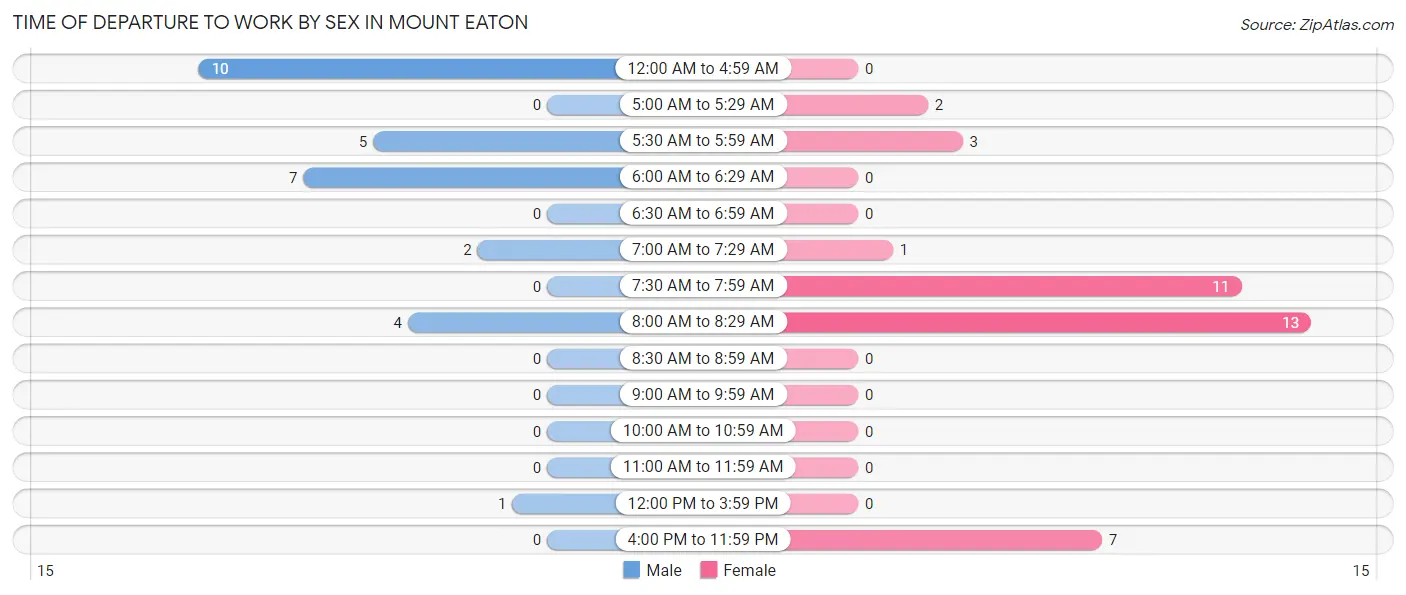
| Time of Departure | Male | Female |
| 12:00 AM to 4:59 AM | 10 (34.5%) | 0 (0.0%) |
| 5:00 AM to 5:29 AM | 0 (0.0%) | 2 (5.4%) |
| 5:30 AM to 5:59 AM | 5 (17.2%) | 3 (8.1%) |
| 6:00 AM to 6:29 AM | 7 (24.1%) | 0 (0.0%) |
| 6:30 AM to 6:59 AM | 0 (0.0%) | 0 (0.0%) |
| 7:00 AM to 7:29 AM | 2 (6.9%) | 1 (2.7%) |
| 7:30 AM to 7:59 AM | 0 (0.0%) | 11 (29.7%) |
| 8:00 AM to 8:29 AM | 4 (13.8%) | 13 (35.1%) |
| 8:30 AM to 8:59 AM | 0 (0.0%) | 0 (0.0%) |
| 9:00 AM to 9:59 AM | 0 (0.0%) | 0 (0.0%) |
| 10:00 AM to 10:59 AM | 0 (0.0%) | 0 (0.0%) |
| 11:00 AM to 11:59 AM | 0 (0.0%) | 0 (0.0%) |
| 12:00 PM to 3:59 PM | 1 (3.5%) | 0 (0.0%) |
| 4:00 PM to 11:59 PM | 0 (0.0%) | 7 (18.9%) |
| Total | 29 (100.0%) | 37 (100.0%) |
Housing Occupancy in Mount Eaton
Occupancy by Ownership in Mount Eaton
Of the total 53 dwellings in Mount Eaton, owner-occupied units account for 38 (71.7%), while renter-occupied units make up 15 (28.3%).
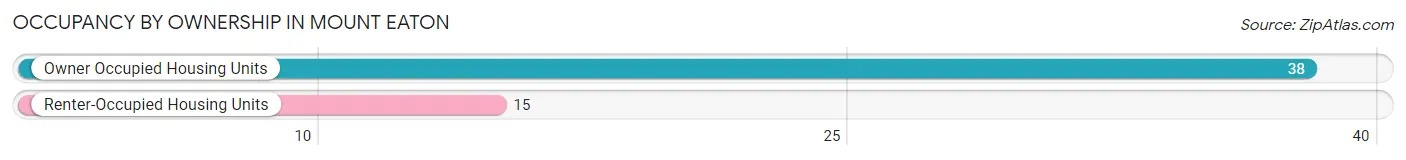
| Occupancy | # Housing Units | % Housing Units |
| Owner Occupied Housing Units | 38 | 71.7% |
| Renter-Occupied Housing Units | 15 | 28.3% |
| Total Occupied Housing Units | 53 | 100.0% |
Occupancy by Household Size in Mount Eaton
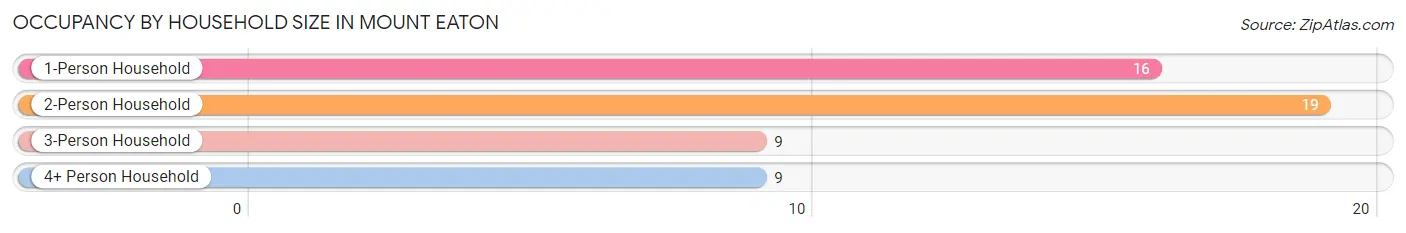
| Household Size | # Housing Units | % Housing Units |
| 1-Person Household | 16 | 30.2% |
| 2-Person Household | 19 | 35.8% |
| 3-Person Household | 9 | 17.0% |
| 4+ Person Household | 9 | 17.0% |
| Total Housing Units | 53 | 100.0% |
Occupancy by Ownership by Household Size in Mount Eaton
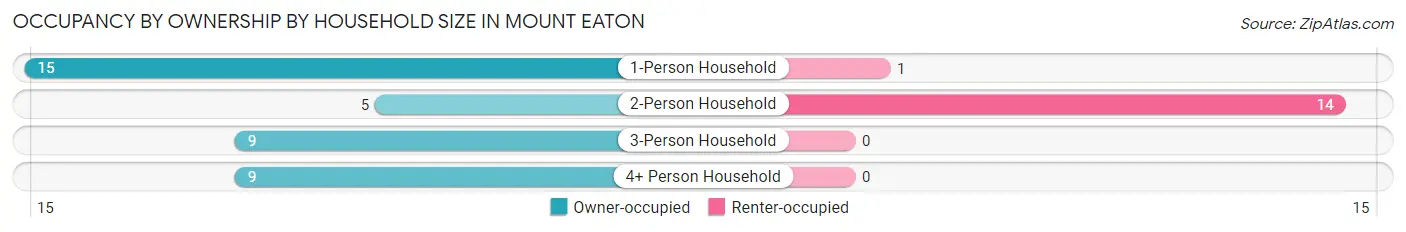
| Household Size | Owner-occupied | Renter-occupied |
| 1-Person Household | 15 (93.8%) | 1 (6.2%) |
| 2-Person Household | 5 (26.3%) | 14 (73.7%) |
| 3-Person Household | 9 (100.0%) | 0 (0.0%) |
| 4+ Person Household | 9 (100.0%) | 0 (0.0%) |
| Total Housing Units | 38 (71.7%) | 15 (28.3%) |
Occupancy by Educational Attainment in Mount Eaton
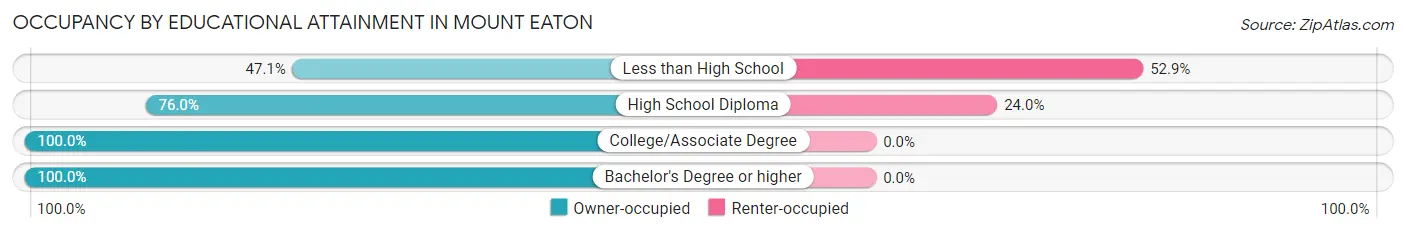
| Household Size | Owner-occupied | Renter-occupied |
| Less than High School | 8 (47.1%) | 9 (52.9%) |
| High School Diploma | 19 (76.0%) | 6 (24.0%) |
| College/Associate Degree | 9 (100.0%) | 0 (0.0%) |
| Bachelor's Degree or higher | 2 (100.0%) | 0 (0.0%) |
Occupancy by Age of Householder in Mount Eaton
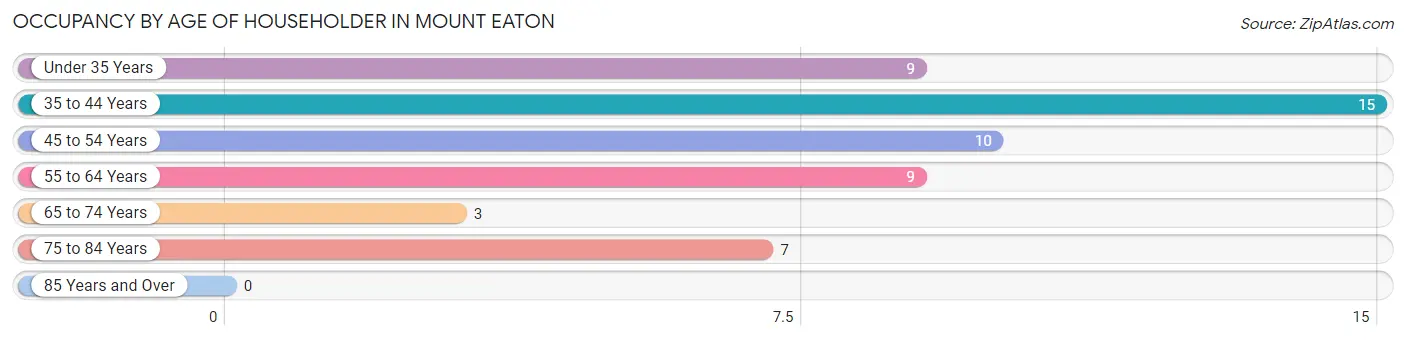
| Age Bracket | # Households | % Households |
| Under 35 Years | 9 | 17.0% |
| 35 to 44 Years | 15 | 28.3% |
| 45 to 54 Years | 10 | 18.9% |
| 55 to 64 Years | 9 | 17.0% |
| 65 to 74 Years | 3 | 5.7% |
| 75 to 84 Years | 7 | 13.2% |
| 85 Years and Over | 0 | 0.0% |
| Total | 53 | 100.0% |
Housing Finances in Mount Eaton
Median Income by Occupancy in Mount Eaton
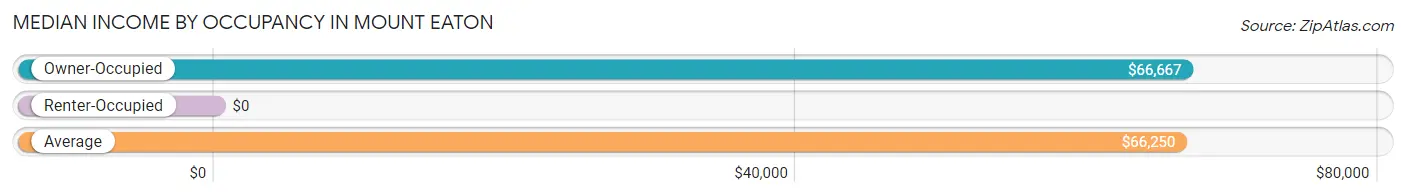
| Occupancy Type | # Households | Median Income |
| Owner-Occupied | 38 (71.7%) | $66,667 |
| Renter-Occupied | 15 (28.3%) | $0 |
| Average | 53 (100.0%) | $66,250 |
Occupancy by Householder Income Bracket in Mount Eaton
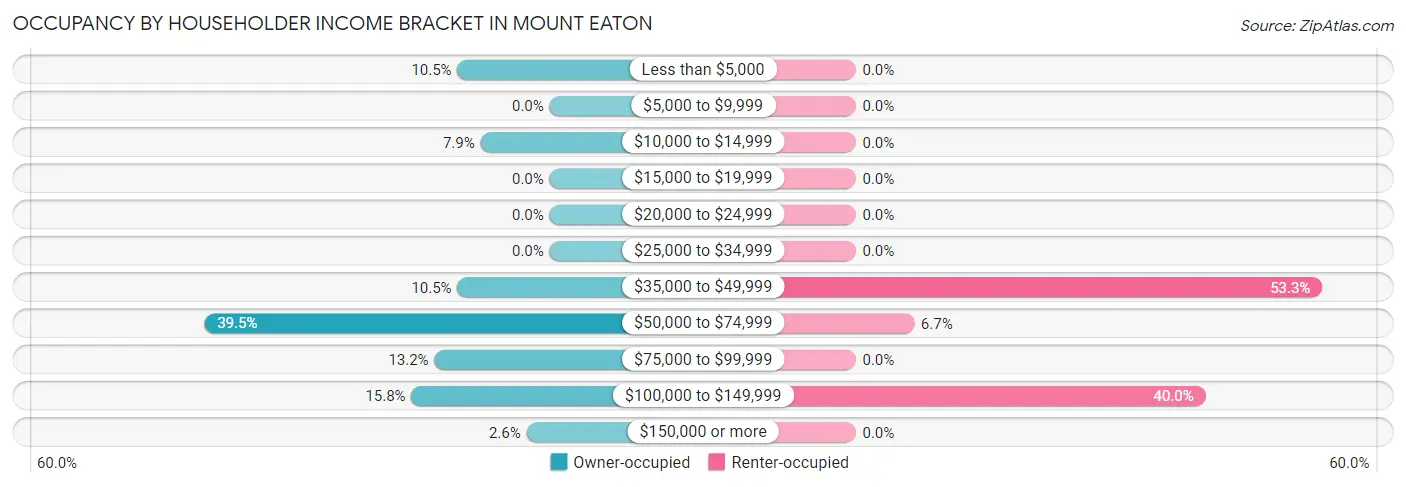
| Income Bracket | Owner-occupied | Renter-occupied |
| Less than $5,000 | 4 (10.5%) | 0 (0.0%) |
| $5,000 to $9,999 | 0 (0.0%) | 0 (0.0%) |
| $10,000 to $14,999 | 3 (7.9%) | 0 (0.0%) |
| $15,000 to $19,999 | 0 (0.0%) | 0 (0.0%) |
| $20,000 to $24,999 | 0 (0.0%) | 0 (0.0%) |
| $25,000 to $34,999 | 0 (0.0%) | 0 (0.0%) |
| $35,000 to $49,999 | 4 (10.5%) | 8 (53.3%) |
| $50,000 to $74,999 | 15 (39.5%) | 1 (6.7%) |
| $75,000 to $99,999 | 5 (13.2%) | 0 (0.0%) |
| $100,000 to $149,999 | 6 (15.8%) | 6 (40.0%) |
| $150,000 or more | 1 (2.6%) | 0 (0.0%) |
| Total | 38 (100.0%) | 15 (100.0%) |
Monthly Housing Cost Tiers in Mount Eaton
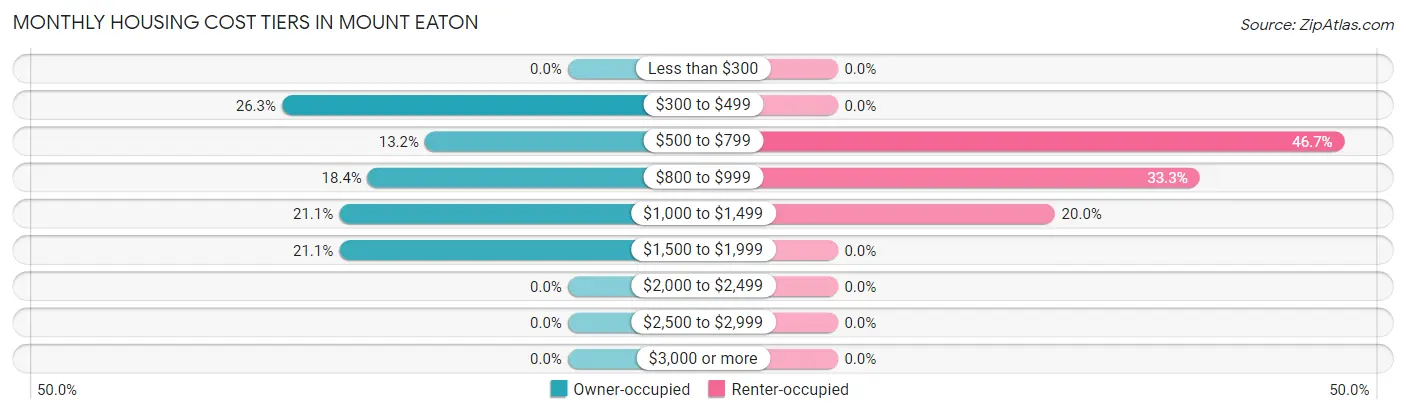
| Monthly Cost | Owner-occupied | Renter-occupied |
| Less than $300 | 0 (0.0%) | 0 (0.0%) |
| $300 to $499 | 10 (26.3%) | 0 (0.0%) |
| $500 to $799 | 5 (13.2%) | 7 (46.7%) |
| $800 to $999 | 7 (18.4%) | 5 (33.3%) |
| $1,000 to $1,499 | 8 (21.0%) | 3 (20.0%) |
| $1,500 to $1,999 | 8 (21.0%) | 0 (0.0%) |
| $2,000 to $2,499 | 0 (0.0%) | 0 (0.0%) |
| $2,500 to $2,999 | 0 (0.0%) | 0 (0.0%) |
| $3,000 or more | 0 (0.0%) | 0 (0.0%) |
| Total | 38 (100.0%) | 15 (100.0%) |
Physical Housing Characteristics in Mount Eaton
Housing Structures in Mount Eaton
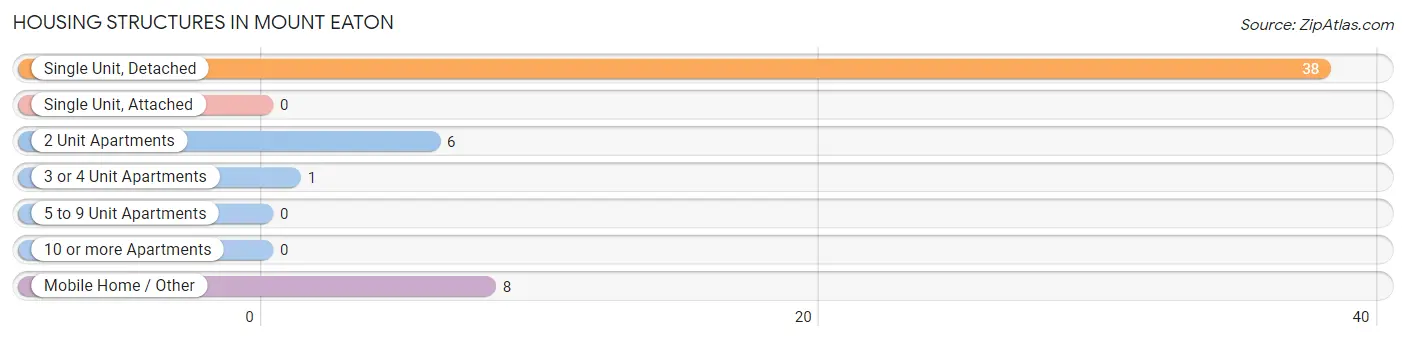
| Structure Type | # Housing Units | % Housing Units |
| Single Unit, Detached | 38 | 71.7% |
| Single Unit, Attached | 0 | 0.0% |
| 2 Unit Apartments | 6 | 11.3% |
| 3 or 4 Unit Apartments | 1 | 1.9% |
| 5 to 9 Unit Apartments | 0 | 0.0% |
| 10 or more Apartments | 0 | 0.0% |
| Mobile Home / Other | 8 | 15.1% |
| Total | 53 | 100.0% |
Housing Structures by Occupancy in Mount Eaton
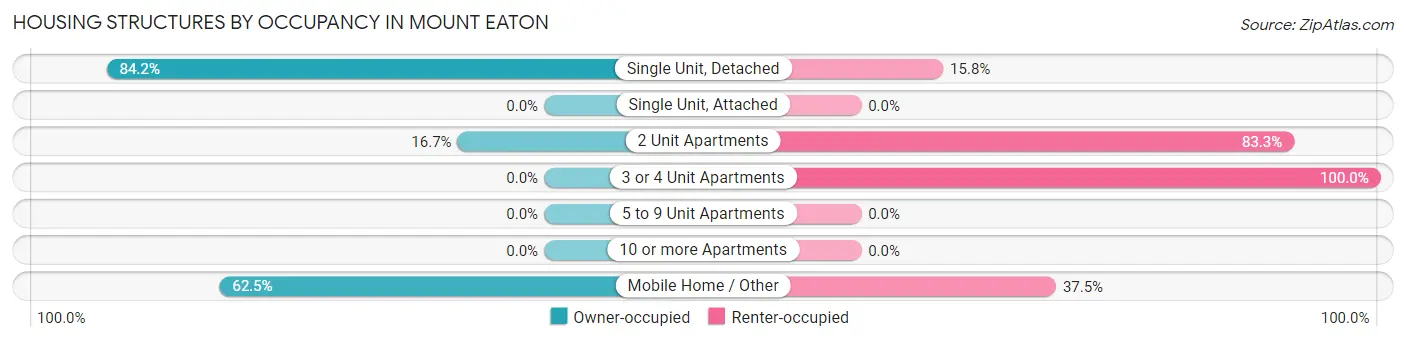
| Structure Type | Owner-occupied | Renter-occupied |
| Single Unit, Detached | 32 (84.2%) | 6 (15.8%) |
| Single Unit, Attached | 0 (0.0%) | 0 (0.0%) |
| 2 Unit Apartments | 1 (16.7%) | 5 (83.3%) |
| 3 or 4 Unit Apartments | 0 (0.0%) | 1 (100.0%) |
| 5 to 9 Unit Apartments | 0 (0.0%) | 0 (0.0%) |
| 10 or more Apartments | 0 (0.0%) | 0 (0.0%) |
| Mobile Home / Other | 5 (62.5%) | 3 (37.5%) |
| Total | 38 (71.7%) | 15 (28.3%) |
Housing Structures by Number of Rooms in Mount Eaton
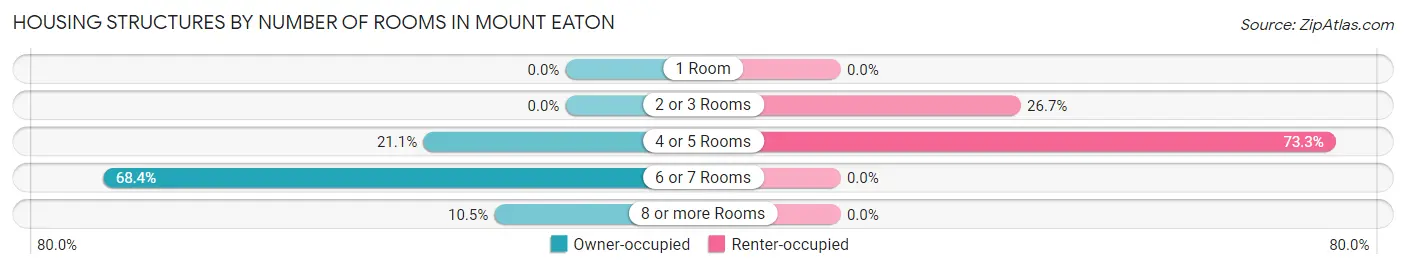
| Number of Rooms | Owner-occupied | Renter-occupied |
| 1 Room | 0 (0.0%) | 0 (0.0%) |
| 2 or 3 Rooms | 0 (0.0%) | 4 (26.7%) |
| 4 or 5 Rooms | 8 (21.0%) | 11 (73.3%) |
| 6 or 7 Rooms | 26 (68.4%) | 0 (0.0%) |
| 8 or more Rooms | 4 (10.5%) | 0 (0.0%) |
| Total | 38 (100.0%) | 15 (100.0%) |
Housing Structure by Heating Type in Mount Eaton
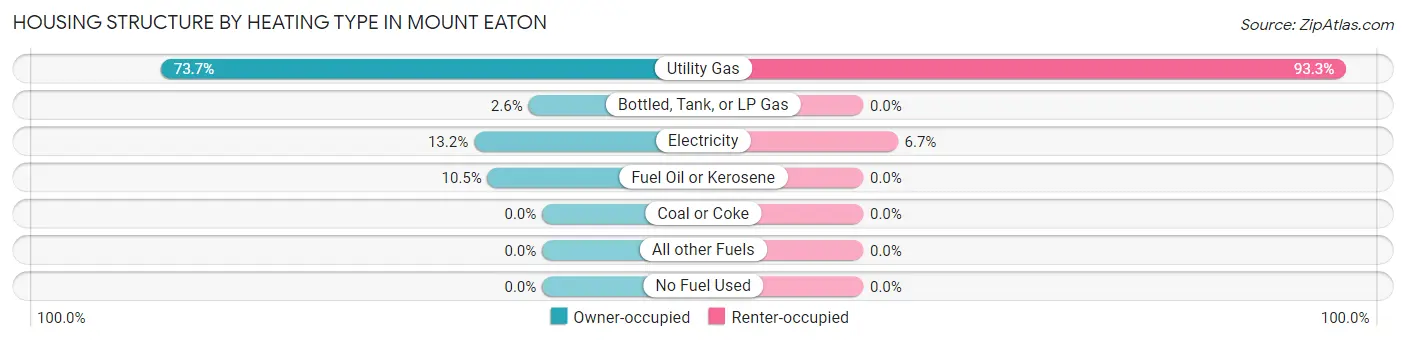
| Heating Type | Owner-occupied | Renter-occupied |
| Utility Gas | 28 (73.7%) | 14 (93.3%) |
| Bottled, Tank, or LP Gas | 1 (2.6%) | 0 (0.0%) |
| Electricity | 5 (13.2%) | 1 (6.7%) |
| Fuel Oil or Kerosene | 4 (10.5%) | 0 (0.0%) |
| Coal or Coke | 0 (0.0%) | 0 (0.0%) |
| All other Fuels | 0 (0.0%) | 0 (0.0%) |
| No Fuel Used | 0 (0.0%) | 0 (0.0%) |
| Total | 38 (100.0%) | 15 (100.0%) |
Household Vehicle Usage in Mount Eaton
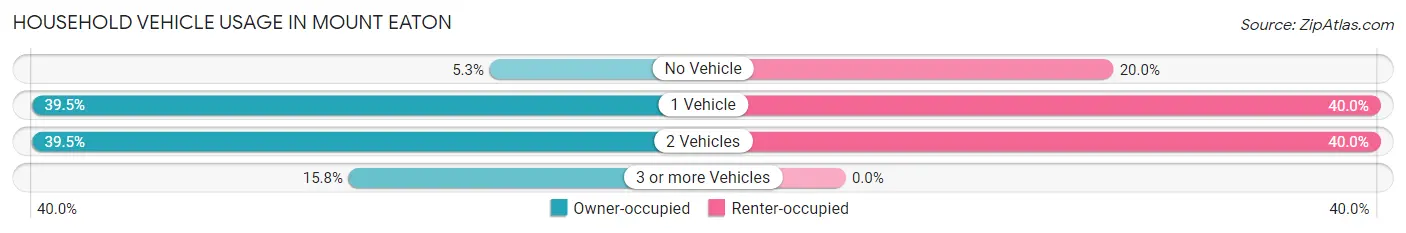
| Vehicles per Household | Owner-occupied | Renter-occupied |
| No Vehicle | 2 (5.3%) | 3 (20.0%) |
| 1 Vehicle | 15 (39.5%) | 6 (40.0%) |
| 2 Vehicles | 15 (39.5%) | 6 (40.0%) |
| 3 or more Vehicles | 6 (15.8%) | 0 (0.0%) |
| Total | 38 (100.0%) | 15 (100.0%) |
Real Estate & Mortgages in Mount Eaton
Real Estate and Mortgage Overview in Mount Eaton
| Characteristic | Without Mortgage | With Mortgage |
| Housing Units | 15 | 23 |
| Median Property Value | $146,900 | $157,500 |
| Median Household Income | - | - |
| Monthly Housing Costs | $379 | $0 |
| Real Estate Taxes | $1,792 | $0 |
Property Value by Mortgage Status in Mount Eaton
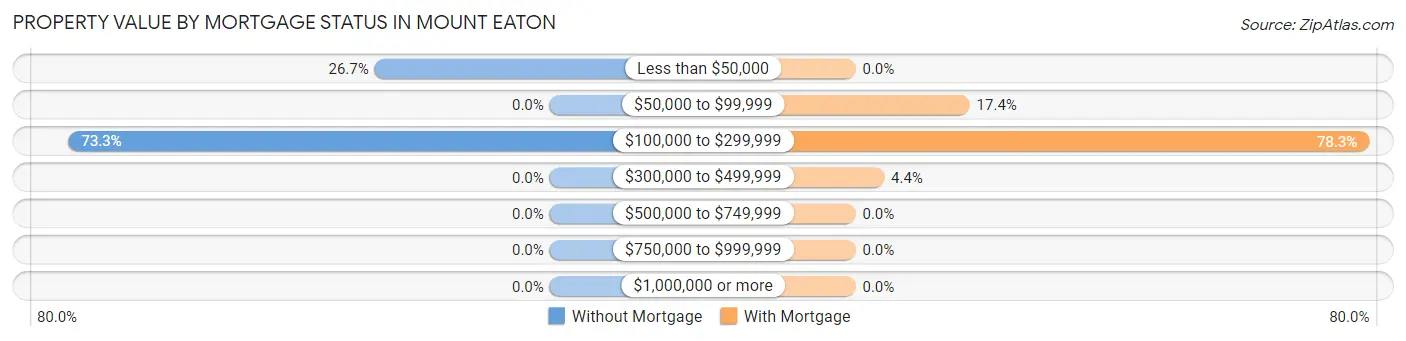
| Property Value | Without Mortgage | With Mortgage |
| Less than $50,000 | 4 (26.7%) | 0 (0.0%) |
| $50,000 to $99,999 | 0 (0.0%) | 4 (17.4%) |
| $100,000 to $299,999 | 11 (73.3%) | 18 (78.3%) |
| $300,000 to $499,999 | 0 (0.0%) | 1 (4.3%) |
| $500,000 to $749,999 | 0 (0.0%) | 0 (0.0%) |
| $750,000 to $999,999 | 0 (0.0%) | 0 (0.0%) |
| $1,000,000 or more | 0 (0.0%) | 0 (0.0%) |
| Total | 15 (100.0%) | 23 (100.0%) |
Household Income by Mortgage Status in Mount Eaton
| Household Income | Without Mortgage | With Mortgage |
| Less than $10,000 | 4 (26.7%) | 0 (0.0%) |
| $10,000 to $24,999 | 2 (13.3%) | 0 (0.0%) |
| $25,000 to $34,999 | 0 (0.0%) | 1 (4.3%) |
| $35,000 to $49,999 | 4 (26.7%) | 0 (0.0%) |
| $50,000 to $74,999 | 0 (0.0%) | 0 (0.0%) |
| $75,000 to $99,999 | 0 (0.0%) | 15 (65.2%) |
| $100,000 to $149,999 | 5 (33.3%) | 5 (21.7%) |
| $150,000 or more | 0 (0.0%) | 1 (4.3%) |
| Total | 15 (100.0%) | 23 (100.0%) |
Property Value to Household Income Ratio in Mount Eaton
| Value-to-Income Ratio | Without Mortgage | With Mortgage |
| Less than 2.0x | 5 (33.3%) | 67,750 (294,565.2%) |
| 2.0x to 2.9x | 4 (26.7%) | 11 (47.8%) |
| 3.0x to 3.9x | 0 (0.0%) | 6 (26.1%) |
| 4.0x or more | 2 (13.3%) | 5 (21.7%) |
| Total | 15 (100.0%) | 23 (100.0%) |
Real Estate Taxes by Mortgage Status in Mount Eaton
| Property Taxes | Without Mortgage | With Mortgage |
| Less than $800 | 4 (26.7%) | 0 (0.0%) |
| $800 to $1,499 | 0 (0.0%) | 2 (8.7%) |
| $800 to $1,499 | 11 (73.3%) | 15 (65.2%) |
| Total | 15 (100.0%) | 23 (100.0%) |
Health & Disability in Mount Eaton
Health Insurance Coverage by Age in Mount Eaton
| Age Bracket | With Coverage | Without Coverage |
| Under 6 Years | 4 (100.0%) | 0 (0.0%) |
| 6 to 18 Years | 32 (100.0%) | 0 (0.0%) |
| 19 to 25 Years | 8 (100.0%) | 0 (0.0%) |
| 26 to 34 Years | 16 (100.0%) | 0 (0.0%) |
| 35 to 44 Years | 27 (100.0%) | 0 (0.0%) |
| 45 to 54 Years | 15 (100.0%) | 0 (0.0%) |
| 55 to 64 Years | 5 (55.6%) | 4 (44.4%) |
| 65 to 74 Years | 4 (100.0%) | 0 (0.0%) |
| 75 Years and older | 13 (100.0%) | 0 (0.0%) |
| Total | 124 (96.9%) | 4 (3.1%) |
Health Insurance Coverage by Citizenship Status in Mount Eaton
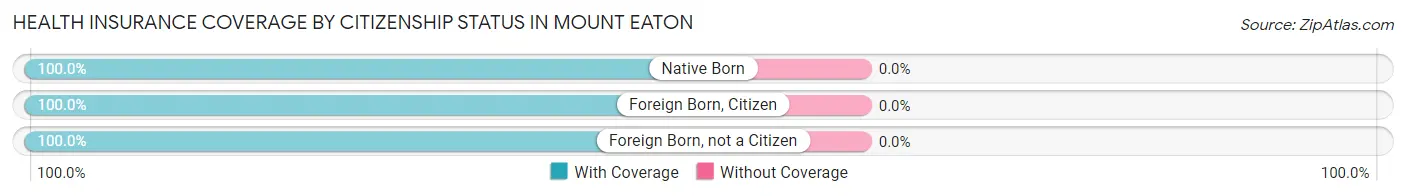
| Citizenship Status | With Coverage | Without Coverage |
| Native Born | 4 (100.0%) | 0 (0.0%) |
| Foreign Born, Citizen | 32 (100.0%) | 0 (0.0%) |
| Foreign Born, not a Citizen | 8 (100.0%) | 0 (0.0%) |
Health Insurance Coverage by Household Income in Mount Eaton
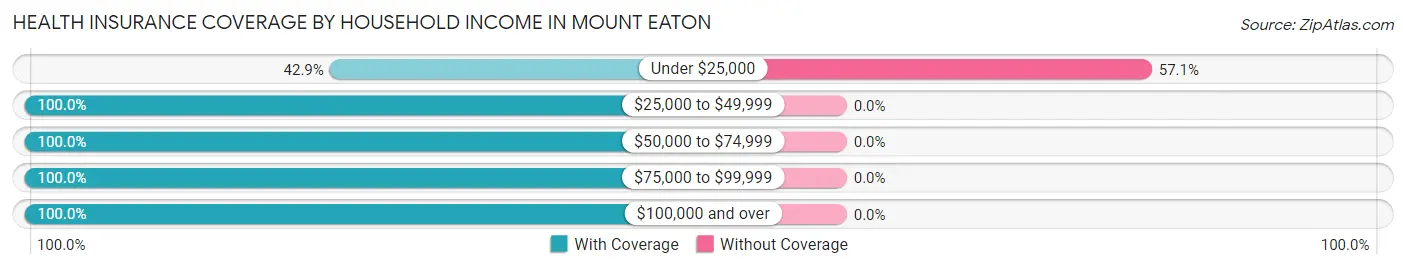
| Household Income | With Coverage | Without Coverage |
| Under $25,000 | 3 (42.9%) | 4 (57.1%) |
| $25,000 to $49,999 | 20 (100.0%) | 0 (0.0%) |
| $50,000 to $74,999 | 34 (100.0%) | 0 (0.0%) |
| $75,000 to $99,999 | 25 (100.0%) | 0 (0.0%) |
| $100,000 and over | 42 (100.0%) | 0 (0.0%) |
Public vs Private Health Insurance Coverage by Age in Mount Eaton
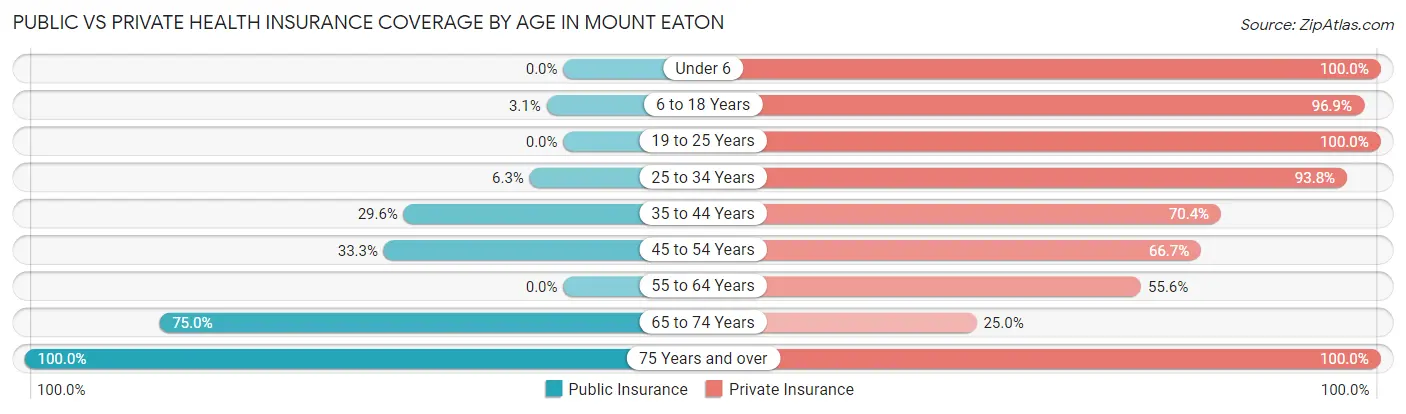
| Age Bracket | Public Insurance | Private Insurance |
| Under 6 | 0 (0.0%) | 4 (100.0%) |
| 6 to 18 Years | 1 (3.1%) | 31 (96.9%) |
| 19 to 25 Years | 0 (0.0%) | 8 (100.0%) |
| 25 to 34 Years | 1 (6.2%) | 15 (93.8%) |
| 35 to 44 Years | 8 (29.6%) | 19 (70.4%) |
| 45 to 54 Years | 5 (33.3%) | 10 (66.7%) |
| 55 to 64 Years | 0 (0.0%) | 5 (55.6%) |
| 65 to 74 Years | 3 (75.0%) | 1 (25.0%) |
| 75 Years and over | 13 (100.0%) | 13 (100.0%) |
| Total | 31 (24.2%) | 106 (82.8%) |
Disability Status by Sex by Age in Mount Eaton
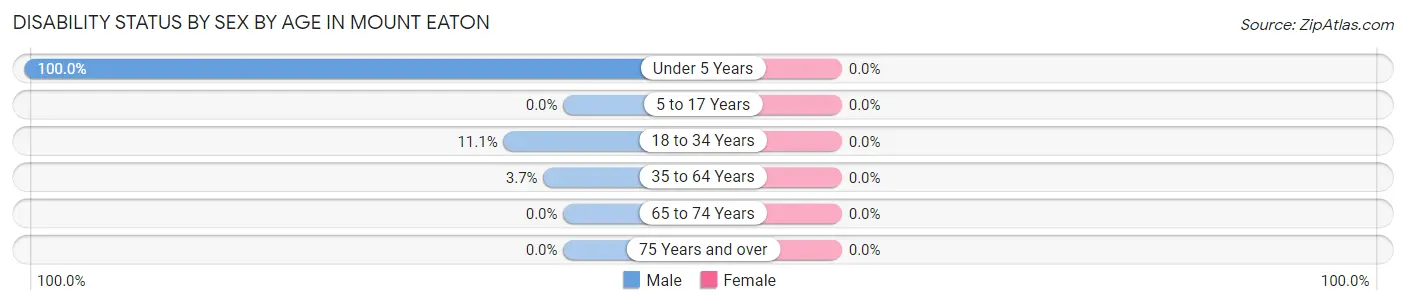
| Age Bracket | Male | Female |
| Under 5 Years | 3 (100.0%) | 0 (0.0%) |
| 5 to 17 Years | 0 (0.0%) | 0 (0.0%) |
| 18 to 34 Years | 1 (11.1%) | 0 (0.0%) |
| 35 to 64 Years | 1 (3.7%) | 0 (0.0%) |
| 65 to 74 Years | 0 (0.0%) | 0 (0.0%) |
| 75 Years and over | 0 (0.0%) | 0 (0.0%) |
Disability Class by Sex by Age in Mount Eaton
Disability Class: Hearing Difficulty
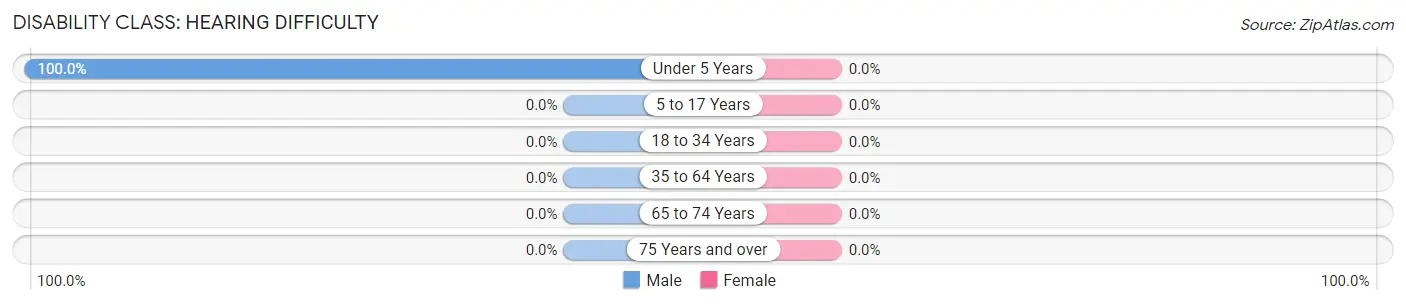
| Age Bracket | Male | Female |
| Under 5 Years | 3 (100.0%) | 0 (0.0%) |
| 5 to 17 Years | 0 (0.0%) | 0 (0.0%) |
| 18 to 34 Years | 0 (0.0%) | 0 (0.0%) |
| 35 to 64 Years | 0 (0.0%) | 0 (0.0%) |
| 65 to 74 Years | 0 (0.0%) | 0 (0.0%) |
| 75 Years and over | 0 (0.0%) | 0 (0.0%) |
Disability Class: Vision Difficulty
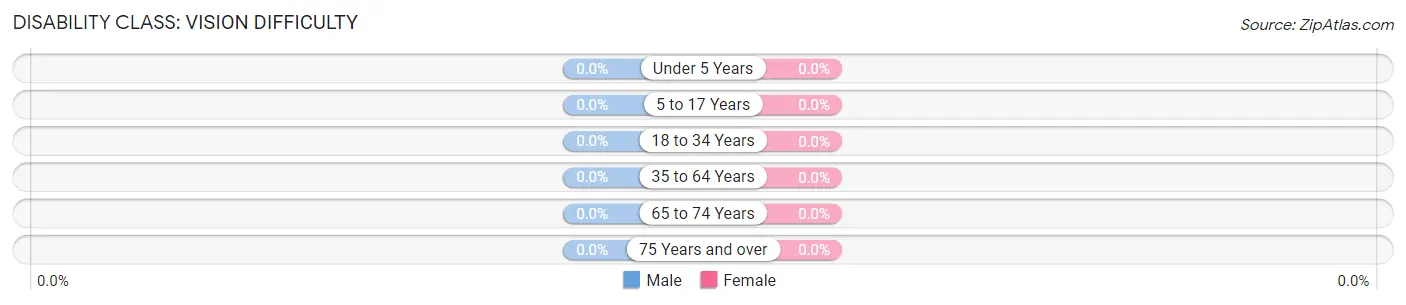
| Age Bracket | Male | Female |
| Under 5 Years | 0 (0.0%) | 0 (0.0%) |
| 5 to 17 Years | 0 (0.0%) | 0 (0.0%) |
| 18 to 34 Years | 0 (0.0%) | 0 (0.0%) |
| 35 to 64 Years | 0 (0.0%) | 0 (0.0%) |
| 65 to 74 Years | 0 (0.0%) | 0 (0.0%) |
| 75 Years and over | 0 (0.0%) | 0 (0.0%) |
Disability Class: Cognitive Difficulty
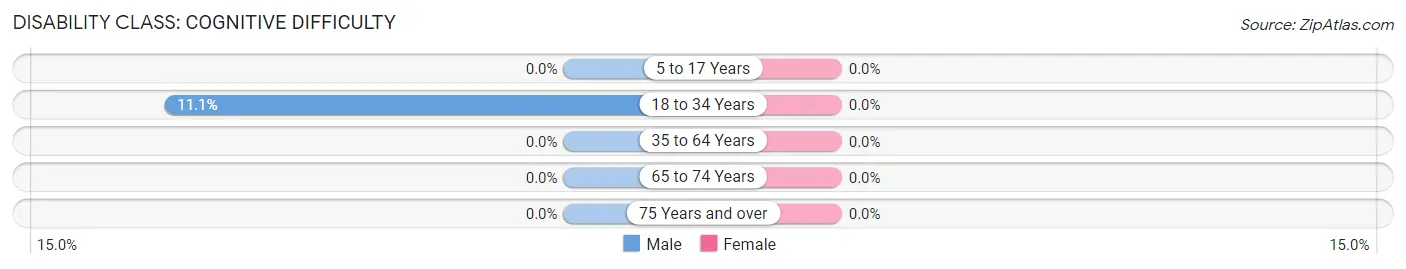
| Age Bracket | Male | Female |
| 5 to 17 Years | 0 (0.0%) | 0 (0.0%) |
| 18 to 34 Years | 1 (11.1%) | 0 (0.0%) |
| 35 to 64 Years | 0 (0.0%) | 0 (0.0%) |
| 65 to 74 Years | 0 (0.0%) | 0 (0.0%) |
| 75 Years and over | 0 (0.0%) | 0 (0.0%) |
Disability Class: Ambulatory Difficulty
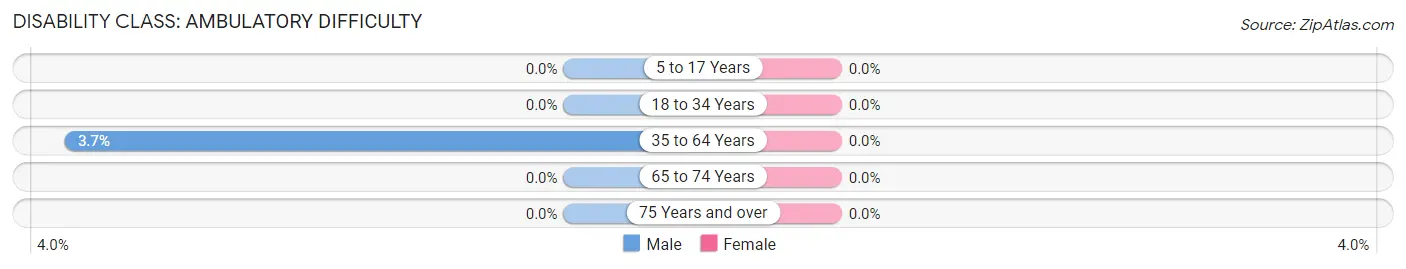
| Age Bracket | Male | Female |
| 5 to 17 Years | 0 (0.0%) | 0 (0.0%) |
| 18 to 34 Years | 0 (0.0%) | 0 (0.0%) |
| 35 to 64 Years | 1 (3.7%) | 0 (0.0%) |
| 65 to 74 Years | 0 (0.0%) | 0 (0.0%) |
| 75 Years and over | 0 (0.0%) | 0 (0.0%) |
Disability Class: Self-Care Difficulty
| Age Bracket | Male | Female |
| 5 to 17 Years | 0 (0.0%) | 0 (0.0%) |
| 18 to 34 Years | 0 (0.0%) | 0 (0.0%) |
| 35 to 64 Years | 0 (0.0%) | 0 (0.0%) |
| 65 to 74 Years | 0 (0.0%) | 0 (0.0%) |
| 75 Years and over | 0 (0.0%) | 0 (0.0%) |
Technology Access in Mount Eaton
Computing Device Access in Mount Eaton
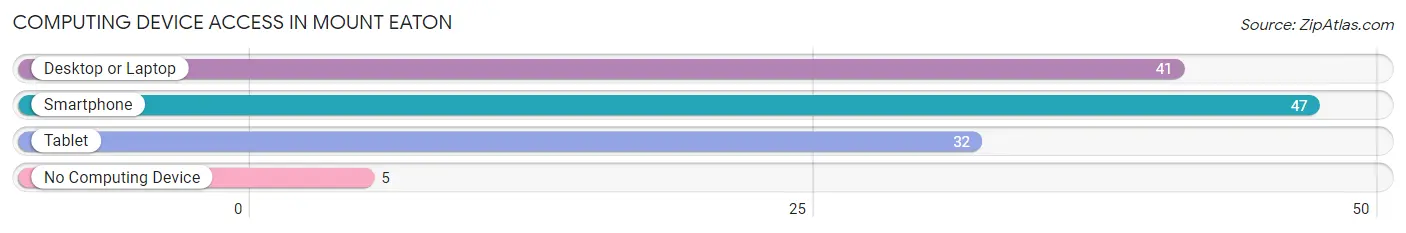
| Device Type | # Households | % Households |
| Desktop or Laptop | 41 | 77.4% |
| Smartphone | 47 | 88.7% |
| Tablet | 32 | 60.4% |
| No Computing Device | 5 | 9.4% |
| Total | 53 | 100.0% |
Internet Access in Mount Eaton
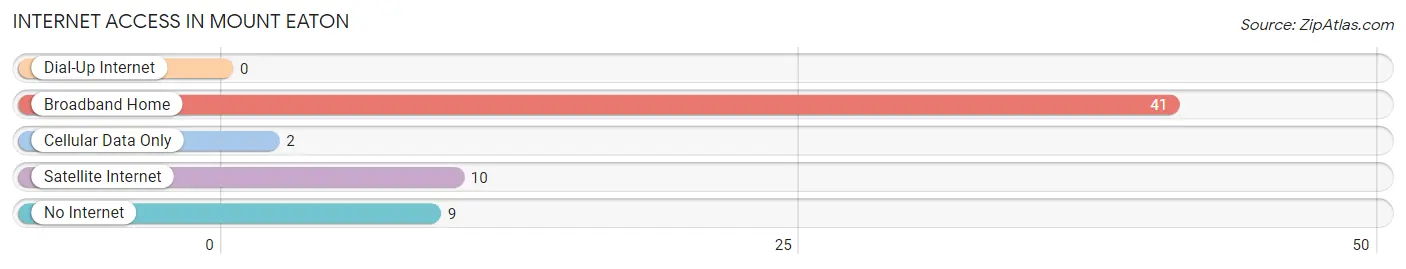
| Internet Type | # Households | % Households |
| Dial-Up Internet | 0 | 0.0% |
| Broadband Home | 41 | 77.4% |
| Cellular Data Only | 2 | 3.8% |
| Satellite Internet | 10 | 18.9% |
| No Internet | 9 | 17.0% |
| Total | 53 | 100.0% |
Mount Eaton Summary
History
Mount Eaton is a small village located in Wayne County, Ohio. It was founded in 1817 by a group of settlers from Pennsylvania. The village was named after the nearby Mount Eaton, a hill that rises to a height of 1,000 feet. The village was originally a farming community, but it has since grown to include a variety of businesses and services.
The first settlers in Mount Eaton were mostly of German descent. They were attracted to the area by its fertile soil and abundant natural resources. The village was incorporated in 1837 and soon became a thriving community. The first post office was established in 1845 and the first school was built in 1848.
The village was a major stop on the Underground Railroad, with many slaves escaping to freedom in Canada. The village was also home to a number of abolitionists, including the prominent Quaker, John Rankin.
In the late 19th century, the village began to experience a period of growth and prosperity. The railroad arrived in 1881, bringing with it new businesses and industry. The village was also home to a number of successful businesses, including a flour mill, a sawmill, a brickyard, and a furniture factory.
The village continued to grow and prosper throughout the 20th century. In the 1950s, the village was home to a number of successful businesses, including a canning factory, a dairy, and a feed mill. The village also had a number of churches, including the United Methodist Church, the Church of the Brethren, and the Church of the Nazarene.
Geography
Mount Eaton is located in Wayne County, Ohio. It is situated in the Appalachian Plateau region of the state, which is characterized by rolling hills and valleys. The village is located on the western edge of the county, near the border with Holmes County.
The village is situated on the banks of the Killbuck Creek, which flows through the village and into the nearby Killbuck Lake. The village is surrounded by a number of small towns and villages, including Apple Creek, Dalton, and Shreve.
The village is located approximately 40 miles south of Cleveland and 60 miles north of Columbus. It is also located near the intersection of Interstate 71 and State Route 83.
Economy
The economy of Mount Eaton is largely based on agriculture and tourism. The village is home to a number of small businesses, including a grocery store, a hardware store, and a restaurant. The village is also home to a number of small manufacturing companies, including a furniture factory and a canning factory.
The village is also home to a number of tourist attractions, including the Killbuck Creek State Park and the Wayne County Historical Society Museum. The village is also home to a number of festivals and events, including the annual Apple Butter Festival and the Mount Eaton Days celebration.
Demographics
As of the 2010 census, the population of Mount Eaton was 1,093. The village is predominantly white, with 95.3% of the population identifying as such. The median household income in the village is $41,250, and the median home value is $90,000.
The village is served by the Dalton Local School District. The village is also home to a number of churches, including the United Methodist Church, the Church of the Brethren, and the Church of the Nazarene.
Conclusion
Mount Eaton is a small village located in Wayne County, Ohio. It was founded in 1817 by a group of settlers from Pennsylvania and has since grown to include a variety of businesses and services. The village is largely based on agriculture and tourism, and is home to a number of small businesses, manufacturing companies, and tourist attractions. The population of the village is predominantly white, with a median household income of $41,250 and a median home value of $90,000. The village is served by the Dalton Local School District and is home to a number of churches.
Common Questions
What is Per Capita Income in Mount Eaton?
Per Capita income in Mount Eaton is $30,597.
What is the Median Family Income in Mount Eaton?
Median Family Income in Mount Eaton is $69,750.
What is the Median Household income in Mount Eaton?
Median Household Income in Mount Eaton is $66,250.
What is Inequality or Gini Index in Mount Eaton?
Inequality or Gini Index in Mount Eaton is 0.36.
What is the Total Population of Mount Eaton?
Total Population of Mount Eaton is 128.
What is the Total Male Population of Mount Eaton?
Total Male Population of Mount Eaton is 62.
What is the Total Female Population of Mount Eaton?
Total Female Population of Mount Eaton is 66.
What is the Ratio of Males per 100 Females in Mount Eaton?
There are 93.94 Males per 100 Females in Mount Eaton.
What is the Ratio of Females per 100 Males in Mount Eaton?
There are 106.45 Females per 100 Males in Mount Eaton.
What is the Median Population Age in Mount Eaton?
Median Population Age in Mount Eaton is 35.6 Years.
What is the Average Family Size in Mount Eaton
Average Family Size in Mount Eaton is 3.0 People.
What is the Average Household Size in Mount Eaton
Average Household Size in Mount Eaton is 2.4 People.
How Large is the Labor Force in Mount Eaton?
There are 90 People in the Labor Forcein in Mount Eaton.
What is the Percentage of People in the Labor Force in Mount Eaton?
90.0% of People are in the Labor Force in Mount Eaton.
What is the Unemployment Rate in Mount Eaton?
Unemployment Rate in Mount Eaton is 4.4%.