Cities with the Highest Percentage of Self-Employed / Incorporated in Vermont
RELATED REPORTS & OPTIONS
Self-Employed / Incorporated
Vermont
Compare Cities
Map of Cities with the Highest Percentage of Self-Employed / Incorporated in Vermont
0.0%
50.0%
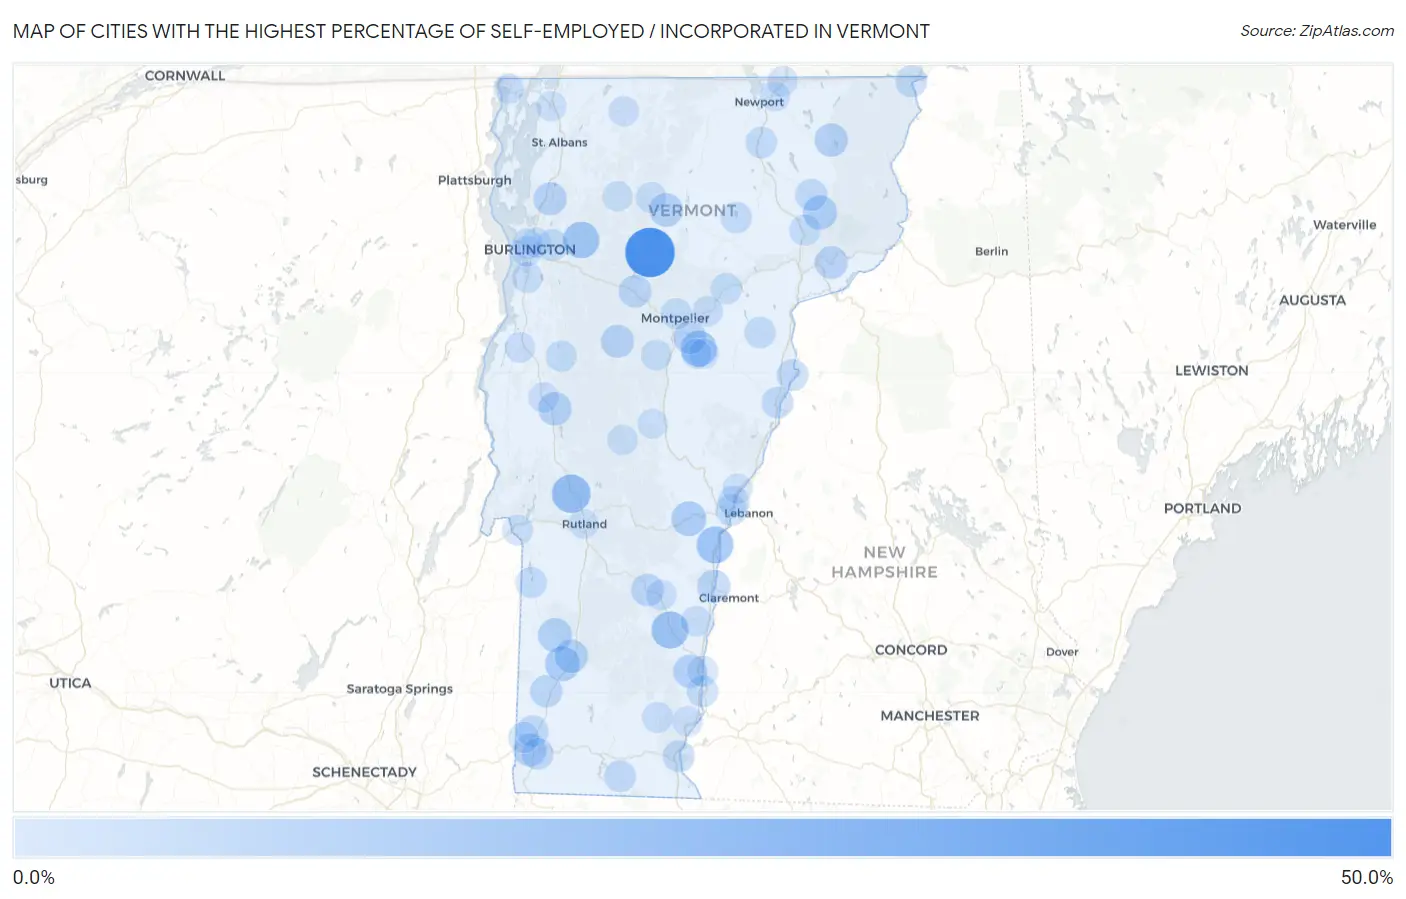
Cities with the Highest Percentage of Self-Employed / Incorporated in Vermont
| City | % Self-Employed / Incorporated | vs State | vs National | |
| 1. | Stowe | 49.2% | 4.6% (+44.6)#1 | 3.8% (+45.4)#104 |
| 2. | East Charlotte | 28.5% | 4.6% (+23.8)#2 | 3.8% (+24.6)#289 |
| 3. | Pownal | 25.5% | 4.6% (+20.9)#3 | 3.8% (+21.7)#367 |
| 4. | Pittsford | 21.4% | 4.6% (+16.8)#4 | 3.8% (+17.6)#521 |
| 5. | West Charlotte | 20.9% | 4.6% (+16.3)#5 | 3.8% (+17.1)#552 |
| 6. | Chester | 18.1% | 4.6% (+13.4)#6 | 3.8% (+14.2)#785 |
| 7. | Hartland | 17.4% | 4.6% (+12.8)#7 | 3.8% (+13.6)#826 |
| 8. | Jericho | 16.6% | 4.6% (+12.0)#8 | 3.8% (+12.8)#897 |
| 9. | Websterville | 15.7% | 4.6% (+11.1)#9 | 3.8% (+11.9)#985 |
| 10. | Grafton | 14.8% | 4.6% (+10.2)#10 | 3.8% (+11.0)#1,106 |
| 11. | Lincoln | 13.8% | 4.6% (+9.20)#11 | 3.8% (+10.0)#1,264 |
| 12. | Londonderry | 12.9% | 4.6% (+8.28)#12 | 3.8% (+9.09)#1,448 |
| 13. | Manchester | 12.8% | 4.6% (+8.23)#13 | 3.8% (+9.03)#1,456 |
| 14. | Woodstock | 12.6% | 4.6% (+7.98)#14 | 3.8% (+8.78)#1,510 |
| 15. | Weston | 11.1% | 4.6% (+6.49)#15 | 3.8% (+7.29)#1,915 |
| 16. | East Burke | 10.8% | 4.6% (+6.22)#16 | 3.8% (+7.03)#1,989 |
| 17. | Dorset | 10.7% | 4.6% (+6.07)#17 | 3.8% (+6.87)#2,035 |
| 18. | North Clarendon | 10.0% | 4.6% (+5.38)#18 | 3.8% (+6.18)#2,274 |
| 19. | Hyde Park | 9.9% | 4.6% (+5.24)#19 | 3.8% (+6.04)#2,350 |
| 20. | Saxtons River | 9.6% | 4.6% (+5.02)#20 | 3.8% (+5.82)#2,433 |
| 21. | Manchester Center | 9.5% | 4.6% (+4.87)#21 | 3.8% (+5.68)#2,485 |
| 22. | Island Pond | 9.5% | 4.6% (+4.87)#22 | 3.8% (+5.68)#2,486 |
| 23. | East Middlebury | 9.4% | 4.6% (+4.82)#23 | 3.8% (+5.62)#2,504 |
| 24. | South Londonderry | 9.1% | 4.6% (+4.52)#24 | 3.8% (+5.32)#2,627 |
| 25. | Milton | 8.7% | 4.6% (+4.12)#25 | 3.8% (+4.92)#2,854 |
| 26. | Barre | 8.6% | 4.6% (+3.94)#26 | 3.8% (+4.74)#2,949 |
| 27. | Waitsfield | 8.5% | 4.6% (+3.89)#27 | 3.8% (+4.69)#2,981 |
| 28. | Old Bennington | 8.4% | 4.6% (+3.81)#28 | 3.8% (+4.62)#3,030 |
| 29. | Ascutney | 8.3% | 4.6% (+3.71)#29 | 3.8% (+4.52)#3,092 |
| 30. | Concord | 8.3% | 4.6% (+3.71)#30 | 3.8% (+4.52)#3,097 |
| 31. | Waterbury | 7.4% | 4.6% (+2.82)#31 | 3.8% (+3.62)#3,784 |
| 32. | Ludlow | 7.4% | 4.6% (+2.75)#32 | 3.8% (+3.55)#3,845 |
| 33. | Arlington | 7.0% | 4.6% (+2.36)#33 | 3.8% (+3.16)#4,194 |
| 34. | Bolton Valley | 6.9% | 4.6% (+2.30)#34 | 3.8% (+3.11)#4,246 |
| 35. | South Lincoln | 6.5% | 4.6% (+1.92)#35 | 3.8% (+2.72)#4,656 |
| 36. | East Poultney | 6.5% | 4.6% (+1.90)#36 | 3.8% (+2.70)#4,679 |
| 37. | Huntington | 6.2% | 4.6% (+1.61)#37 | 3.8% (+2.41)#4,991 |
| 38. | Underhill Flats | 6.2% | 4.6% (+1.58)#38 | 3.8% (+2.39)#5,031 |
| 39. | West Burke | 6.0% | 4.6% (+1.35)#39 | 3.8% (+2.15)#5,332 |
| 40. | South Shaftsbury | 5.7% | 4.6% (+1.08)#40 | 3.8% (+1.89)#5,694 |
| 41. | Newbury | 5.7% | 4.6% (+1.06)#41 | 3.8% (+1.86)#5,722 |
| 42. | Bennington | 5.6% | 4.6% (+0.987)#42 | 3.8% (+1.79)#5,819 |
| 43. | Brattleboro | 5.6% | 4.6% (+0.950)#43 | 3.8% (+1.75)#5,868 |
| 44. | Canaan | 5.6% | 4.6% (+0.936)#44 | 3.8% (+1.74)#5,889 |
| 45. | Jacksonville | 5.4% | 4.6% (+0.757)#45 | 3.8% (+1.56)#6,170 |
| 46. | New Haven | 5.3% | 4.6% (+0.724)#46 | 3.8% (+1.53)#6,214 |
| 47. | Bradford | 5.3% | 4.6% (+0.708)#47 | 3.8% (+1.51)#6,247 |
| 48. | Essex Junction | 5.3% | 4.6% (+0.649)#48 | 3.8% (+1.45)#6,327 |
| 49. | Westminster | 5.2% | 4.6% (+0.585)#49 | 3.8% (+1.39)#6,432 |
| 50. | White River Junction | 5.0% | 4.6% (+0.414)#50 | 3.8% (+1.22)#6,712 |
| 51. | Orleans | 4.9% | 4.6% (+0.306)#51 | 3.8% (+1.11)#6,909 |
| 52. | Greensboro | 4.9% | 4.6% (+0.259)#52 | 3.8% (+1.06)#6,997 |
| 53. | Groton | 4.8% | 4.6% (+0.162)#53 | 3.8% (+0.964)#7,155 |
| 54. | Lyndonville | 4.5% | 4.6% (-0.144)#54 | 3.8% (+0.658)#7,789 |
| 55. | Whitingham | 4.3% | 4.6% (-0.271)#55 | 3.8% (+0.531)#8,065 |
| 56. | Marshfield | 4.3% | 4.6% (-0.295)#56 | 3.8% (+0.507)#8,110 |
| 57. | Pawlet | 4.2% | 4.6% (-0.418)#57 | 3.8% (+0.384)#8,403 |
| 58. | Chittenden | 4.1% | 4.6% (-0.496)#58 | 3.8% (+0.307)#8,582 |
| 59. | Wells | 4.0% | 4.6% (-0.601)#59 | 3.8% (+0.201)#8,828 |
| 60. | Pownal Center | 3.9% | 4.6% (-0.723)#60 | 3.8% (+0.079)#9,137 |
| 61. | St. George | 3.8% | 4.6% (-0.792)#61 | 3.8% (+0.011)#9,340 |
| 62. | North Bennington | 3.8% | 4.6% (-0.846)#62 | 3.8% (-0.044)#9,474 |
| 63. | Bristol | 3.8% | 4.6% (-0.858)#63 | 3.8% (-0.055)#9,508 |
| 64. | Wilder | 3.7% | 4.6% (-0.873)#64 | 3.8% (-0.071)#9,550 |
| 65. | Montpelier | 3.7% | 4.6% (-0.884)#65 | 3.8% (-0.082)#9,581 |
| 66. | Johnson | 3.7% | 4.6% (-0.937)#66 | 3.8% (-0.135)#9,728 |
| 67. | West Woodstock | 3.6% | 4.6% (-1.03)#67 | 3.8% (-0.230)#9,986 |
| 68. | Newfane | 3.5% | 4.6% (-1.11)#68 | 3.8% (-0.308)#10,219 |
| 69. | Stamford | 3.4% | 4.6% (-1.19)#69 | 3.8% (-0.384)#10,469 |
| 70. | Bellows Falls | 3.4% | 4.6% (-1.22)#70 | 3.8% (-0.416)#10,585 |
| 71. | South Hero | 3.3% | 4.6% (-1.32)#71 | 3.8% (-0.520)#10,927 |
| 72. | Springfield | 3.2% | 4.6% (-1.42)#72 | 3.8% (-0.617)#11,231 |
| 73. | Northfield | 3.2% | 4.6% (-1.43)#73 | 3.8% (-0.627)#11,264 |
| 74. | Plainfield | 3.2% | 4.6% (-1.44)#74 | 3.8% (-0.643)#11,324 |
| 75. | Fair Haven | 3.1% | 4.6% (-1.50)#75 | 3.8% (-0.697)#11,512 |
| 76. | Shelburne | 3.1% | 4.6% (-1.54)#76 | 3.8% (-0.734)#11,623 |
| 77. | West Pawlet | 3.0% | 4.6% (-1.61)#77 | 3.8% (-0.805)#11,854 |
| 78. | Hartford | 3.0% | 4.6% (-1.65)#78 | 3.8% (-0.852)#12,021 |
| 79. | Burlington | 2.9% | 4.6% (-1.69)#79 | 3.8% (-0.887)#12,131 |
| 80. | Proctorsville | 2.9% | 4.6% (-1.71)#80 | 3.8% (-0.905)#12,194 |
| 81. | Rochester | 2.9% | 4.6% (-1.71)#81 | 3.8% (-0.905)#12,195 |
| 82. | Vergennes | 2.9% | 4.6% (-1.74)#82 | 3.8% (-0.940)#12,316 |
| 83. | Westford | 2.8% | 4.6% (-1.82)#83 | 3.8% (-1.01)#12,598 |
| 84. | South Burlington | 2.8% | 4.6% (-1.82)#84 | 3.8% (-1.02)#12,601 |
| 85. | Middlebury | 2.8% | 4.6% (-1.83)#85 | 3.8% (-1.03)#12,630 |
| 86. | Castleton Four Corners | 2.7% | 4.6% (-1.89)#86 | 3.8% (-1.09)#12,903 |
| 87. | Enosburg Falls | 2.7% | 4.6% (-1.96)#87 | 3.8% (-1.16)#13,151 |
| 88. | Putney | 2.6% | 4.6% (-2.01)#88 | 3.8% (-1.21)#13,340 |
| 89. | Derby Line | 2.5% | 4.6% (-2.16)#89 | 3.8% (-1.36)#13,977 |
| 90. | Lunenburg | 2.4% | 4.6% (-2.26)#90 | 3.8% (-1.45)#14,349 |
| 91. | Jeffersonville | 2.3% | 4.6% (-2.28)#91 | 3.8% (-1.48)#14,452 |
| 92. | Alburgh | 2.3% | 4.6% (-2.33)#92 | 3.8% (-1.52)#14,627 |
| 93. | East Barre | 2.2% | 4.6% (-2.41)#93 | 3.8% (-1.61)#14,964 |
| 94. | Derby Center | 2.0% | 4.6% (-2.60)#94 | 3.8% (-1.80)#15,785 |
| 95. | Randolph | 1.9% | 4.6% (-2.67)#95 | 3.8% (-1.87)#16,053 |
| 96. | Swanton | 1.9% | 4.6% (-2.70)#96 | 3.8% (-1.90)#16,177 |
| 97. | Norwich | 1.9% | 4.6% (-2.77)#97 | 3.8% (-1.97)#16,476 |
| 98. | Winooski | 1.8% | 4.6% (-2.79)#98 | 3.8% (-1.99)#16,564 |
| 99. | Graniteville | 1.8% | 4.6% (-2.81)#99 | 3.8% (-2.01)#16,653 |
| 100. | Rutland | 1.7% | 4.6% (-2.88)#100 | 3.8% (-2.08)#16,947 |
1
2Common Questions
What are the Top 10 Cities with the Highest Percentage of Self-Employed / Incorporated in Vermont?
Top 10 Cities with the Highest Percentage of Self-Employed / Incorporated in Vermont are:
#1
49.2%
#2
21.4%
#3
18.1%
#4
17.4%
#5
16.6%
#6
15.7%
#7
12.8%
#8
12.6%
#9
10.8%
#10
10.7%
What city has the Highest Percentage of Self-Employed / Incorporated in Vermont?
Stowe has the Highest Percentage of Self-Employed / Incorporated in Vermont with 49.2%.
What is the Percentage of Self-Employed / Incorporated in the State of Vermont?
Percentage of Self-Employed / Incorporated in Vermont is 4.6%.
What is the Percentage of Self-Employed / Incorporated in the United States?
Percentage of Self-Employed / Incorporated in the United States is 3.8%.