Cities with the Highest Percentage of Self-Employed / Incorporated in South Dakota
RELATED REPORTS & OPTIONS
Self-Employed / Incorporated
South Dakota
Compare Cities
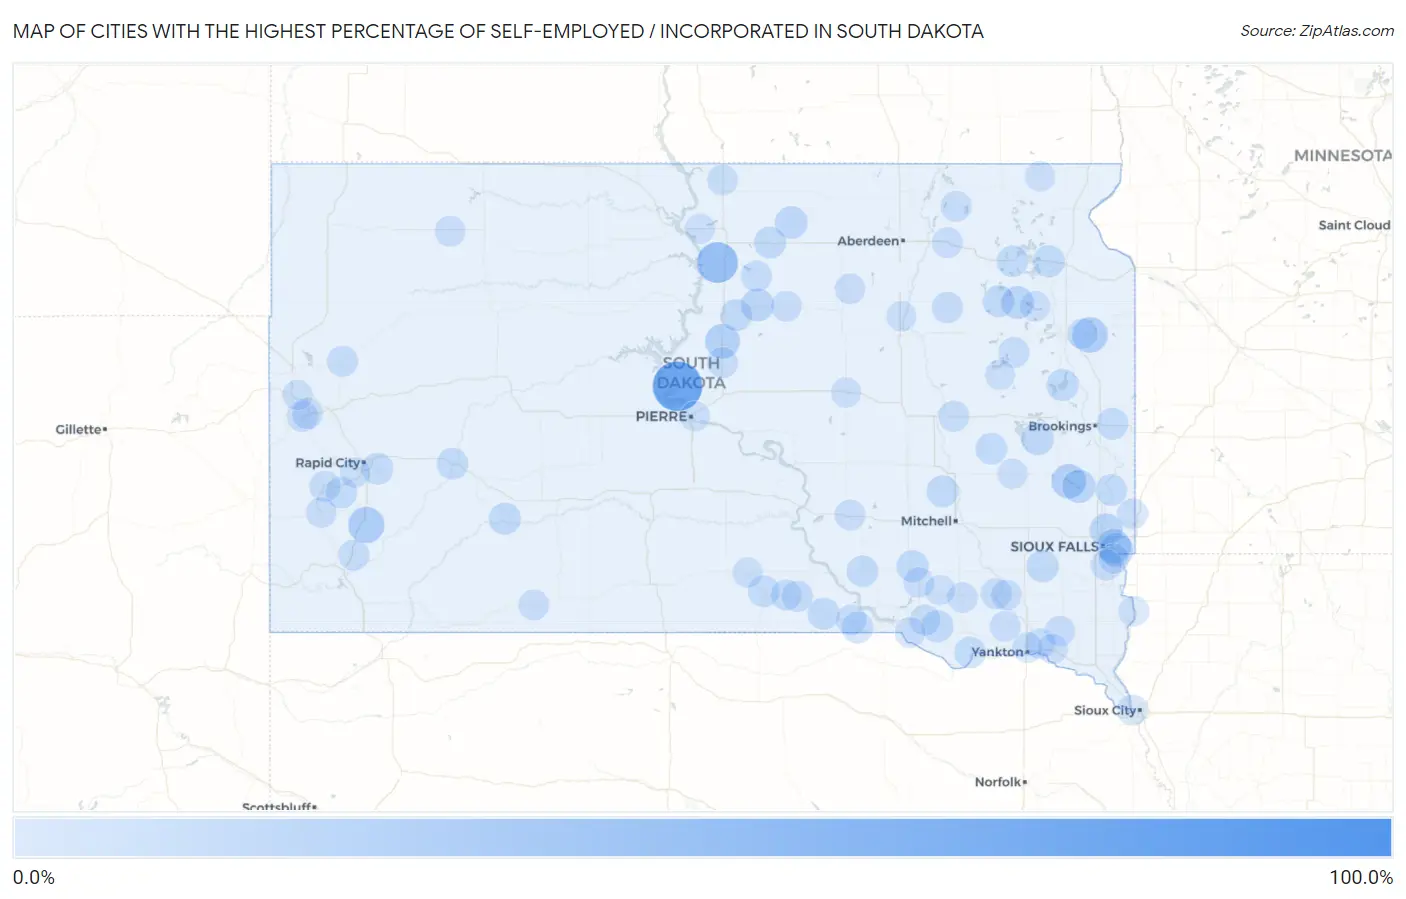
Map of Cities with the Highest Percentage of Self-Employed / Incorporated in South Dakota
0.0%
100.0%
Cities with the Highest Percentage of Self-Employed / Incorporated in South Dakota
| City | % Self-Employed / Incorporated | vs State | vs National | |
| 1. | Meckling | 100.0% | 4.2%(+95.8)#1 | 3.8%(+96.2)#17 |
| 2. | Shannon Colony | 100.0% | 4.2%(+95.8)#2 | 3.8%(+96.2)#19 |
| 3. | Cow Creek | 74.5% | 4.2%(+70.3)#3 | 3.8%(+70.7)#37 |
| 4. | Grassland Colony | 66.7% | 4.2%(+62.5)#4 | 3.8%(+62.8)#43 |
| 5. | Akaska | 42.9% | 4.2%(+38.6)#5 | 3.8%(+39.0)#136 |
| 6. | Rowena | 39.3% | 4.2%(+35.1)#6 | 3.8%(+35.5)#162 |
| 7. | Fairburn | 26.7% | 4.2%(+22.5)#7 | 3.8%(+22.8)#330 |
| 8. | Mountain Plains | 24.5% | 4.2%(+20.3)#8 | 3.8%(+20.7)#401 |
| 9. | Lantry | 23.8% | 4.2%(+19.6)#9 | 3.8%(+20.0)#421 |
| 10. | Goodwin | 23.7% | 4.2%(+19.5)#10 | 3.8%(+19.9)#423 |
| 11. | Agar | 21.2% | 4.2%(+16.9)#11 | 3.8%(+17.3)#538 |
| 12. | Lake Madison | 20.7% | 4.2%(+16.5)#12 | 3.8%(+16.9)#566 |
| 13. | Pine Lakes Addition | 19.0% | 4.2%(+14.8)#13 | 3.8%(+15.1)#702 |
| 14. | Anderson | 18.8% | 4.2%(+14.6)#14 | 3.8%(+15.0)#712 |
| 15. | Prairiewood | 17.5% | 4.2%(+13.3)#15 | 3.8%(+13.7)#818 |
| 16. | Mina | 17.5% | 4.2%(+13.2)#16 | 3.8%(+13.6)#820 |
| 17. | Angostura | 16.7% | 4.2%(+12.5)#17 | 3.8%(+12.8)#885 |
| 18. | Brant Lake | 16.3% | 4.2%(+12.1)#18 | 3.8%(+12.5)#916 |
| 19. | Lebanon | 14.9% | 4.2%(+10.7)#19 | 3.8%(+11.1)#1,096 |
| 20. | Renner Corner | 14.6% | 4.2%(+10.3)#20 | 3.8%(+10.7)#1,137 |
| 21. | Wallace | 14.3% | 4.2%(+10.1)#21 | 3.8%(+10.5)#1,180 |
| 22. | Oldham | 14.0% | 4.2%(+9.82)#22 | 3.8%(+10.2)#1,230 |
| 23. | Hosmer | 14.0% | 4.2%(+9.76)#23 | 3.8%(+10.2)#1,241 |
| 24. | Glendale Colony | 12.5% | 4.2%(+8.28)#24 | 3.8%(+8.68)#1,530 |
| 25. | Interior | 12.5% | 4.2%(+8.28)#25 | 3.8%(+8.68)#1,538 |
| 26. | Dante | 12.3% | 4.2%(+8.09)#26 | 3.8%(+8.49)#1,576 |
| 27. | Lake Poinsett | 11.9% | 4.2%(+7.72)#27 | 3.8%(+8.11)#1,673 |
| 28. | Ortley | 11.8% | 4.2%(+7.55)#28 | 3.8%(+7.95)#1,726 |
| 29. | Marion | 11.7% | 4.2%(+7.52)#29 | 3.8%(+7.92)#1,732 |
| 30. | Letcher | 11.6% | 4.2%(+7.41)#30 | 3.8%(+7.81)#1,759 |
| 31. | Gettysburg | 11.6% | 4.2%(+7.40)#31 | 3.8%(+7.80)#1,764 |
| 32. | Corsica | 11.6% | 4.2%(+7.37)#32 | 3.8%(+7.76)#1,773 |
| 33. | Bowdle | 11.1% | 4.2%(+6.90)#33 | 3.8%(+7.29)#1,896 |
| 34. | Bradley | 11.1% | 4.2%(+6.90)#34 | 3.8%(+7.29)#1,906 |
| 35. | Herrick | 11.1% | 4.2%(+6.90)#35 | 3.8%(+7.29)#1,912 |
| 36. | Green Valley | 10.9% | 4.2%(+6.64)#36 | 3.8%(+7.04)#1,984 |
| 37. | Colome | 10.8% | 4.2%(+6.63)#37 | 3.8%(+7.03)#1,986 |
| 38. | Keystone | 10.7% | 4.2%(+6.48)#38 | 3.8%(+6.88)#2,031 |
| 39. | Fairfax | 10.6% | 4.2%(+6.39)#39 | 3.8%(+6.79)#2,069 |
| 40. | Trent | 10.5% | 4.2%(+6.28)#40 | 3.8%(+6.68)#2,107 |
| 41. | Platte | 10.5% | 4.2%(+6.27)#41 | 3.8%(+6.67)#2,109 |
| 42. | Carthage | 10.4% | 4.2%(+6.17)#42 | 3.8%(+6.57)#2,148 |
| 43. | Webster | 10.1% | 4.2%(+5.89)#43 | 3.8%(+6.29)#2,222 |
| 44. | Bushnell | 10.0% | 4.2%(+5.78)#44 | 3.8%(+6.18)#2,294 |
| 45. | Springfield | 9.7% | 4.2%(+5.50)#45 | 3.8%(+5.90)#2,400 |
| 46. | Wasta | 9.7% | 4.2%(+5.46)#46 | 3.8%(+5.86)#2,417 |
| 47. | Boulder Canyon | 9.6% | 4.2%(+5.35)#47 | 3.8%(+5.75)#2,461 |
| 48. | Turton | 9.1% | 4.2%(+4.88)#48 | 3.8%(+5.27)#2,661 |
| 49. | Hill City | 8.6% | 4.2%(+4.37)#49 | 3.8%(+4.77)#2,930 |
| 50. | Olivet | 8.6% | 4.2%(+4.36)#50 | 3.8%(+4.75)#2,945 |
| 51. | Gregory | 8.4% | 4.2%(+4.15)#51 | 3.8%(+4.55)#3,069 |
| 52. | Cavour | 8.3% | 4.2%(+4.12)#52 | 3.8%(+4.52)#3,096 |
| 53. | Central City | 8.3% | 4.2%(+4.12)#53 | 3.8%(+4.52)#3,104 |
| 54. | Naples | 8.3% | 4.2%(+4.12)#54 | 3.8%(+4.52)#3,107 |
| 55. | Dallas | 8.2% | 4.2%(+3.98)#55 | 3.8%(+4.38)#3,209 |
| 56. | Harrisburg | 8.2% | 4.2%(+3.97)#56 | 3.8%(+4.37)#3,215 |
| 57. | Wagner | 8.2% | 4.2%(+3.97)#57 | 3.8%(+4.37)#3,216 |
| 58. | Hoven | 8.1% | 4.2%(+3.89)#58 | 3.8%(+4.29)#3,265 |
| 59. | Kenel | 8.1% | 4.2%(+3.85)#59 | 3.8%(+4.25)#3,294 |
| 60. | Newell | 8.1% | 4.2%(+3.84)#60 | 3.8%(+4.24)#3,299 |
| 61. | Buffalo Gap | 8.0% | 4.2%(+3.78)#61 | 3.8%(+4.18)#3,343 |
| 62. | Onida | 8.0% | 4.2%(+3.74)#62 | 3.8%(+4.13)#3,376 |
| 63. | Claremont | 7.8% | 4.2%(+3.63)#63 | 3.8%(+4.03)#3,451 |
| 64. | Deadwood | 7.7% | 4.2%(+3.50)#64 | 3.8%(+3.90)#3,549 |
| 65. | Dakota Dunes | 7.5% | 4.2%(+3.30)#65 | 3.8%(+3.69)#3,725 |
| 66. | Groton | 7.4% | 4.2%(+3.15)#66 | 3.8%(+3.54)#3,850 |
| 67. | Kimball | 7.3% | 4.2%(+3.05)#67 | 3.8%(+3.44)#3,947 |
| 68. | Martin | 7.2% | 4.2%(+3.00)#68 | 3.8%(+3.40)#3,990 |
| 69. | Custer | 7.2% | 4.2%(+2.96)#69 | 3.8%(+3.36)#4,021 |
| 70. | Sherman | 7.1% | 4.2%(+2.93)#70 | 3.8%(+3.33)#4,058 |
| 71. | Seneca | 7.1% | 4.2%(+2.93)#71 | 3.8%(+3.33)#4,059 |
| 72. | Herreid | 7.1% | 4.2%(+2.90)#72 | 3.8%(+3.30)#4,074 |
| 73. | Menno | 7.0% | 4.2%(+2.80)#73 | 3.8%(+3.20)#4,151 |
| 74. | Cresbard | 7.0% | 4.2%(+2.76)#74 | 3.8%(+3.16)#4,199 |
| 75. | Marty | 6.9% | 4.2%(+2.68)#75 | 3.8%(+3.08)#4,272 |
| 76. | Oahe Acres | 6.9% | 4.2%(+2.66)#76 | 3.8%(+3.06)#4,296 |
| 77. | Bonesteel | 6.8% | 4.2%(+2.60)#77 | 3.8%(+3.00)#4,360 |
| 78. | Lesterville | 6.8% | 4.2%(+2.54)#78 | 3.8%(+2.94)#4,429 |
| 79. | Bison | 6.7% | 4.2%(+2.51)#79 | 3.8%(+2.91)#4,463 |
| 80. | Mission Hill | 6.7% | 4.2%(+2.45)#80 | 3.8%(+2.85)#4,521 |
| 81. | Tripp | 6.6% | 4.2%(+2.35)#81 | 3.8%(+2.75)#4,631 |
| 82. | Wakonda | 6.6% | 4.2%(+2.34)#82 | 3.8%(+2.74)#4,641 |
| 83. | Kranzburg | 6.5% | 4.2%(+2.24)#83 | 3.8%(+2.63)#4,741 |
| 84. | Armour | 6.3% | 4.2%(+2.12)#84 | 3.8%(+2.52)#4,856 |
| 85. | Florence | 6.1% | 4.2%(+1.91)#85 | 3.8%(+2.31)#5,123 |
| 86. | Hudson | 6.0% | 4.2%(+1.82)#86 | 3.8%(+2.22)#5,247 |
| 87. | Veblen | 6.0% | 4.2%(+1.81)#87 | 3.8%(+2.21)#5,261 |
| 88. | Shindler | 6.0% | 4.2%(+1.76)#88 | 3.8%(+2.16)#5,320 |
| 89. | Glenham | 6.0% | 4.2%(+1.75)#89 | 3.8%(+2.15)#5,337 |
| 90. | Howard | 6.0% | 4.2%(+1.75)#90 | 3.8%(+2.15)#5,339 |
| 91. | Gayville | 5.9% | 4.2%(+1.64)#91 | 3.8%(+2.04)#5,472 |
| 92. | Spearfish | 5.8% | 4.2%(+1.60)#92 | 3.8%(+2.00)#5,526 |
| 93. | Ashton | 5.8% | 4.2%(+1.60)#93 | 3.8%(+2.00)#5,531 |
| 94. | Miller | 5.8% | 4.2%(+1.55)#94 | 3.8%(+1.95)#5,609 |
| 95. | Winner | 5.7% | 4.2%(+1.47)#95 | 3.8%(+1.87)#5,716 |
| 96. | Delmont | 5.7% | 4.2%(+1.47)#96 | 3.8%(+1.86)#5,725 |
| 97. | Yankton | 5.5% | 4.2%(+1.31)#97 | 3.8%(+1.70)#5,954 |
| 98. | Willow Lake | 5.5% | 4.2%(+1.29)#98 | 3.8%(+1.69)#5,973 |
| 99. | Pierre | 5.5% | 4.2%(+1.27)#99 | 3.8%(+1.67)#6,001 |
| 100. | Colonial Pine Hills | 5.5% | 4.2%(+1.26)#100 | 3.8%(+1.66)#6,014 |
Common Questions
What are the Top 10 Cities with the Highest Percentage of Self-Employed / Incorporated in South Dakota?
Top 10 Cities with the Highest Percentage of Self-Employed / Incorporated in South Dakota are:
#1
74.5%
#2
42.9%
#3
26.7%
#4
23.7%
#5
21.2%
#6
20.7%
#7
19.0%
#8
18.8%
#9
16.3%
#10
14.9%
What city has the Highest Percentage of Self-Employed / Incorporated in South Dakota?
Cow Creek has the Highest Percentage of Self-Employed / Incorporated in South Dakota with 74.5%.
What is the Percentage of Self-Employed / Incorporated in the State of South Dakota?
Percentage of Self-Employed / Incorporated in South Dakota is 4.2%.
What is the Percentage of Self-Employed / Incorporated in the United States?
Percentage of Self-Employed / Incorporated in the United States is 3.8%.