Cities with the Highest Percentage of Self-Employed / Incorporated in the United States
RELATED REPORTS & OPTIONS
Self-Employed / Incorporated
United States
Compare Cities
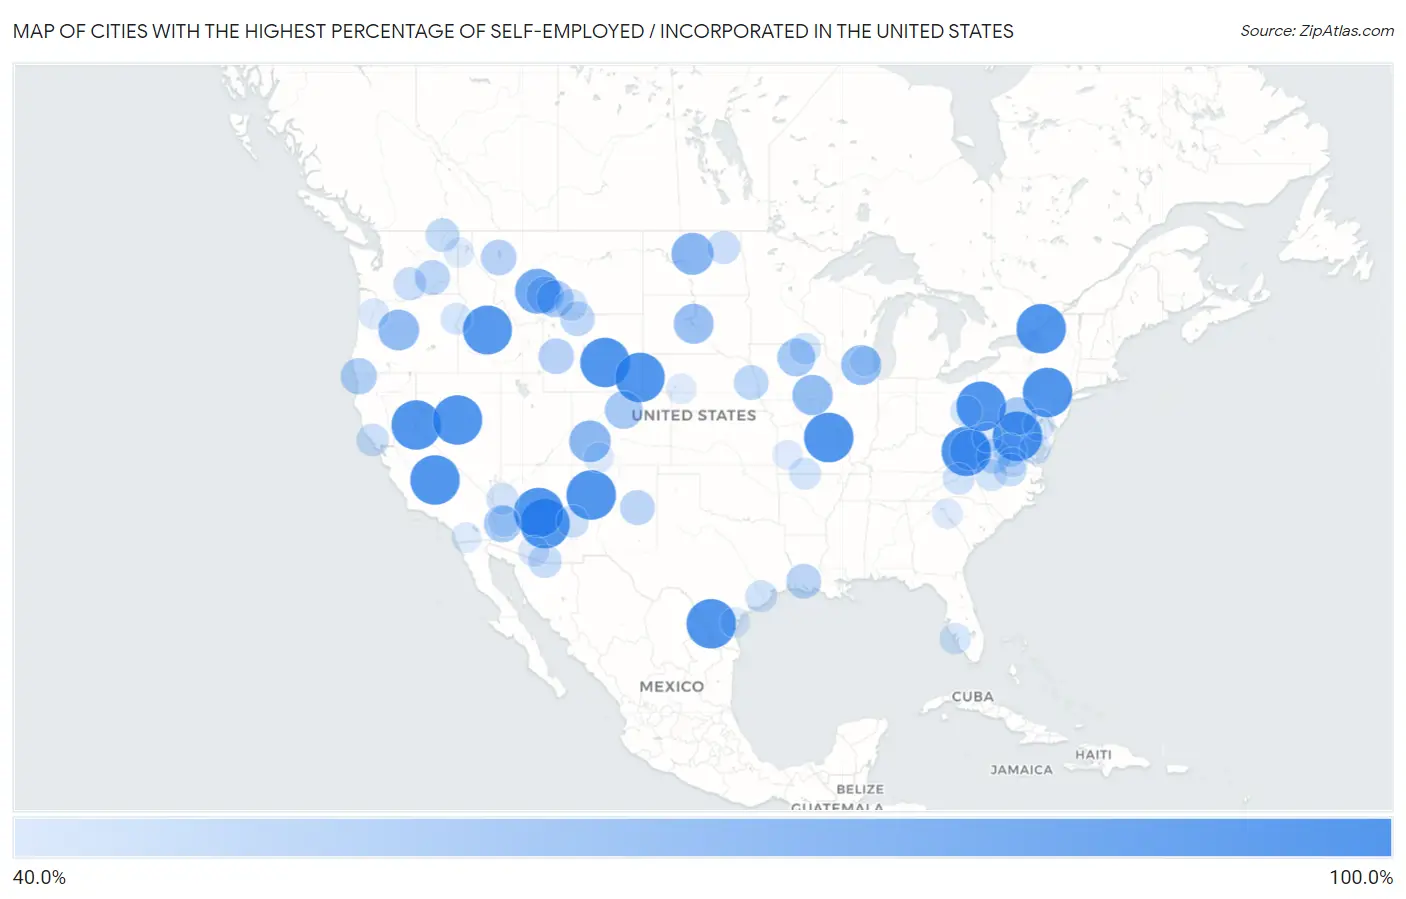
Map of Cities with the Highest Percentage of Self-Employed / Incorporated in the United States
0.0%
100.0%
Cities with the Highest Percentage of Self-Employed / Incorporated in the United States
| City | % Self-Employed / Incorporated | vs State | vs National | |
| 1. | Lobo Canyon | 100.0% | 3.1%(+96.9)#1 | 3.8%(+96.2)#1 |
| 2. | Albrightsville | 100.0% | 3.0%(+97.0)#1 | 3.8%(+96.2)#2 |
| 3. | Millville | 100.0% | 3.2%(+96.8)#1 | 3.8%(+96.2)#3 |
| 4. | Crystal Bay | 100.0% | 3.7%(+96.3)#1 | 3.8%(+96.2)#4 |
| 5. | Rock House | 100.0% | 3.9%(+96.1)#1 | 3.8%(+96.2)#5 |
| 6. | Chimney Point | 100.0% | 3.5%(+96.5)#1 | 3.8%(+96.2)#6 |
| 7. | Alcova | 100.0% | 4.9%(+95.1)#1 | 3.8%(+96.2)#7 |
| 8. | Camp Nelson | 100.0% | 3.8%(+96.2)#1 | 3.8%(+96.2)#8 |
| 9. | Flowing Springs | 100.0% | 3.9%(+96.1)#2 | 3.8%(+96.2)#10 |
| 10. | Paris | 100.0% | 3.4%(+96.6)#1 | 3.8%(+96.2)#11 |
| 11. | Fishers Landing | 100.0% | 3.9%(+96.1)#1 | 3.8%(+96.2)#12 |
| 12. | Calverton | 100.0% | 3.4%(+96.6)#2 | 3.8%(+96.2)#13 |
| 13. | Goodmanville | 100.0% | 3.8%(+96.2)#2 | 3.8%(+96.2)#14 |
| 14. | Eccles | 100.0% | 2.6%(+97.4)#1 | 3.8%(+96.2)#15 |
| 15. | Los Arcos | 100.0% | 3.4%(+96.6)#1 | 3.8%(+96.2)#16 |
| 16. | Westland | 100.0% | 3.0%(+97.0)#2 | 3.8%(+96.2)#17 |
| 17. | Meckling | 100.0% | 4.2%(+95.8)#1 | 3.8%(+96.2)#18 |
| 18. | Hawk Springs | 100.0% | 4.9%(+95.1)#2 | 3.8%(+96.2)#19 |
| 19. | Shannon Colony | 100.0% | 4.2%(+95.8)#2 | 3.8%(+96.2)#20 |
| 20. | San Mateo | 100.0% | 3.1%(+96.9)#2 | 3.8%(+96.2)#21 |
| 21. | Austin | 100.0% | 3.7%(+96.3)#2 | 3.8%(+96.2)#22 |
| 22. | Duncan Ranch Colony | 100.0% | 6.0%(+94.0)#1 | 3.8%(+96.2)#23 |
| 23. | Three Creeks | 100.0% | 3.2%(+96.8)#1 | 3.8%(+96.2)#24 |
| 24. | Stoneridge | 100.0% | 3.1%(+96.9)#3 | 3.8%(+96.2)#25 |
| 25. | Goldcreek | 100.0% | 6.0%(+94.0)#2 | 3.8%(+96.2)#26 |
| 26. | Stanley | 98.6% | 4.8%(+93.8)#1 | 3.8%(+94.8)#27 |
| 27. | Toston | 87.6% | 6.0%(+81.6)#3 | 3.8%(+83.8)#28 |
| 28. | Rivergrove | 81.5% | 3.8%(+77.7)#3 | 3.8%(+77.7)#29 |
| 29. | Monroe | 81.0% | 3.8%(+77.2)#1 | 3.8%(+77.1)#30 |
| 30. | Balfour | 80.0% | 3.5%(+76.5)#1 | 3.8%(+76.2)#31 |
| 31. | Colona | 78.8% | 5.1%(+73.7)#1 | 3.8%(+75.0)#32 |
| 32. | Double Horn | 78.3% | 3.4%(+75.0)#2 | 3.8%(+74.5)#33 |
| 33. | Pronghorn | 77.1% | 4.2%(+72.9)#1 | 3.8%(+73.2)#34 |
| 34. | Prince | 76.5% | 2.6%(+73.9)#2 | 3.8%(+72.7)#35 |
| 35. | Douds | 75.8% | 3.7%(+72.0)#1 | 3.8%(+71.9)#36 |
| 36. | Chemung | 75.0% | 4.0%(+71.0)#1 | 3.8%(+71.2)#37 |
| 37. | Cow Creek | 74.5% | 4.2%(+70.3)#3 | 3.8%(+70.7)#38 |
| 38. | Reid | 69.4% | 3.5%(+66.0)#1 | 3.8%(+65.6)#39 |
| 39. | Tall Timber | 69.2% | 5.1%(+64.2)#2 | 3.8%(+65.4)#40 |
| 40. | Chapin | 69.1% | 3.7%(+65.4)#2 | 3.8%(+65.3)#41 |
| 41. | Brenda | 67.7% | 3.9%(+63.8)#3 | 3.8%(+63.9)#42 |
| 42. | Sedan | 67.6% | 6.0%(+61.6)#4 | 3.8%(+63.8)#43 |
| 43. | Grassland Colony | 66.7% | 4.2%(+62.5)#4 | 3.8%(+62.8)#44 |
| 44. | Springdale | 66.7% | 6.0%(+60.7)#5 | 3.8%(+62.8)#45 |
| 45. | Old River | 66.2% | 3.8%(+62.4)#4 | 3.8%(+62.4)#46 |
| 46. | Gasquet | 65.1% | 3.8%(+61.3)#5 | 3.8%(+61.3)#47 |
| 47. | Aldie | 64.3% | 3.4%(+60.8)#3 | 3.8%(+60.5)#48 |
| 48. | Rocky Point | 63.6% | 6.0%(+57.6)#6 | 3.8%(+59.8)#49 |
| 49. | Daniel | 63.4% | 4.9%(+58.6)#3 | 3.8%(+59.6)#50 |
| 50. | Fords Creek Colony | 61.7% | 6.0%(+55.7)#7 | 3.8%(+57.9)#51 |
| 51. | Hatton | 61.7% | 4.0%(+57.7)#1 | 3.8%(+57.9)#52 |
| 52. | Lake Sumner | 61.5% | 3.1%(+58.4)#4 | 3.8%(+57.7)#53 |
| 53. | Roanoke | 61.4% | 3.9%(+57.5)#1 | 3.8%(+57.5)#54 |
| 54. | Fontanelle | 61.1% | 4.2%(+56.9)#1 | 3.8%(+57.3)#55 |
| 55. | Big Island | 60.5% | 3.4%(+57.1)#4 | 3.8%(+56.7)#56 |
| 56. | Garland | 60.5% | 4.9%(+55.6)#4 | 3.8%(+56.7)#57 |
| 57. | Palmyra | 58.4% | 3.4%(+55.0)#5 | 3.8%(+54.6)#58 |
| 58. | Barstow | 58.3% | 4.0%(+54.4)#2 | 3.8%(+54.5)#59 |
| 59. | Beyerville | 57.7% | 3.9%(+53.8)#4 | 3.8%(+53.9)#60 |
| 60. | Milwaukee | 57.6% | 3.9%(+53.7)#1 | 3.8%(+53.8)#61 |
| 61. | Donald | 56.7% | 4.0%(+52.7)#3 | 3.8%(+52.9)#62 |
| 62. | Utica | 56.7% | 3.7%(+53.0)#1 | 3.8%(+52.8)#63 |
| 63. | Brocket | 56.7% | 3.5%(+53.2)#2 | 3.8%(+52.8)#64 |
| 64. | Union Level | 56.1% | 3.4%(+52.6)#6 | 3.8%(+52.3)#65 |
| 65. | Sereno Del Mar | 55.6% | 3.8%(+51.8)#6 | 3.8%(+51.7)#66 |
| 66. | Luna | 55.6% | 3.1%(+52.4)#5 | 3.8%(+51.7)#67 |
| 67. | Damon | 54.5% | 3.4%(+51.2)#3 | 3.8%(+50.7)#68 |
| 68. | Canyon Creek | 54.5% | 6.0%(+48.5)#8 | 3.8%(+50.7)#69 |
| 69. | Boyd | 54.5% | 6.0%(+48.5)#9 | 3.8%(+50.7)#70 |
| 70. | Pine Lake | 54.2% | 3.9%(+50.3)#5 | 3.8%(+50.3)#71 |
| 71. | Dorseyville | 54.1% | 3.9%(+50.2)#2 | 3.8%(+50.3)#72 |
| 72. | Valle Crucis | 53.8% | 3.9%(+49.9)#2 | 3.8%(+50.0)#73 |
| 73. | Pontiac | 53.7% | 3.2%(+50.5)#2 | 3.8%(+49.9)#74 |
| 74. | Ruffin | 53.7% | 3.9%(+49.8)#3 | 3.8%(+49.9)#75 |
| 75. | Georgetown | 53.6% | 3.5%(+50.1)#2 | 3.8%(+49.8)#76 |
| 76. | New Haven | 53.3% | 3.7%(+49.6)#3 | 3.8%(+49.5)#77 |
| 77. | Salesville | 53.1% | 3.0%(+50.1)#1 | 3.8%(+49.3)#78 |
| 78. | Richland | 52.9% | 4.2%(+48.8)#2 | 3.8%(+49.1)#79 |
| 79. | Heathsville | 52.6% | 3.4%(+49.2)#7 | 3.8%(+48.8)#80 |
| 80. | Vicksburg | 52.5% | 3.9%(+48.6)#6 | 3.8%(+48.7)#81 |
| 81. | Matlacha | 52.4% | 6.1%(+46.3)#1 | 3.8%(+48.5)#82 |
| 82. | Sherman | 52.2% | 3.5%(+48.7)#2 | 3.8%(+48.4)#83 |
| 83. | Haivana Nakya | 51.7% | 3.9%(+47.8)#7 | 3.8%(+47.9)#84 |
| 84. | Brooks | 51.1% | 4.2%(+46.9)#3 | 3.8%(+47.3)#85 |
| 85. | New Rockport Colony | 50.8% | 6.0%(+44.8)#10 | 3.8%(+47.0)#86 |
| 86. | Abanda | 50.8% | 3.5%(+47.3)#1 | 3.8%(+47.0)#87 |
| 87. | Blanchard | 50.0% | 4.8%(+45.2)#2 | 3.8%(+46.2)#88 |
| 88. | Lowndesville | 50.0% | 3.8%(+46.2)#1 | 3.8%(+46.2)#89 |
| 89. | Springfield | 50.0% | 3.3%(+46.7)#1 | 3.8%(+46.2)#90 |
| 90. | Bartow | 50.0% | 2.6%(+47.4)#3 | 3.8%(+46.2)#91 |
| 91. | Sunland Estates | 50.0% | 4.0%(+46.0)#4 | 3.8%(+46.2)#92 |
| 92. | Mount Laguna | 50.0% | 3.8%(+46.2)#7 | 3.8%(+46.2)#93 |
| 93. | Nottoway Court House | 50.0% | 3.4%(+46.6)#8 | 3.8%(+46.2)#94 |
| 94. | Tierra Grande | 50.0% | 3.4%(+46.6)#4 | 3.8%(+46.2)#95 |
| 95. | Piedra | 50.0% | 5.1%(+44.9)#3 | 3.8%(+46.2)#96 |
| 96. | Arcola | 50.0% | 3.2%(+46.8)#3 | 3.8%(+46.2)#97 |
| 97. | Martinsburg Junction | 50.0% | 3.0%(+47.0)#3 | 3.8%(+46.2)#98 |
| 98. | Eagle Bay | 50.0% | 3.9%(+46.1)#2 | 3.8%(+46.2)#99 |
| 99. | Sarben | 50.0% | 4.2%(+45.8)#2 | 3.8%(+46.2)#100 |
| 100. | Lindsay | 50.0% | 6.0%(+44.0)#11 | 3.8%(+46.2)#101 |
Common Questions
What are the Top 10 Cities with the Highest Percentage of Self-Employed / Incorporated in the United States?
Top 10 Cities with the Highest Percentage of Self-Employed / Incorporated in the United States are:
#1
100.0%
#2
100.0%
#3
100.0%
#4
100.0%
#5
100.0%
#6
100.0%
#7
100.0%
#8
100.0%
#9
100.0%
#10
100.0%
What city has the Highest Percentage of Self-Employed / Incorporated in the United States?
Albrightsville has the Highest Percentage of Self-Employed / Incorporated in the United States with 100.0%.
What is the Percentage of Self-Employed / Incorporated in the United States?
Percentage of Self-Employed / Incorporated in the United States is 3.8%.