Cities with the Highest Percentage of Self-Employed / Incorporated in Indiana
RELATED REPORTS & OPTIONS
Self-Employed / Incorporated
Indiana
Compare Cities
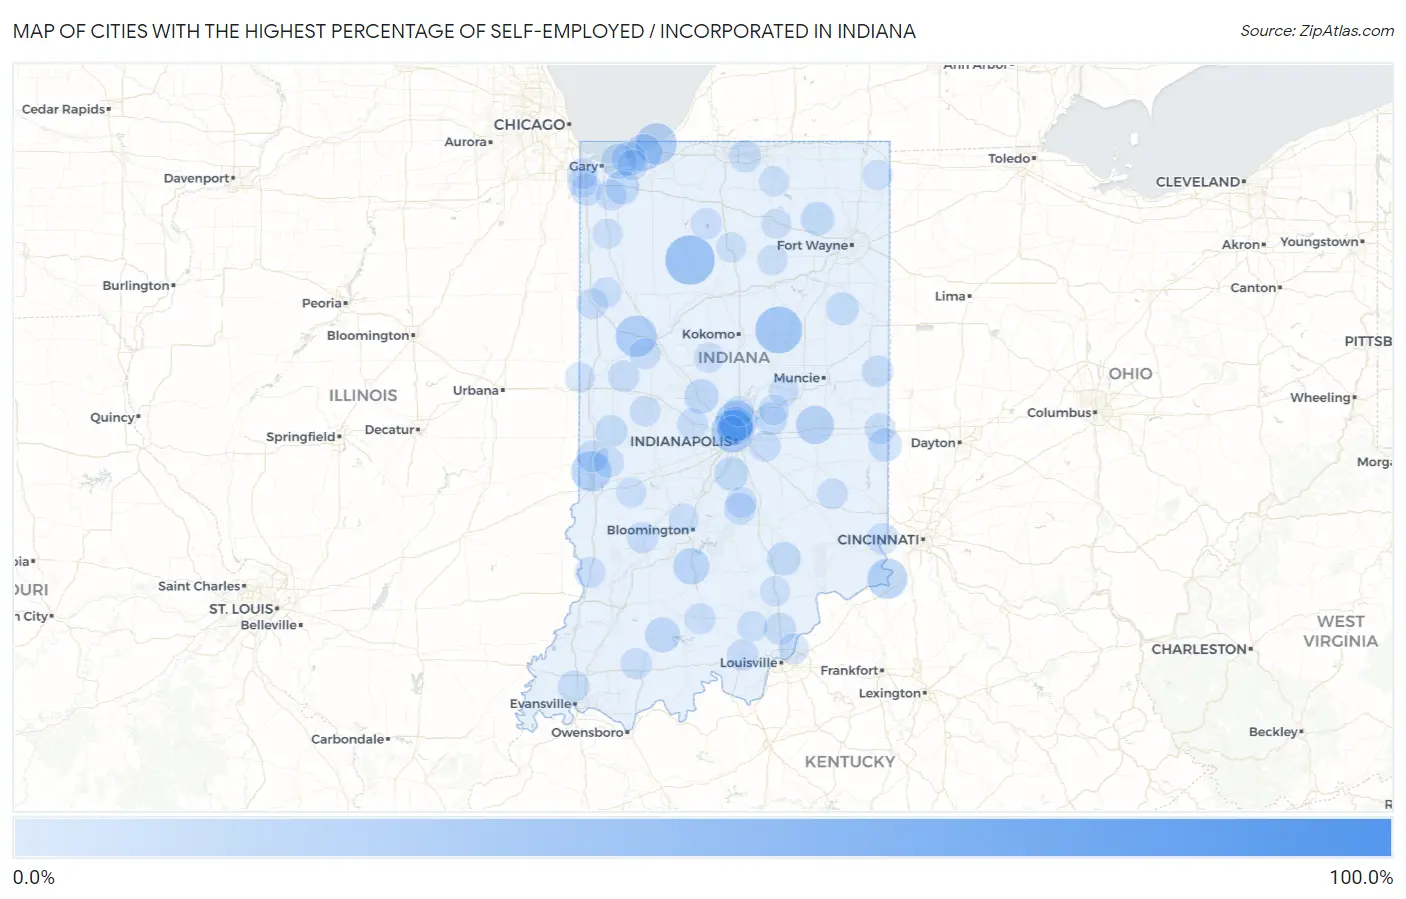
Map of Cities with the Highest Percentage of Self-Employed / Incorporated in Indiana
0.0%
100.0%
Cities with the Highest Percentage of Self-Employed / Incorporated in Indiana
| City | % Self-Employed / Incorporated | vs State | vs National | |
| 1. | Millville | 100.0% | 3.2%(+96.8)#1 | 3.8%(+96.2)#3 |
| 2. | Prairie Creek | 49.2% | 3.2%(+46.0)#2 | 3.8%(+45.4)#103 |
| 3. | Vicksburg | 48.3% | 3.2%(+45.1)#3 | 3.8%(+44.5)#109 |
| 4. | Star City | 38.9% | 3.2%(+35.7)#4 | 3.8%(+35.1)#165 |
| 5. | Herbst | 34.4% | 3.2%(+31.2)#5 | 3.8%(+30.6)#198 |
| 6. | Depauw | 33.3% | 3.2%(+30.1)#6 | 3.8%(+29.5)#204 |
| 7. | Spring Hill | 26.7% | 3.2%(+23.4)#7 | 3.8%(+22.8)#328 |
| 8. | Montmorenci | 24.7% | 3.2%(+21.5)#8 | 3.8%(+20.9)#394 |
| 9. | Williams Creek | 24.6% | 3.2%(+21.4)#9 | 3.8%(+20.8)#395 |
| 10. | Long Beach | 24.4% | 3.2%(+21.2)#10 | 3.8%(+20.6)#404 |
| 11. | Millgrove | 24.2% | 3.2%(+21.0)#11 | 3.8%(+20.4)#408 |
| 12. | Billtown | 23.0% | 3.2%(+19.7)#12 | 3.8%(+19.1)#447 |
| 13. | Tecumseh | 22.8% | 3.2%(+19.6)#13 | 3.8%(+19.0)#456 |
| 14. | Patriot | 22.8% | 3.2%(+19.6)#14 | 3.8%(+19.0)#458 |
| 15. | New Lebanon | 22.5% | 3.2%(+19.3)#15 | 3.8%(+18.7)#472 |
| 16. | Newtonville | 20.9% | 3.2%(+17.7)#16 | 3.8%(+17.1)#556 |
| 17. | Wildwood | 20.6% | 3.2%(+17.4)#17 | 3.8%(+16.8)#571 |
| 18. | Greensboro | 19.2% | 3.2%(+16.0)#18 | 3.8%(+15.4)#676 |
| 19. | Grandview Lake | 18.8% | 3.2%(+15.6)#19 | 3.8%(+15.0)#714 |
| 20. | Harrison Lake | 18.1% | 3.2%(+14.9)#20 | 3.8%(+14.3)#783 |
| 21. | Beverly Shores | 17.0% | 3.2%(+13.8)#21 | 3.8%(+13.2)#858 |
| 22. | Avoca | 16.3% | 3.2%(+13.0)#22 | 3.8%(+12.4)#920 |
| 23. | Abington | 15.6% | 3.2%(+12.4)#23 | 3.8%(+11.8)#995 |
| 24. | Snow Lake | 15.4% | 3.2%(+12.2)#24 | 3.8%(+11.6)#1,017 |
| 25. | Crows Nest | 14.8% | 3.2%(+11.6)#25 | 3.8%(+11.0)#1,104 |
| 26. | Dubois | 14.0% | 3.2%(+10.8)#26 | 3.8%(+10.2)#1,227 |
| 27. | Ogden Dunes | 13.7% | 3.2%(+10.4)#27 | 3.8%(+9.84)#1,293 |
| 28. | Ulen | 13.2% | 3.2%(+9.99)#28 | 3.8%(+9.39)#1,387 |
| 29. | Meridian Hills | 13.1% | 3.2%(+9.89)#29 | 3.8%(+9.30)#1,407 |
| 30. | Grammer | 12.5% | 3.2%(+9.28)#30 | 3.8%(+8.68)#1,528 |
| 31. | Bargersville | 12.4% | 3.2%(+9.22)#31 | 3.8%(+8.62)#1,547 |
| 32. | Dune Acres | 12.3% | 3.2%(+9.12)#32 | 3.8%(+8.52)#1,570 |
| 33. | Shorewood Forest | 12.0% | 3.2%(+8.83)#33 | 3.8%(+8.23)#1,646 |
| 34. | Hayden | 11.9% | 3.2%(+8.69)#34 | 3.8%(+8.09)#1,681 |
| 35. | Tri Lakes | 11.7% | 3.2%(+8.52)#35 | 3.8%(+7.93)#1,731 |
| 36. | Blue Ridge | 11.5% | 3.2%(+8.26)#36 | 3.8%(+7.66)#1,802 |
| 37. | Boston | 11.2% | 3.2%(+8.00)#37 | 3.8%(+7.41)#1,865 |
| 38. | Union Mills | 11.0% | 3.2%(+7.79)#38 | 3.8%(+7.19)#1,937 |
| 39. | Jefferson | 10.9% | 3.2%(+7.69)#39 | 3.8%(+7.09)#1,968 |
| 40. | Poneto | 10.5% | 3.2%(+7.31)#40 | 3.8%(+6.71)#2,087 |
| 41. | Sardinia | 10.3% | 3.2%(+7.04)#41 | 3.8%(+6.44)#2,184 |
| 42. | Reo | 10.1% | 3.2%(+6.90)#42 | 3.8%(+6.30)#2,218 |
| 43. | Ardmore | 9.8% | 3.2%(+6.57)#43 | 3.8%(+5.97)#2,378 |
| 44. | Fortville | 9.8% | 3.2%(+6.54)#44 | 3.8%(+5.94)#2,385 |
| 45. | Bloomingdale | 9.7% | 3.2%(+6.44)#45 | 3.8%(+5.84)#2,425 |
| 46. | Hessen Cassel | 9.3% | 3.2%(+6.11)#46 | 3.8%(+5.52)#2,547 |
| 47. | Memphis | 9.0% | 3.2%(+5.82)#47 | 3.8%(+5.23)#2,682 |
| 48. | Osceola | 9.0% | 3.2%(+5.82)#48 | 3.8%(+5.23)#2,683 |
| 49. | Enchanted Hills | 8.9% | 3.2%(+5.69)#49 | 3.8%(+5.09)#2,762 |
| 50. | Pleasant Mills | 8.5% | 3.2%(+5.27)#50 | 3.8%(+4.67)#2,998 |
| 51. | St John | 8.4% | 3.2%(+5.15)#51 | 3.8%(+4.55)#3,071 |
| 52. | Darmstadt | 8.3% | 3.2%(+5.13)#52 | 3.8%(+4.53)#3,081 |
| 53. | Cordry Sweetwater Lakes | 8.3% | 3.2%(+5.07)#53 | 3.8%(+4.47)#3,128 |
| 54. | Clinton | 8.1% | 3.2%(+4.91)#54 | 3.8%(+4.31)#3,248 |
| 55. | Newtown | 8.1% | 3.2%(+4.89)#55 | 3.8%(+4.29)#3,266 |
| 56. | Saratoga | 8.0% | 3.2%(+4.82)#56 | 3.8%(+4.22)#3,318 |
| 57. | Williamsburg | 7.8% | 3.2%(+4.58)#57 | 3.8%(+3.98)#3,492 |
| 58. | Lawrenceburg | 7.8% | 3.2%(+4.57)#58 | 3.8%(+3.97)#3,500 |
| 59. | Holland | 7.7% | 3.2%(+4.45)#59 | 3.8%(+3.85)#3,605 |
| 60. | Culver | 7.6% | 3.2%(+4.41)#60 | 3.8%(+3.81)#3,643 |
| 61. | New Salisbury | 7.6% | 3.2%(+4.39)#61 | 3.8%(+3.80)#3,652 |
| 62. | Worthington | 7.6% | 3.2%(+4.39)#62 | 3.8%(+3.79)#3,658 |
| 63. | Spencerville | 7.5% | 3.2%(+4.33)#63 | 3.8%(+3.73)#3,703 |
| 64. | Shadeland | 7.5% | 3.2%(+4.30)#64 | 3.8%(+3.71)#3,717 |
| 65. | Paoli | 7.5% | 3.2%(+4.28)#65 | 3.8%(+3.68)#3,737 |
| 66. | New Palestine | 7.5% | 3.2%(+4.24)#66 | 3.8%(+3.64)#3,769 |
| 67. | Winfield | 7.4% | 3.2%(+4.22)#67 | 3.8%(+3.63)#3,776 |
| 68. | Jimmerson Lake | 7.3% | 3.2%(+4.08)#68 | 3.8%(+3.48)#3,910 |
| 69. | Ramsey | 7.3% | 3.2%(+4.05)#69 | 3.8%(+3.46)#3,935 |
| 70. | Earl Park | 7.2% | 3.2%(+4.00)#70 | 3.8%(+3.40)#3,987 |
| 71. | Lizton | 7.1% | 3.2%(+3.90)#71 | 3.8%(+3.31)#4,070 |
| 72. | Oaktown | 7.0% | 3.2%(+3.81)#72 | 3.8%(+3.22)#4,135 |
| 73. | Prince S Lakes | 6.9% | 3.2%(+3.71)#73 | 3.8%(+3.12)#4,235 |
| 74. | Spring Grove | 6.9% | 3.2%(+3.68)#74 | 3.8%(+3.08)#4,268 |
| 75. | Lake Holiday | 6.9% | 3.2%(+3.66)#75 | 3.8%(+3.07)#4,289 |
| 76. | Lake Santee | 6.7% | 3.2%(+3.52)#76 | 3.8%(+2.92)#4,450 |
| 77. | Utica | 6.6% | 3.2%(+3.34)#77 | 3.8%(+2.74)#4,635 |
| 78. | Rosedale | 6.5% | 3.2%(+3.31)#78 | 3.8%(+2.71)#4,666 |
| 79. | Munster | 6.5% | 3.2%(+3.28)#79 | 3.8%(+2.68)#4,700 |
| 80. | New Pekin | 6.4% | 3.2%(+3.18)#80 | 3.8%(+2.58)#4,797 |
| 81. | Laketon | 6.3% | 3.2%(+3.11)#81 | 3.8%(+2.51)#4,868 |
| 82. | Carmel | 6.2% | 3.2%(+3.01)#82 | 3.8%(+2.41)#5,001 |
| 83. | Otter Lake | 6.2% | 3.2%(+2.99)#83 | 3.8%(+2.39)#5,020 |
| 84. | Ingalls | 6.2% | 3.2%(+2.99)#84 | 3.8%(+2.39)#5,022 |
| 85. | Goodland | 6.2% | 3.2%(+2.97)#85 | 3.8%(+2.37)#5,045 |
| 86. | Chesterton | 6.2% | 3.2%(+2.97)#86 | 3.8%(+2.37)#5,047 |
| 87. | Wynnedale | 6.1% | 3.2%(+2.92)#87 | 3.8%(+2.32)#5,099 |
| 88. | Winona Lake | 6.1% | 3.2%(+2.89)#88 | 3.8%(+2.30)#5,139 |
| 89. | Roselawn | 6.1% | 3.2%(+2.87)#89 | 3.8%(+2.27)#5,168 |
| 90. | Michigantown | 6.1% | 3.2%(+2.85)#90 | 3.8%(+2.26)#5,188 |
| 91. | Austin | 6.0% | 3.2%(+2.82)#91 | 3.8%(+2.23)#5,234 |
| 92. | Center Point | 6.0% | 3.2%(+2.77)#92 | 3.8%(+2.17)#5,308 |
| 93. | New Paris | 6.0% | 3.2%(+2.75)#93 | 3.8%(+2.15)#5,340 |
| 94. | Ellettsville | 5.9% | 3.2%(+2.71)#94 | 3.8%(+2.11)#5,402 |
| 95. | Pleasant View | 5.9% | 3.2%(+2.65)#95 | 3.8%(+2.05)#5,455 |
| 96. | Hamilton | 5.9% | 3.2%(+2.63)#96 | 3.8%(+2.04)#5,483 |
| 97. | Rochester | 5.8% | 3.2%(+2.60)#97 | 3.8%(+2.00)#5,527 |
| 98. | Dyer | 5.8% | 3.2%(+2.59)#98 | 3.8%(+1.99)#5,540 |
| 99. | State Line City | 5.7% | 3.2%(+2.49)#99 | 3.8%(+1.90)#5,686 |
| 100. | Edgewood | 5.7% | 3.2%(+2.44)#100 | 3.8%(+1.85)#5,745 |
Common Questions
What are the Top 10 Cities with the Highest Percentage of Self-Employed / Incorporated in Indiana?
Top 10 Cities with the Highest Percentage of Self-Employed / Incorporated in Indiana are:
#1
38.9%
#2
34.4%
#3
26.7%
#4
24.7%
#5
24.6%
#6
24.4%
#7
22.8%
#8
22.8%
#9
19.2%
#10
17.0%
What city has the Highest Percentage of Self-Employed / Incorporated in Indiana?
Star City has the Highest Percentage of Self-Employed / Incorporated in Indiana with 38.9%.
What is the Percentage of Self-Employed / Incorporated in the State of Indiana?
Percentage of Self-Employed / Incorporated in Indiana is 3.2%.
What is the Percentage of Self-Employed / Incorporated in the United States?
Percentage of Self-Employed / Incorporated in the United States is 3.8%.