Cities with the Highest Percentage of Self-Employed / Incorporated in Oregon
RELATED REPORTS & OPTIONS
Self-Employed / Incorporated
Oregon
Compare Cities
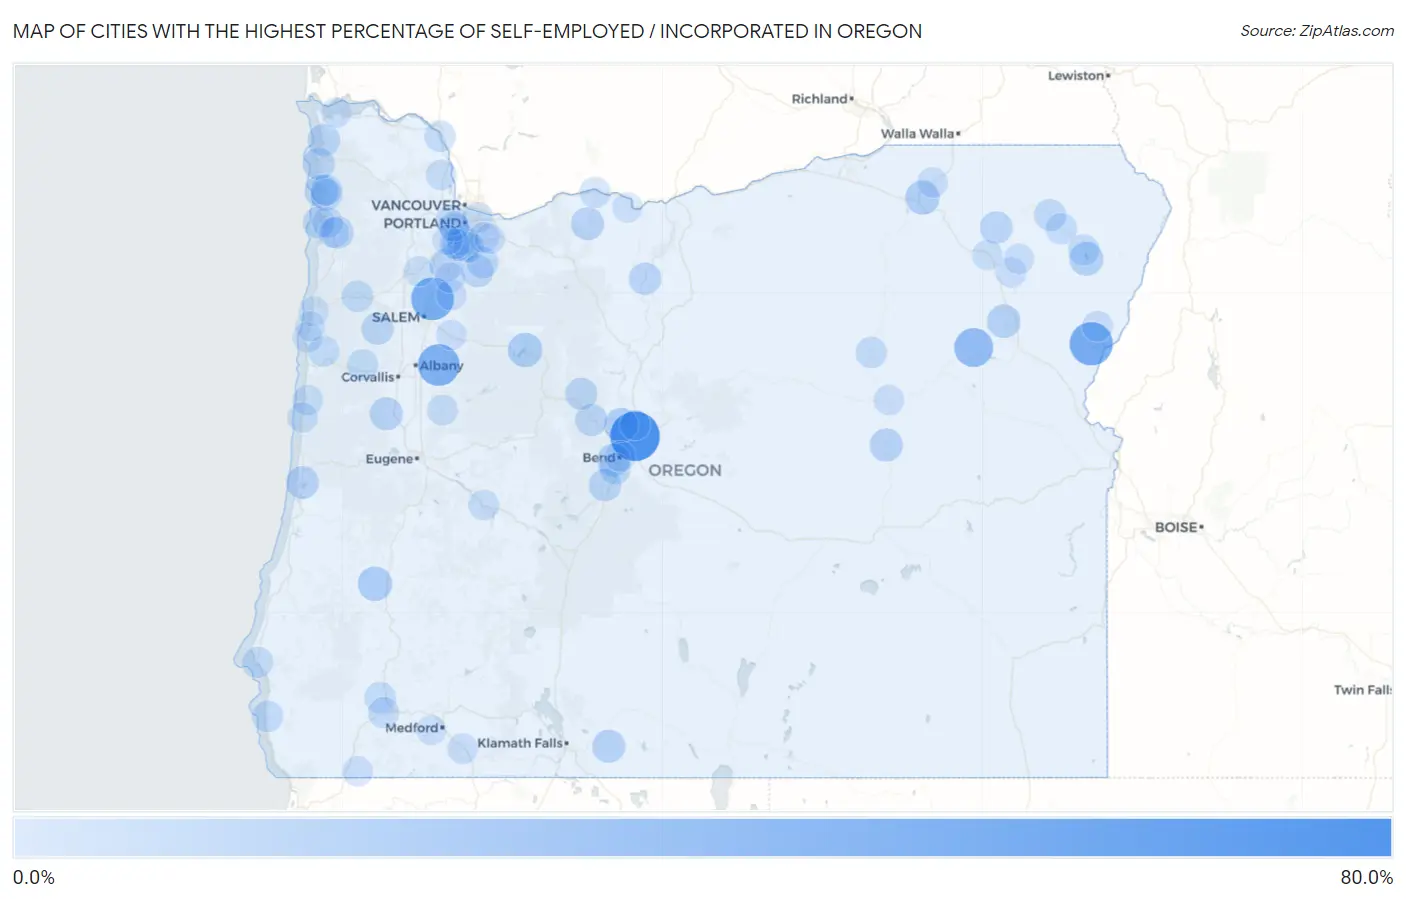
Map of Cities with the Highest Percentage of Self-Employed / Incorporated in Oregon
0.0%
80.0%
Cities with the Highest Percentage of Self-Employed / Incorporated in Oregon
| City | % Self-Employed / Incorporated | vs State | vs National | |
| 1. | Pronghorn | 77.1% | 4.2%(+72.9)#1 | 3.8%(+73.2)#33 |
| 2. | Richland | 52.9% | 4.2%(+48.8)#2 | 3.8%(+49.1)#78 |
| 3. | Brooks | 51.1% | 4.2%(+46.9)#3 | 3.8%(+47.3)#84 |
| 4. | Crabtree | 47.1% | 4.2%(+43.0)#4 | 3.8%(+43.3)#115 |
| 5. | Sumpter | 36.4% | 4.2%(+32.2)#5 | 3.8%(+32.5)#182 |
| 6. | Barnesdale | 24.2% | 4.2%(+20.0)#6 | 3.8%(+20.4)#409 |
| 7. | Melrose | 20.2% | 4.2%(+16.0)#7 | 3.8%(+16.4)#600 |
| 8. | Detroit | 20.0% | 4.2%(+15.8)#8 | 3.8%(+16.2)#619 |
| 9. | Kirkpatrick | 19.4% | 4.2%(+15.3)#9 | 3.8%(+15.6)#666 |
| 10. | Eagle Crest | 19.1% | 4.2%(+14.9)#10 | 3.8%(+15.3)#691 |
| 11. | Dunthorpe | 18.6% | 4.2%(+14.4)#11 | 3.8%(+14.8)#729 |
| 12. | Wallowa Lake | 18.1% | 4.2%(+13.9)#12 | 3.8%(+14.3)#784 |
| 13. | Stafford | 17.3% | 4.2%(+13.1)#13 | 3.8%(+13.5)#836 |
| 14. | Haines | 16.7% | 4.2%(+12.5)#14 | 3.8%(+12.8)#882 |
| 15. | Bonanza | 15.4% | 4.2%(+11.2)#15 | 3.8%(+11.6)#1,015 |
| 16. | Manzanita | 15.3% | 4.2%(+11.1)#16 | 3.8%(+11.5)#1,027 |
| 17. | Seneca | 15.3% | 4.2%(+11.1)#17 | 3.8%(+11.5)#1,035 |
| 18. | Running Y Ranch | 15.3% | 4.2%(+11.1)#18 | 3.8%(+11.4)#1,037 |
| 19. | Tetherow | 15.2% | 4.2%(+11.0)#19 | 3.8%(+11.4)#1,051 |
| 20. | Alpine | 15.1% | 4.2%(+10.9)#20 | 3.8%(+11.3)#1,061 |
| 21. | River Point | 15.1% | 4.2%(+10.9)#21 | 3.8%(+11.3)#1,066 |
| 22. | Parkdale | 15.0% | 4.2%(+10.8)#22 | 3.8%(+11.2)#1,071 |
| 23. | Butteville | 15.0% | 4.2%(+10.8)#23 | 3.8%(+11.1)#1,082 |
| 24. | Dunes City | 14.5% | 4.2%(+10.3)#24 | 3.8%(+10.7)#1,144 |
| 25. | Falcon Heights | 13.7% | 4.2%(+9.53)#25 | 3.8%(+9.90)#1,281 |
| 26. | Summerville | 13.6% | 4.2%(+9.38)#26 | 3.8%(+9.74)#1,314 |
| 27. | Maupin | 13.3% | 4.2%(+9.09)#27 | 3.8%(+9.46)#1,368 |
| 28. | Gearhart | 12.9% | 4.2%(+8.69)#28 | 3.8%(+9.05)#1,452 |
| 29. | Heceta Beach | 12.9% | 4.2%(+8.68)#29 | 3.8%(+9.04)#1,454 |
| 30. | Fairview | 12.8% | 4.2%(+8.60)#30 | 3.8%(+8.97)#1,472 |
| 31. | Sunriver | 12.8% | 4.2%(+8.57)#31 | 3.8%(+8.93)#1,476 |
| 32. | Saunders Lake | 12.4% | 4.2%(+8.25)#32 | 3.8%(+8.62)#1,550 |
| 33. | Cannon Beach | 12.3% | 4.2%(+8.13)#33 | 3.8%(+8.50)#1,573 |
| 34. | Mckay | 12.3% | 4.2%(+8.12)#34 | 3.8%(+8.49)#1,577 |
| 35. | Mulino | 12.3% | 4.2%(+8.12)#35 | 3.8%(+8.49)#1,578 |
| 36. | Sisters | 12.1% | 4.2%(+7.95)#36 | 3.8%(+8.32)#1,617 |
| 37. | Falls City | 11.8% | 4.2%(+7.65)#37 | 3.8%(+8.02)#1,704 |
| 38. | Camp Sherman | 11.7% | 4.2%(+7.50)#38 | 3.8%(+7.87)#1,743 |
| 39. | Wheeler | 11.5% | 4.2%(+7.28)#39 | 3.8%(+7.65)#1,806 |
| 40. | Cape Meares | 11.1% | 4.2%(+6.93)#40 | 3.8%(+7.29)#1,897 |
| 41. | Wallowa | 10.8% | 4.2%(+6.58)#41 | 3.8%(+6.94)#2,005 |
| 42. | Beavercreek | 10.5% | 4.2%(+6.31)#42 | 3.8%(+6.68)#2,106 |
| 43. | Grand Ronde | 10.1% | 4.2%(+5.92)#43 | 3.8%(+6.28)#2,225 |
| 44. | Boring | 10.0% | 4.2%(+5.78)#44 | 3.8%(+6.15)#2,309 |
| 45. | Deschutes River Woods | 9.4% | 4.2%(+5.26)#45 | 3.8%(+5.63)#2,502 |
| 46. | Gold Beach | 9.4% | 4.2%(+5.26)#46 | 3.8%(+5.62)#2,505 |
| 47. | Nehalem | 9.4% | 4.2%(+5.19)#47 | 3.8%(+5.56)#2,532 |
| 48. | Long Creek | 9.3% | 4.2%(+5.12)#48 | 3.8%(+5.49)#2,555 |
| 49. | Chemult | 9.3% | 4.2%(+5.12)#49 | 3.8%(+5.49)#2,558 |
| 50. | Rivergrove | 9.2% | 4.2%(+5.02)#50 | 3.8%(+5.39)#2,599 |
| 51. | Summit | 9.1% | 4.2%(+4.91)#51 | 3.8%(+5.27)#2,651 |
| 52. | Prescott | 9.1% | 4.2%(+4.91)#52 | 3.8%(+5.27)#2,660 |
| 53. | Merlin | 9.1% | 4.2%(+4.90)#53 | 3.8%(+5.26)#2,665 |
| 54. | Redwood | 9.0% | 4.2%(+4.86)#54 | 3.8%(+5.23)#2,680 |
| 55. | Lostine | 9.0% | 4.2%(+4.78)#55 | 3.8%(+5.15)#2,733 |
| 56. | Port Orford | 8.7% | 4.2%(+4.54)#56 | 3.8%(+4.91)#2,863 |
| 57. | Joseph | 8.7% | 4.2%(+4.53)#57 | 3.8%(+4.90)#2,869 |
| 58. | Siletz | 8.4% | 4.2%(+4.20)#58 | 3.8%(+4.56)#3,055 |
| 59. | Bayshore | 7.8% | 4.2%(+3.63)#59 | 3.8%(+4.00)#3,474 |
| 60. | Raleigh Hills | 7.4% | 4.2%(+3.27)#60 | 3.8%(+3.63)#3,772 |
| 61. | Hood River | 7.3% | 4.2%(+3.10)#61 | 3.8%(+3.46)#3,923 |
| 62. | Lake Oswego | 7.3% | 4.2%(+3.10)#62 | 3.8%(+3.46)#3,924 |
| 63. | Bend | 7.3% | 4.2%(+3.09)#63 | 3.8%(+3.46)#3,931 |
| 64. | Halfway | 7.1% | 4.2%(+2.96)#64 | 3.8%(+3.33)#4,047 |
| 65. | Bay City | 7.1% | 4.2%(+2.92)#65 | 3.8%(+3.29)#4,080 |
| 66. | Crawfordsville | 7.0% | 4.2%(+2.85)#66 | 3.8%(+3.22)#4,131 |
| 67. | Cedar Mill | 7.0% | 4.2%(+2.81)#67 | 3.8%(+3.18)#4,178 |
| 68. | Warren | 6.9% | 4.2%(+2.72)#68 | 3.8%(+3.09)#4,261 |
| 69. | Westfir | 6.9% | 4.2%(+2.71)#69 | 3.8%(+3.08)#4,269 |
| 70. | West Linn | 6.9% | 4.2%(+2.67)#70 | 3.8%(+3.03)#4,330 |
| 71. | Maywood Park | 6.8% | 4.2%(+2.66)#71 | 3.8%(+3.02)#4,343 |
| 72. | Waldport | 6.8% | 4.2%(+2.61)#72 | 3.8%(+2.97)#4,394 |
| 73. | Happy Valley | 6.7% | 4.2%(+2.48)#73 | 3.8%(+2.85)#4,509 |
| 74. | Adams | 6.5% | 4.2%(+2.32)#74 | 3.8%(+2.69)#4,691 |
| 75. | Pleasant Valley | 6.5% | 4.2%(+2.31)#75 | 3.8%(+2.68)#4,705 |
| 76. | Yachats | 6.5% | 4.2%(+2.29)#76 | 3.8%(+2.66)#4,716 |
| 77. | Durham | 6.5% | 4.2%(+2.28)#77 | 3.8%(+2.65)#4,726 |
| 78. | Damascus | 6.5% | 4.2%(+2.28)#78 | 3.8%(+2.64)#4,728 |
| 79. | Tillamook | 6.4% | 4.2%(+2.17)#79 | 3.8%(+2.53)#4,830 |
| 80. | Mount Angel | 6.3% | 4.2%(+2.11)#80 | 3.8%(+2.47)#4,909 |
| 81. | Ashland | 6.0% | 4.2%(+1.86)#81 | 3.8%(+2.23)#5,228 |
| 82. | Santa Clara | 6.0% | 4.2%(+1.85)#82 | 3.8%(+2.22)#5,243 |
| 83. | Sublimity | 6.0% | 4.2%(+1.82)#83 | 3.8%(+2.18)#5,285 |
| 84. | Mapleton | 6.0% | 4.2%(+1.79)#84 | 3.8%(+2.15)#5,328 |
| 85. | John Day | 5.9% | 4.2%(+1.76)#85 | 3.8%(+2.12)#5,373 |
| 86. | West Slope | 5.8% | 4.2%(+1.64)#86 | 3.8%(+2.00)#5,520 |
| 87. | Takilma | 5.7% | 4.2%(+1.55)#87 | 3.8%(+1.92)#5,648 |
| 88. | Dayton | 5.7% | 4.2%(+1.54)#88 | 3.8%(+1.91)#5,666 |
| 89. | Hubbard | 5.7% | 4.2%(+1.48)#89 | 3.8%(+1.85)#5,742 |
| 90. | Union | 5.7% | 4.2%(+1.47)#90 | 3.8%(+1.84)#5,757 |
| 91. | La Grande | 5.6% | 4.2%(+1.45)#91 | 3.8%(+1.81)#5,788 |
| 92. | Cove | 5.6% | 4.2%(+1.39)#92 | 3.8%(+1.76)#5,852 |
| 93. | Redmond | 5.5% | 4.2%(+1.35)#93 | 3.8%(+1.72)#5,921 |
| 94. | Astoria | 5.4% | 4.2%(+1.26)#94 | 3.8%(+1.63)#6,055 |
| 95. | Bull Mountain | 5.4% | 4.2%(+1.20)#95 | 3.8%(+1.57)#6,146 |
| 96. | Depoe Bay | 5.1% | 4.2%(+0.961)#96 | 3.8%(+1.33)#6,543 |
| 97. | Lincoln City | 5.1% | 4.2%(+0.890)#97 | 3.8%(+1.26)#6,652 |
| 98. | Chenoweth | 5.1% | 4.2%(+0.876)#98 | 3.8%(+1.24)#6,675 |
| 99. | Lincoln Beach | 5.0% | 4.2%(+0.829)#99 | 3.8%(+1.20)#6,754 |
| 100. | Jacksonville | 4.9% | 4.2%(+0.722)#100 | 3.8%(+1.09)#6,940 |
Common Questions
What are the Top 10 Cities with the Highest Percentage of Self-Employed / Incorporated in Oregon?
Top 10 Cities with the Highest Percentage of Self-Employed / Incorporated in Oregon are:
#1
77.1%
#2
52.9%
#3
51.1%
#4
47.1%
#5
36.4%
#6
20.2%
#7
20.0%
#8
19.4%
#9
19.1%
#10
18.1%
What city has the Highest Percentage of Self-Employed / Incorporated in Oregon?
Pronghorn has the Highest Percentage of Self-Employed / Incorporated in Oregon with 77.1%.
What is the Percentage of Self-Employed / Incorporated in the State of Oregon?
Percentage of Self-Employed / Incorporated in Oregon is 4.2%.
What is the Percentage of Self-Employed / Incorporated in the United States?
Percentage of Self-Employed / Incorporated in the United States is 3.8%.