Cities with the Highest Percentage of Self-Employed / Incorporated in Idaho
RELATED REPORTS & OPTIONS
Self-Employed / Incorporated
Idaho
Compare Cities
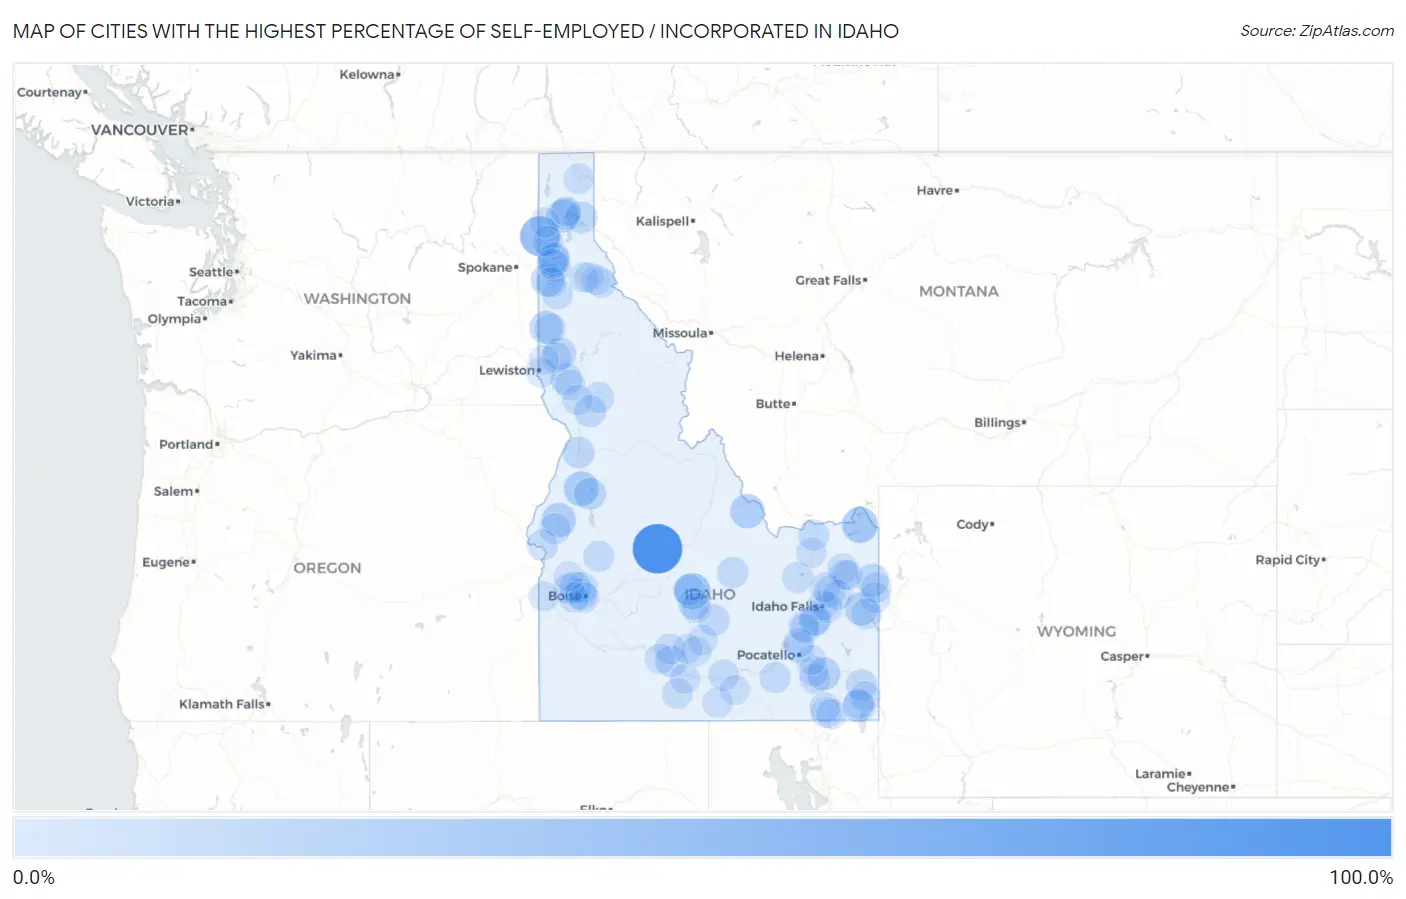
Map of Cities with the Highest Percentage of Self-Employed / Incorporated in Idaho
0.0%
100.0%
Cities with the Highest Percentage of Self-Employed / Incorporated in Idaho
| City | % Self-Employed / Incorporated | vs State | vs National | |
| 1. | Stanley | 98.6% | 4.8%(+93.8)#1 | 3.8%(+94.8)#26 |
| 2. | Blanchard | 50.0% | 4.8%(+45.2)#2 | 3.8%(+46.2)#87 |
| 3. | Sun Valley | 31.9% | 4.8%(+27.1)#3 | 3.8%(+28.1)#221 |
| 4. | Island Park | 30.0% | 4.8%(+25.2)#4 | 3.8%(+26.2)#250 |
| 5. | New Meadows | 25.9% | 4.8%(+21.0)#5 | 3.8%(+22.0)#353 |
| 6. | Cambridge | 22.9% | 4.8%(+18.0)#6 | 3.8%(+19.0)#453 |
| 7. | Leadore | 22.4% | 4.8%(+17.6)#7 | 3.8%(+18.6)#473 |
| 8. | Swan Valley | 18.9% | 4.8%(+14.1)#8 | 3.8%(+15.1)#704 |
| 9. | Onaway | 18.4% | 4.8%(+13.5)#9 | 3.8%(+14.6)#752 |
| 10. | Lava Hot Springs | 17.2% | 4.8%(+12.4)#10 | 3.8%(+13.4)#841 |
| 11. | Rockford Bay | 17.1% | 4.8%(+12.2)#11 | 3.8%(+13.3)#849 |
| 12. | Firth | 15.5% | 4.8%(+10.7)#12 | 3.8%(+11.7)#1,002 |
| 13. | Laclede | 15.4% | 4.8%(+10.5)#13 | 3.8%(+11.6)#1,020 |
| 14. | Dover | 15.3% | 4.8%(+10.5)#14 | 3.8%(+11.5)#1,029 |
| 15. | Tetonia | 15.0% | 4.8%(+10.1)#15 | 3.8%(+11.1)#1,081 |
| 16. | Kendrick | 13.9% | 4.8%(+9.09)#16 | 3.8%(+10.1)#1,246 |
| 17. | Bloomington | 13.8% | 4.8%(+8.95)#17 | 3.8%(+9.98)#1,267 |
| 18. | Dalton Gardens | 13.2% | 4.8%(+8.35)#18 | 3.8%(+9.38)#1,390 |
| 19. | Mccall | 12.4% | 4.8%(+7.56)#19 | 3.8%(+8.59)#1,557 |
| 20. | East Hope | 11.9% | 4.8%(+7.06)#20 | 3.8%(+8.09)#1,683 |
| 21. | Reubens | 11.8% | 4.8%(+6.92)#21 | 3.8%(+7.95)#1,723 |
| 22. | Grangeville | 11.2% | 4.8%(+6.31)#22 | 3.8%(+7.34)#1,884 |
| 23. | Fernan Lake Village | 11.1% | 4.8%(+6.26)#23 | 3.8%(+7.29)#1,903 |
| 24. | Carey | 11.1% | 4.8%(+6.24)#24 | 3.8%(+7.27)#1,919 |
| 25. | Wendell | 11.1% | 4.8%(+6.24)#25 | 3.8%(+7.27)#1,921 |
| 26. | Sandpoint | 11.0% | 4.8%(+6.11)#26 | 3.8%(+7.14)#1,953 |
| 27. | Riggins | 10.7% | 4.8%(+5.82)#27 | 3.8%(+6.85)#2,046 |
| 28. | Eagle | 10.4% | 4.8%(+5.60)#28 | 3.8%(+6.63)#2,119 |
| 29. | Georgetown | 10.1% | 4.8%(+5.24)#29 | 3.8%(+6.27)#2,237 |
| 30. | Hailey | 9.7% | 4.8%(+4.81)#30 | 3.8%(+5.84)#2,426 |
| 31. | Mackay | 9.4% | 4.8%(+4.59)#31 | 3.8%(+5.62)#2,506 |
| 32. | Ketchum | 9.1% | 4.8%(+4.21)#32 | 3.8%(+5.24)#2,676 |
| 33. | Princeton | 9.0% | 4.8%(+4.16)#33 | 3.8%(+5.19)#2,704 |
| 34. | Rockland | 8.8% | 4.8%(+3.93)#34 | 3.8%(+4.95)#2,837 |
| 35. | Midvale | 8.7% | 4.8%(+3.90)#35 | 3.8%(+4.93)#2,851 |
| 36. | Hayden Lake | 8.6% | 4.8%(+3.77)#36 | 3.8%(+4.80)#2,912 |
| 37. | Weiser | 8.2% | 4.8%(+3.35)#37 | 3.8%(+4.38)#3,211 |
| 38. | Stites | 8.2% | 4.8%(+3.32)#38 | 3.8%(+4.35)#3,233 |
| 39. | Crouch | 8.1% | 4.8%(+3.26)#39 | 3.8%(+4.29)#3,267 |
| 40. | Hidden Springs | 8.0% | 4.8%(+3.20)#40 | 3.8%(+4.23)#3,311 |
| 41. | Garden City | 7.8% | 4.8%(+3.00)#41 | 3.8%(+4.03)#3,450 |
| 42. | Rigby | 7.8% | 4.8%(+2.98)#42 | 3.8%(+4.01)#3,461 |
| 43. | Tyhee | 7.7% | 4.8%(+2.90)#43 | 3.8%(+3.93)#3,528 |
| 44. | Spencer | 7.7% | 4.8%(+2.85)#44 | 3.8%(+3.88)#3,585 |
| 45. | Paul | 7.6% | 4.8%(+2.80)#45 | 3.8%(+3.83)#3,623 |
| 46. | Spirit Lake | 7.4% | 4.8%(+2.60)#46 | 3.8%(+3.63)#3,777 |
| 47. | Parkline | 7.4% | 4.8%(+2.56)#47 | 3.8%(+3.59)#3,820 |
| 48. | Juliaetta | 7.1% | 4.8%(+2.24)#48 | 3.8%(+3.27)#4,093 |
| 49. | Arimo | 7.0% | 4.8%(+2.15)#49 | 3.8%(+3.18)#4,179 |
| 50. | Victor | 6.9% | 4.8%(+2.03)#50 | 3.8%(+3.06)#4,293 |
| 51. | Mud Lake | 6.8% | 4.8%(+1.96)#51 | 3.8%(+2.99)#4,377 |
| 52. | Gooding | 6.8% | 4.8%(+1.92)#52 | 3.8%(+2.95)#4,415 |
| 53. | Hollister | 6.5% | 4.8%(+1.68)#53 | 3.8%(+2.70)#4,677 |
| 54. | Craigmont | 6.4% | 4.8%(+1.55)#54 | 3.8%(+2.58)#4,800 |
| 55. | Irwin | 6.3% | 4.8%(+1.50)#55 | 3.8%(+2.53)#4,837 |
| 56. | Star | 6.3% | 4.8%(+1.43)#56 | 3.8%(+2.46)#4,923 |
| 57. | Driggs | 5.9% | 4.8%(+1.09)#57 | 3.8%(+2.12)#5,387 |
| 58. | Ammon | 5.9% | 4.8%(+1.09)#58 | 3.8%(+2.12)#5,391 |
| 59. | Groveland | 5.5% | 4.8%(+0.683)#59 | 3.8%(+1.71)#5,932 |
| 60. | Dayton | 5.5% | 4.8%(+0.683)#60 | 3.8%(+1.71)#5,933 |
| 61. | Montpelier | 5.5% | 4.8%(+0.647)#61 | 3.8%(+1.68)#5,988 |
| 62. | Bonners Ferry | 5.4% | 4.8%(+0.538)#62 | 3.8%(+1.57)#6,148 |
| 63. | Clifton | 5.4% | 4.8%(+0.536)#63 | 3.8%(+1.57)#6,160 |
| 64. | Coeur D Alene | 5.3% | 4.8%(+0.453)#64 | 3.8%(+1.48)#6,287 |
| 65. | Cottonwood | 5.2% | 4.8%(+0.382)#65 | 3.8%(+1.41)#6,395 |
| 66. | Paris | 5.1% | 4.8%(+0.260)#66 | 3.8%(+1.29)#6,603 |
| 67. | Oakley | 5.1% | 4.8%(+0.255)#67 | 3.8%(+1.28)#6,612 |
| 68. | Harrison | 5.1% | 4.8%(+0.255)#68 | 3.8%(+1.28)#6,614 |
| 69. | St Anthony | 5.1% | 4.8%(+0.245)#69 | 3.8%(+1.27)#6,623 |
| 70. | Preston | 5.0% | 4.8%(+0.116)#70 | 3.8%(+1.15)#6,838 |
| 71. | Dubois | 4.9% | 4.8%(+0.083)#71 | 3.8%(+1.11)#6,899 |
| 72. | Hagerman | 4.9% | 4.8%(+0.068)#72 | 3.8%(+1.10)#6,928 |
| 73. | Twin Falls | 4.9% | 4.8%(+0.046)#73 | 3.8%(+1.08)#6,969 |
| 74. | Wallace | 4.9% | 4.8%(+0.037)#74 | 3.8%(+1.07)#6,985 |
| 75. | Idaho Falls | 4.7% | 4.8%(-0.113)#75 | 3.8%(+0.917)#7,250 |
| 76. | Richfield | 4.7% | 4.8%(-0.152)#76 | 3.8%(+0.878)#7,327 |
| 77. | Dietrich | 4.7% | 4.8%(-0.159)#77 | 3.8%(+0.870)#7,342 |
| 78. | Mccammon | 4.7% | 4.8%(-0.170)#78 | 3.8%(+0.860)#7,360 |
| 79. | Meridian | 4.7% | 4.8%(-0.180)#79 | 3.8%(+0.849)#7,380 |
| 80. | Menan | 4.7% | 4.8%(-0.195)#80 | 3.8%(+0.834)#7,404 |
| 81. | Homedale | 4.5% | 4.8%(-0.308)#81 | 3.8%(+0.721)#7,654 |
| 82. | Teton | 4.5% | 4.8%(-0.313)#82 | 3.8%(+0.716)#7,666 |
| 83. | Bellevue | 4.5% | 4.8%(-0.362)#83 | 3.8%(+0.668)#7,762 |
| 84. | Boise City | 4.4% | 4.8%(-0.407)#84 | 3.8%(+0.622)#7,856 |
| 85. | Ririe | 4.4% | 4.8%(-0.479)#85 | 3.8%(+0.551)#7,997 |
| 86. | Newdale | 4.3% | 4.8%(-0.499)#86 | 3.8%(+0.531)#8,044 |
| 87. | Priest River | 4.3% | 4.8%(-0.554)#87 | 3.8%(+0.475)#8,178 |
| 88. | Inkom | 4.3% | 4.8%(-0.591)#88 | 3.8%(+0.438)#8,265 |
| 89. | Basalt | 4.2% | 4.8%(-0.621)#89 | 3.8%(+0.408)#8,331 |
| 90. | Lewiston | 4.1% | 4.8%(-0.715)#90 | 3.8%(+0.315)#8,563 |
| 91. | Albion | 4.1% | 4.8%(-0.765)#91 | 3.8%(+0.264)#8,674 |
| 92. | Blackfoot | 4.1% | 4.8%(-0.770)#92 | 3.8%(+0.260)#8,691 |
| 93. | Fort Hall | 3.9% | 4.8%(-0.919)#93 | 3.8%(+0.111)#9,068 |
| 94. | Osburn | 3.9% | 4.8%(-0.985)#94 | 3.8%(+0.045)#9,231 |
| 95. | Pinehurst | 3.9% | 4.8%(-0.986)#95 | 3.8%(+0.043)#9,236 |
| 96. | Emmett | 3.8% | 4.8%(-1.09)#96 | 3.8%(-0.060)#9,521 |
| 97. | Genesee | 3.7% | 4.8%(-1.14)#97 | 3.8%(-0.113)#9,648 |
| 98. | Ponderay | 3.7% | 4.8%(-1.18)#98 | 3.8%(-0.146)#9,760 |
| 99. | Kellogg | 3.6% | 4.8%(-1.26)#99 | 3.8%(-0.229)#9,983 |
| 100. | Shoshone | 3.5% | 4.8%(-1.34)#100 | 3.8%(-0.311)#10,229 |
Common Questions
What are the Top 10 Cities with the Highest Percentage of Self-Employed / Incorporated in Idaho?
Top 10 Cities with the Highest Percentage of Self-Employed / Incorporated in Idaho are:
#1
98.6%
#2
50.0%
#3
31.9%
#4
30.0%
#5
25.9%
#6
22.9%
#7
22.4%
#8
18.9%
#9
18.4%
#10
17.2%
What city has the Highest Percentage of Self-Employed / Incorporated in Idaho?
Stanley has the Highest Percentage of Self-Employed / Incorporated in Idaho with 98.6%.
What is the Percentage of Self-Employed / Incorporated in the State of Idaho?
Percentage of Self-Employed / Incorporated in Idaho is 4.8%.
What is the Percentage of Self-Employed / Incorporated in the United States?
Percentage of Self-Employed / Incorporated in the United States is 3.8%.