Cities with the Highest Percentage of Self-Employed / Incorporated in Colorado
RELATED REPORTS & OPTIONS
Self-Employed / Incorporated
Colorado
Compare Cities
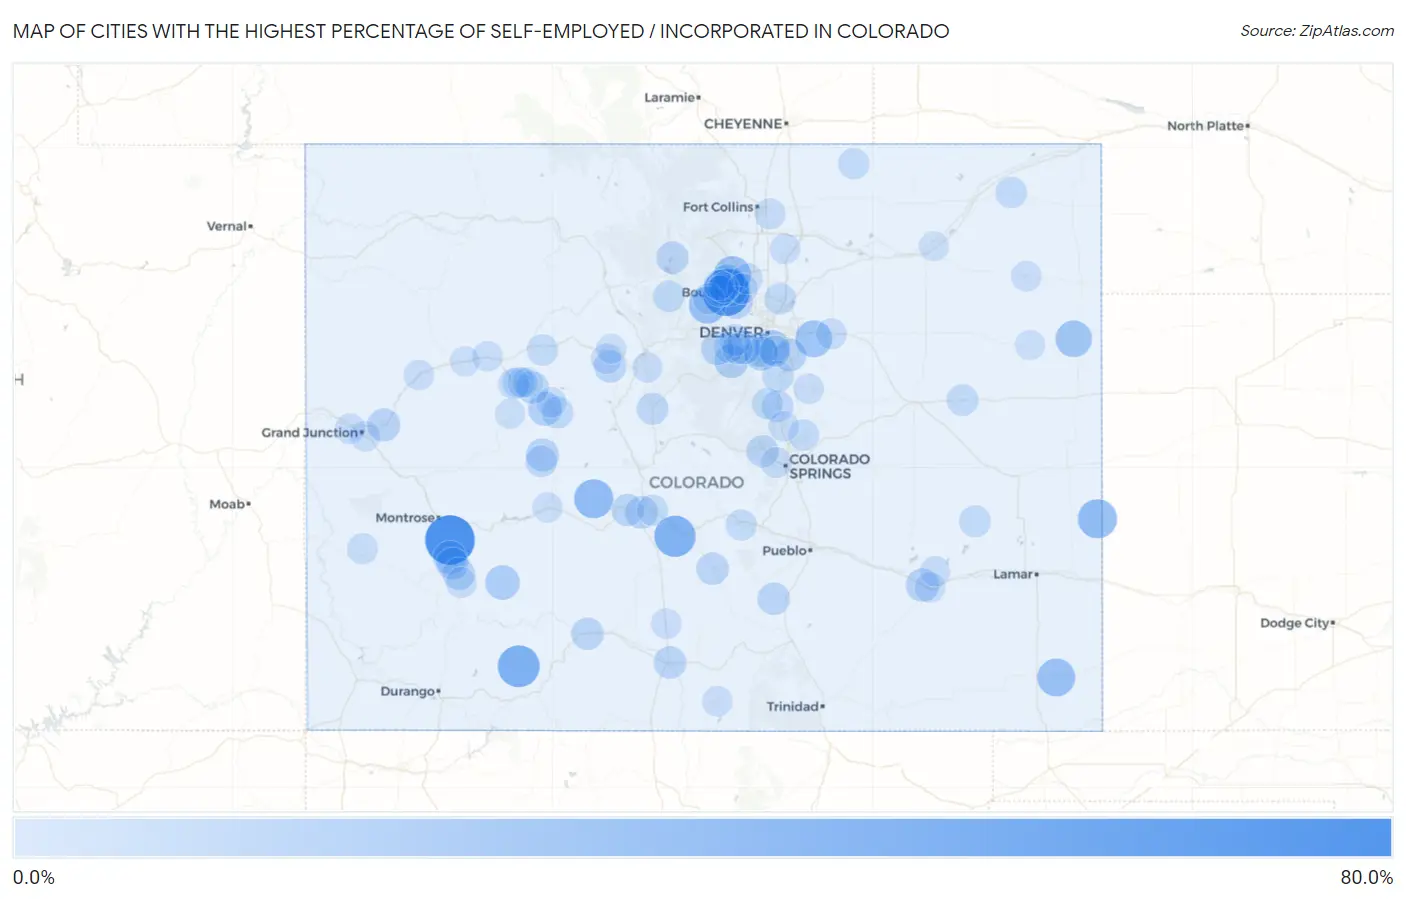
Map of Cities with the Highest Percentage of Self-Employed / Incorporated in Colorado
0.0%
80.0%
Cities with the Highest Percentage of Self-Employed / Incorporated in Colorado
| City | % Self-Employed / Incorporated | vs State | vs National | |
| 1. | Colona | 78.8% | 5.1%(+73.7)#1 | 3.8%(+75.0)#31 |
| 2. | Tall Timber | 69.2% | 5.1%(+64.2)#2 | 3.8%(+65.4)#39 |
| 3. | Piedra | 50.0% | 5.1%(+44.9)#3 | 3.8%(+46.2)#95 |
| 4. | Coaldale | 47.9% | 5.1%(+42.8)#4 | 3.8%(+44.1)#110 |
| 5. | Nathrop | 44.4% | 5.1%(+39.4)#5 | 3.8%(+40.6)#129 |
| 6. | Matheson | 40.0% | 5.1%(+34.9)#6 | 3.8%(+36.2)#157 |
| 7. | Towner | 40.0% | 5.1%(+34.9)#7 | 3.8%(+36.2)#158 |
| 8. | Pitkin | 39.6% | 5.1%(+34.5)#8 | 3.8%(+35.8)#160 |
| 9. | Vilas | 35.4% | 5.1%(+30.3)#9 | 3.8%(+31.6)#190 |
| 10. | Pine Brook Hill | 34.3% | 5.1%(+29.2)#10 | 3.8%(+30.5)#200 |
| 11. | Altona | 34.2% | 5.1%(+29.1)#11 | 3.8%(+30.3)#202 |
| 12. | Rollinsville | 33.1% | 5.1%(+28.0)#12 | 3.8%(+29.3)#213 |
| 13. | Watkins | 31.8% | 5.1%(+26.7)#13 | 3.8%(+28.0)#225 |
| 14. | Brook Forest | 30.9% | 5.1%(+25.8)#14 | 3.8%(+27.1)#238 |
| 15. | Idalia | 30.4% | 5.1%(+25.3)#15 | 3.8%(+26.5)#245 |
| 16. | Placerville | 24.4% | 5.1%(+19.4)#16 | 3.8%(+20.6)#402 |
| 17. | Cherry Hills Village | 23.4% | 5.1%(+18.4)#17 | 3.8%(+19.6)#432 |
| 18. | Lake City | 23.3% | 5.1%(+18.2)#18 | 3.8%(+19.5)#435 |
| 19. | Lazy Acres | 21.8% | 5.1%(+16.8)#19 | 3.8%(+18.0)#500 |
| 20. | Snowmass Village | 21.3% | 5.1%(+16.2)#20 | 3.8%(+17.4)#531 |
| 21. | Bow Mar | 20.7% | 5.1%(+15.6)#21 | 3.8%(+16.9)#567 |
| 22. | Aspen Park | 20.6% | 5.1%(+15.6)#22 | 3.8%(+16.8)#573 |
| 23. | Columbine Valley | 20.5% | 5.1%(+15.4)#23 | 3.8%(+16.7)#583 |
| 24. | Morrison | 20.4% | 5.1%(+15.4)#24 | 3.8%(+16.6)#588 |
| 25. | Loghill Village | 20.0% | 5.1%(+14.9)#25 | 3.8%(+16.2)#611 |
| 26. | Swink | 18.8% | 5.1%(+13.7)#26 | 3.8%(+15.0)#715 |
| 27. | Palisade | 17.9% | 5.1%(+12.9)#27 | 3.8%(+14.1)#789 |
| 28. | Mount Crested Butte | 17.8% | 5.1%(+12.8)#28 | 3.8%(+14.0)#793 |
| 29. | Eldorado Springs | 17.1% | 5.1%(+12.0)#29 | 3.8%(+13.3)#850 |
| 30. | Upper Bear Creek | 17.1% | 5.1%(+12.0)#30 | 3.8%(+13.2)#851 |
| 31. | Foxfield | 17.0% | 5.1%(+11.9)#31 | 3.8%(+13.2)#860 |
| 32. | Poncha Springs | 16.8% | 5.1%(+11.7)#32 | 3.8%(+13.0)#873 |
| 33. | Portland | 16.7% | 5.1%(+11.6)#33 | 3.8%(+12.8)#886 |
| 34. | Alamosa East | 16.4% | 5.1%(+11.3)#34 | 3.8%(+12.5)#913 |
| 35. | Red Cliff | 16.2% | 5.1%(+11.1)#35 | 3.8%(+12.4)#928 |
| 36. | Basalt | 16.1% | 5.1%(+11.0)#36 | 3.8%(+12.3)#936 |
| 37. | Westcliffe | 16.1% | 5.1%(+11.0)#37 | 3.8%(+12.2)#941 |
| 38. | Rye | 16.0% | 5.1%(+10.9)#38 | 3.8%(+12.2)#948 |
| 39. | Ridgway | 15.9% | 5.1%(+10.8)#39 | 3.8%(+12.1)#956 |
| 40. | Gerrard | 15.9% | 5.1%(+10.8)#40 | 3.8%(+12.0)#958 |
| 41. | Green Mountain Falls | 15.5% | 5.1%(+10.4)#41 | 3.8%(+11.6)#1,013 |
| 42. | Grand Lake | 15.3% | 5.1%(+10.3)#42 | 3.8%(+11.5)#1,028 |
| 43. | Maysville | 14.9% | 5.1%(+9.77)#43 | 3.8%(+11.0)#1,100 |
| 44. | Fairplay | 14.2% | 5.1%(+9.13)#44 | 3.8%(+10.4)#1,198 |
| 45. | Aspen | 13.9% | 5.1%(+8.85)#45 | 3.8%(+10.1)#1,247 |
| 46. | Larkspur | 13.7% | 5.1%(+8.61)#46 | 3.8%(+9.87)#1,290 |
| 47. | Crested Butte | 13.6% | 5.1%(+8.54)#47 | 3.8%(+9.80)#1,302 |
| 48. | Genesee | 13.6% | 5.1%(+8.50)#48 | 3.8%(+9.76)#1,309 |
| 49. | Haswell | 13.3% | 5.1%(+8.25)#49 | 3.8%(+9.52)#1,356 |
| 50. | Todd Creek | 13.2% | 5.1%(+8.10)#50 | 3.8%(+9.36)#1,394 |
| 51. | Fleming | 13.1% | 5.1%(+8.06)#51 | 3.8%(+9.32)#1,405 |
| 52. | Arriba | 13.0% | 5.1%(+7.92)#52 | 3.8%(+9.18)#1,425 |
| 53. | Tabernash | 12.8% | 5.1%(+7.69)#53 | 3.8%(+8.95)#1,475 |
| 54. | Castle Pines Village | 12.6% | 5.1%(+7.51)#54 | 3.8%(+8.77)#1,513 |
| 55. | Mulford | 12.4% | 5.1%(+7.35)#55 | 3.8%(+8.62)#1,553 |
| 56. | Mountain Meadows | 12.2% | 5.1%(+7.17)#56 | 3.8%(+8.43)#1,591 |
| 57. | Carbondale | 12.1% | 5.1%(+6.99)#57 | 3.8%(+8.25)#1,641 |
| 58. | Perry Park | 11.9% | 5.1%(+6.80)#58 | 3.8%(+8.06)#1,694 |
| 59. | Gypsum | 11.9% | 5.1%(+6.77)#59 | 3.8%(+8.04)#1,701 |
| 60. | Lincoln Park | 11.7% | 5.1%(+6.61)#60 | 3.8%(+7.87)#1,742 |
| 61. | Grover | 11.6% | 5.1%(+6.52)#61 | 3.8%(+7.78)#1,768 |
| 62. | Nederland | 11.6% | 5.1%(+6.50)#62 | 3.8%(+7.76)#1,774 |
| 63. | Sugarloaf | 11.4% | 5.1%(+6.35)#63 | 3.8%(+7.61)#1,816 |
| 64. | Black Forest | 11.1% | 5.1%(+6.02)#64 | 3.8%(+7.28)#1,918 |
| 65. | Salida | 11.1% | 5.1%(+5.98)#65 | 3.8%(+7.24)#1,924 |
| 66. | Greenwood Village | 11.0% | 5.1%(+5.94)#66 | 3.8%(+7.20)#1,934 |
| 67. | Timnath | 11.0% | 5.1%(+5.89)#67 | 3.8%(+7.15)#1,947 |
| 68. | Manitou Springs | 10.9% | 5.1%(+5.79)#68 | 3.8%(+7.05)#1,979 |
| 69. | Ouray | 10.7% | 5.1%(+5.59)#69 | 3.8%(+6.85)#2,044 |
| 70. | Nucla | 10.7% | 5.1%(+5.58)#70 | 3.8%(+6.84)#2,048 |
| 71. | Niwot | 10.2% | 5.1%(+5.11)#71 | 3.8%(+6.37)#2,205 |
| 72. | Bennett | 10.2% | 5.1%(+5.10)#72 | 3.8%(+6.36)#2,208 |
| 73. | Minturn | 10.0% | 5.1%(+4.90)#73 | 3.8%(+6.17)#2,304 |
| 74. | Evergreen | 9.9% | 5.1%(+4.86)#74 | 3.8%(+6.12)#2,319 |
| 75. | Parachute | 9.7% | 5.1%(+4.64)#75 | 3.8%(+5.90)#2,399 |
| 76. | Indian Hills | 9.7% | 5.1%(+4.62)#76 | 3.8%(+5.89)#2,405 |
| 77. | Orchard Mesa | 9.6% | 5.1%(+4.49)#77 | 3.8%(+5.75)#2,458 |
| 78. | San Luis | 9.6% | 5.1%(+4.49)#78 | 3.8%(+5.75)#2,460 |
| 79. | Milliken | 9.6% | 5.1%(+4.47)#79 | 3.8%(+5.73)#2,465 |
| 80. | Chacra | 9.5% | 5.1%(+4.45)#80 | 3.8%(+5.71)#2,473 |
| 81. | La Junta Gardens | 9.5% | 5.1%(+4.45)#81 | 3.8%(+5.71)#2,475 |
| 82. | Redlands | 9.4% | 5.1%(+4.34)#82 | 3.8%(+5.60)#2,508 |
| 83. | Hooper | 9.3% | 5.1%(+4.22)#83 | 3.8%(+5.49)#2,556 |
| 84. | Woodmoor | 9.2% | 5.1%(+4.16)#84 | 3.8%(+5.43)#2,583 |
| 85. | Valmont | 9.2% | 5.1%(+4.15)#85 | 3.8%(+5.41)#2,589 |
| 86. | Yuma | 9.1% | 5.1%(+4.01)#86 | 3.8%(+5.27)#2,663 |
| 87. | Breckenridge | 9.0% | 5.1%(+3.95)#87 | 3.8%(+5.21)#2,692 |
| 88. | Elizabeth | 9.0% | 5.1%(+3.92)#88 | 3.8%(+5.18)#2,709 |
| 89. | Cheraw | 8.9% | 5.1%(+3.81)#89 | 3.8%(+5.07)#2,774 |
| 90. | Woody Creek | 8.9% | 5.1%(+3.79)#90 | 3.8%(+5.05)#2,783 |
| 91. | Gunnison | 8.8% | 5.1%(+3.73)#91 | 3.8%(+4.99)#2,819 |
| 92. | Gold Hill | 8.7% | 5.1%(+3.58)#92 | 3.8%(+4.84)#2,895 |
| 93. | Redstone | 8.6% | 5.1%(+3.48)#93 | 3.8%(+4.74)#2,954 |
| 94. | Crisman | 8.5% | 5.1%(+3.38)#94 | 3.8%(+4.64)#3,017 |
| 95. | Silt | 8.3% | 5.1%(+3.20)#95 | 3.8%(+4.46)#3,134 |
| 96. | El Jebel | 8.3% | 5.1%(+3.18)#96 | 3.8%(+4.44)#3,156 |
| 97. | Catherine | 8.2% | 5.1%(+3.13)#97 | 3.8%(+4.40)#3,196 |
| 98. | Joes | 8.1% | 5.1%(+3.03)#98 | 3.8%(+4.29)#3,268 |
| 99. | Hillrose | 8.1% | 5.1%(+3.00)#99 | 3.8%(+4.26)#3,279 |
| 100. | Vail | 8.1% | 5.1%(+3.00)#100 | 3.8%(+4.26)#3,283 |
Common Questions
What are the Top 10 Cities with the Highest Percentage of Self-Employed / Incorporated in Colorado?
Top 10 Cities with the Highest Percentage of Self-Employed / Incorporated in Colorado are:
#1
78.8%
#2
69.2%
#3
50.0%
#4
47.9%
#5
40.0%
#6
39.6%
#7
35.4%
#8
34.3%
#9
34.2%
#10
33.1%
What city has the Highest Percentage of Self-Employed / Incorporated in Colorado?
Colona has the Highest Percentage of Self-Employed / Incorporated in Colorado with 78.8%.
What is the Percentage of Self-Employed / Incorporated in the State of Colorado?
Percentage of Self-Employed / Incorporated in Colorado is 5.1%.
What is the Percentage of Self-Employed / Incorporated in the United States?
Percentage of Self-Employed / Incorporated in the United States is 3.8%.