Cities with the Highest Percentage of Self-Employed / Incorporated in Oklahoma
RELATED REPORTS & OPTIONS
Self-Employed / Incorporated
Oklahoma
Compare Cities
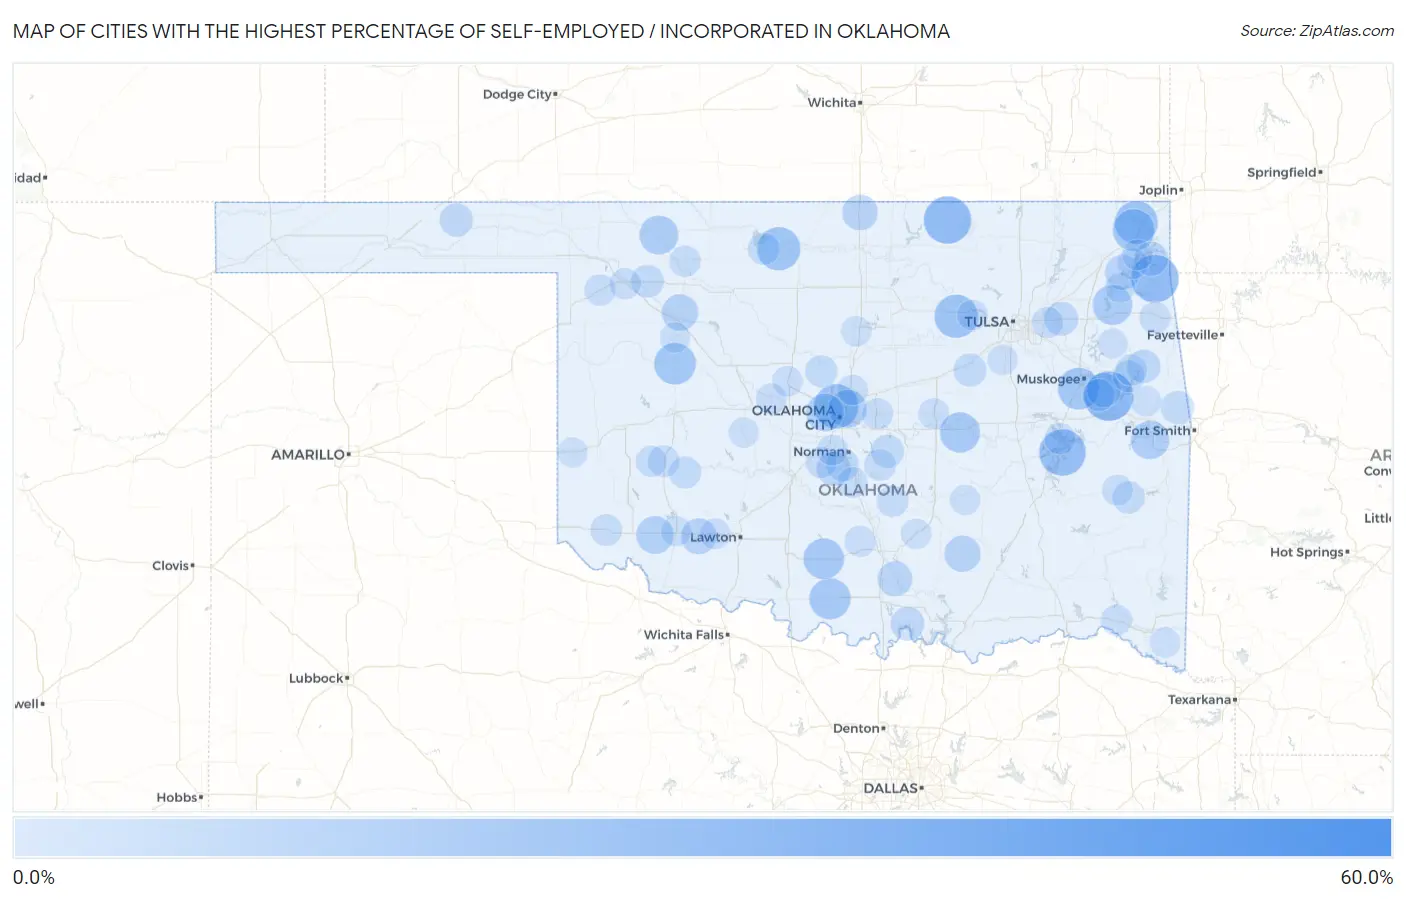
Map of Cities with the Highest Percentage of Self-Employed / Incorporated in Oklahoma
0.0%
60.0%
Cities with the Highest Percentage of Self-Employed / Incorporated in Oklahoma
| City | % Self-Employed / Incorporated | vs State | vs National | |
| 1. | Utica | 56.7% | 3.7%(+53.0)#1 | 3.8%(+52.8)#62 |
| 2. | Edgewater Park | 35.9% | 3.7%(+32.2)#2 | 3.8%(+32.1)#188 |
| 3. | Leonard | 31.7% | 3.7%(+28.1)#3 | 3.8%(+27.9)#226 |
| 4. | Sour John | 30.0% | 3.7%(+26.3)#4 | 3.8%(+26.2)#252 |
| 5. | Durham | 30.0% | 3.7%(+26.3)#5 | 3.8%(+26.2)#254 |
| 6. | Hanson | 28.2% | 3.7%(+24.5)#6 | 3.8%(+24.4)#295 |
| 7. | Deer Lick | 27.5% | 3.7%(+23.8)#7 | 3.8%(+23.7)#311 |
| 8. | Foraker | 27.3% | 3.7%(+23.6)#8 | 3.8%(+23.5)#320 |
| 9. | Carlton Landing | 26.3% | 3.7%(+22.6)#9 | 3.8%(+22.5)#342 |
| 10. | Nichols Hills | 23.5% | 3.7%(+19.8)#10 | 3.8%(+19.7)#431 |
| 11. | Terlton | 22.2% | 3.7%(+18.6)#11 | 3.8%(+18.4)#482 |
| 12. | Nash | 22.0% | 3.7%(+18.3)#12 | 3.8%(+18.1)#494 |
| 13. | Dotyville | 21.5% | 3.7%(+17.9)#13 | 3.8%(+17.7)#515 |
| 14. | Narcissa | 20.0% | 3.7%(+16.3)#14 | 3.8%(+16.2)#618 |
| 15. | Summit | 20.0% | 3.7%(+16.3)#15 | 3.8%(+16.2)#620 |
| 16. | Putnam | 20.0% | 3.7%(+16.3)#16 | 3.8%(+16.2)#624 |
| 17. | Cornish | 19.2% | 3.7%(+15.6)#17 | 3.8%(+15.4)#677 |
| 18. | Velma | 18.7% | 3.7%(+15.0)#18 | 3.8%(+14.9)#727 |
| 19. | Olive | 18.2% | 3.7%(+14.5)#19 | 3.8%(+14.4)#776 |
| 20. | Cromwell | 17.9% | 3.7%(+14.3)#20 | 3.8%(+14.1)#788 |
| 21. | Pump Back | 17.4% | 3.7%(+13.8)#21 | 3.8%(+13.6)#823 |
| 22. | Freedom | 16.5% | 3.7%(+12.8)#22 | 3.8%(+12.7)#904 |
| 23. | Cowlington | 15.8% | 3.7%(+12.1)#23 | 3.8%(+12.0)#973 |
| 24. | Lake Aluma | 15.4% | 3.7%(+11.7)#24 | 3.8%(+11.6)#1,022 |
| 25. | Woodlawn Park | 15.1% | 3.7%(+11.4)#25 | 3.8%(+11.3)#1,062 |
| 26. | Headrick | 14.7% | 3.7%(+11.0)#26 | 3.8%(+10.9)#1,118 |
| 27. | Ingalls | 13.9% | 3.7%(+10.3)#27 | 3.8%(+10.1)#1,248 |
| 28. | Pumpkin Hollow | 13.5% | 3.7%(+9.79)#28 | 3.8%(+9.64)#1,337 |
| 29. | Chester | 13.3% | 3.7%(+9.67)#29 | 3.8%(+9.52)#1,355 |
| 30. | Clarita | 12.9% | 3.7%(+9.24)#30 | 3.8%(+9.09)#1,446 |
| 31. | Cookson | 12.8% | 3.7%(+9.12)#31 | 3.8%(+8.97)#1,471 |
| 32. | Indiahoma | 12.4% | 3.7%(+8.74)#32 | 3.8%(+8.59)#1,558 |
| 33. | Braman | 12.0% | 3.7%(+8.33)#33 | 3.8%(+8.18)#1,658 |
| 34. | Grand Lake Towne | 11.5% | 3.7%(+7.87)#34 | 3.8%(+7.72)#1,783 |
| 35. | Greenville | 11.5% | 3.7%(+7.87)#35 | 3.8%(+7.72)#1,786 |
| 36. | Sand Point | 11.5% | 3.7%(+7.84)#36 | 3.8%(+7.69)#1,794 |
| 37. | Lake Ellsworth Addition | 11.4% | 3.7%(+7.73)#37 | 3.8%(+7.58)#1,828 |
| 38. | Gene Autry | 11.2% | 3.7%(+7.57)#38 | 3.8%(+7.42)#1,862 |
| 39. | Braggs | 10.4% | 3.7%(+6.78)#39 | 3.8%(+6.63)#2,121 |
| 40. | Cole | 10.3% | 3.7%(+6.63)#40 | 3.8%(+6.48)#2,168 |
| 41. | Grove | 10.3% | 3.7%(+6.60)#41 | 3.8%(+6.45)#2,176 |
| 42. | Gregory | 10.0% | 3.7%(+6.33)#42 | 3.8%(+6.18)#2,276 |
| 43. | Haywood | 9.8% | 3.7%(+6.14)#43 | 3.8%(+5.99)#2,373 |
| 44. | Lebanon | 9.8% | 3.7%(+6.12)#44 | 3.8%(+5.97)#2,381 |
| 45. | Turpin | 9.5% | 3.7%(+5.82)#45 | 3.8%(+5.67)#2,489 |
| 46. | Caney | 9.4% | 3.7%(+5.71)#46 | 3.8%(+5.56)#2,530 |
| 47. | Belfonte | 9.2% | 3.7%(+5.54)#47 | 3.8%(+5.39)#2,597 |
| 48. | Middleberg | 9.1% | 3.7%(+5.42)#48 | 3.8%(+5.27)#2,654 |
| 49. | Pink | 9.1% | 3.7%(+5.40)#49 | 3.8%(+5.25)#2,668 |
| 50. | Goldsby | 8.9% | 3.7%(+5.28)#50 | 3.8%(+5.13)#2,744 |
| 51. | Mooreland | 8.8% | 3.7%(+5.14)#51 | 3.8%(+4.99)#2,814 |
| 52. | Slick | 8.8% | 3.7%(+5.10)#52 | 3.8%(+4.95)#2,836 |
| 53. | Le Flore | 8.2% | 3.7%(+4.50)#53 | 3.8%(+4.35)#3,234 |
| 54. | Gotebo | 8.0% | 3.7%(+4.31)#54 | 3.8%(+4.16)#3,355 |
| 55. | River Bottom | 8.0% | 3.7%(+4.29)#55 | 3.8%(+4.14)#3,371 |
| 56. | Pettit | 7.7% | 3.7%(+4.04)#56 | 3.8%(+3.89)#3,551 |
| 57. | Cashion | 7.7% | 3.7%(+4.02)#57 | 3.8%(+3.88)#3,559 |
| 58. | Jet | 7.6% | 3.7%(+3.95)#58 | 3.8%(+3.80)#3,648 |
| 59. | Rocky | 7.5% | 3.7%(+3.83)#59 | 3.8%(+3.68)#3,733 |
| 60. | Etowah | 7.4% | 3.7%(+3.74)#60 | 3.8%(+3.59)#3,817 |
| 61. | Little Ponderosa | 7.3% | 3.7%(+3.60)#61 | 3.8%(+3.45)#3,946 |
| 62. | East Duke | 7.1% | 3.7%(+3.43)#62 | 3.8%(+3.28)#4,085 |
| 63. | Waynoka | 7.0% | 3.7%(+3.37)#63 | 3.8%(+3.23)#4,127 |
| 64. | Byars | 7.0% | 3.7%(+3.35)#64 | 3.8%(+3.20)#4,153 |
| 65. | Keys | 6.9% | 3.7%(+3.20)#65 | 3.8%(+3.05)#4,310 |
| 66. | Blanchard | 6.9% | 3.7%(+3.20)#66 | 3.8%(+3.05)#4,311 |
| 67. | Fair Oaks | 6.8% | 3.7%(+3.15)#67 | 3.8%(+3.00)#4,365 |
| 68. | Flint Creek | 6.8% | 3.7%(+3.10)#68 | 3.8%(+2.95)#4,420 |
| 69. | Taylor Ferry | 6.7% | 3.7%(+3.05)#69 | 3.8%(+2.90)#4,468 |
| 70. | Harrah | 6.7% | 3.7%(+3.05)#70 | 3.8%(+2.90)#4,471 |
| 71. | Fargo | 6.7% | 3.7%(+3.04)#71 | 3.8%(+2.89)#4,478 |
| 72. | Sentinel | 6.7% | 3.7%(+3.02)#72 | 3.8%(+2.87)#4,500 |
| 73. | Eufaula | 6.6% | 3.7%(+2.95)#73 | 3.8%(+2.80)#4,561 |
| 74. | Woodward | 6.5% | 3.7%(+2.88)#74 | 3.8%(+2.73)#4,651 |
| 75. | Katie | 6.5% | 3.7%(+2.82)#75 | 3.8%(+2.67)#4,712 |
| 76. | Cleora | 6.4% | 3.7%(+2.77)#76 | 3.8%(+2.62)#4,752 |
| 77. | Prague | 6.4% | 3.7%(+2.75)#77 | 3.8%(+2.60)#4,772 |
| 78. | Valliant | 6.3% | 3.7%(+2.66)#78 | 3.8%(+2.51)#4,866 |
| 79. | Red Oak | 6.3% | 3.7%(+2.62)#79 | 3.8%(+2.47)#4,911 |
| 80. | Newcastle | 6.3% | 3.7%(+2.60)#80 | 3.8%(+2.45)#4,935 |
| 81. | Bernice | 6.2% | 3.7%(+2.49)#81 | 3.8%(+2.34)#5,087 |
| 82. | Edmond | 6.0% | 3.7%(+2.35)#82 | 3.8%(+2.20)#5,267 |
| 83. | Calumet | 6.0% | 3.7%(+2.35)#83 | 3.8%(+2.20)#5,271 |
| 84. | Westport | 6.0% | 3.7%(+2.32)#84 | 3.8%(+2.17)#5,309 |
| 85. | Purcell | 6.0% | 3.7%(+2.29)#85 | 3.8%(+2.14)#5,352 |
| 86. | Cache | 5.9% | 3.7%(+2.26)#86 | 3.8%(+2.11)#5,406 |
| 87. | Okarche | 5.9% | 3.7%(+2.25)#87 | 3.8%(+2.10)#5,409 |
| 88. | Marble City | 5.8% | 3.7%(+2.10)#88 | 3.8%(+1.95)#5,603 |
| 89. | Haworth | 5.7% | 3.7%(+2.05)#89 | 3.8%(+1.90)#5,679 |
| 90. | Roff | 5.7% | 3.7%(+2.02)#90 | 3.8%(+1.87)#5,707 |
| 91. | Snyder | 5.7% | 3.7%(+2.01)#91 | 3.8%(+1.86)#5,732 |
| 92. | Allen | 5.7% | 3.7%(+1.99)#92 | 3.8%(+1.84)#5,746 |
| 93. | Mulhall | 5.6% | 3.7%(+1.98)#93 | 3.8%(+1.83)#5,764 |
| 94. | Taloga | 5.6% | 3.7%(+1.89)#94 | 3.8%(+1.74)#5,886 |
| 95. | Lookeba | 5.6% | 3.7%(+1.89)#95 | 3.8%(+1.74)#5,896 |
| 96. | Spavinaw | 5.5% | 3.7%(+1.80)#96 | 3.8%(+1.65)#6,023 |
| 97. | Mounds | 5.5% | 3.7%(+1.78)#97 | 3.8%(+1.63)#6,050 |
| 98. | Lost City | 5.4% | 3.7%(+1.76)#98 | 3.8%(+1.61)#6,087 |
| 99. | Erick | 5.4% | 3.7%(+1.75)#99 | 3.8%(+1.60)#6,104 |
| 100. | Johnson Prairie | 5.4% | 3.7%(+1.74)#100 | 3.8%(+1.59)#6,122 |
Common Questions
What are the Top 10 Cities with the Highest Percentage of Self-Employed / Incorporated in Oklahoma?
Top 10 Cities with the Highest Percentage of Self-Employed / Incorporated in Oklahoma are:
#1
30.0%
#2
27.5%
#3
27.3%
#4
26.3%
#5
23.5%
#6
22.2%
#7
22.0%
#8
21.5%
#9
20.0%
#10
20.0%
What city has the Highest Percentage of Self-Employed / Incorporated in Oklahoma?
Sour John has the Highest Percentage of Self-Employed / Incorporated in Oklahoma with 30.0%.
What is the Percentage of Self-Employed / Incorporated in the State of Oklahoma?
Percentage of Self-Employed / Incorporated in Oklahoma is 3.7%.
What is the Percentage of Self-Employed / Incorporated in the United States?
Percentage of Self-Employed / Incorporated in the United States is 3.8%.